Type A - Springer Static Content Server€¦ · Web view · 2014-03-18Table S2. Results of...
11
Table S2. Results of positive selection using site-specific models Gene family Lineage under M0 1 M2a vs. M1 2 M8 vs. M7 2 M8 vs. M8a 2 M2a estimates PSS under M2a 3 M8 estimates PSS under M8 3 serine peptidas e Bd 0.4585 185.34 ** 193.05 ** 148.36 ** 30, 19 * , 14 ** 37, 21 * , 14 ** bacteri a 0.0118 0 0 2.39 - - - - DXX-DAB Bd 0.6953 28.92 ** 28.86 ** 28.85 ** 43, 8 * 59, 13 * , 6 ** oomycet es 0.3929 0 0 0 - - - - DFB Bd 0.6429 132.04 ** 131.28 ** 127.86 ** 90, 21 * , 11 ** 139, 59 * , 24 ** 1
Transcript of Type A - Springer Static Content Server€¦ · Web view · 2014-03-18Table S2. Results of...
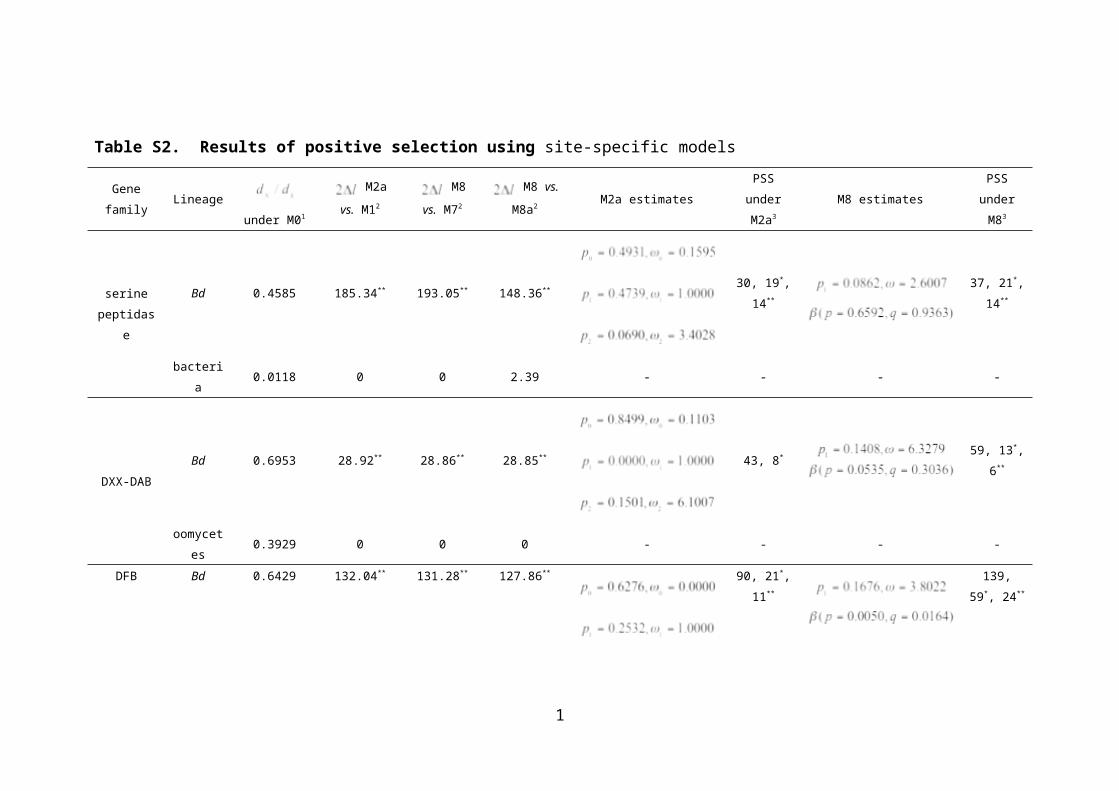
Table S2. Results of positive selection using site-specific models
Gene family Lineage under
M01
M2a vs.
M12
M8 vs.
M72
M8 vs.
M8a2M2a estimates
PSS under
M2a3M8 estimates
PSS under
M83
serine
peptidase
Bd 0.4585 185.34** 193.05** 148.36**30, 19*,
14**
37, 21*,
14**
bacteria 0.0118 0 0 2.39 - - - -
DXX-DABBd 0.6953 28.92** 28.86** 28.85** 43, 8* 59, 13*, 6**
oomycetes 0.3929 0 0 0 - - - -
DFB Bd 0.6429 132.04** 131.28** 127.86** 90, 21*,
11**
139, 59*,
24**
1
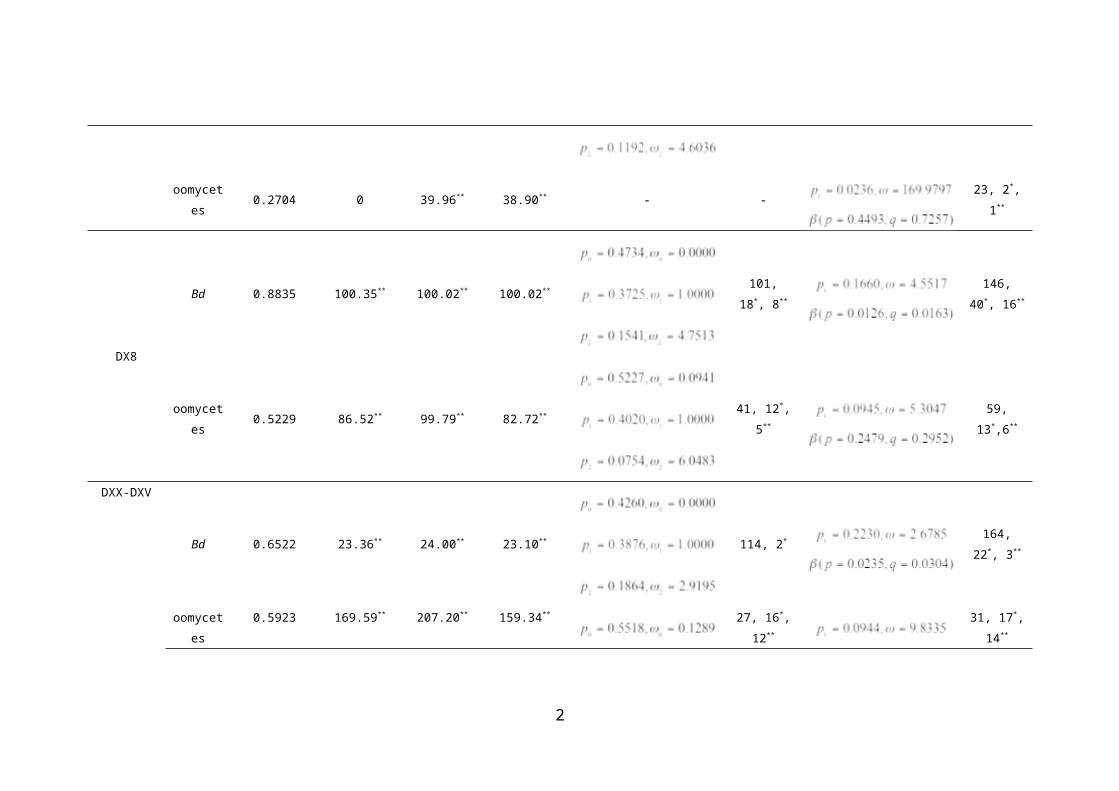
oomycetes 0.2704 0 39.96** 38.90** - - 23, 2*, 1**
DX8
Bd 0.8835 100.35** 100.02** 100.02**101, 18*,
8**
146, 40*,
16**
oomycetes 0.5229 86.52** 99.79** 82.72** 41, 12*, 5** 59, 13*,6**
DXX-DXV
Bd 0.6522 23.36** 24.00** 23.10** 114, 2*164, 22*,
3**
oomycetes 0.5923 169.59** 207.20** 159.34** 27, 16*,
12**
31, 17*,
14**
2
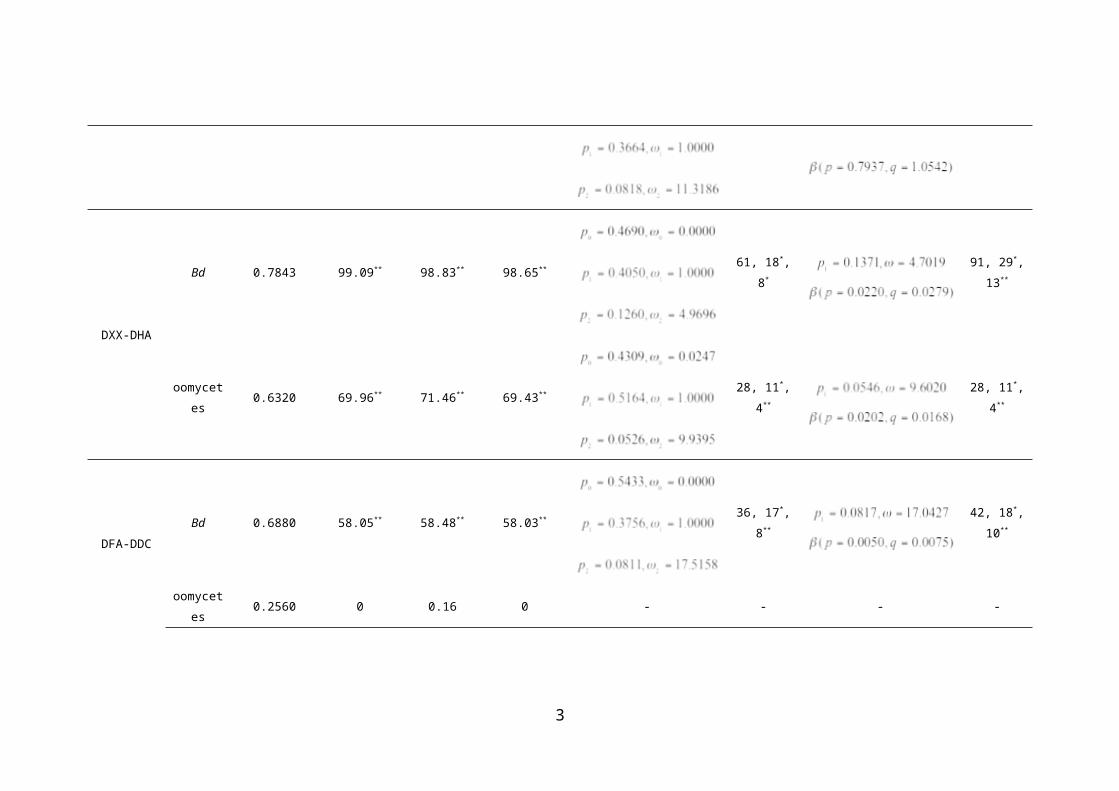
DXX-DHA
Bd 0.7843 99.09** 98.83** 98.65** 61, 18*, 8*91, 29*,
13**
oomycetes 0.6320 69.96** 71.46** 69.43** 28, 11*, 4** 28, 11*, 4**
DFA-DDCBd 0.6880 58.05** 58.48** 58.03** 36, 17*, 8**
42, 18*,
10**
oomycetes 0.2560 0 0.16 0 - - - -
DN17 Bd 0.4980 28.56** 28.82** 28.51** 25, 8*, 3** 28, 9*, 5**
3
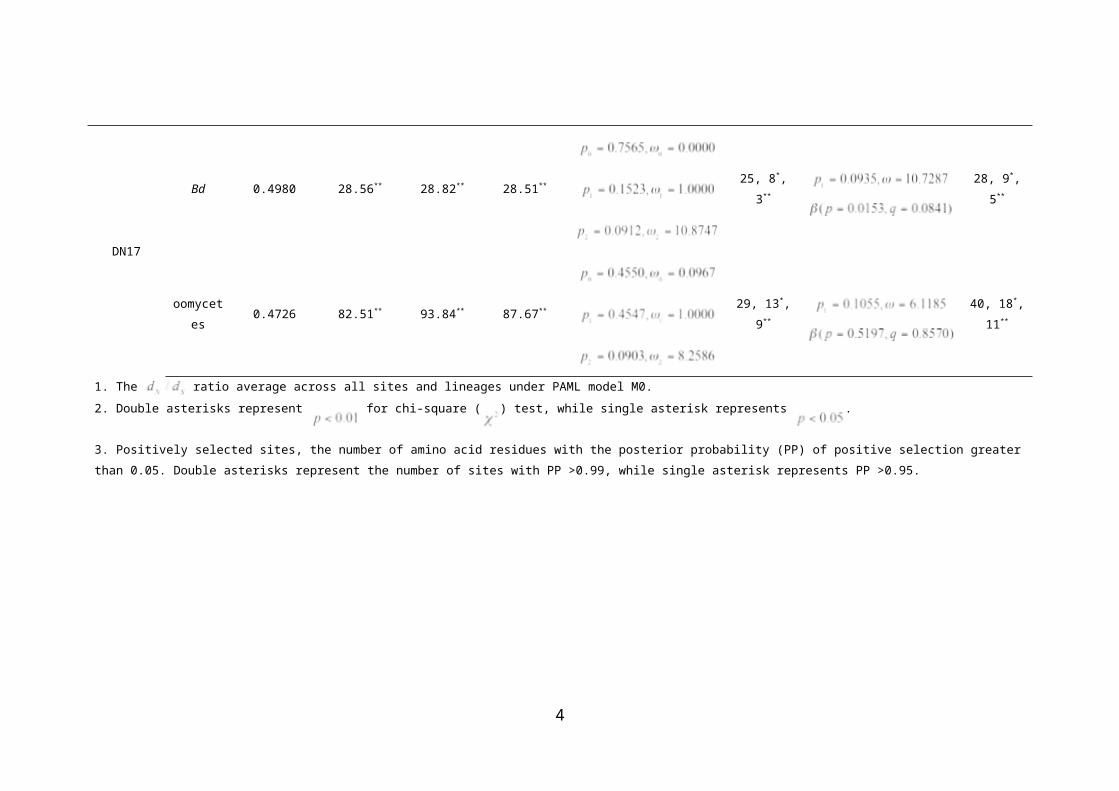
oomycetes 0.4726 82.51** 93.84** 87.67** 29, 13*, 9**40, 18*,
11**
1. The ratio average across all sites and lineages under PAML model M0.
2. Double asterisks represent for chi-square ( ) test, while single asterisk represents .
3. Positively selected sites, the number of amino acid residues with the posterior probability (PP) of positive selection greater than 0.05. Double asterisks represent the number of sites with PP
>0.99, while single asterisk represents PP >0.95.
4
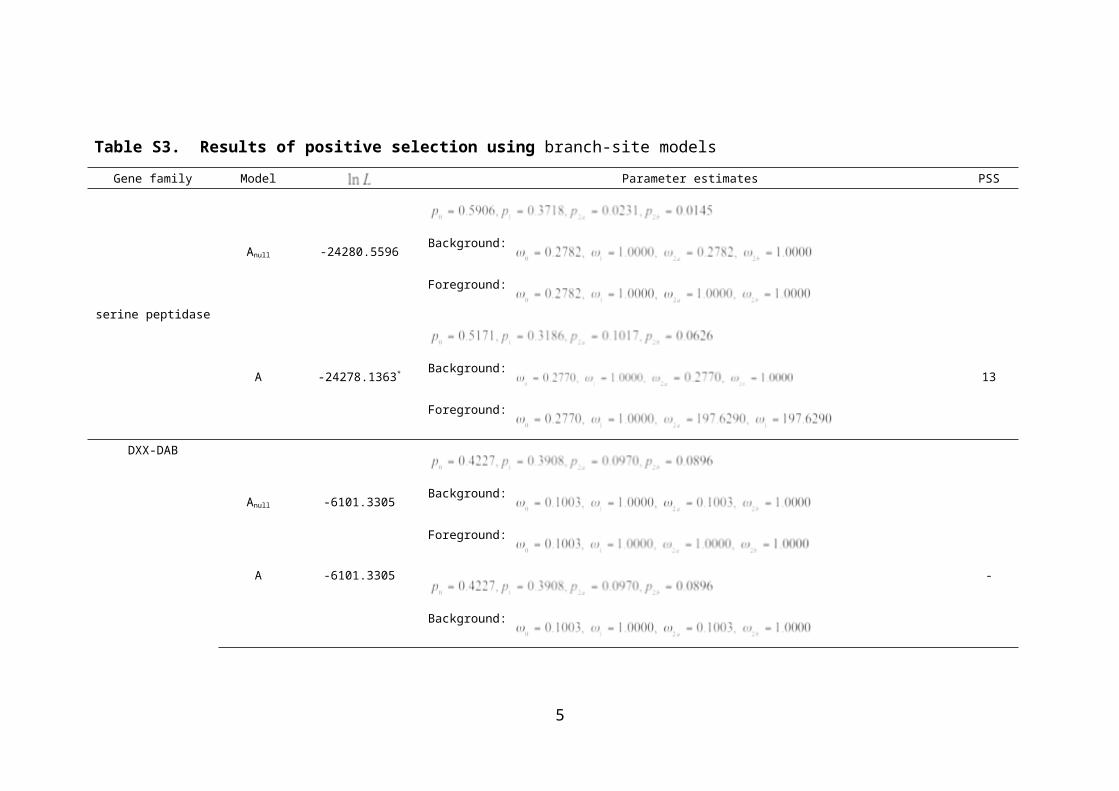
Table S3. Results of positive selection using branch-site modelsGene family Model Parameter estimates PSS
serine peptidase
Anull -24280.5596Background:
Foreground:
A -24278.1363* Background:
Foreground:
13
DXX-DAB
Anull -6101.3305Background:
Foreground:
A -6101.3305
Background:
-
5
Foreground:
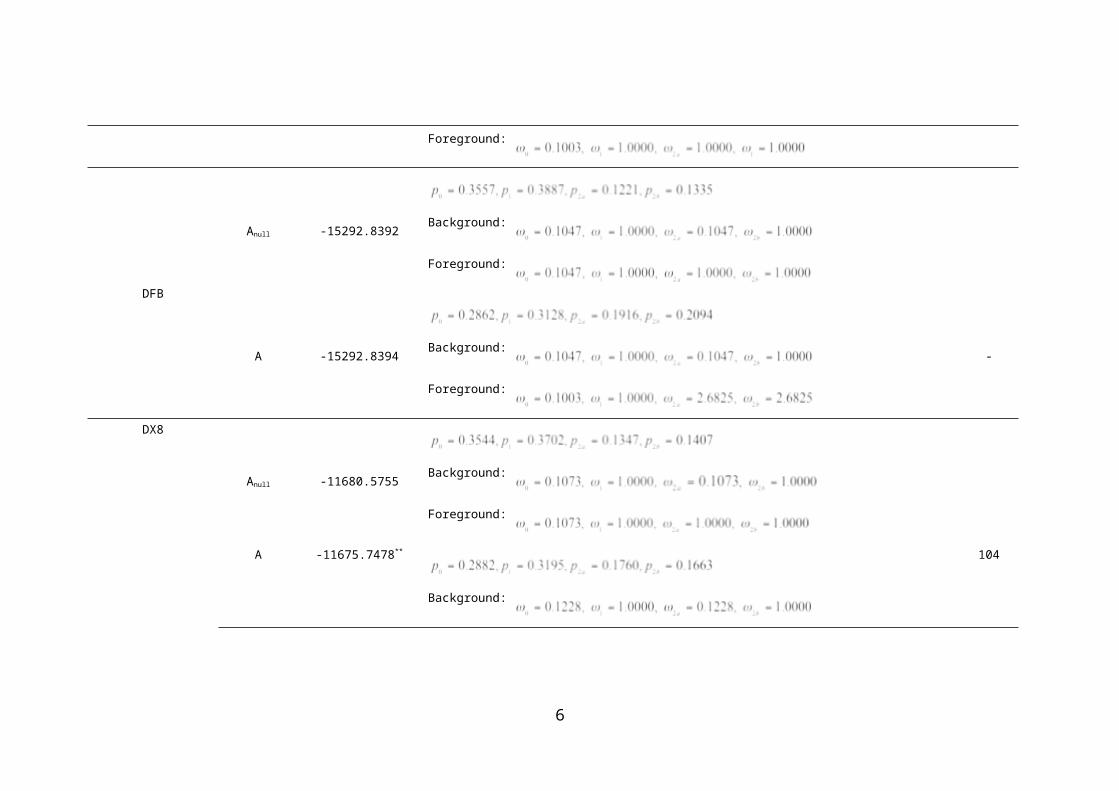
DFB
Anull -15292.8392Background:
Foreground:
A -15292.8394Background:
Foreground:
-
DX8
Anull -11680.5755Background:
Foreground:
A -11675.7478**
Background:
104
6
Foreground:
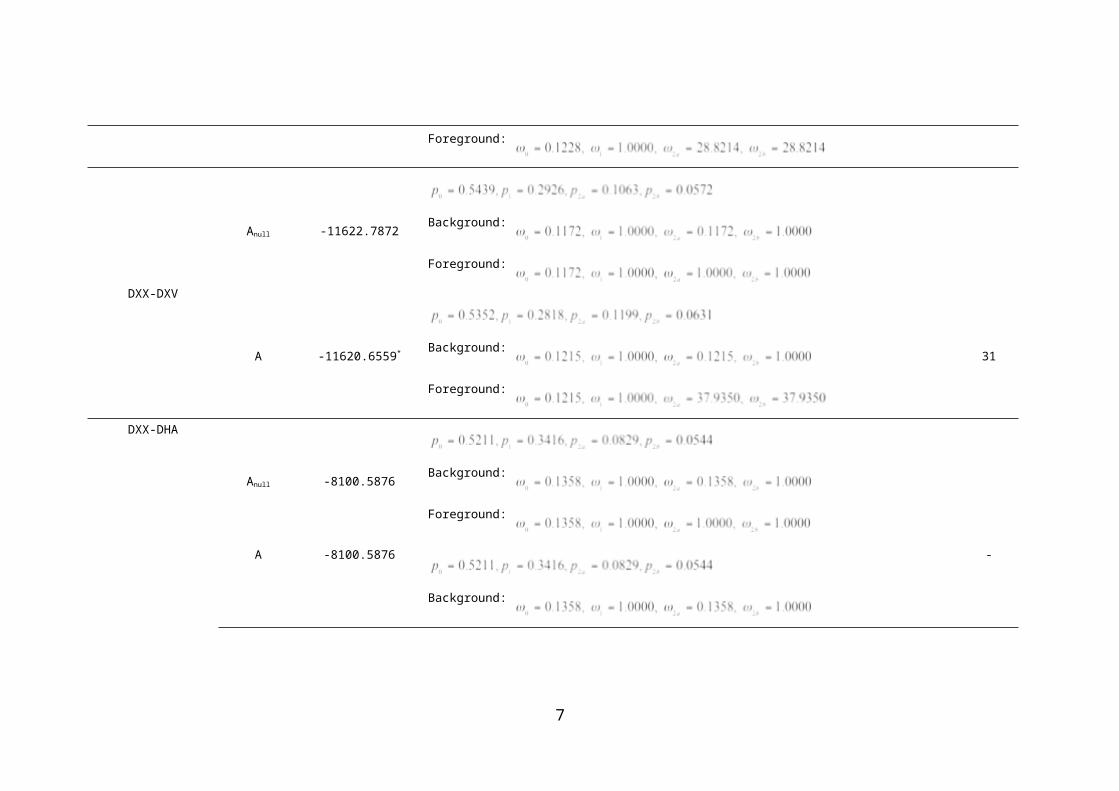
DXX-DXV
Anull -11622.7872Background:
Foreground:
A -11620.6559* Background:
Foreground:
31
DXX-DHA
Anull -8100.5876Background:
Foreground:
A -8100.5876
Background:
-
7
Foreground:
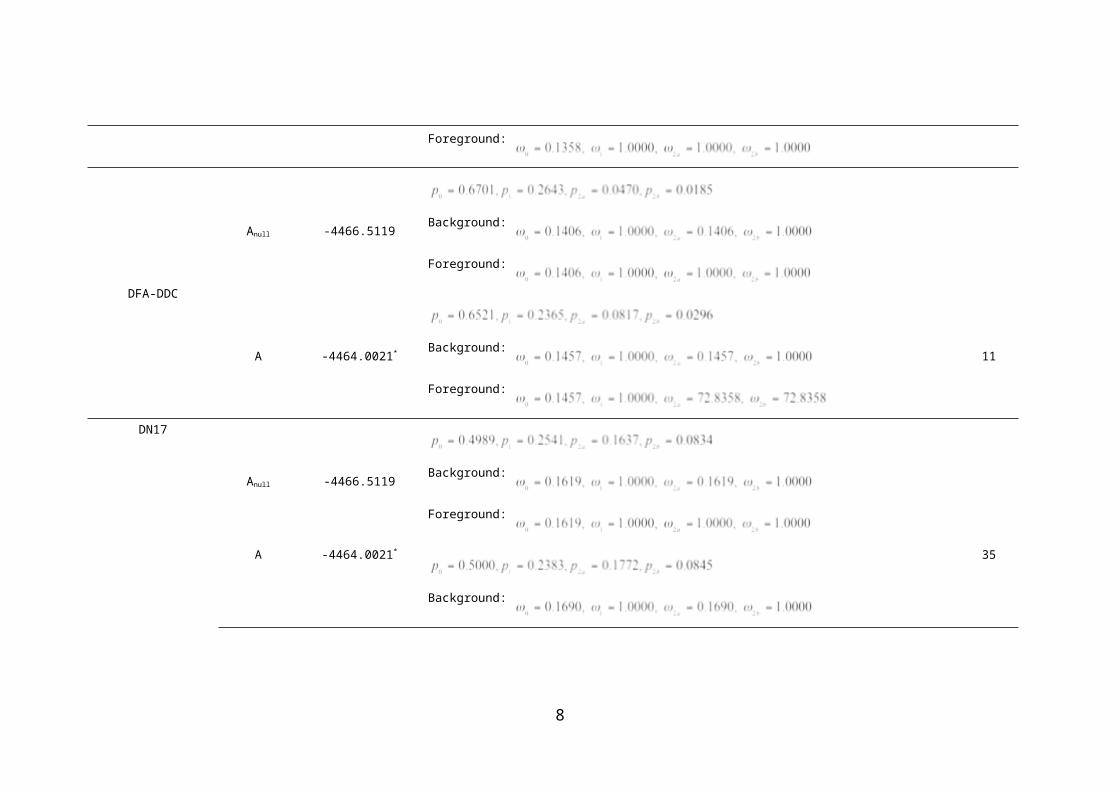
DFA-DDC
Anull -4466.5119Background:
Foreground:
A -4464.0021* Background:
Foreground:
11
DN17
Anull -4466.5119Background:
Foreground:
A -4464.0021*
Background:
35
8
Foreground:
9
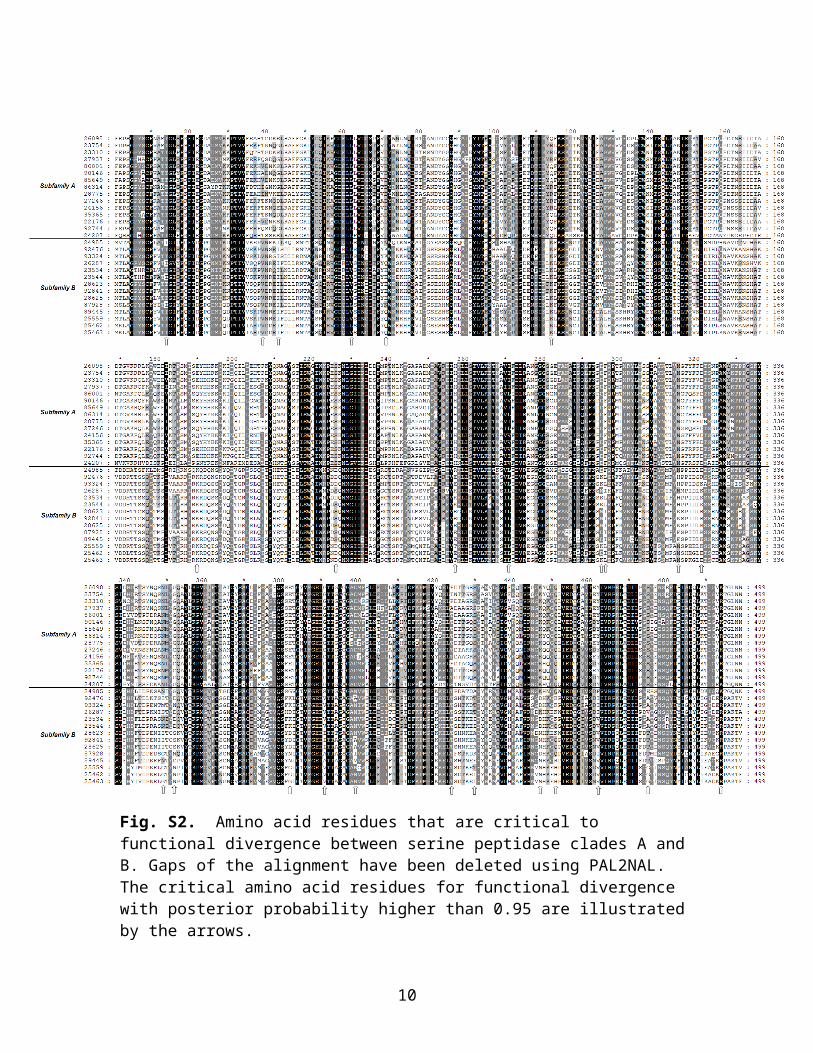
Fig. S2. Amino acid residues that are critical to functional divergence between serine peptidase clades A and B. Gaps of the alignment have been deleted using PAL2NAL. The critical amino acid residues for functional divergence with posterior probability higher than 0.95 are illustrated by the arrows.
10


![arXiv:1407.5685v2 [math.RT] 19 Feb 2016arXiv:1407.5685v2 [math.RT] 19 Feb 2016. 2 ALEXEI OBLOMKOV AND ZHIWEI YUN 5.2. A ne Springer bers 29 5.3. Homogeneous a ne Springer bers 30 5.4.](https://static.fdocument.org/doc/165x107/600b3f1156014228d05c08f2/arxiv14075685v2-mathrt-19-feb-2016-arxiv14075685v2-mathrt-19-feb-2016.jpg)