Trapping of - Positron lifetime.pdf · to the local electron density at the site of positron...
14
Transcript of Trapping of - Positron lifetime.pdf · to the local electron density at the site of positron...
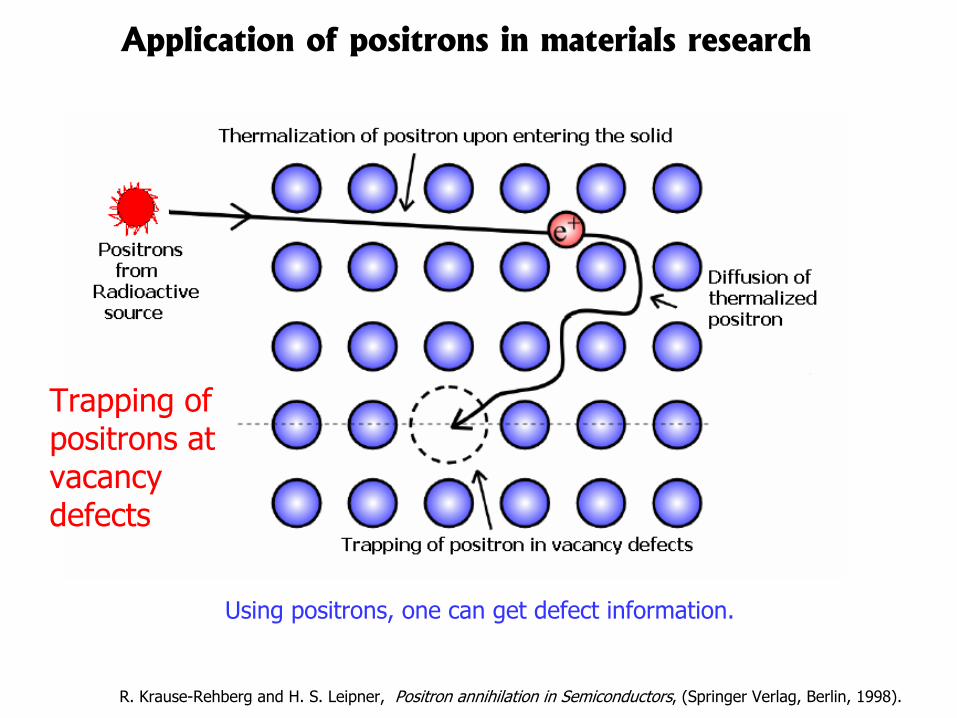
R. Krause-Rehberg and H. S. Leipner, Positron annihilation in Semiconductors, (Springer Verlag, Berlin, 1998).
Trapping of positrons at vacancy defects
Using positrons, one can get defect information.
Application of positrons in materials research
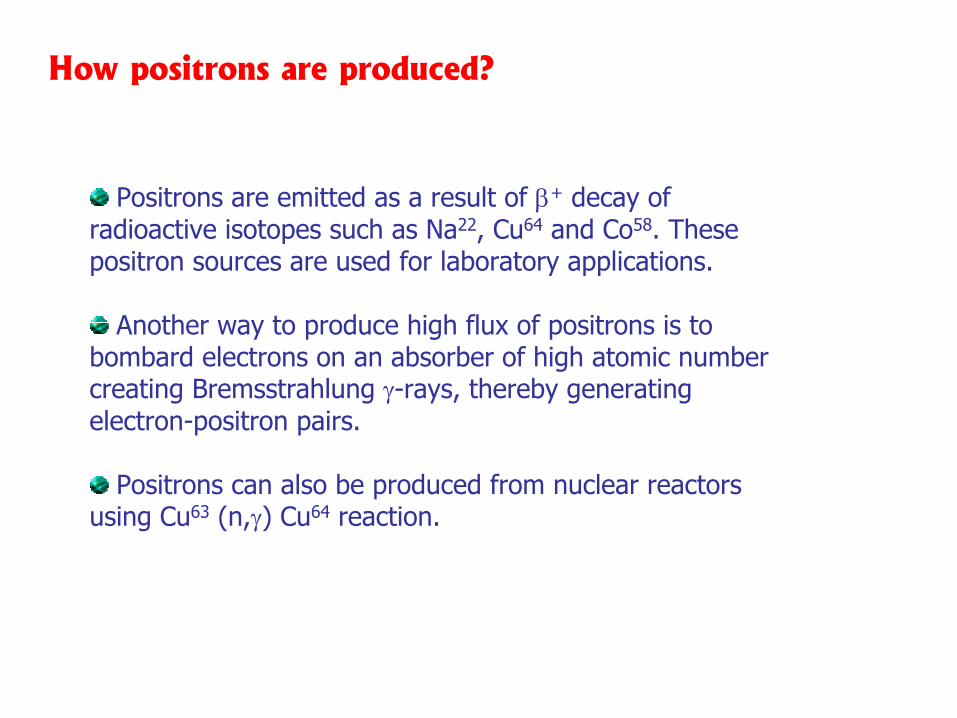
How positrons are produced?
Positrons are emitted as a result of β+ decay of radioactive isotopes such as Na22, Cu64 and Co58. These positron sources are used for laboratory applications.
Another way to produce high flux of positrons is to bombard electrons on an absorber of high atomic number creating Bremsstrahlung γ-rays, thereby generating electron-positron pairs.
Positrons can also be produced from nuclear reactors using Cu63 (n,γ) Cu64 reaction.
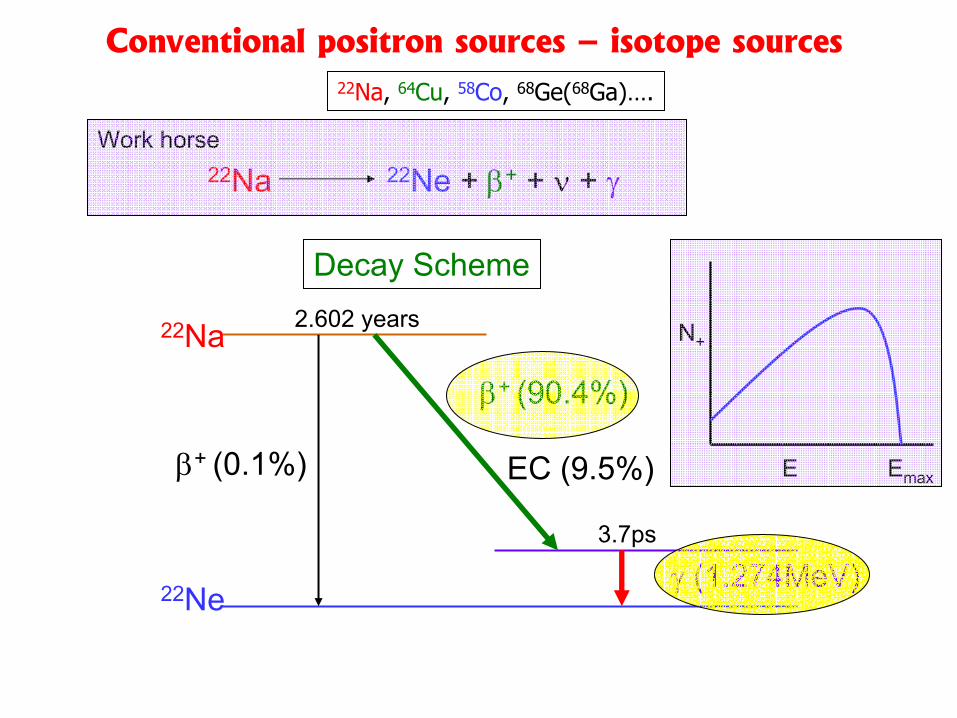
22Na, 64Cu, 58Co, 68Ge(68Ga)….
22Na 22Ne + β+ + ν + γWork horse
22Na
γ (1.274MeV)22Ne
β+ (0.1%)
β+ (90.4%)
EC (9.5%)
2.602 years
3.7ps
Decay Scheme
N+
E Emax
Conventional positron sources – isotope sources
e-
e+
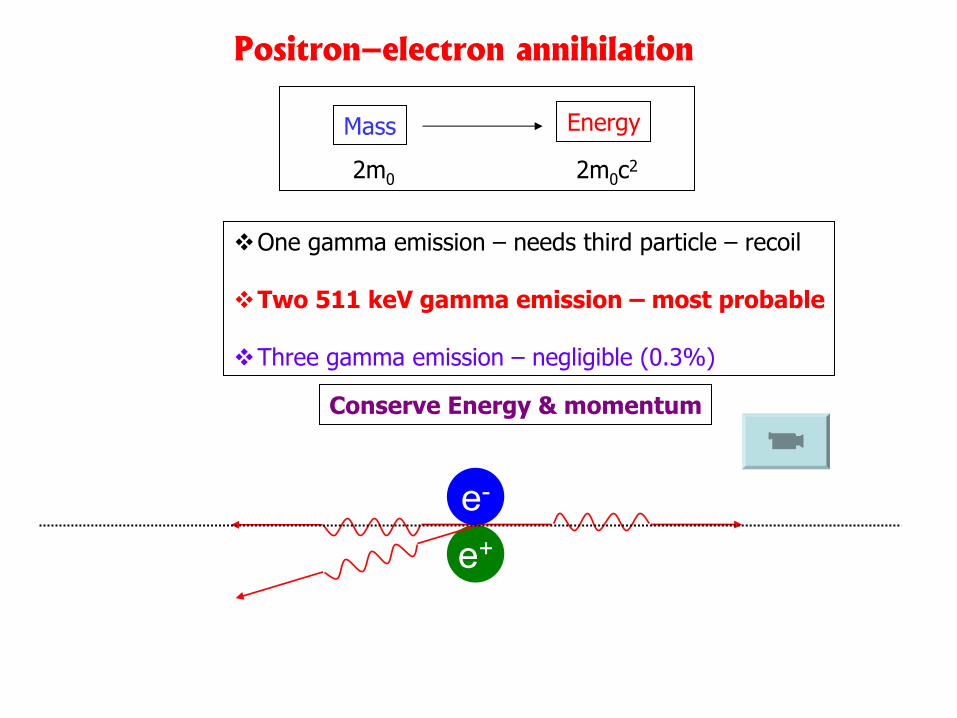
Mass Energy
One gamma emission – needs third particle – recoil
Two 511 keV gamma emission – most probable
Three gamma emission – negligible (0.3%)
2m0 2m0c2
Conserve Energy & momentum
Positron–electron annihilation
e- e+
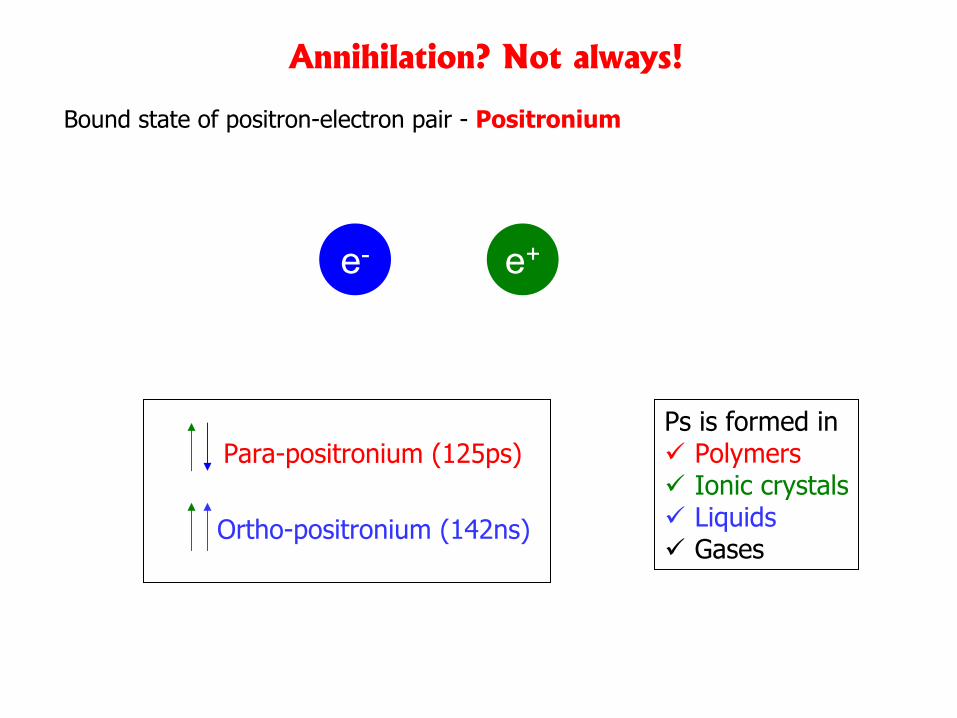
Bound state of positron-electron pair - Positronium
Para-positronium (125ps)
Ortho-positronium (142ns)
Ps is formed inPolymersIonic crystalsLiquidsGases
Annihilation? Not always!
22Na (e+ Source)
~100µm
θ
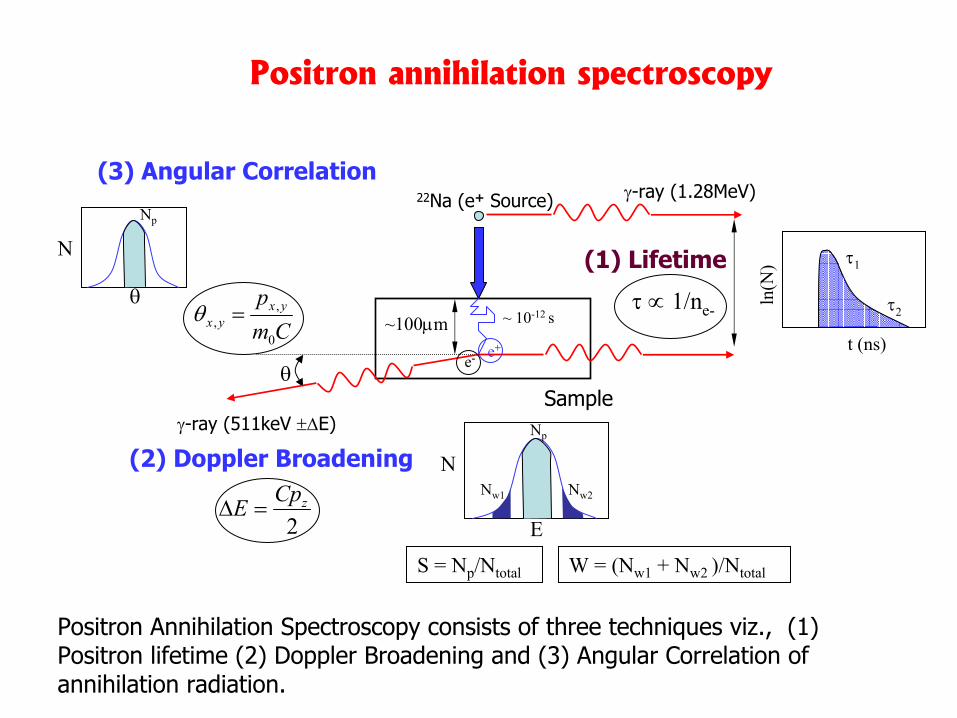
(3) Angular Correlation
τ ∝ 1/ne-
(1) Lifetime
γ-ray (1.28MeV)
~ 10-12 s
e+e-
Sampleγ-ray (511keV ±∆E)
(2) Doppler Broadening
Cmp yx
yx0
,, =θ
2zCpE =∆
N
Np
θ ln(N
)
t (ns)
τ1
τ2
N
E
Np
S = Np/Ntotal
Nw1 Nw2
W = (Nw1 + Nw2 )/Ntotal
Positron annihilation spectroscopy
Positron Annihilation Spectroscopy consists of three techniques viz., (1) Positron lifetime (2) Doppler Broadening and (3) Angular Correlation of annihilation radiation.
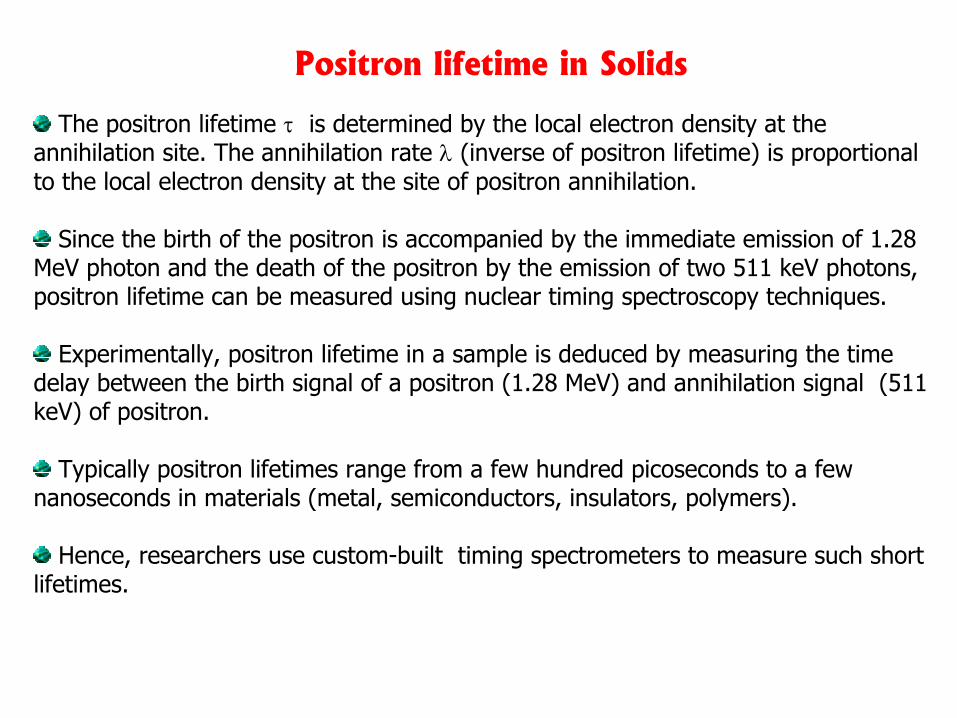
The positron lifetime τ is determined by the local electron density at the annihilation site. The annihilation rate λ (inverse of positron lifetime) is proportional to the local electron density at the site of positron annihilation.
Since the birth of the positron is accompanied by the immediate emission of 1.28 MeV photon and the death of the positron by the emission of two 511 keV photons, positron lifetime can be measured using nuclear timing spectroscopy techniques.
Experimentally, positron lifetime in a sample is deduced by measuring the time delay between the birth signal of a positron (1.28 MeV) and annihilation signal (511 keV) of positron.
Typically positron lifetimes range from a few hundred picoseconds to a few nanoseconds in materials (metal, semiconductors, insulators, polymers).
Hence, researchers use custom-built timing spectrometers to measure such short lifetimes.
Positron lifetime in Solids
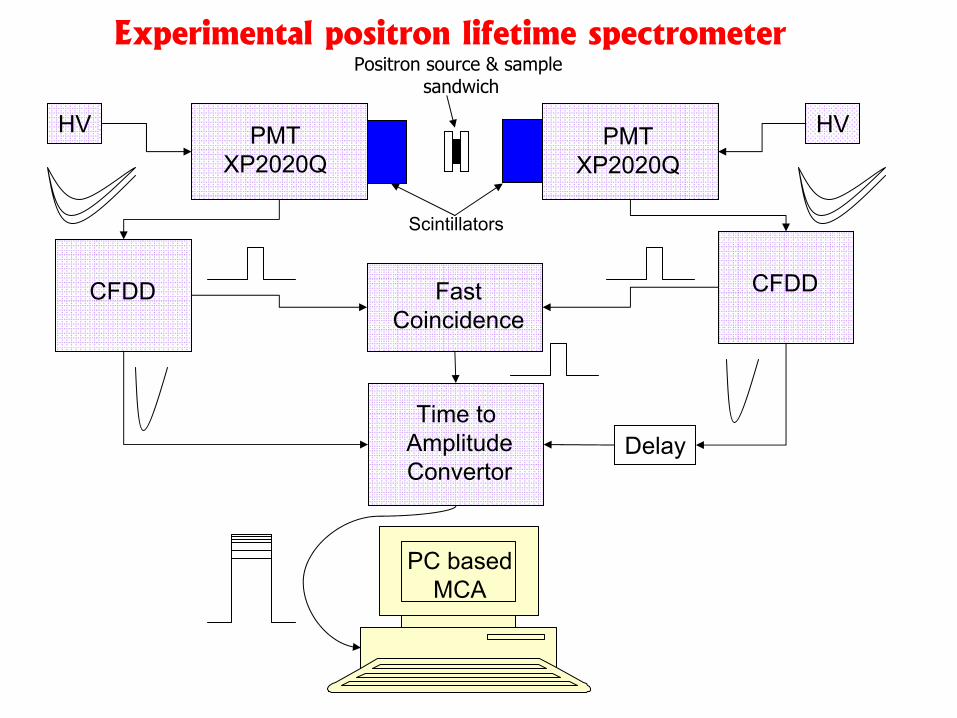
HV PMTXP2020Q
PMTXP2020Q
HV
CFDD CFDDFastCoincidence
Time to AmplitudeConvertor
PC based MCA
Delay
Scintillators
Positron source & sample sandwich
Experimental positron lifetime spectrometer
60AnAl
time [ns]1211109876543210-1
Cou
nts
45,00030,000
15,000
Residuals
160ps
400ps
∑ −⊗+=i
ti
ieItGBGtN τ/)()(
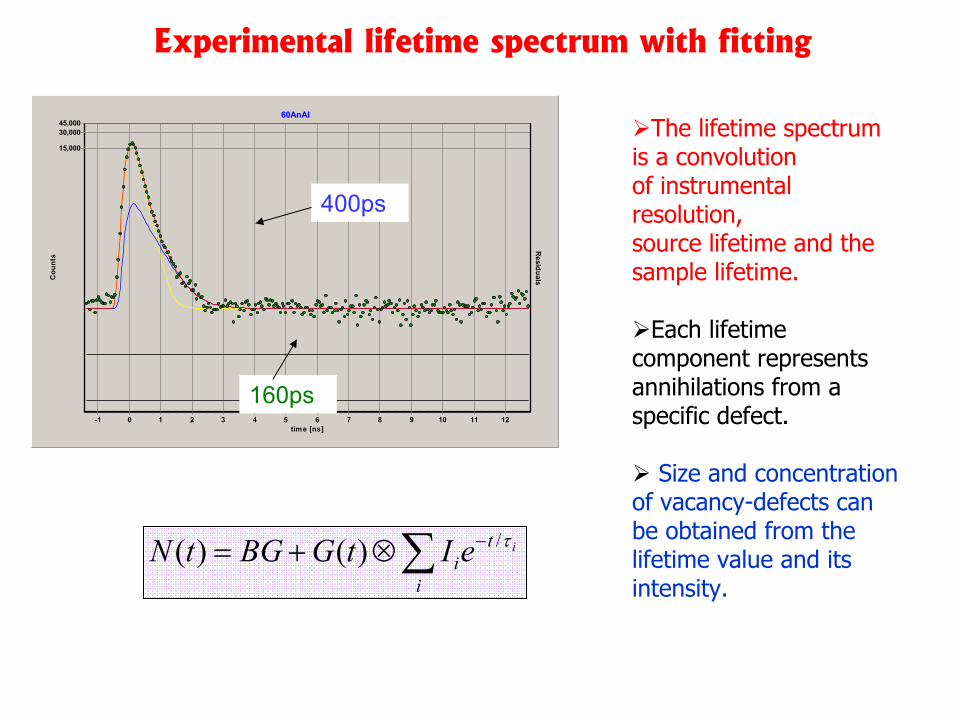
The lifetime spectrum is a convolutionof instrumental resolution, source lifetime and the sample lifetime.
Each lifetime component represents annihilations from a specific defect.
Size and concentration of vacancy-defects can be obtained from the lifetime value and its intensity.
Experimental lifetime spectrum with fitting
From the experimental curve, the positron lifetime is extracted using a program. In an annealed metal, all positrons annihilate as free particle with a well-defined annihilation rate λ. The lifetime measurement then produces a single exponential spectrum of the form exp (-λt). The corresponding mean lifetime τ is the inverse of λ.
If the positrons annihilate from different states in the sample, the result is an multi exponential lifetime spectrum.
Average τ = Σi Ii τi - (1)
This is normally analyzed using a program to extract lifetime values τi and relative intensities Ii associated with the different components.
τi gives information on the kind of defects present and the Ii is related to the defect concentration.
So, both the nature of defect and its concentration are obtained using positron lifetime measurement.
Analysis and extraction of useful information from positron lifetime spectra
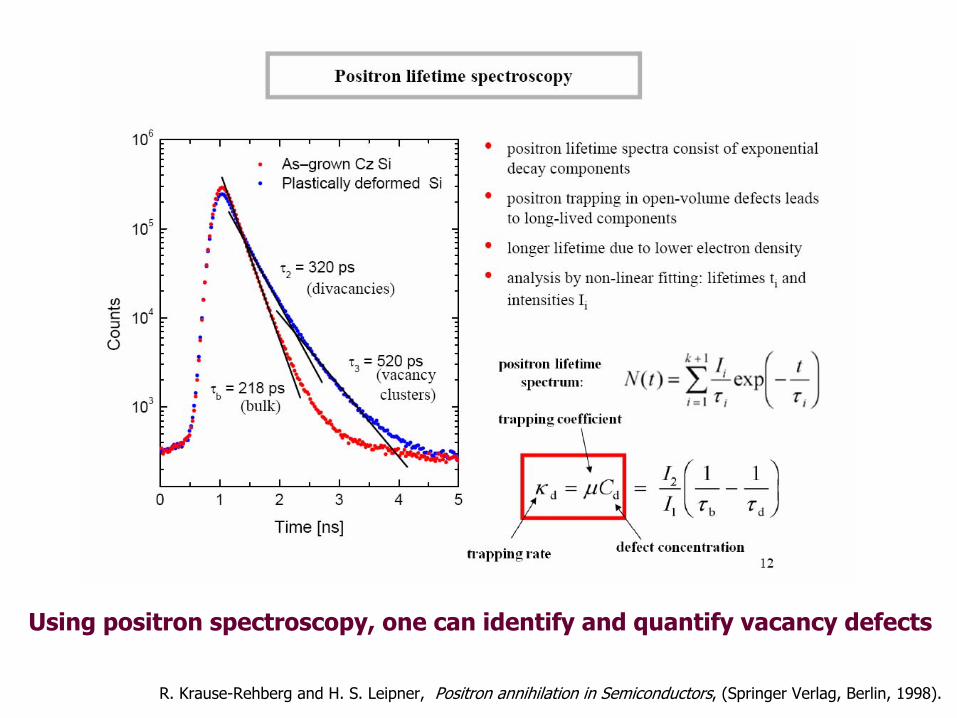
R. Krause-Rehberg and H. S. Leipner, Positron annihilation in Semiconductors, (Springer Verlag, Berlin, 1998).
Using positron spectroscopy, one can identify and quantify vacancy defects
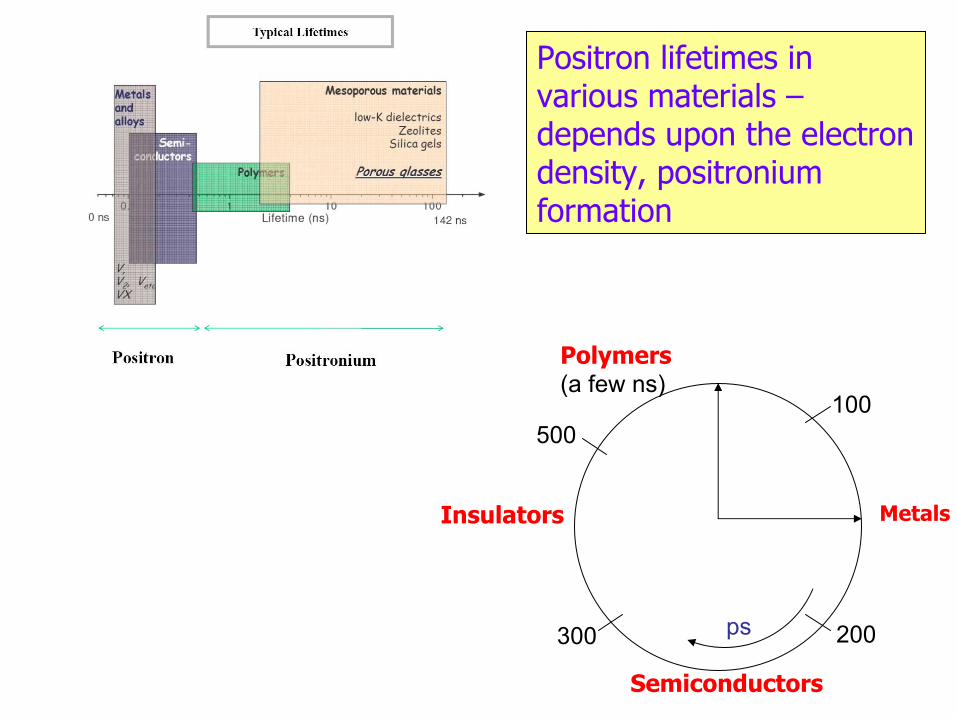
Metals
Semiconductors
Insulators
Polymers(a few ns)
100
200300 ps
Positron lifetimes in various materials –depends upon the electron density, positroniumformation
500
Application of PAS for defect studies
Positron lifetime is sensitive to the local electron density.
Due to relative decrease of the local electron density at the site of vacancy, positron lifetime increases due to the presence of vacancy-defects.
Further, as the vacancy cluster size increases, positron lifetime initially increases upto some cluster size and saturates at higher sizes.
Thus, positrons can be used as a probe to any process aided by vacancy-defects, with sensitivity starting from atomistic vacancy
defect onwards upto a large vacancy cluster or void.

![Post-mortem histopathology underlying β-amyloid PET ...€¦ · A recent phase III trial of [18F]flutemetamol positron emission tomography (PET) imaging in 106 end-of-life subjects](https://static.fdocument.org/doc/165x107/6128f3e918ccd57368713d6a/post-mortem-histopathology-underlying-amyloid-pet-a-recent-phase-iii-trial.jpg)

![RESEARCH Open Access Diagnostic effectiveness of quantitative · 42; and tracer retention on amyloid positron emission tomography [PET] imaging) are representative of up-stream events](https://static.fdocument.org/doc/165x107/6128f490fc72d227544be542/research-open-access-diagnostic-effectiveness-of-quantitative-42-and-tracer-retention.jpg)