Transforming Growth Factor-β Signaling Guides the ... · PDF fileTransforming Growth...
11
Immunity, Volume 44 Supplemental Information Transforming Growth Factor-b Signaling Guides the Differentiation of Innate Lymphoid Cells in Salivary Glands Victor S. Cortez, Luisa Cervantes-Barragan, Michelle L. Robinette, Jennifer K. Bando, Yaming Wang, Theresa L. Geiger, Susan Gilfillan, Anja Fuchs, Eric Vivier, Joe C. Sun, Marina Cella, and Marco Colonna
Transcript of Transforming Growth Factor-β Signaling Guides the ... · PDF fileTransforming Growth...
Immunity, Volume 44
Supplemental Information
Transforming Growth Factor-b Signaling
Guides the Differentiation of Innate
Lymphoid Cells in Salivary Glands
Victor S. Cortez, Luisa Cervantes-Barragan, Michelle L. Robinette, Jennifer K.Bando, Yaming Wang, Theresa L. Geiger, Susan Gilfillan, Anja Fuchs, Eric Vivier, Joe C.Sun, Marina Cella, and Marco Colonna
TRAIL
7.33
9.35
17.6
24.9
6.34
7.75NK1
.1
NKp46102
103
104
105
106
Liver
siLP siI
E
Liver siLP siIE
# N
K1.1
+ NKp
46+ C
D3- c
ells
2.43
2.23
NK1.1
CD
49b
2.01
0.3331.3
1.92
0.3127.3
NK1.1
CD
3
105
106
107
Spl
n N
K ce
lls
0
10
20
30
40
50
60
% IF
N-γ
+ Cel
ls
46.1
45
SplnIL-12 + IL-18
NK1
.1
IFN-γ
% C
D10
7α+ C
ells
0
10
20
30
40
50
60
SplnP/I
NK1
.1
CD107α
47.2
46.9
WT
Tgfbr2f/f Ncr1Cre
Liver
siLP siIE
Spln
CD73
Liver
WT
Tgfbr2f/f Ncr1Cre
1.13
41.6
0.50
42
82.6
NK1.1
GAT
A3
CD127
KLR
G1 86.3
NK1.1
RO
Rgt
Thy1
.2
CCR6
NKp
46
NK1.1 0.00.20.61.0
203040
10
NK1.1+
ILC2
ILC3
SG ILC2 SG ILC3
0 0
64.935
% C
ells
A
B C D E
F G
H I
WT Tgfbr2f/f Ncr1Cre
CD49a
CD69
CD62L
Liver siLP siIEWT Tgfbr2f/f Ncr1Cre
WT Tgfbr2f/f Ncr1Cre
WT Tgfbr2f/f Ncr1Cre
NS
NSNS
NS
NSNS
69
35.4 4.4
3426
70.7
37.8 4.6
18 39.7
RO
Rγt
CD45
CC
R6
NKp4602
468
10
1214
# SI
LP
NKp
46+ I
LC3
(x10
4 )
WT Tgfbr2f/f Ncr1Cre
NS
Figure S1
siLP
Spln Spln
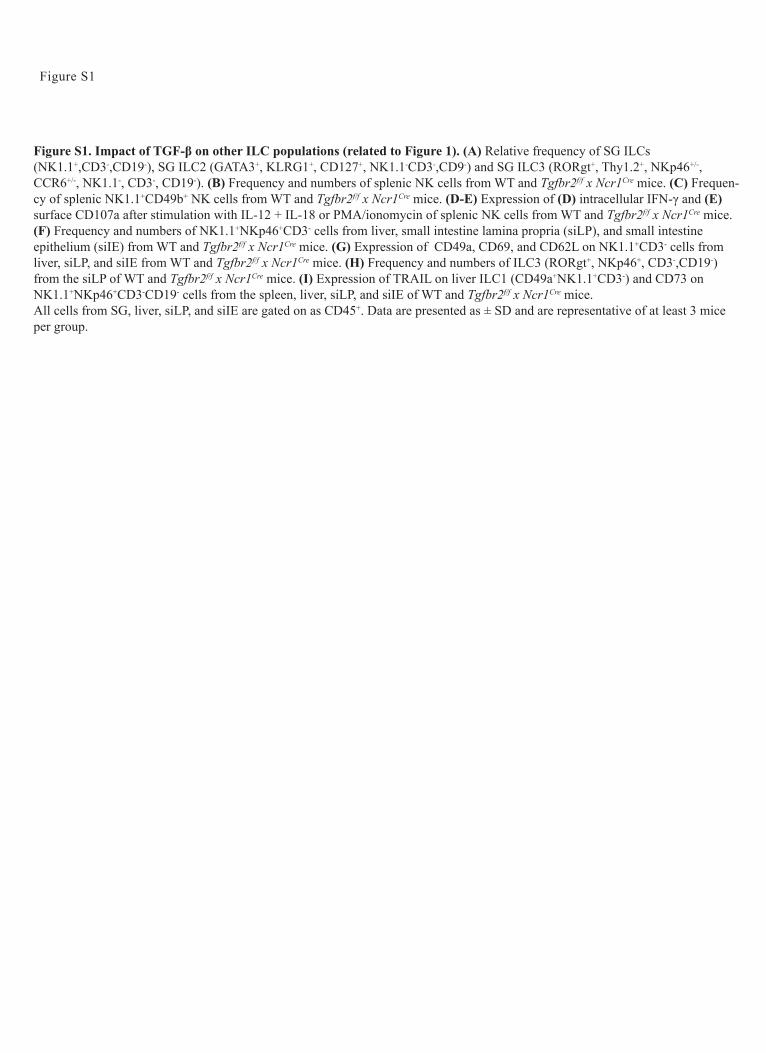
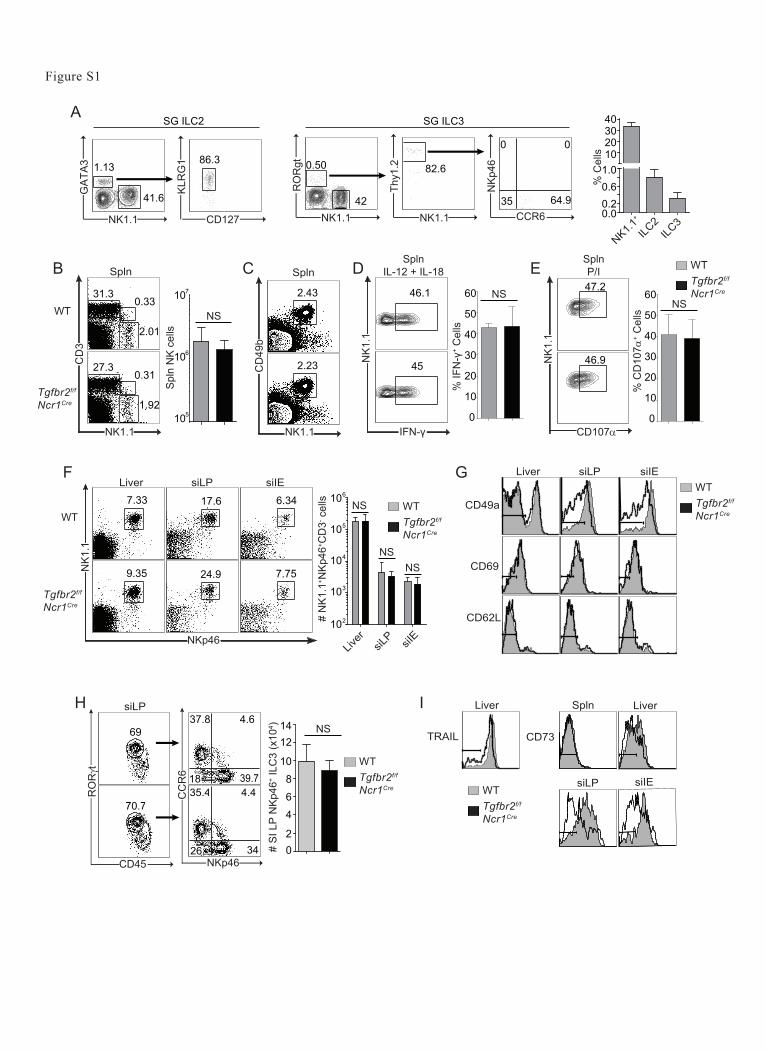
Figure S1. Impact of TGF-β on other ILC populations (related to Figure 1). (A) Relative frequency of SG ILCs (NK1.1+,CD3-,CD19-), SG ILC2 (GATA3+, KLRG1+, CD127+, NK1.1-CD3-,CD9-) and SG ILC3 (RORgt+, Thy1.2+, NKp46+/-, CCR6+/-, NK1.1-, CD3-, CD19-). (B) Frequency and numbers of splenic NK cells from WT and Tgfbr2f/f x Ncr1Cre mice. (C) Frequen-cy of splenic NK1.1+CD49b+ NK cells from WT and Tgfbr2f/f x Ncr1Cre mice. (D-E) Expression of (D) intracellular IFN-γ and (E) surface CD107a after stimulation with IL-12 + IL-18 or PMA/ionomycin of splenic NK cells from WT and Tgfbr2f/f x Ncr1Cre mice. (F) Frequency and numbers of NK1.1+NKp46+CD3- cells from liver, small intestine lamina propria (siLP), and small intestine epithelium (siIE) from WT and Tgfbr2f/f x Ncr1Cre mice. (G) Expression of CD49a, CD69, and CD62L on NK1.1+CD3- cells from liver, siLP, and siIE from WT and Tgfbr2f/f x Ncr1Cre mice. (H) Frequency and numbers of ILC3 (RORgt+, NKp46+, CD3-,CD19-) from the siLP of WT and Tgfbr2f/f x Ncr1Cre mice. (I) Expression of TRAIL on liver ILC1 (CD49a+NK1.1+CD3-) and CD73 on NK1.1+NKp46+CD3-CD19- cells from the spleen, liver, siLP, and siIE of WT and Tgfbr2f/f x Ncr1Cre mice. All cells from SG, liver, siLP, and siIE are gated on as CD45+. Data are presented as ± SD and are representative of at least 3 mice per group.
Figure S1
76.2
64.9
NK1.1
CD
3WT
Tgfbr2f/f Ncr1Cre
CD49b NKp46
IL-2
IL-2 +TGF-β1 Ctrl
WT Tgfbr2f/f Ncr1Cre
A B
Figure S2
Figure S2. NK cells maintain CD49b and NKp46 expression after in vitro culture with TGF-β1 (related to Figure 2). (A) Frequencies of NK1.1+CD3- NK cells from spleen of WT and Tgfbr2f/f x Ncr1Cre mice after magnetic enrichment using CD49b microbeads. (B) Expression of CD49b and NKp46 after 7 days of culture with either IL-2 + TGF-β1 or IL-2 alone on enriched splenic NK cells from WT or Tgfbr2f/f x Ncr1Cre mice.
84.1 14
84.1 74.4
60.8 13
Liver
SG
WT Nfil3-/-A
Figure S3
3.6
24
0.2
29.7
0.6
26.8
WT Tbx21-/-Eomesf/f Ncr1Cre
Spleen
C
Spleen
93.5 21.7
98.9 98.3
98.5 67.6
WT Nfil3-/-
T-betEomes
0
0.5
1.0
1.5
2.0Sp
leni
c N
K ce
lls (x
106 )
***
NK1.1
CD
3
WT
Tbx21-/-
Eomesf/f Ncr1Cre
Liver
SG
Spleen
WT Tbx21-/-
SG ILCsCD103
SG ILCsNKp46
WT
SG-NK1.1
Eomesf/f Ncr1Cre
SG
D ESG ILCsTRAIL
WT Eomesf/f Ncr1Cre
WT Spln NK
0.95 92.4
6.03CD49b
CD
49a
Tbx21-/- SG ILCsF G
B
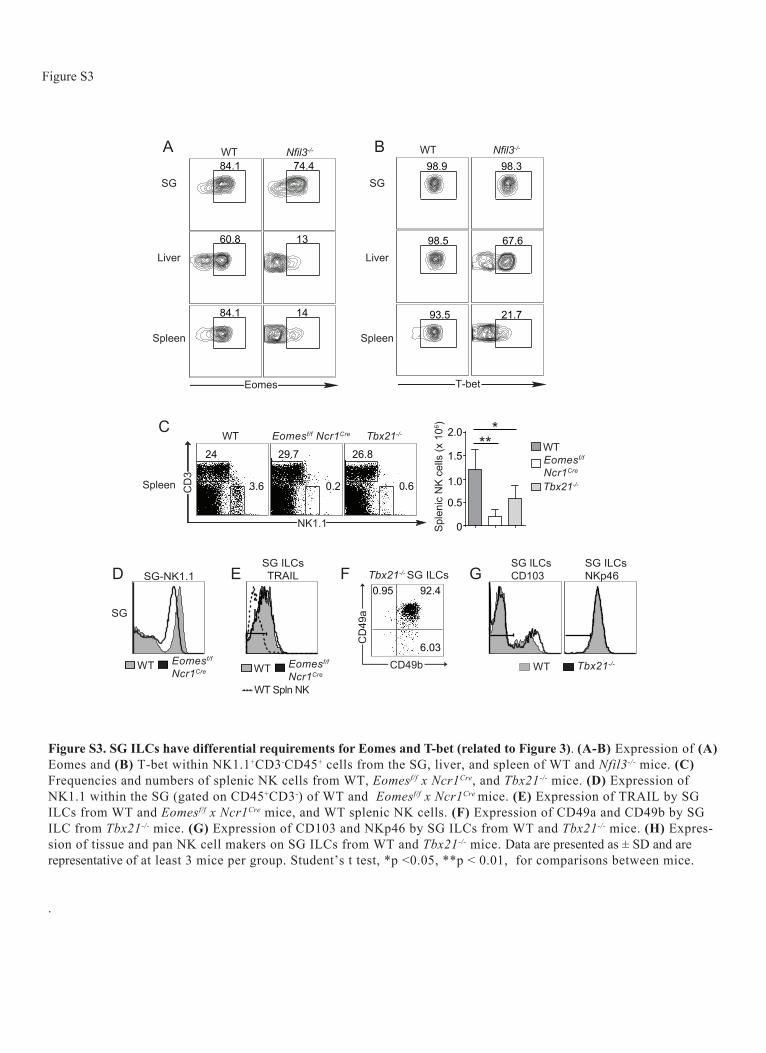
Figure S3. SG ILCs have differential requirements for Eomes and T-bet (related to Figure 3). (A-B) Expression of (A) Eomes and (B) T-bet within NK1.1+CD3-CD45+ cells from the SG, liver, and spleen of WT and Nfil3-/- mice. (C) Frequencies and numbers of splenic NK cells from WT, Eomesf/f x Ncr1Cre, and Tbx21-/- mice. (D) Expression of NK1.1 within the SG (gated on CD45+CD3-) of WT and Eomesf/f x Ncr1Cre mice. (E) Expression of TRAIL by SG ILCs from WT and Eomesf/f x Ncr1Cre mice, and WT splenic NK cells. (F) Expression of CD49a and CD49b by SG ILC from Tbx21-/- mice. (G) Expression of CD103 and NKp46 by SG ILCs from WT and Tbx21-/- mice. (H) Expres-sion of tissue and pan NK cell makers on SG ILCs from WT and Tbx21-/- mice. Data are presented as ± SD and are representative of at least 3 mice per group. Student’s t test, *p <0.05, **p < 0.01, for comparisons between mice.
.
CD49a
CD103
CD69CD62
L
TRAILCD73
0
20
40
60
80
100
Figure S4
A
% H
igh
SG IL
Cs
WT Smad4f/f Ncr1Cre
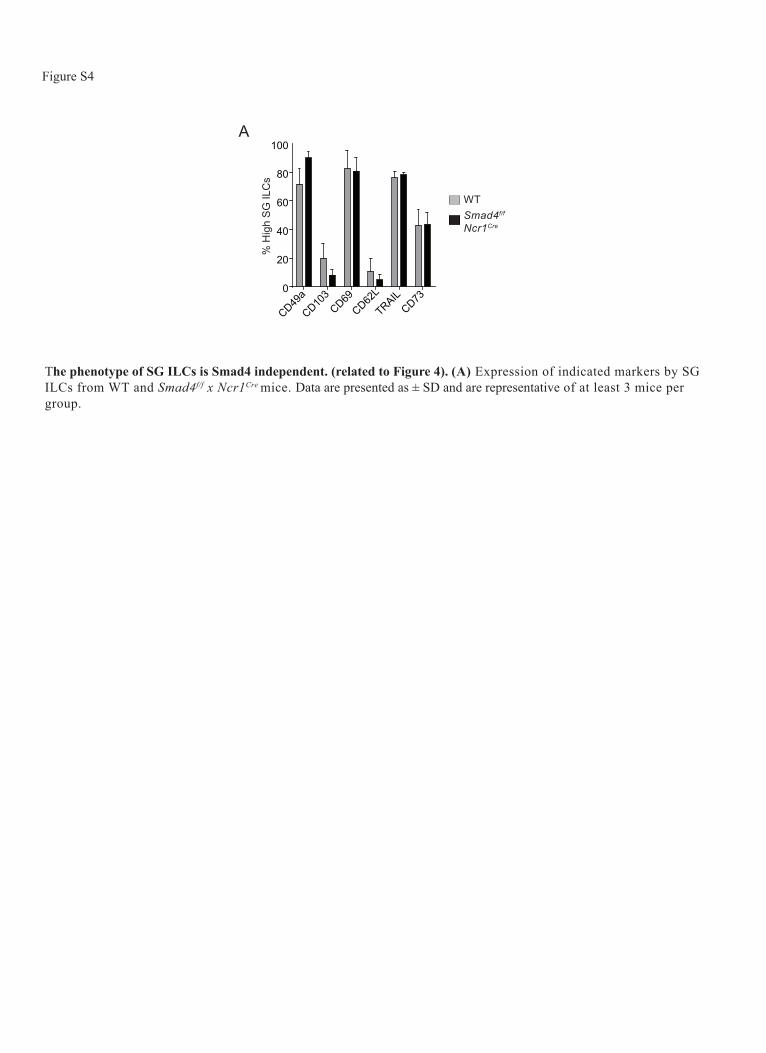
The phenotype of SG ILCs is Smad4 independent. (related to Figure 4). (A) Expression of indicated markers by SG ILCs from WT and Smad4f/f x Ncr1Cre mice. Data are presented as ± SD and are representative of at least 3 mice per group.
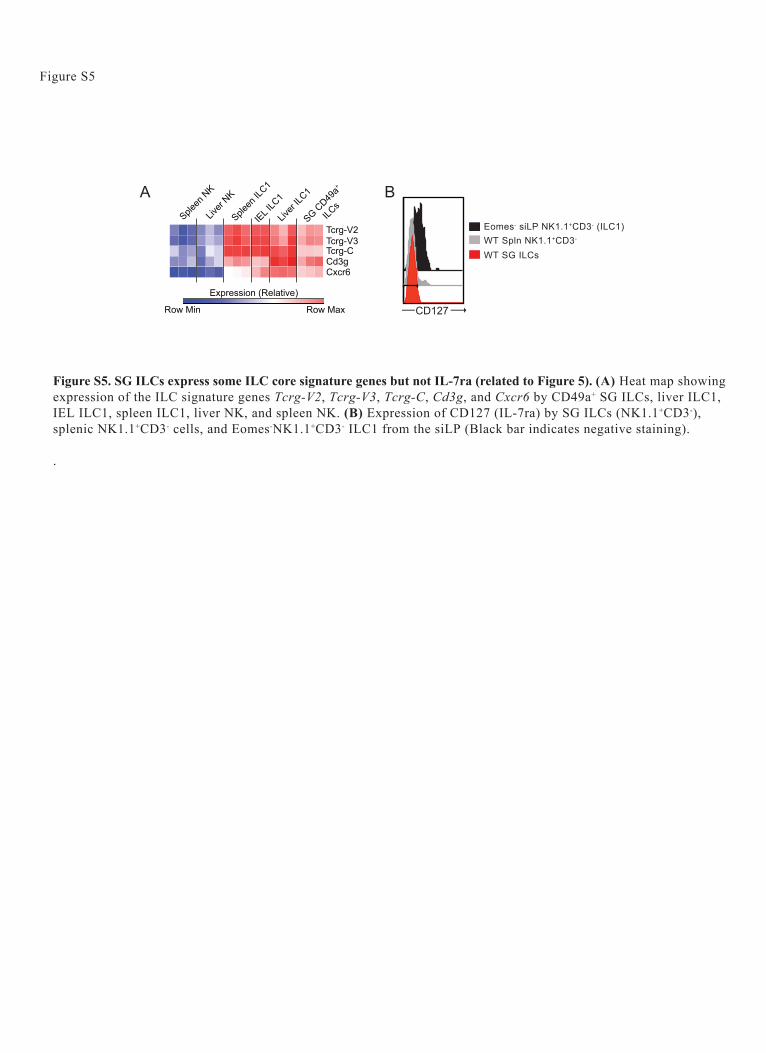
Figure S5
Cxcr6
Tcrg-V2Tcrg-V3
Cd3gTcrg-C
SG CD49
a+
ILCs
Spleen
NK
Liver
NK
Spleen
ILC1
Liver
ILC1
IEL ILC
1
CD127
WT SG ILCs
Eomes- siLP NK1.1+CD3- (ILC1)WT Spln NK1.1+CD3-
A B
Figure S5. SG ILCs express some ILC core signature genes but not IL-7ra (related to Figure 5). (A) Heat map showing expression of the ILC signature genes Tcrg-V2, Tcrg-V3, Tcrg-C, Cd3g, and Cxcr6 by CD49a+ SG ILCs, liver ILC1, IEL ILC1, spleen ILC1, liver NK, and spleen NK. (B) Expression of CD127 (IL-7ra) by SG ILCs (NK1.1+CD3-), splenic NK1.1+CD3- cells, and Eomes-NK1.1+CD3- ILC1 from the siLP (Black bar indicates negative staining).
.
Row Min Row Max
Expression (Relative)
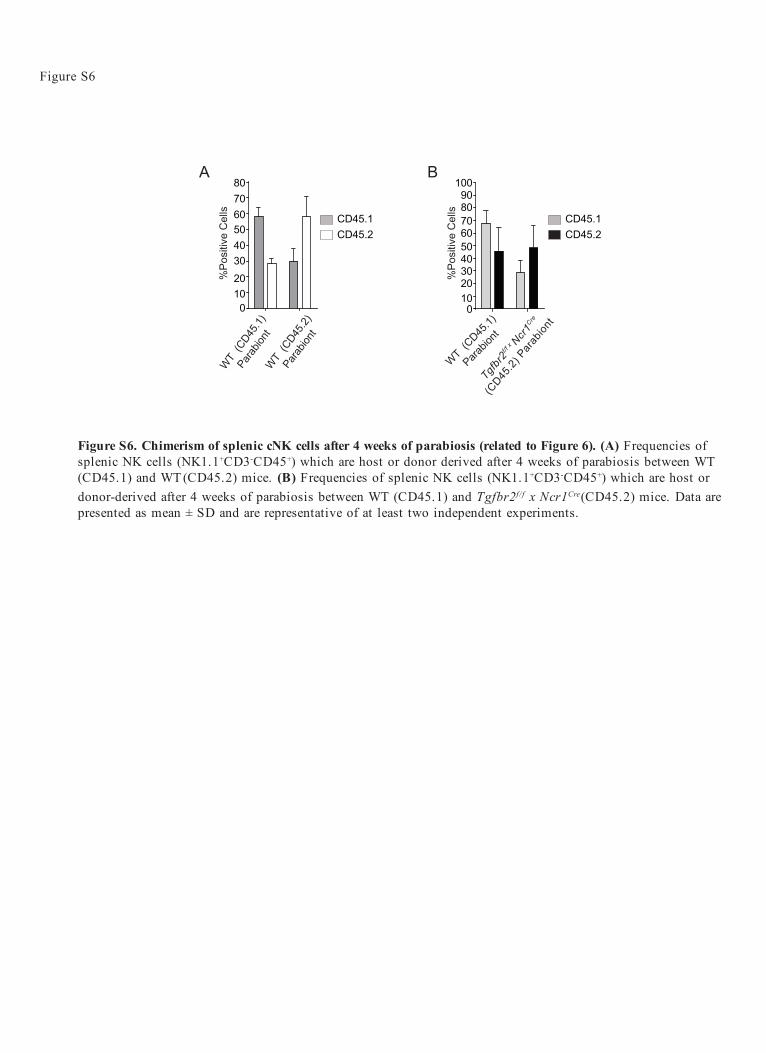
Figure S6
Figure S6. Chimerism of splenic cNK cells after 4 weeks of parabiosis (related to Figure 6). (A) Frequencies of splenic NK cells (NK1.1+CD3-CD45+) which are host or donor derived after 4 weeks of parabiosis between WT (CD45.1) and WT (CD45.2) mice. (B) Frequencies of splenic NK cells (NK1.1+CD3-CD45+) which are host or donor-derived after 4 weeks of parabiosis between WT (CD45.1) and Tgfbr2f/f x Ncr1Cre(CD45.2) mice. Data are presented as mean ± SD and are representative of at least two independent experiments.
A
01020304050607080
WT
(CD45
.1)
Par
abion
tW
T (C
D45.2)
Par
abion
t
%Po
sitiv
e C
ells
CD45.1CD45.2
0102030405060708090
100
%Po
sitiv
e C
ells
CD45.1CD45.2
WT (CD45
.1)
Parabio
nt
Tgfbr
2f/f
x Ncr
1Cre
(CD45
.2) P
arab
iont
B
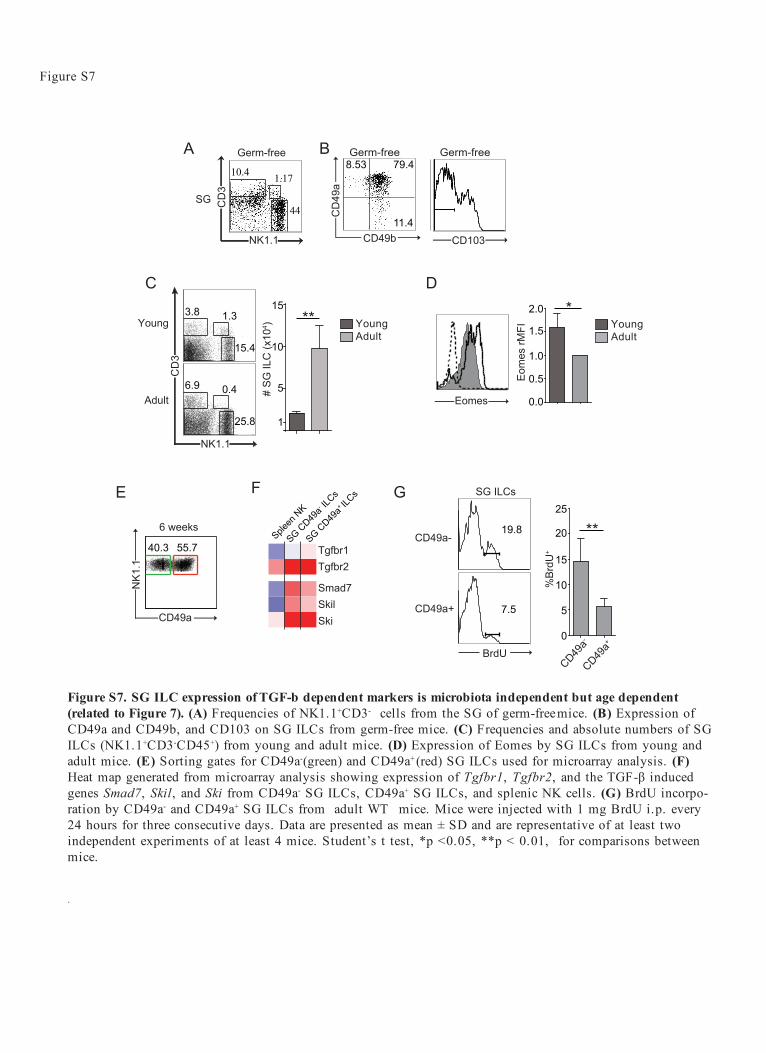
Figure S7
A10.4
44
1.17
SG
B
NK1.1
CD
3
Germ-free
0.0
0.5
1.0
1.5
2.0
D
AdultYoung
Eom
es rM
FI
*
Eomes
8.53 79.4
11.4CD49b
CD
49a
Germ-free
CD103
Germ-free
6 weeks
40.3 55.7
NK1
.1
CD49a
E F
Tgfbr1Tgfbr2
Smad7SkilSki
SG CD49
a+ ILC
s
Spleen
NK
SG CD49
a- ILC
s G
3.8
15.4
1.3
6.9
25.8
0.4
NK1.1
CD
3
Young
1
5
10
15
# SG
ILC
(x10
4 ) **AdultYoung
Adult
C
Figure S7. SG ILC expression of TGF-b dependent markers is microbiota independent but age dependent (related to Figure 7). (A) Frequencies of NK1.1+CD3- cells from the SG of germ-free mice. (B) Expression of CD49a and CD49b, and CD103 on SG ILCs from germ-free mice. (C) Frequencies and absolute numbers of SG ILCs (NK1.1+CD3-CD45+) from young and adult mice. (D) Expression of Eomes by SG ILCs from young and adult mice. (E) Sorting gates for CD49a-(green) and CD49a+ (red) SG ILCs used for microarray analysis. (F) Heat map generated from microarray analysis showing expression of Tgfbr1, Tgfbr2, and the TGF-β induced genes Smad7, Skil, and Ski from CD49a- SG ILCs, CD49a+ SG ILCs, and splenic NK cells. (G) BrdU incorpo-ration by CD49a- and CD49a+ SG ILCs from adult WT mice. Mice were injected with 1 mg BrdU i.p. every 24 hours for three consecutive days. Data are presented as mean ± SD and are representative of at least two independent experiments of at least 4 mice. Student’s t test, *p <0.05, **p < 0.01, for comparisons between mice.
.
CD49a-
BrdU
7.5
19.8
CD49a+
SG ILCs
0
5
10
15
20
25
CD49a-
CD49a+
%Br
dU+
**
Supplemental Experimental Procedures
Antibodies
Fluorochrome- and biotin-conjugated antibodies to mouse NK1.1 (PK136), CD3 (145-2C11), CD45 (30-F11), CD103 (2E7), CD49b (HMa2), CD27 (LG.7F9), TRAIL (N2B2), CD11b (M1/70), CD45.1 (104), CD45.2 (A20), CD11c (N418), KLRG1 (2F1), Eomes (Dan11mag), T-bet (eBIO 4B10), and IFN-γ (xma1.2) were purchased from eBioscience. Fluorochrome- and biotin-conjugated antibodies to mouse CD49a (Ha31/8), CD69 (H1.2F3) CD62L (MEL-14), CD43 (S7), IL-21r (4A9), and CD107a (1D4B) were purchased from BD Biosci-ences. Biotin-conjugated GITR (DTA-1) was purchased from Biolegend. Streptavidin-APC, Streptavidin-Per-CP/Cy5.5, and Streptavidin-PE-Cy7 were purchased from Invitrogen, Biolegend, and eBioscience, respectively.
Primer Pairs for qRT-PCR
Primers were used as follows:
Gapdh forward-ACGGCAAATTCAACGGCACAGTCA; Gapdh reverse-TGGGGGCATCGGCAGAAGG; Tgfb1 forward-TTGCTTCAGCTCCACAGAGA;Tgfb1 reverse- TGGTTGTAGAGGGCAAGGAC; Tgfb2 forward- CCGGAGGTGATTTCCATCTA; Tgfb2 reverse- GCGGACGATTCTGAAGTAGG; Tgfb3 forward- ATTCGACATGATCCAGGGAC; Tgfb3 reverse- TCTCCACTGAGGACACATTGA.Inpp4b forward- AGAACCTCAGATGGTGGCAAAInpp4b reverse- CCCGCTCAGACTTTCTGGTGTsc22d1 forward- CCAGTGGCGATGGATCTAGGATsc22d1 reverse- CTTGCACCAGAGCTATTGTCA
Gut and liver lymphocyte isolation
To isolated intestinal lymphocytes, small intestine mesentery and peyers patches were excised followed by length wise cut and gently washing to remove luminal contents. To isolate the intestinal epithelial fraction tissue was incubated in 1x HBSS, 5%BCS, HEPES, and 5mM EDTA for 20 min (performed twice) at RT on a shaker. After removal of epithelial fraction the intestine was washed, minced, and incubated with RPMI1640, 5%BCS, HEPES, and 1mM Collagenase (II or IV) shaking at 37○C for up to 90min. Both the intestinal epithelial fraction and lamina propria fraction were passed through a 100uM filter and layered on a 70%/40% percoll gradient to enrich for lymphocytes in a manner similar to SG. To isolate hepatic lymphocytes, livers were passed through a 70uM filter, followed by red blood cell lysis and layered on a 70%/40% percoll gradient in a manner similar to SG.
Microarray and data analysis
In accordance with ImmGen project standards, 6-week-old male C57BL/6J mice obtained from Jackson Laboratories were used for cell sorting experiments. One to three replicates of RNA were obtained from each sample that passed quality control. RNA amplification and hybridization to the Affymetrix Mouse Gene 1.0 ST array were carried out by ImmGen with a standardized TRIzol extraction protocol.
Data generation and quality-control documentation also followed the ImmGen protocol. Data were analyzed with GenePattern software (Broad Institute). Raw data were normalized with RMA. Differences in gene expression were identified with the Multiplot Studio function of GenePattern, from a filtered subset of genes with coefficients of variation less than 0.2 in all samples and expression of at least 120 relative units in one subset by the class mean functions, a value that corresponds to 95% confidence of true expression across the ImmGen data set.
Hierarchical clustering of sample replicates was carried out in Gene-E from the same dataset, with the Pearson correlation used as a metric. For PCA, the top 15% of the most variable probe sets was calculated with the Popula-tionDistances PCA program (S. Davis, Harvard Medical School). This dataset was log2-transformed in MATLAB and used to generate a PCA with the functions pca and scatter3. Volcano plots comparing change in expression (fold) versus change in expression (fold) were produced in Multiplot Studio. Heat maps were generated with Gene-E. Data were log2-transformed and visualized by 'relative' expression per row.
MiceAll mice were bred at a pathogen free facility at Washington University. All animal experiments were conducted according to USA Public Health Service Policy of Humane Care and Use of Laboratory Animals. All protocols were approved by the Institutional Animal Care and Use Committee (School of Medicine, Washington University, St. Louis, MO).