Transfer Functions for Direct Volume Rendering
45
Transfer Functions for Direct Volume Rendering
Transcript of Transfer Functions for Direct Volume Rendering
Transfer Functions forDirect Volume Rendering
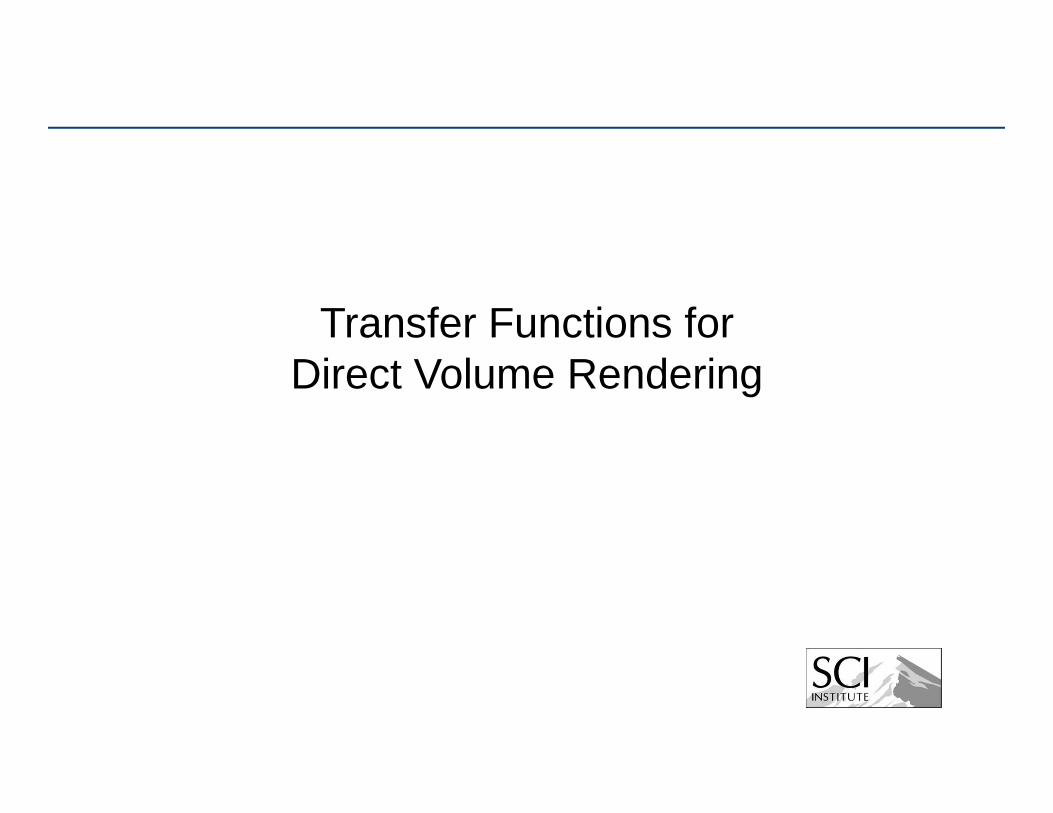
Transfer functions make volume data visibleby mapping data values to optical properties
8 140140
slices: volume rendering:
volume data:
What and Why
Introduction
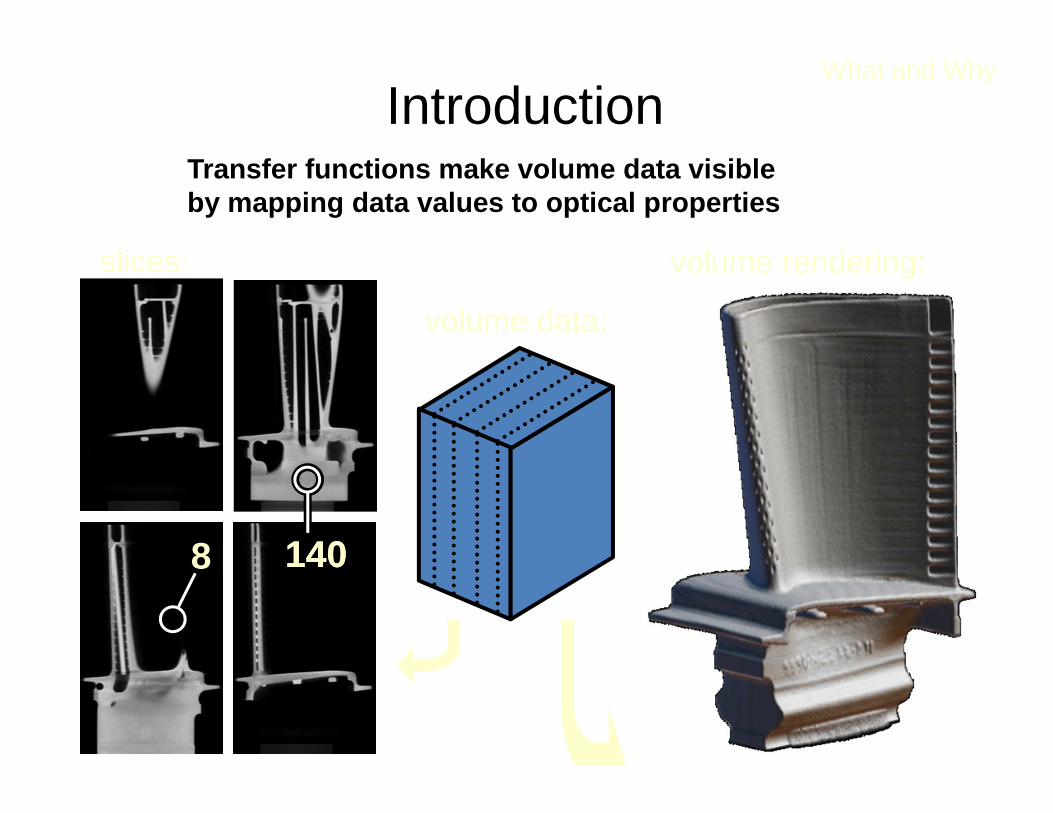
Human Tooth CT
αααα(f)RGB(f)
f
RGB
Shading,Compositing…
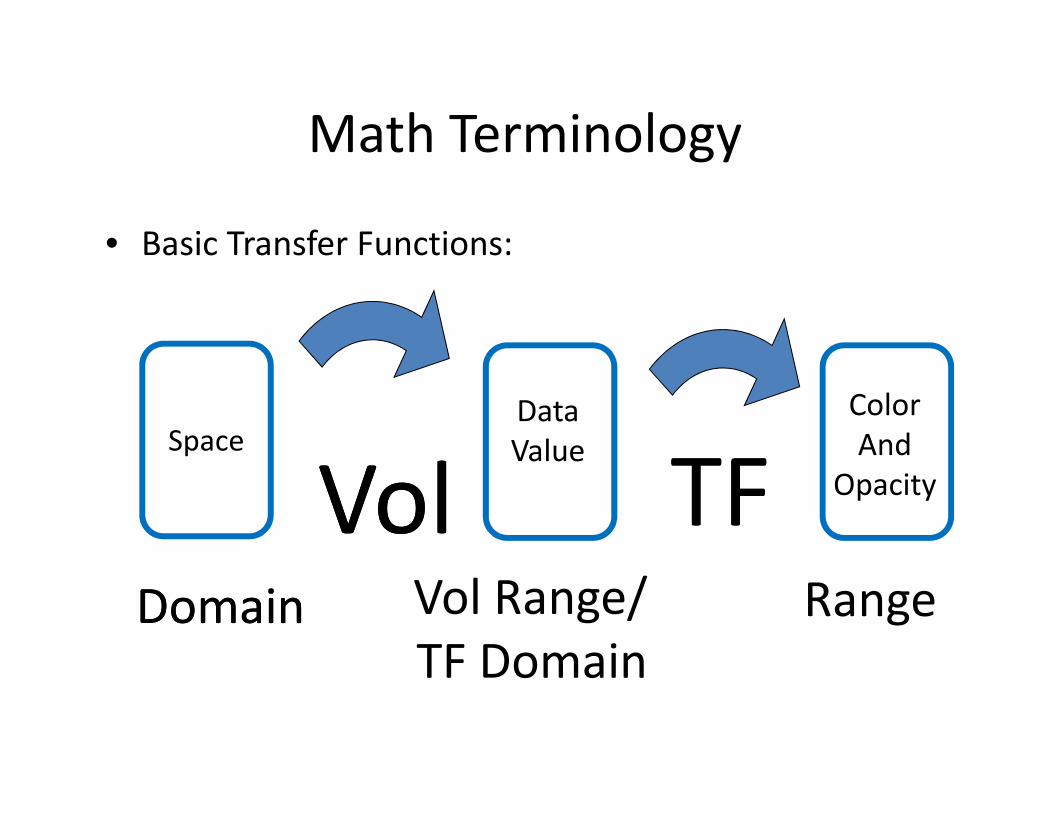
Simple (usual) case: Map data value f to color and opacity
αααα
What and Why
Transfer Functions (TFs)
Vol Range/
TF Domain
Range
Data
Value
Color
And
OpacityTF
Math Terminology
• Basic Transfer Functions:
Space
VolVolDomainDomain
What and Why
What else in range?
• “Optical Properties”: Anything that can be composited with a standard graphics operator (“over”)– Opacity: “opacity functions”
• Most important– Color
• Can help distinguish features– Emittance– Phong parameters (ka, kd, ks)– Index of refraction
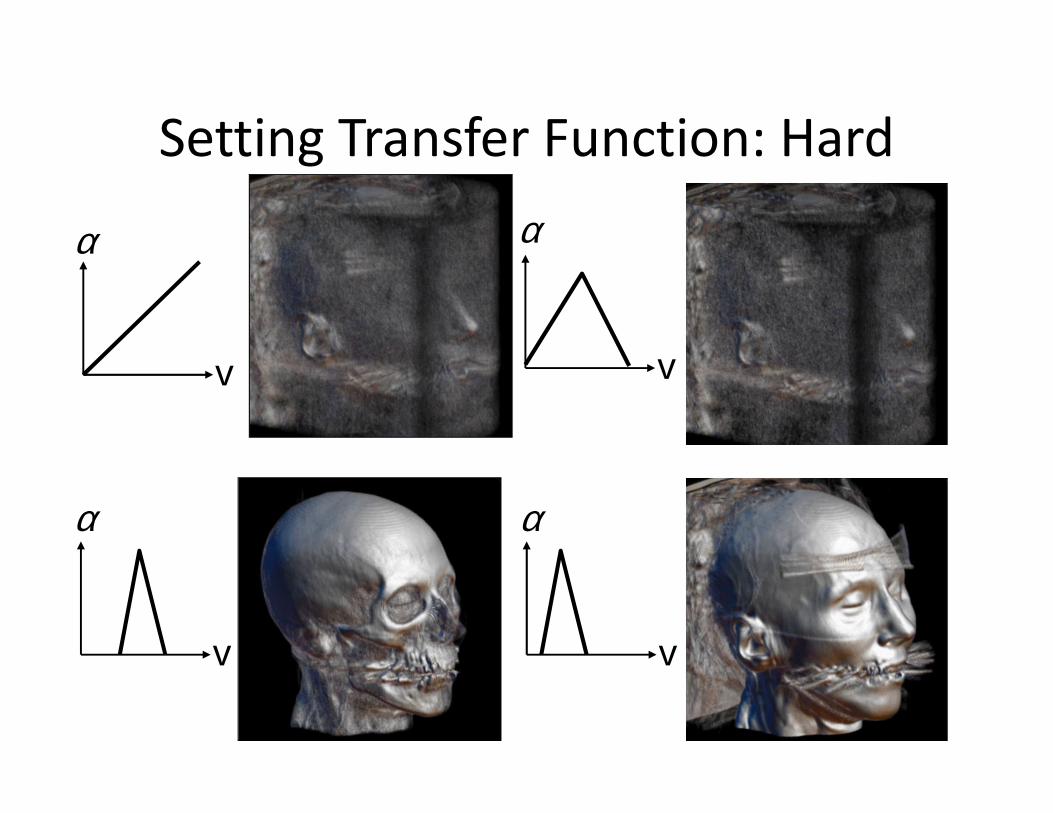
Setting Transfer Function: Hard
v
α
v
α
v
α
v
α
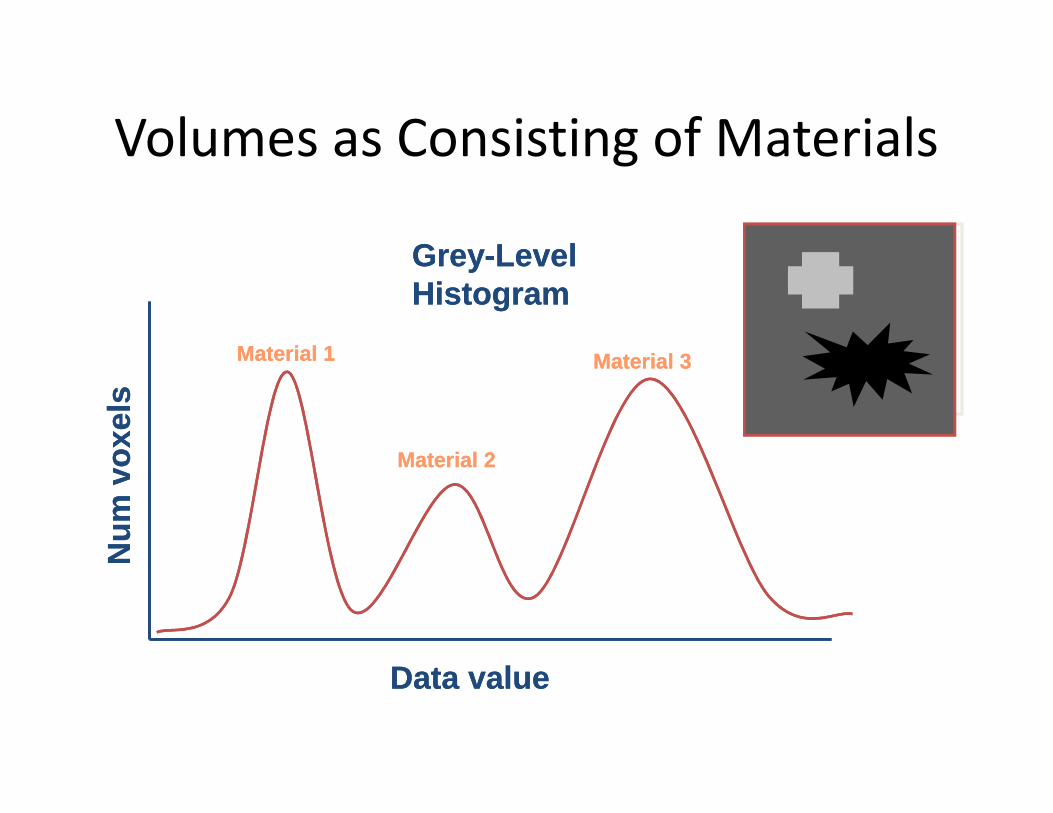
Volumes as Consisting of MaterialsN
um
vo
xels
Nu
m v
oxe
ls
Data valueData value
Grey-Level HistogramGrey-Level Histogram
Material 1Material 1
Material 2Material 2
Material 3Material 3
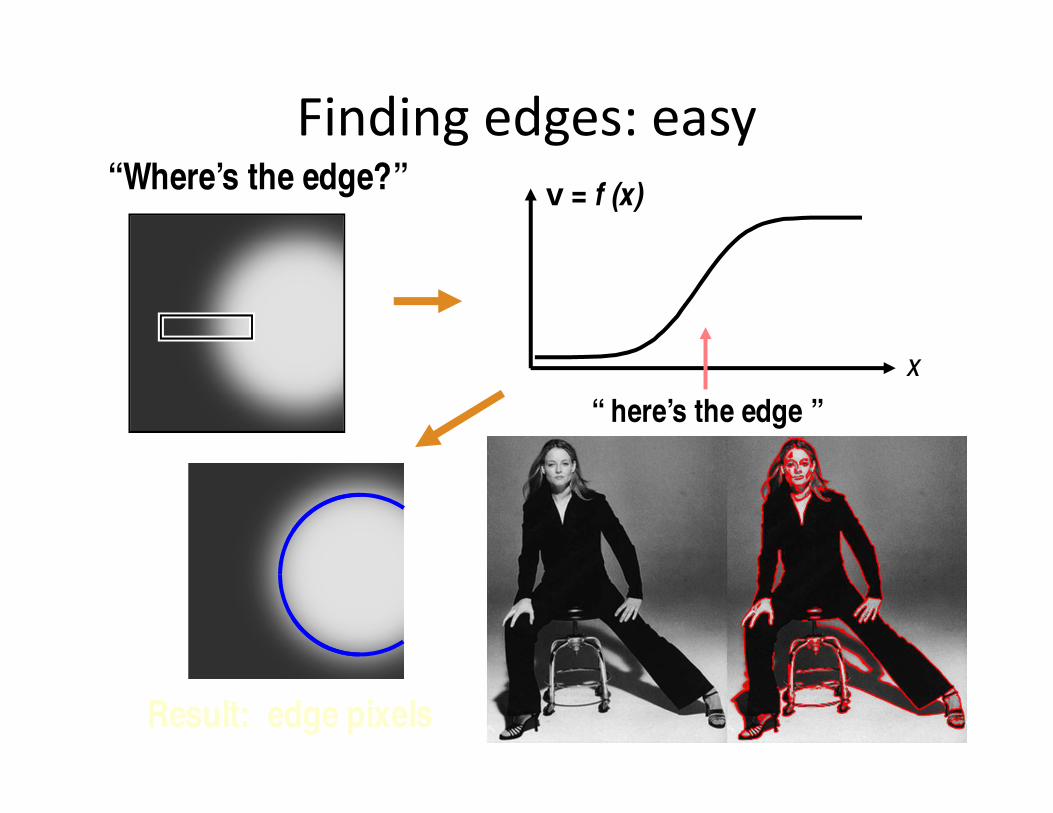
Finding edges: easy
x
v = f (x)
“ here’s the edge ”
Result: edge pixels
“Where’s the edge?”
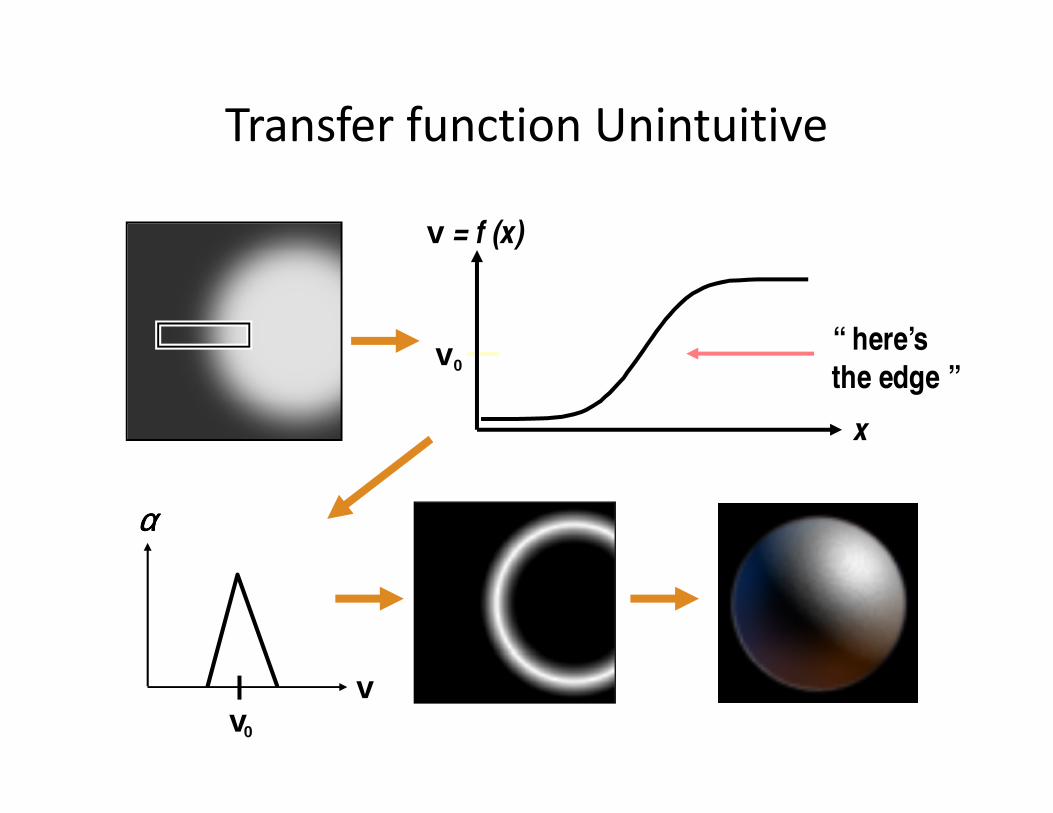
Transfer function Unintuitive
“ here’s
the edge ”
v
αααα
v0
v = f (x)
v0
x
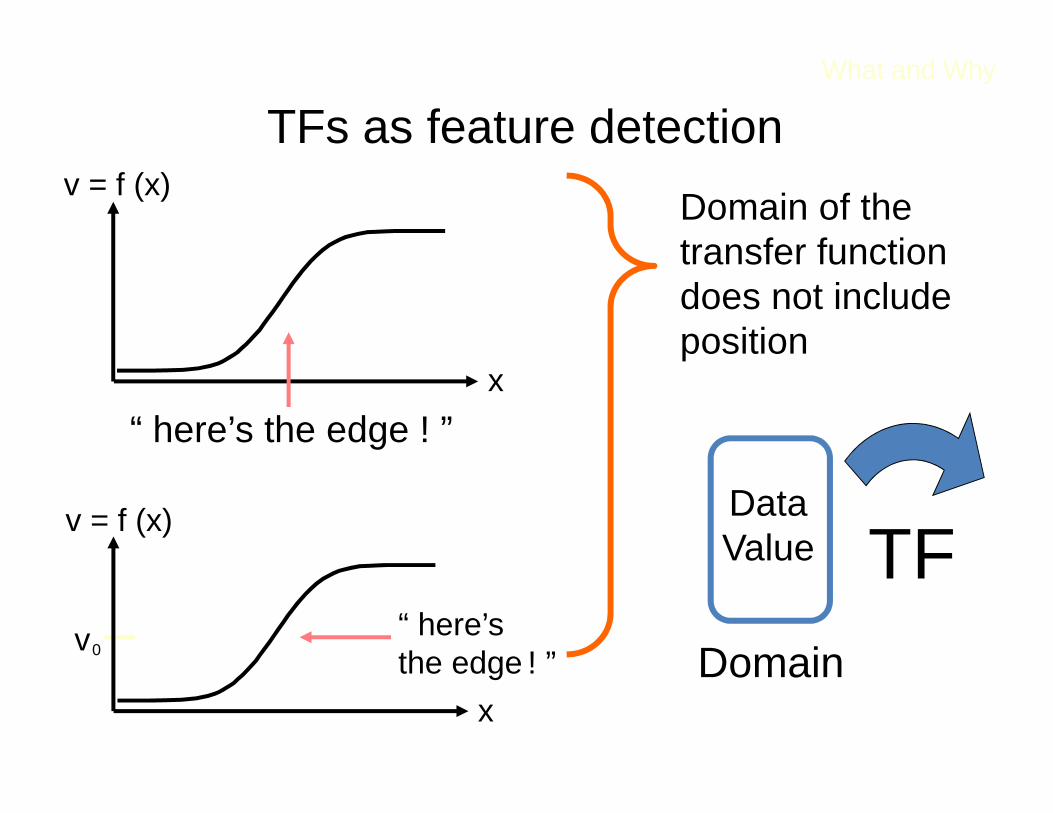
What and Why
“ here’sthe edge ! ”
v0
x
v = f (x)
x
v = f (x)
“ here’s the edge ! ”
Domain of the transfer function does not include position
Domain
DataValue TF
TFs as feature detection
What and Why
Tools for TFs
• Make good renderings easier to come by• Make space of TFs less confusing• Remove excess “flexibility”• Provide one or more of:
– Information– Guidance– Semi-automation– Automation
1. Trial and Error (manual)
2. Spatial Feature Detection
3. Image-Centric
4. Data-Centric
TF Tools
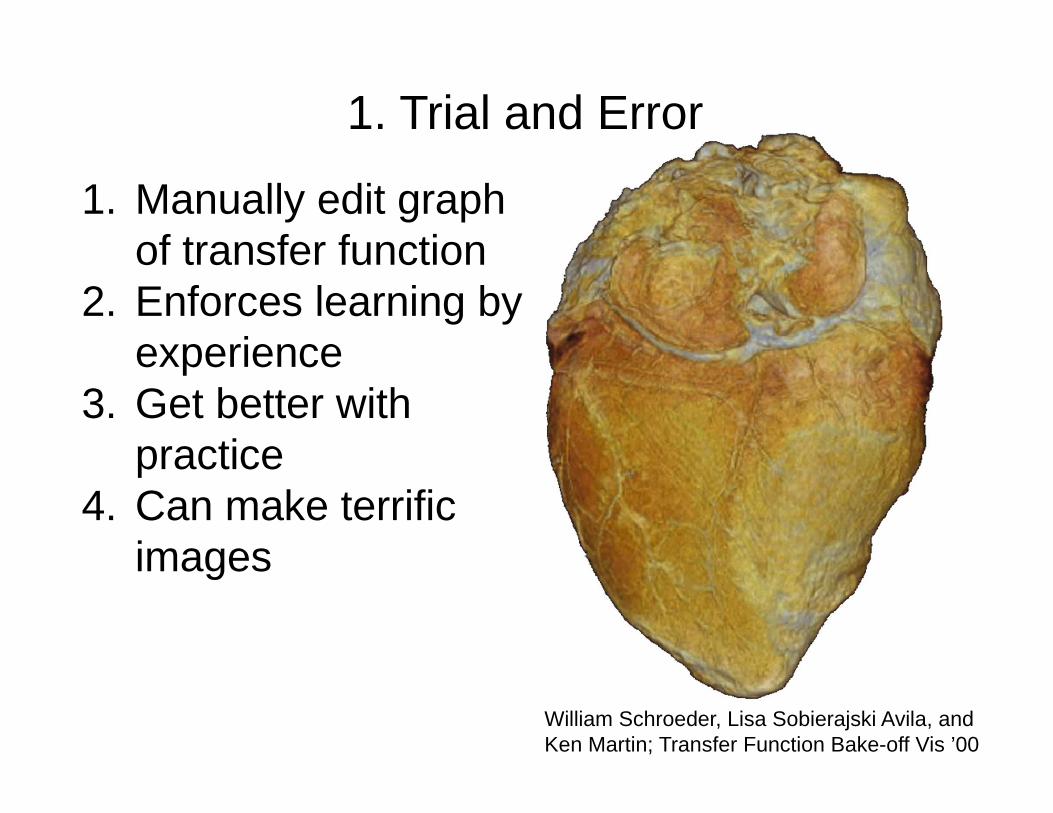
1. Manually edit graph of transfer function
2. Enforces learning by experience
3. Get better with practice
4. Can make terrific images
William Schroeder, Lisa Sobierajski Avila, andKen Martin; Transfer Function Bake-off Vis ’00
1. Trial and Error
1. Trial and Error (manual)
2. Spatial Feature Detection
3. Image-Centric
4. Data-Centric
TF Tools
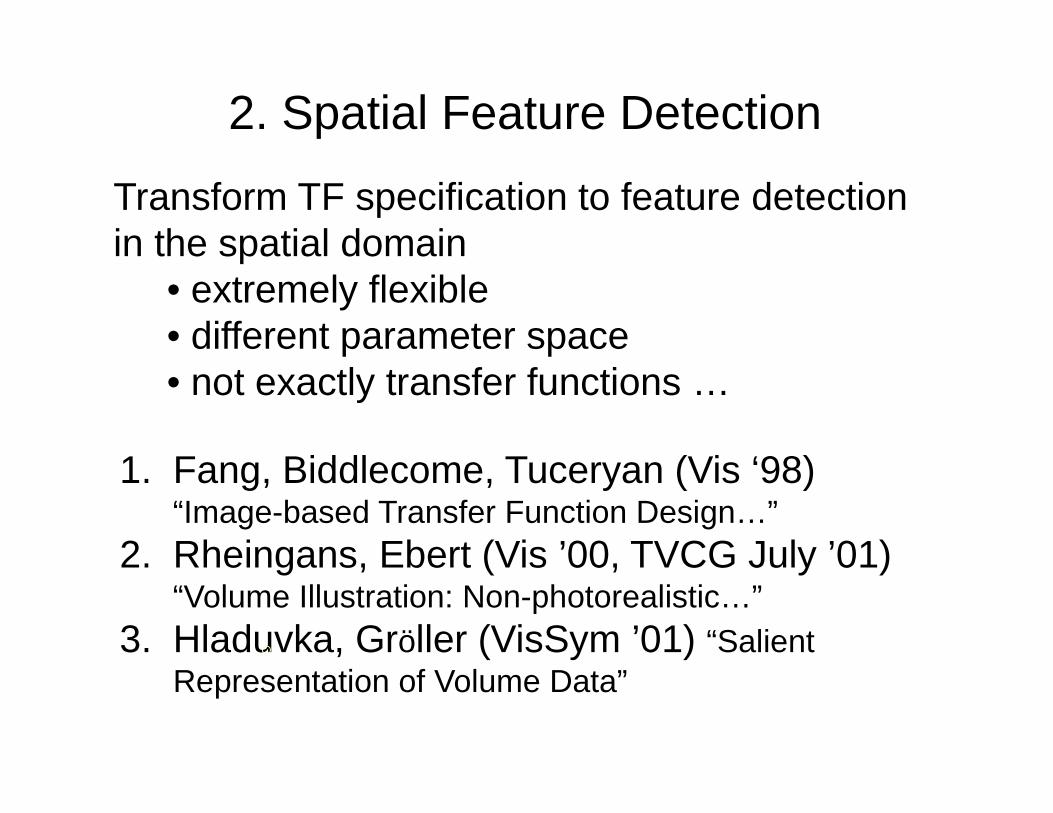
Transform TF specification to feature detection in the spatial domain
• extremely flexible• different parameter space• not exactly transfer functions …
1. Fang, Biddlecome, Tuceryan (Vis ‘98)“Image-based Transfer Function Design…”
2. Rheingans, Ebert (Vis ’00, TVCG July ’01)“Volume Illustration: Non-photorealistic…”
3. Hladuvka, Gröller (VisSym ’01) “Salient Representation of Volume Data”
2. Spatial Feature Detection
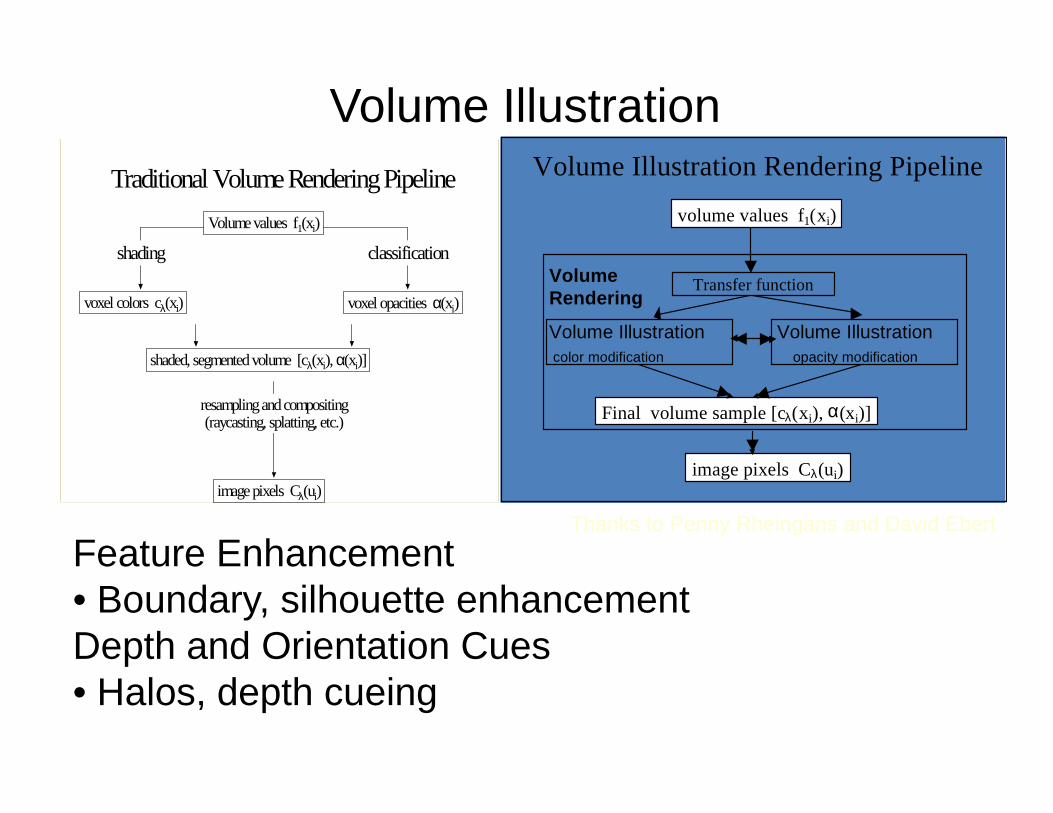
Traditional Volume Rendering Pipeline
voxel colors cλ(xi)
shading classification
shaded, segmented volume [cλ(xi), α(xi)]
image pixels Cλ(ui)
Volume values f1(xi)
voxel opacities α(xi)
resamplingandcompositing(raycasting, splatting, etc.)
Volume Rendering
Volume Illustration Volume Illustration color modification opacity modification
Volume Illustration Rendering Pipeline
Final volume sample [cλ(xi), α(xi)]
image pixels Cλ(ui)
volume values f1(xi)
Transfer functionVolume Rendering
Volume Illustration Volume Illustration color modification opacity modification
Volume Illustration Rendering Pipeline
Final volume sample [cλ(xi), α(xi)]
image pixels Cλ(ui)
volume values f1(xi)
Transfer function
Thanks to Penny Rheingans and David Ebert
Feature Enhancement• Boundary, silhouette enhancementDepth and Orientation Cues• Halos, depth cueing
Volume Illustration
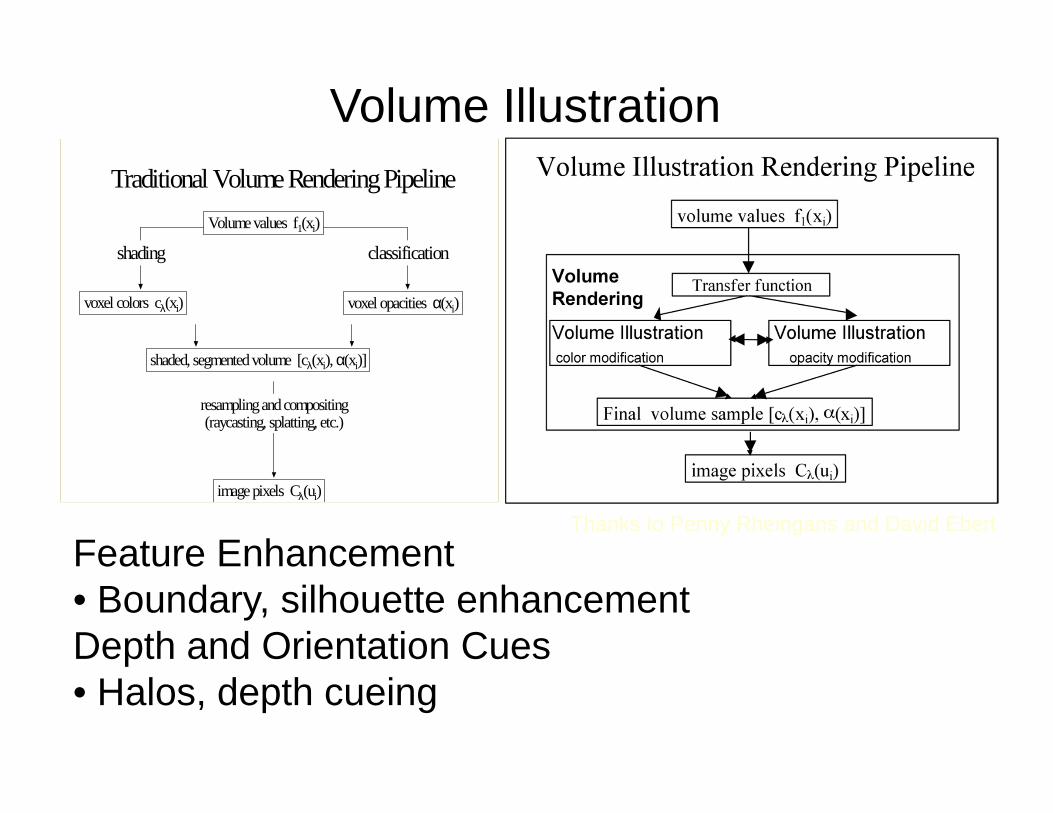
Traditional Volume Rendering Pipeline
voxel colors cλ(xi)
shading classification
shaded, segmented volume [cλ(xi), α(xi)]
image pixels Cλ(ui)
Volume values f1(xi)
voxel opacities α(xi)
resamplingandcompositing(raycasting, splatting, etc.)
Thanks to Penny Rheingans and David Ebert
Feature Enhancement• Boundary, silhouette enhancementDepth and Orientation Cues• Halos, depth cueing
Volume Illustration
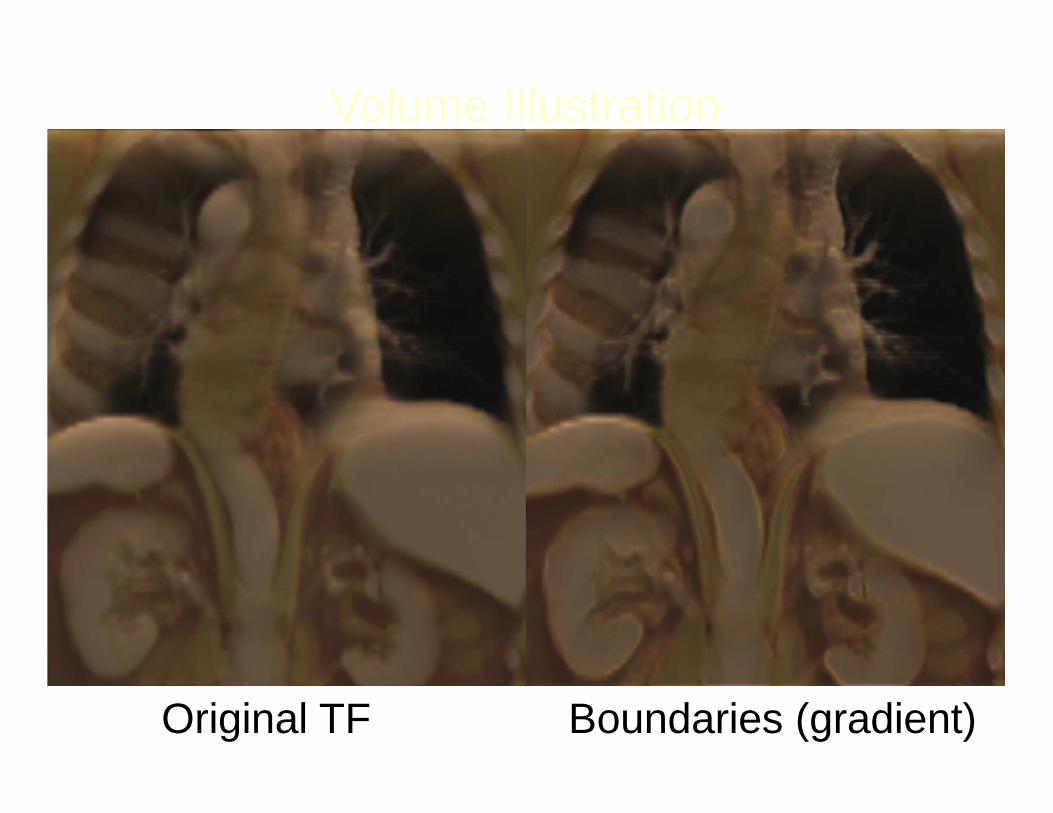
Original TF Boundaries (gradient)
Volume Illustration
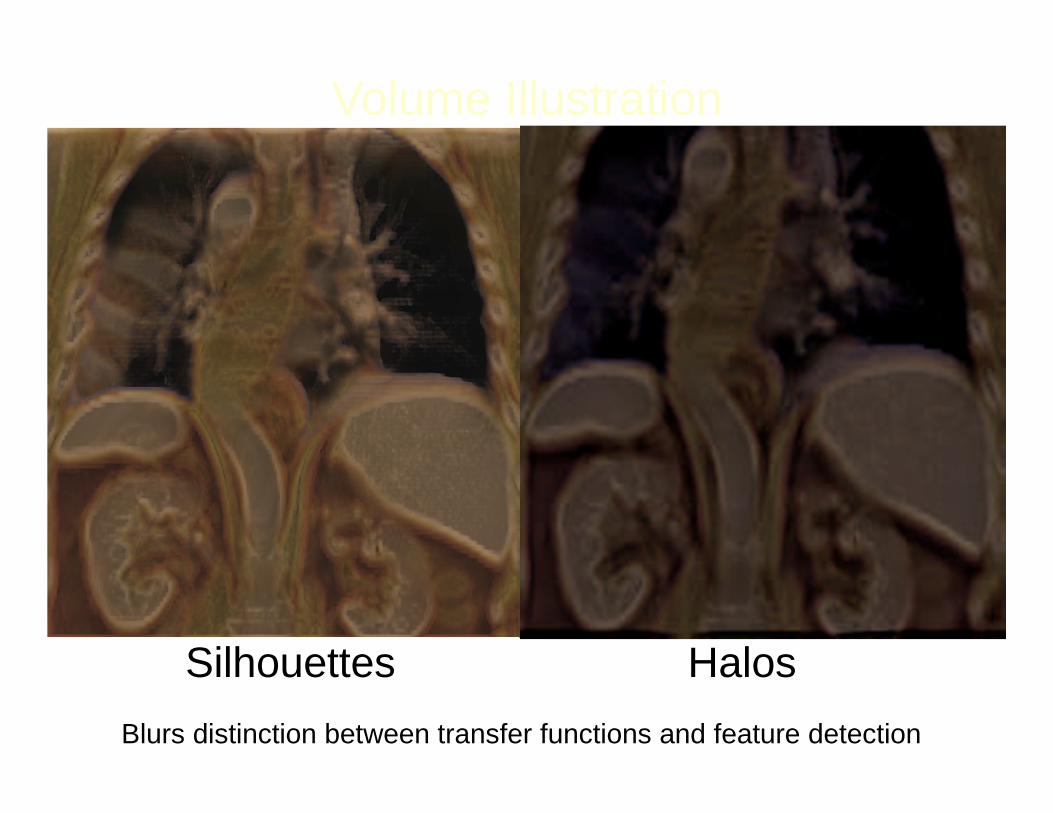
Silhouettes Halos
Blurs distinction between transfer functions and feature detection
Volume Illustration
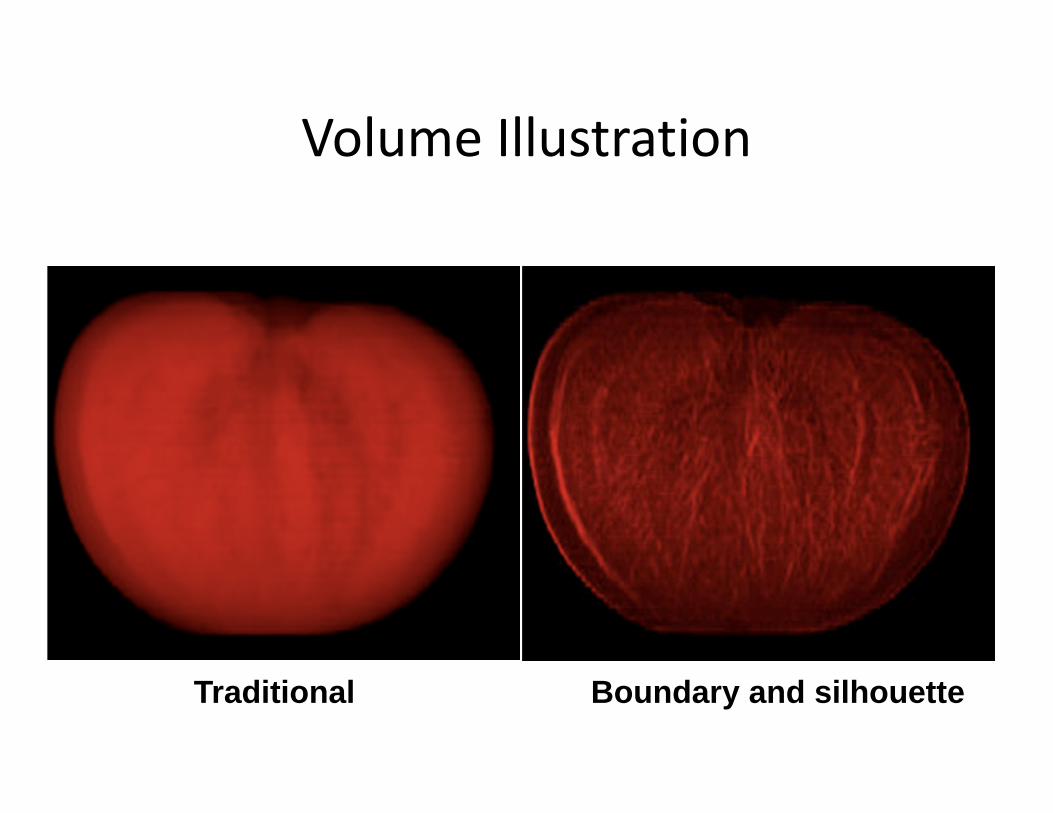
Volume Illustration
Boundary and silhouetteTraditional
1. Trial and Error (manual)
2. Spatial Feature Detection
3. Image-Centric
4. Data-Centric
TF Tools
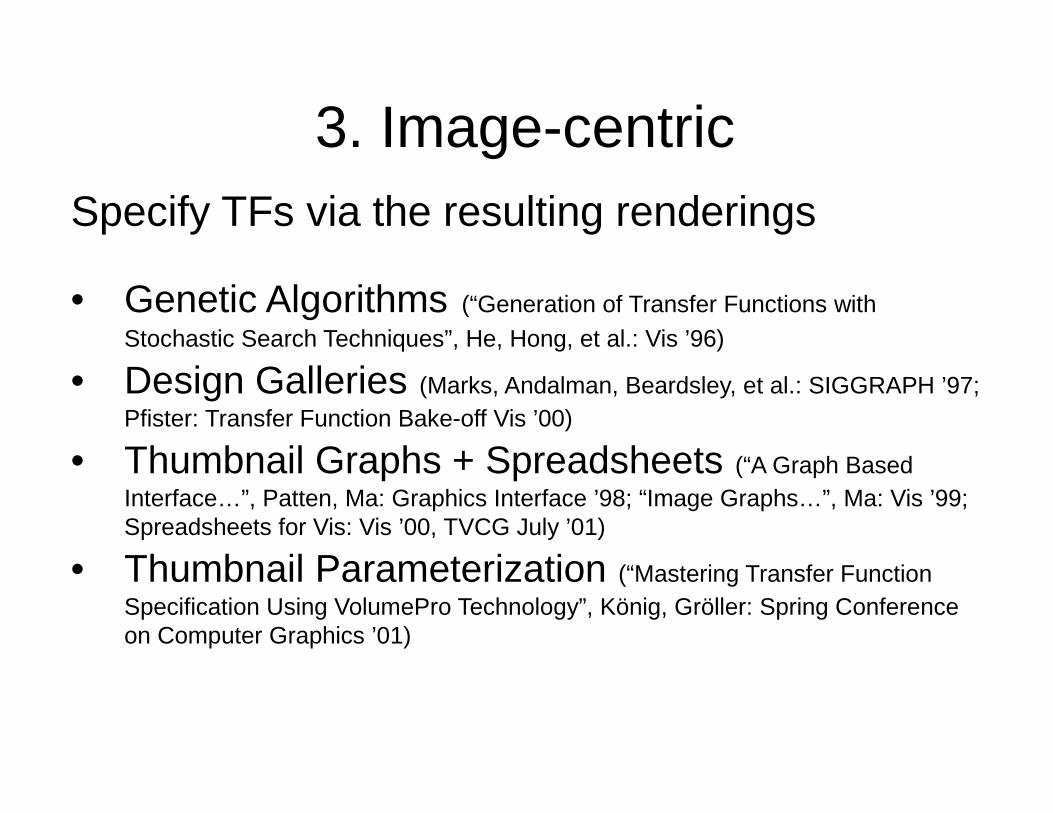
Specify TFs via the resulting renderings
• Genetic Algorithms (“Generation of Transfer Functions with Stochastic Search Techniques”, He, Hong, et al.: Vis ’96)
• Design Galleries (Marks, Andalman, Beardsley, et al.: SIGGRAPH ’97; Pfister: Transfer Function Bake-off Vis ’00)
• Thumbnail Graphs + Spreadsheets (“A Graph Based Interface…”, Patten, Ma: Graphics Interface ’98; “Image Graphs…”, Ma: Vis ’99; Spreadsheets for Vis: Vis ’00, TVCG July ’01)
• Thumbnail Parameterization (“Mastering Transfer Function Specification Using VolumePro Technology”, König, Gröller: Spring Conference on Computer Graphics ’01)
3. Image-centric
1. Trial and Error (manual)
2. Spatial Feature Detection
3. Image-Centric
4. Data-Centric
5. Others
TF Tools
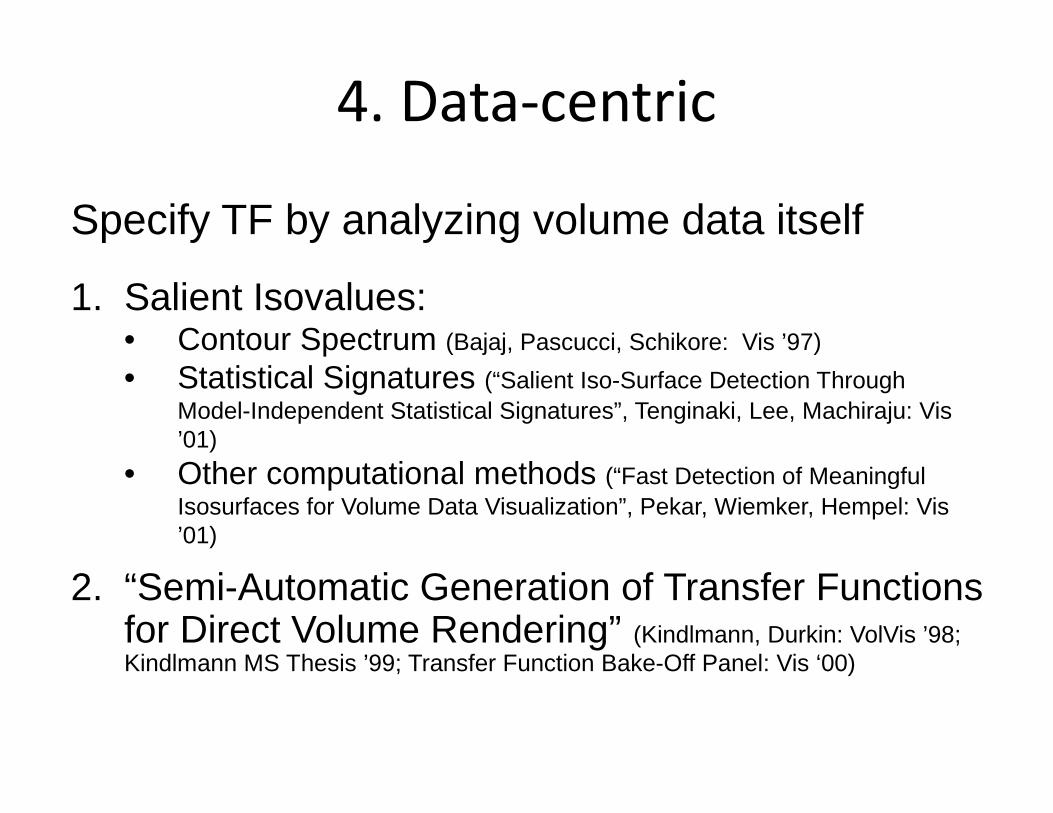
4. Data-centric
Specify TF by analyzing volume data itself
1. Salient Isovalues:• Contour Spectrum (Bajaj, Pascucci, Schikore: Vis ’97)
• Statistical Signatures (“Salient Iso-Surface Detection Through Model-Independent Statistical Signatures”, Tenginaki, Lee, Machiraju: Vis ’01)
• Other computational methods (“Fast Detection of Meaningful Isosurfaces for Volume Data Visualization”, Pekar, Wiemker, Hempel: Vis ’01)
2. “Semi-Automatic Generation of Transfer Functions for Direct Volume Rendering” (Kindlmann, Durkin: VolVis ’98; Kindlmann MS Thesis ’99; Transfer Function Bake-Off Panel: Vis ‘00)
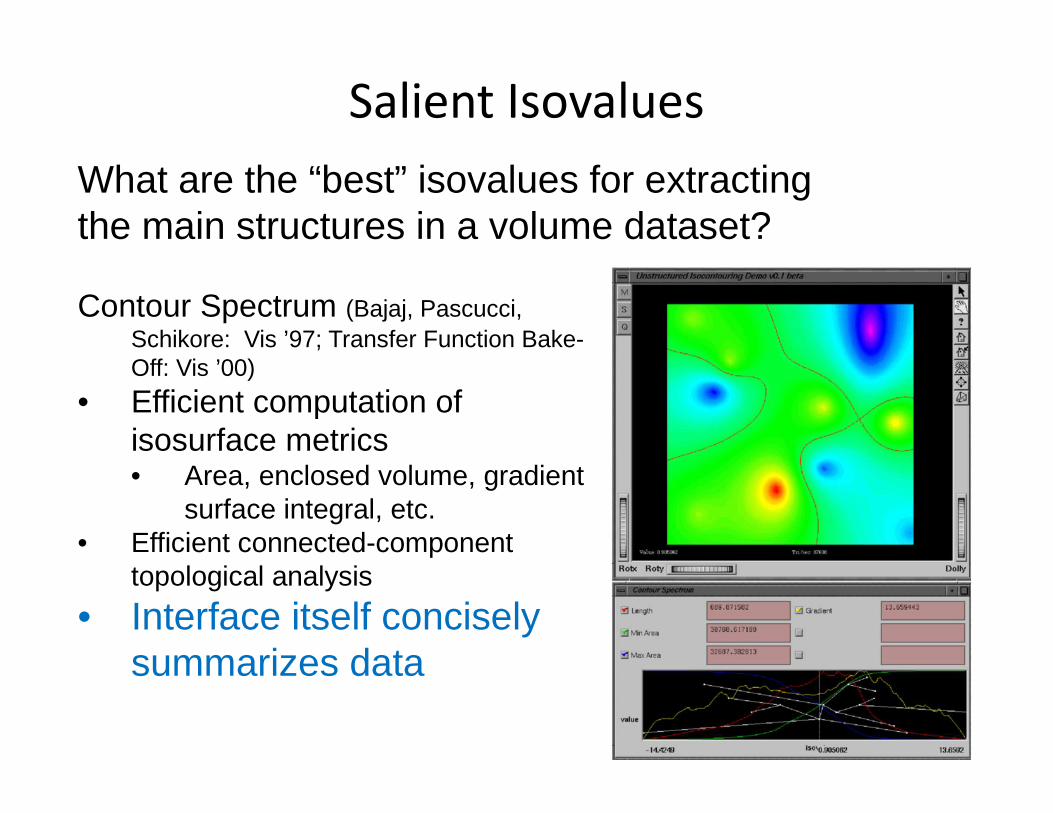
Salient Isovalues
What are the “best” isovalues for extractingthe main structures in a volume dataset?
Contour Spectrum (Bajaj, Pascucci, Schikore: Vis ’97; Transfer Function Bake-Off: Vis ’00)
• Efficient computation of isosurface metrics• Area, enclosed volume, gradient
surface integral, etc.• Efficient connected-component
topological analysis
• Interface itself concisely summarizes data
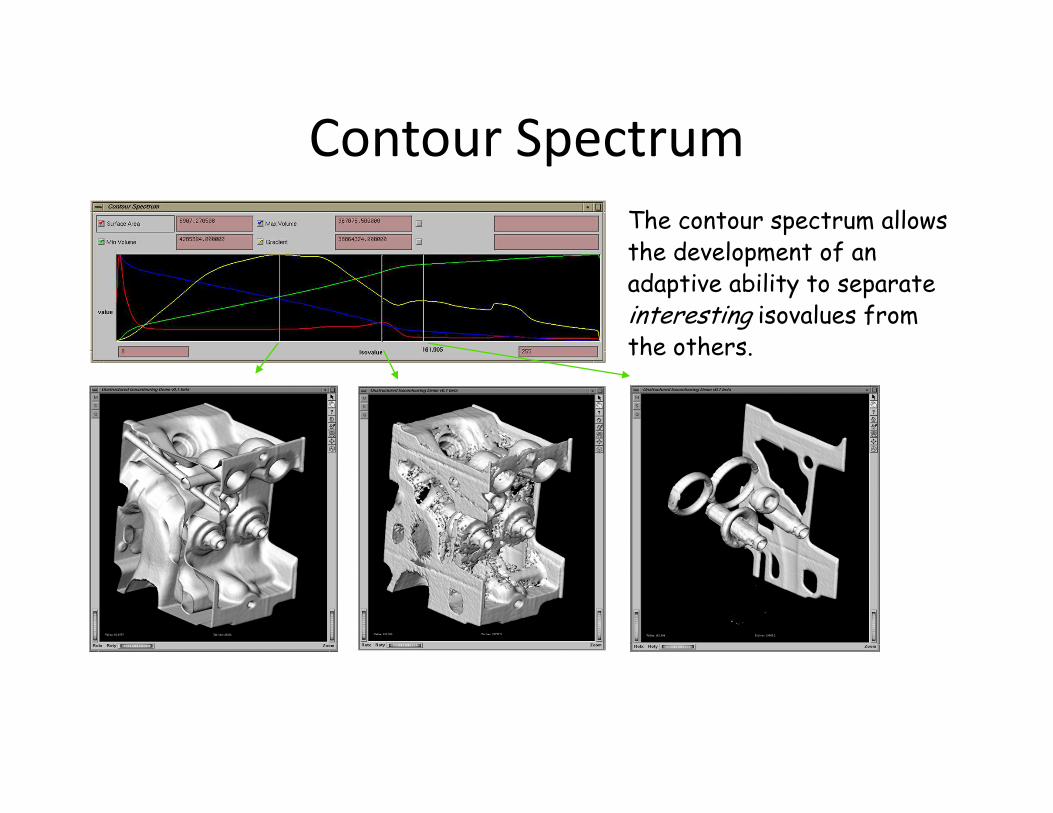
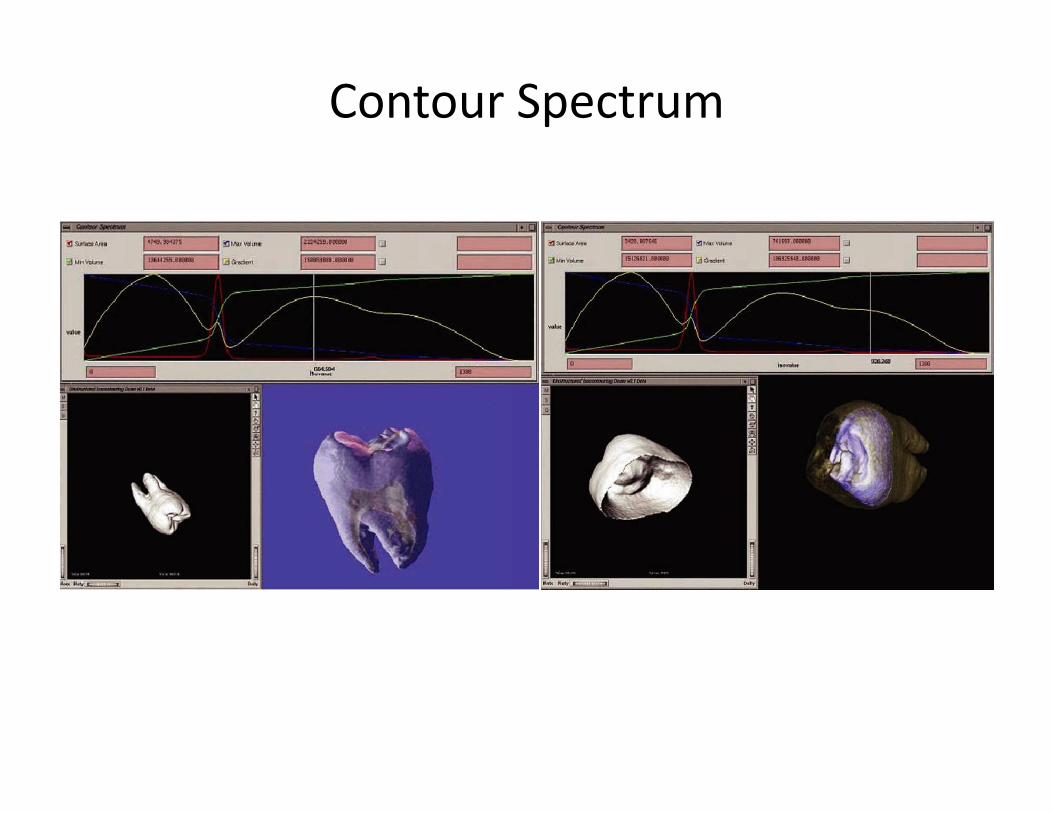
Contour Spectrum
The contour spectrum allows the development of an adaptive ability to separate interesting isovalues from the others.
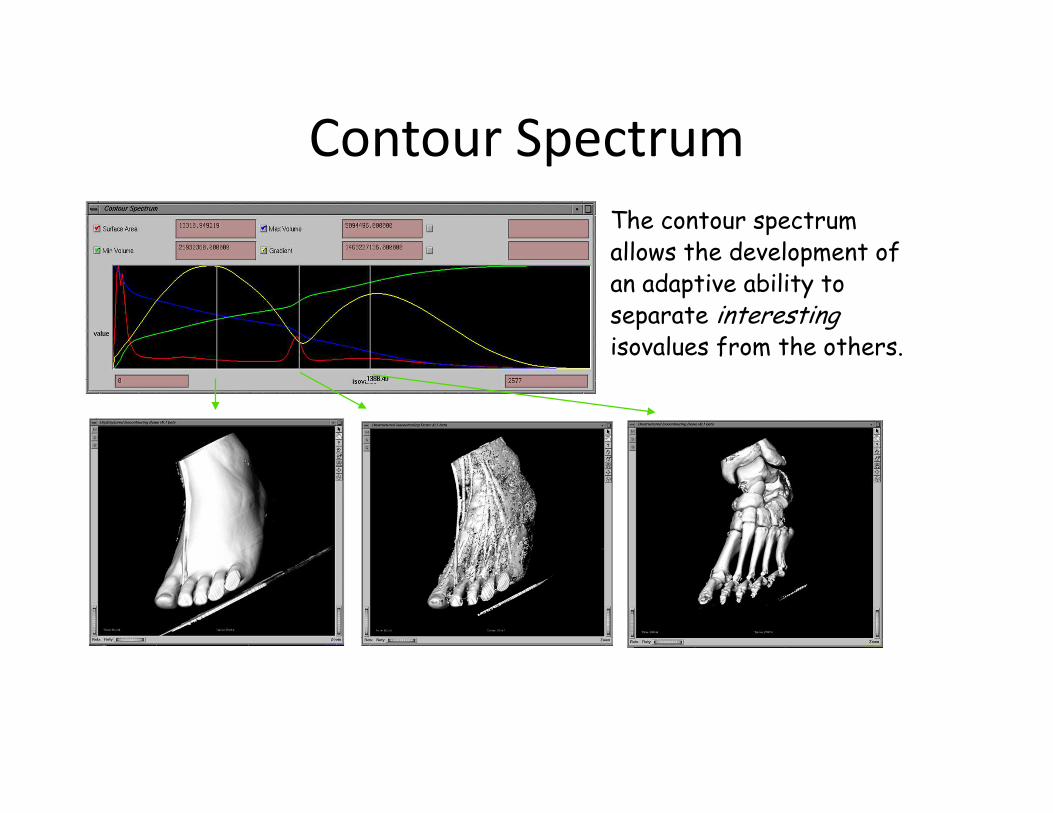
Contour Spectrum
The contour spectrum allows the development of an adaptive ability to separate interesting isovalues from the others.
Contour Spectrum
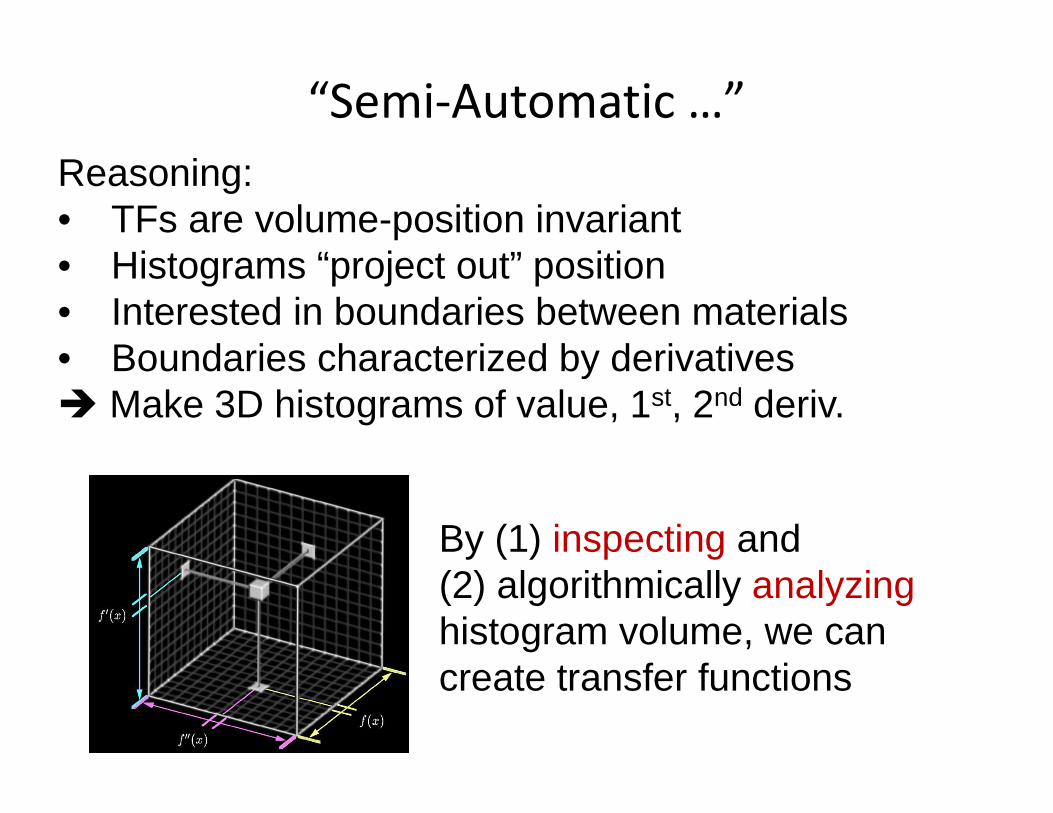
“Semi-Automatic …”
Reasoning:• TFs are volume-position invariant• Histograms “project out” position• Interested in boundaries between materials• Boundaries characterized by derivatives� Make 3D histograms of value, 1st, 2nd deriv.
By (1) inspecting and(2) algorithmically analyzinghistogram volume, we cancreate transfer functions
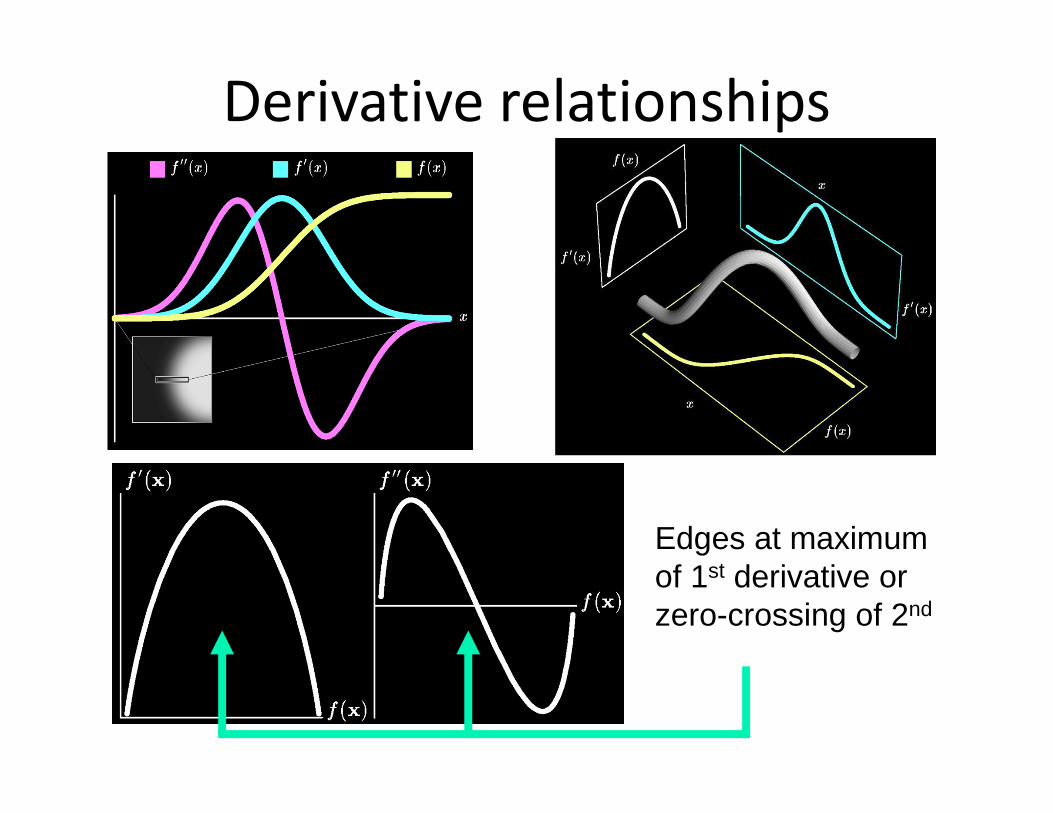
Derivative relationships
Edges at maximumof 1st derivative orzero-crossing of 2nd
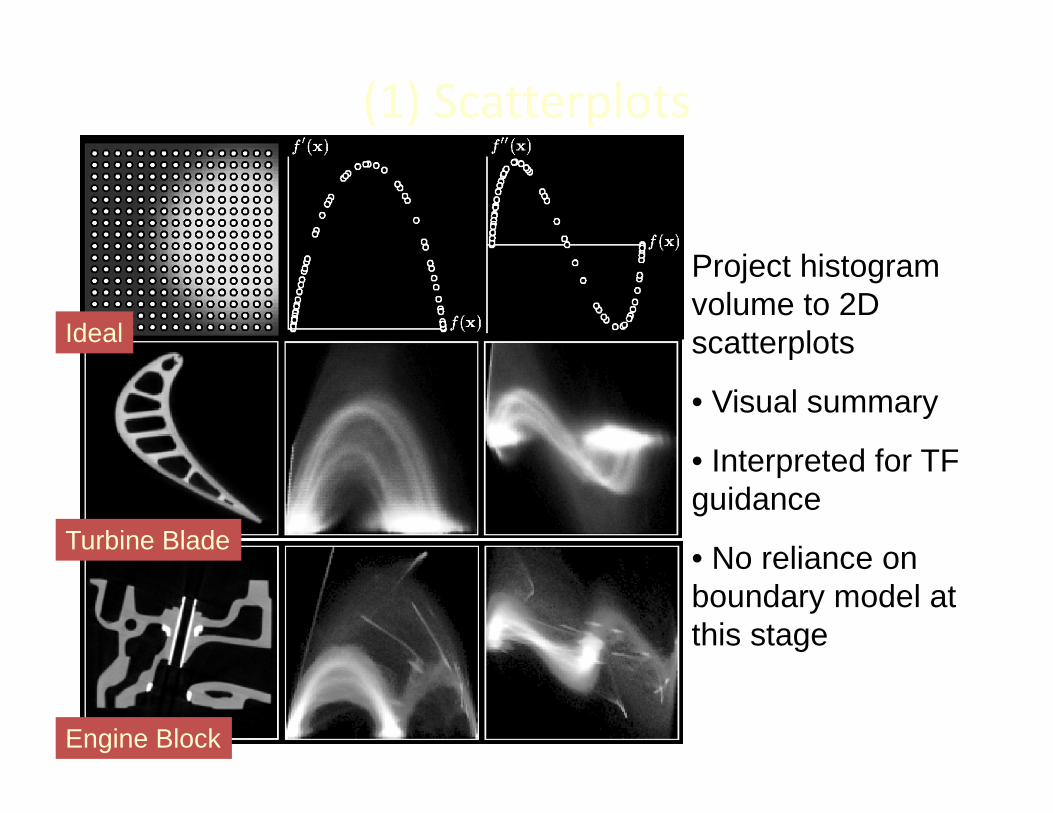
(1) Scatterplots
Ideal
Turbine Blade
Engine Block
Project histogram volume to 2D scatterplots
• Visual summary
• Interpreted for TF guidance
• No reliance on boundary model at this stage
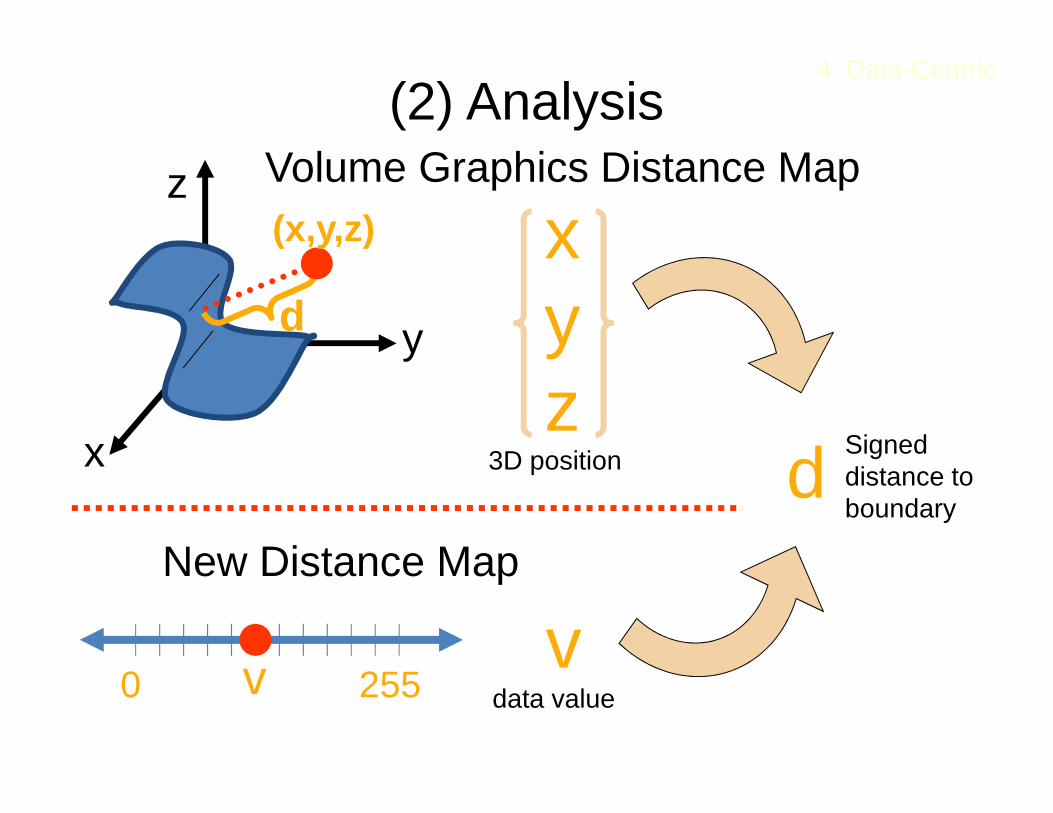
(2) Analysis
x
y
z Volume Graphics Distance Map
d
(x,y,z)
d
xyz
New Distance Map
0 255vv
4. Data-Centric
3D position
data value
Signeddistance toboundary
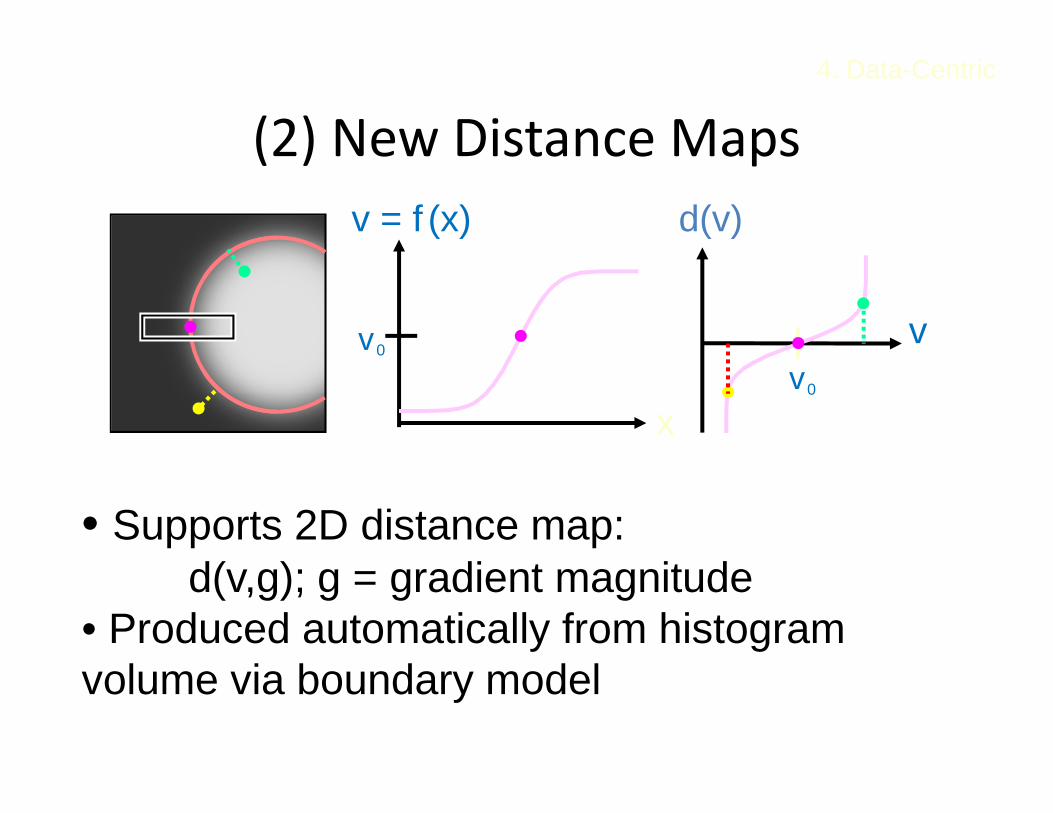
(2) New Distance Maps
d(v)
v
v = f (x)
x
v0
v0
• Supports 2D distance map:d(v,g); g = gradient magnitude
• Produced automatically from histogram volume via boundary model
4. Data-Centric
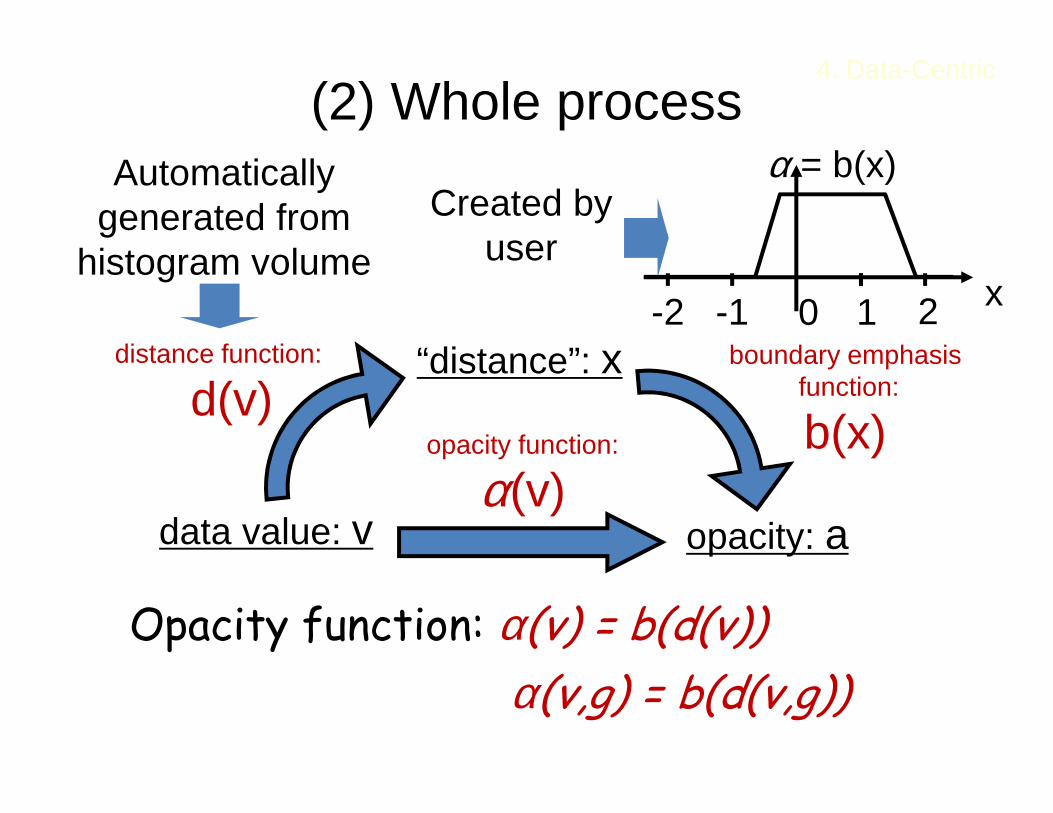
Opacity function: α(v) = b(d(v))
α(v,g) = b(d(v,g))
data value: v
“distance”: xdistance function:
d(v)
opacity: a
boundary emphasisfunction:
b(x)opacity function:
α(v)
Automaticallygenerated from
histogram volume
Created byuser
(2) Whole process
x
α = b(x)
-1-2 210
4. Data-Centric
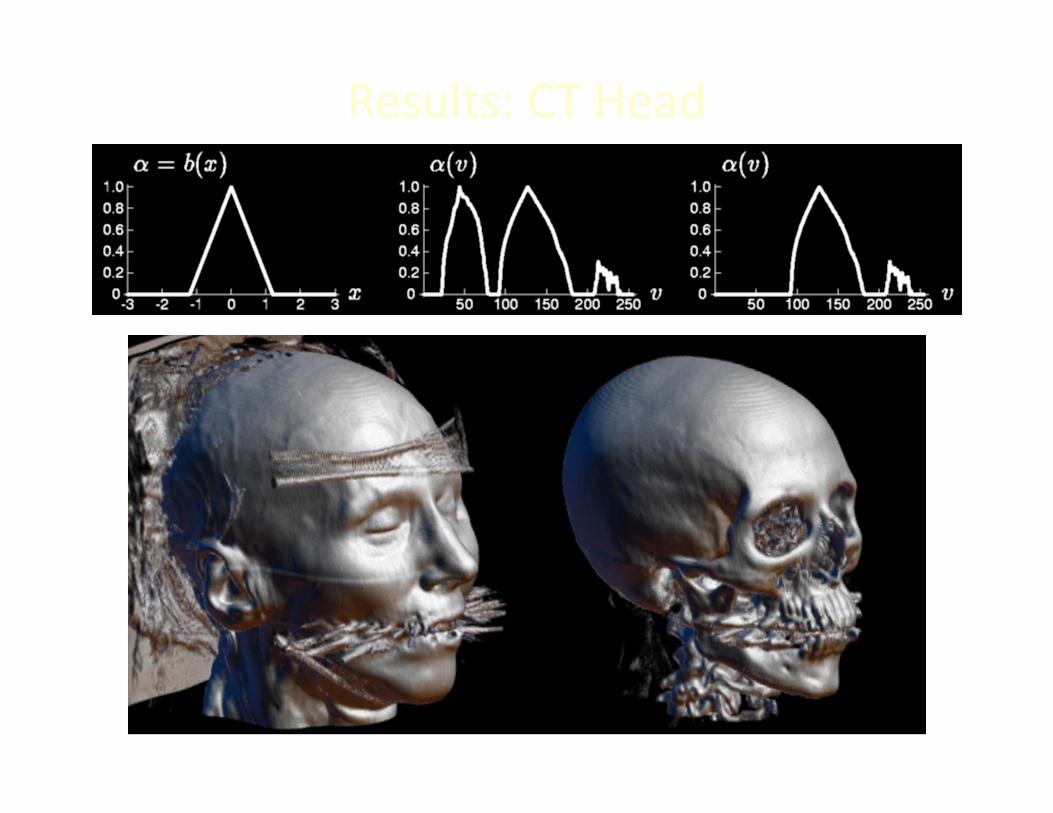
Results: CT Head
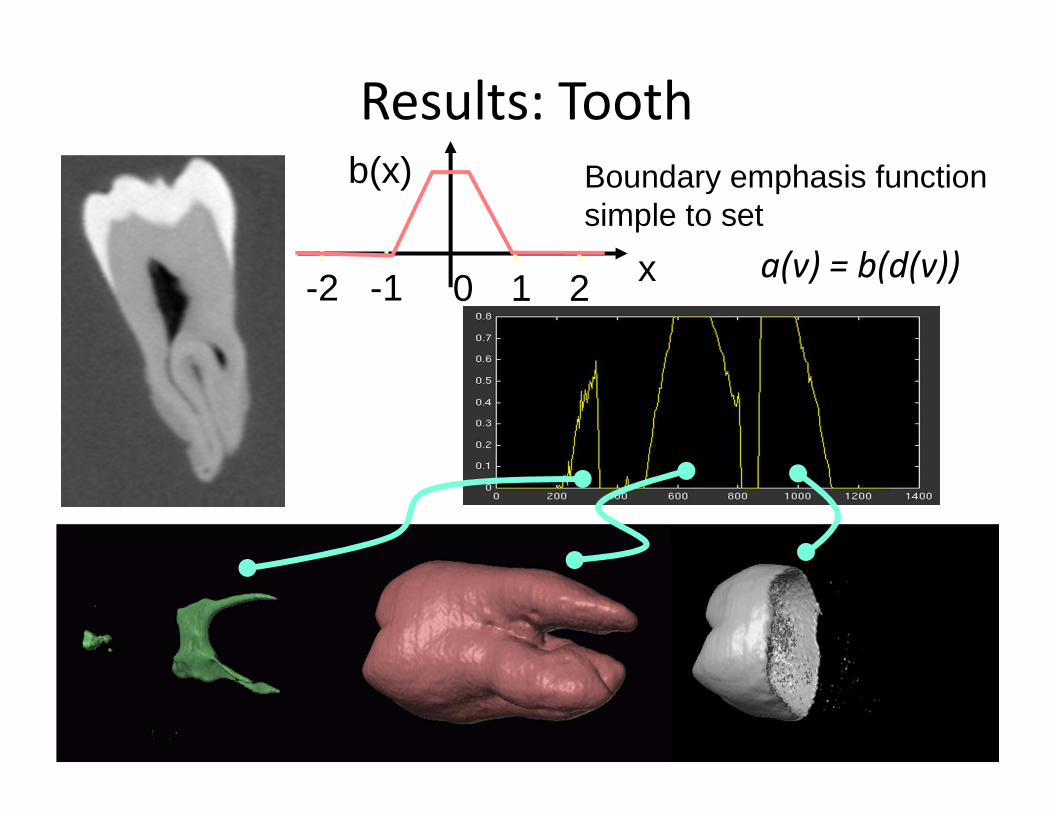
Results: Tooth
x
b(x)
-1-2 210
Boundary emphasis function simple to set
a(v) = b(d(v))
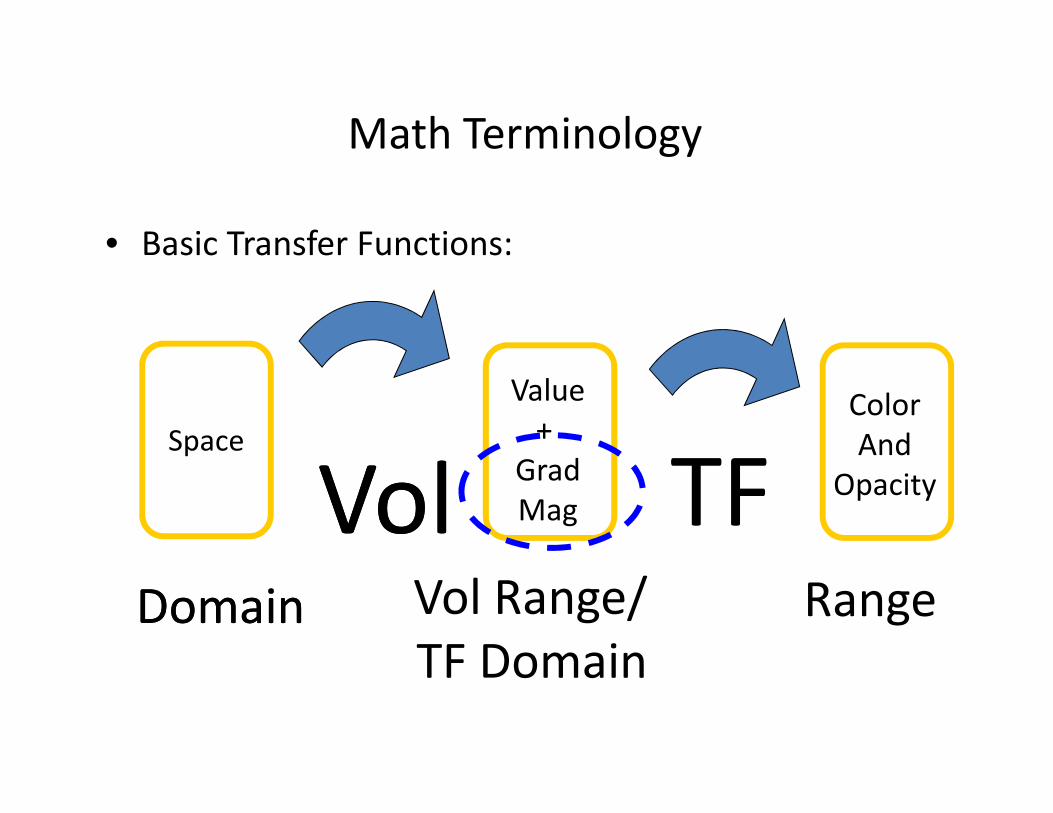
Vol Range/
TF Domain
Range
Value
+
Grad
Mag
Color
And
OpacityTF
Math Terminology
• Basic Transfer Functions:
Space
VolVolDomainDomain
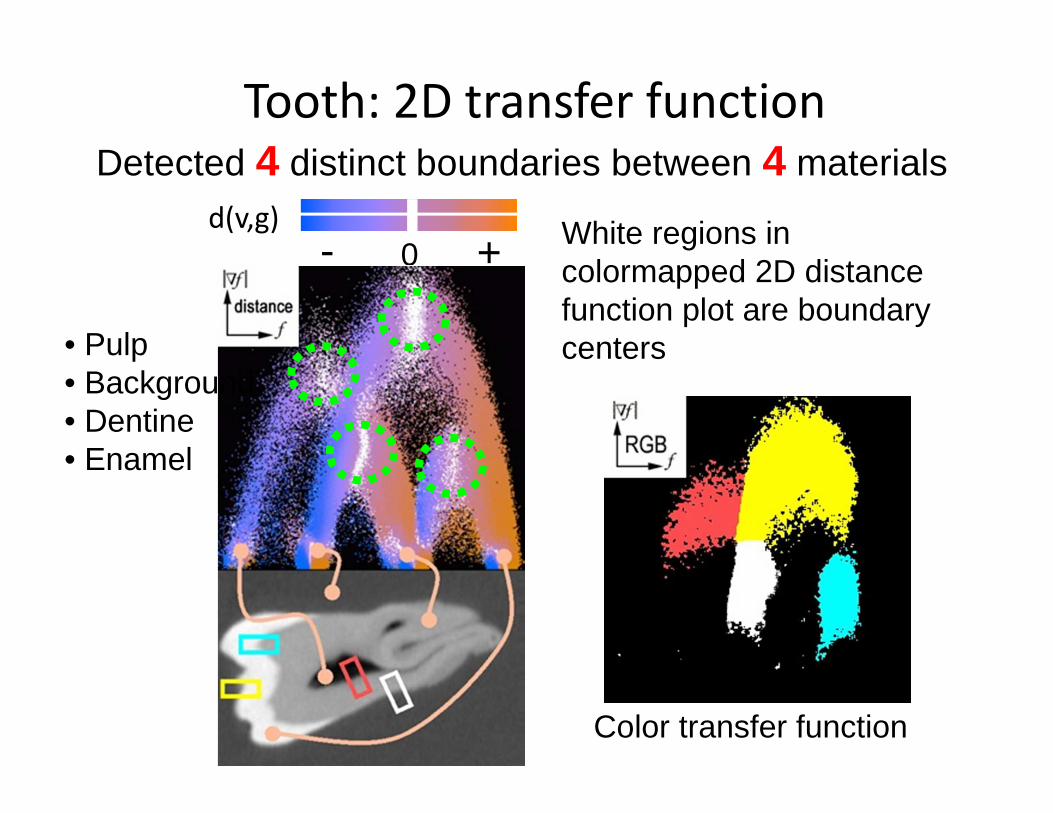
Tooth: 2D transfer functionDetected 4 distinct boundaries between 4 materials
0 +- White regions in colormapped 2D distance function plot are boundary centers
Color transfer function
• Pulp• Background• Dentine• Enamel
d(v,g)
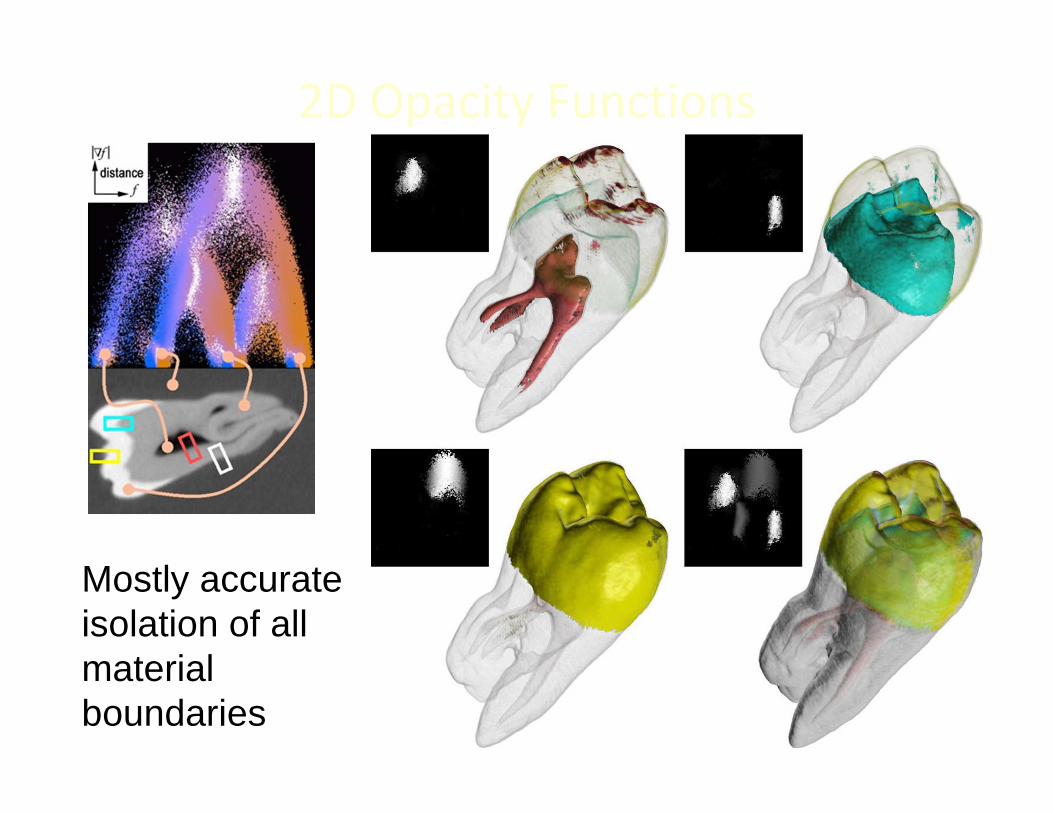
2D Opacity Functions
Mostly accurate isolation of all material boundaries
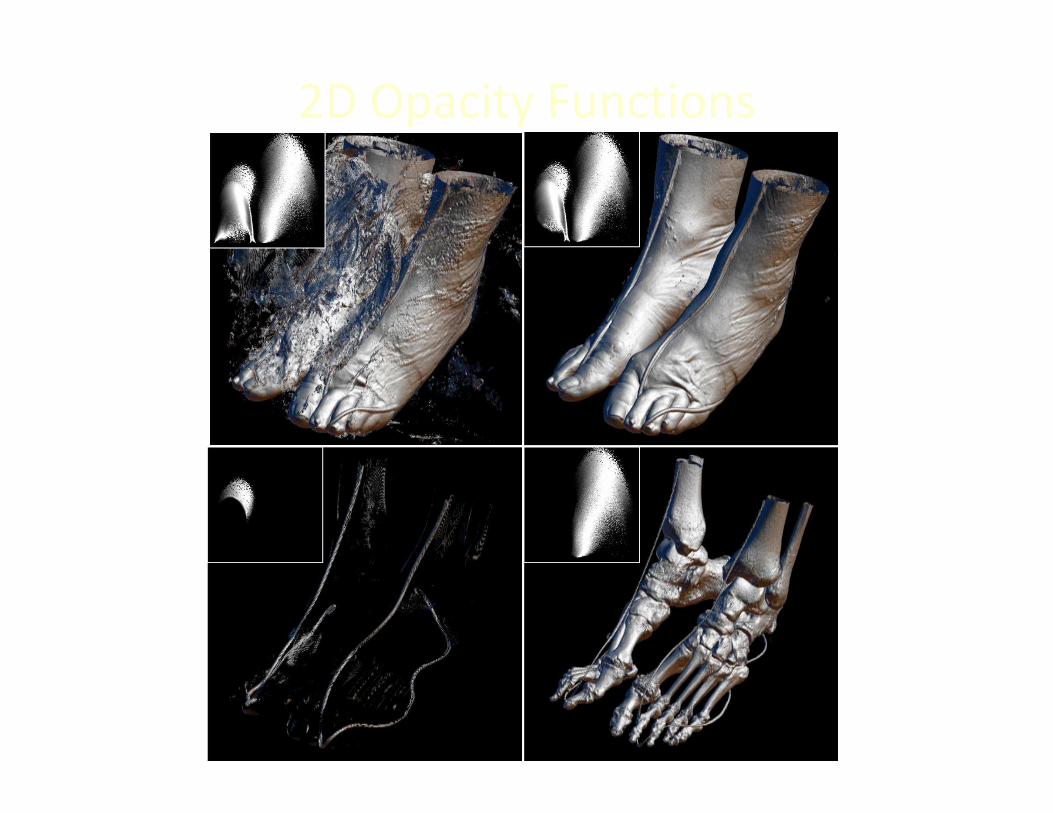
2D Opacity Functions
Organization
1. Trial and Error (manual)
2. Spatial Feature Detection
3. Image-Centric
4. Data-Centric
5. Others
Current Methods
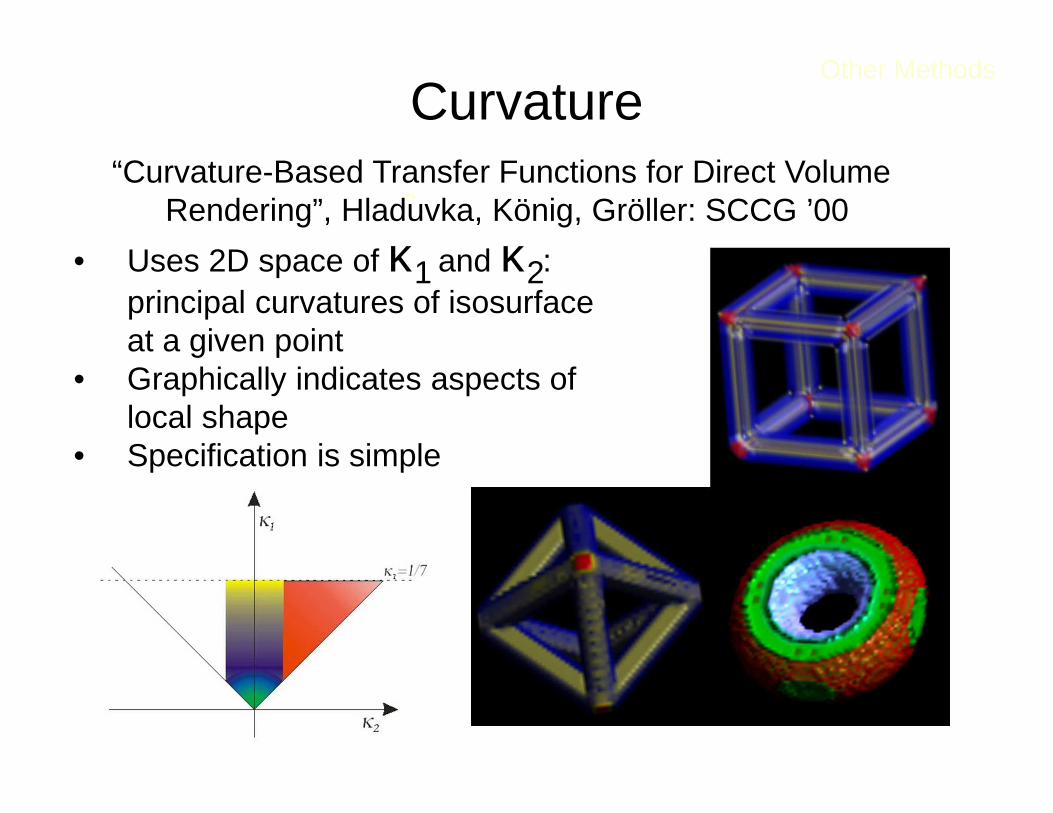
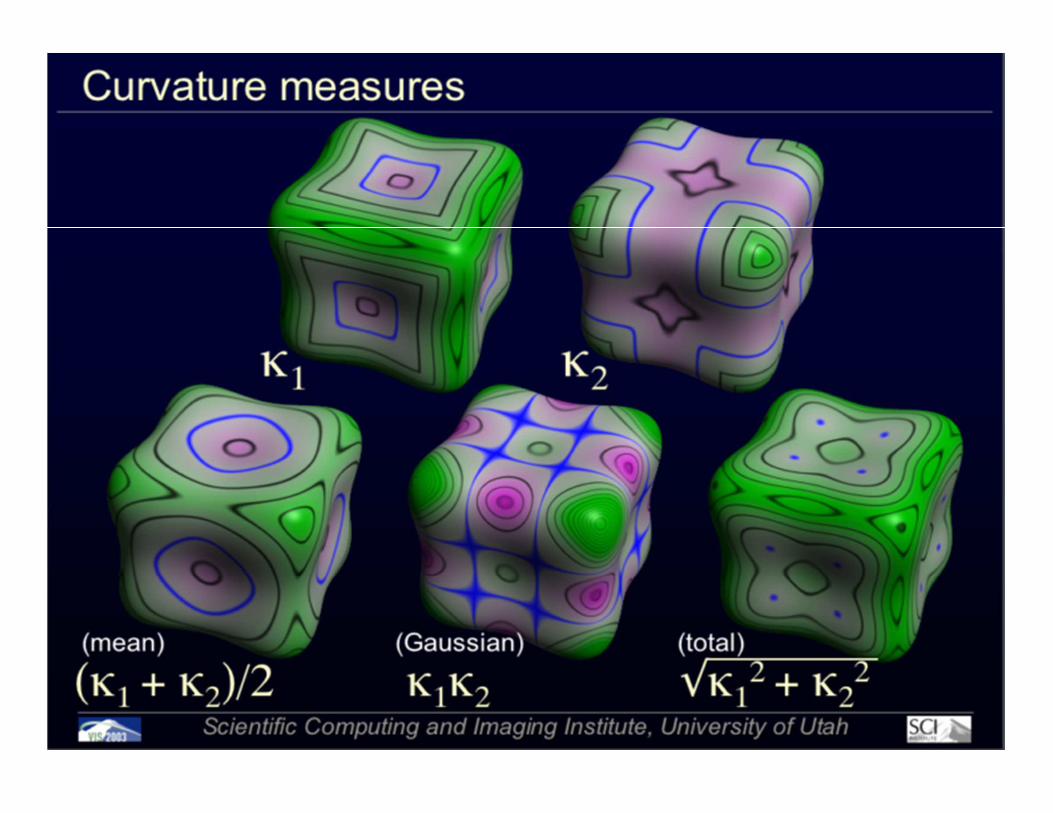
Curvature“Curvature-Based Transfer Functions for Direct Volume
Rendering”, Hladuvka, König, Gröller: SCCG ’00
Other Methods
• Uses 2D space of κ1 and κ2: principal curvatures of isosurface at a given point
• Graphically indicates aspects of local shape
• Specification is simple
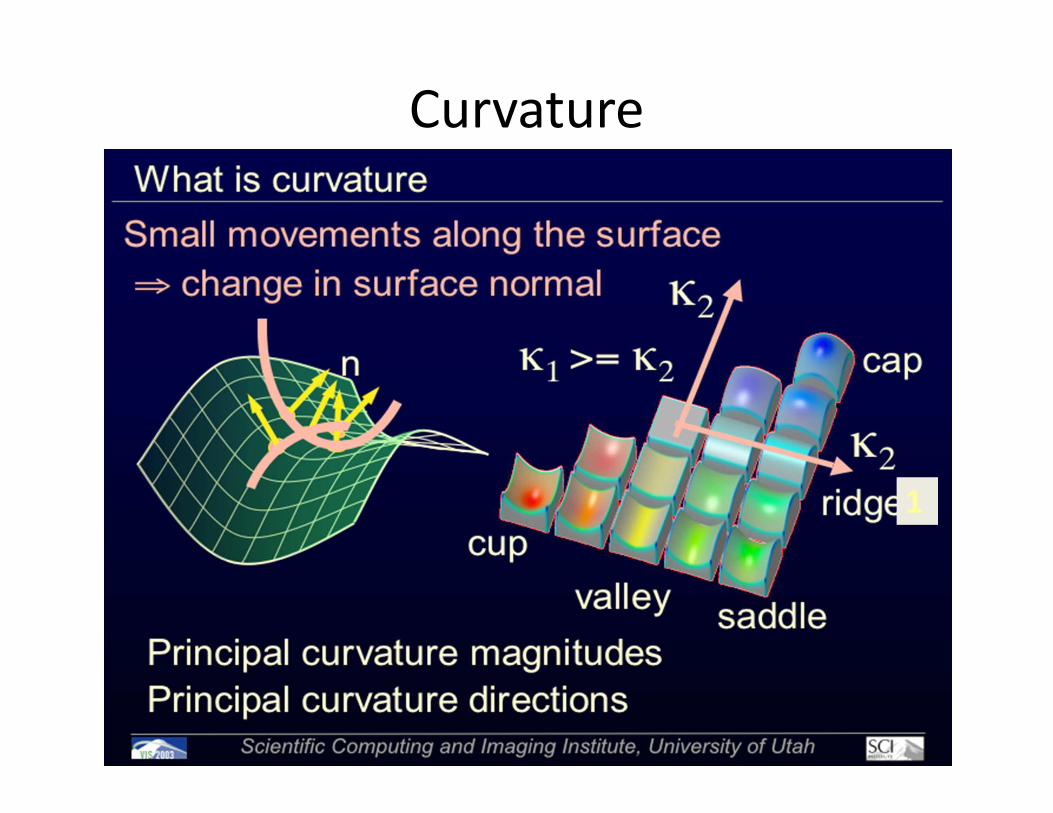
Curvature
11
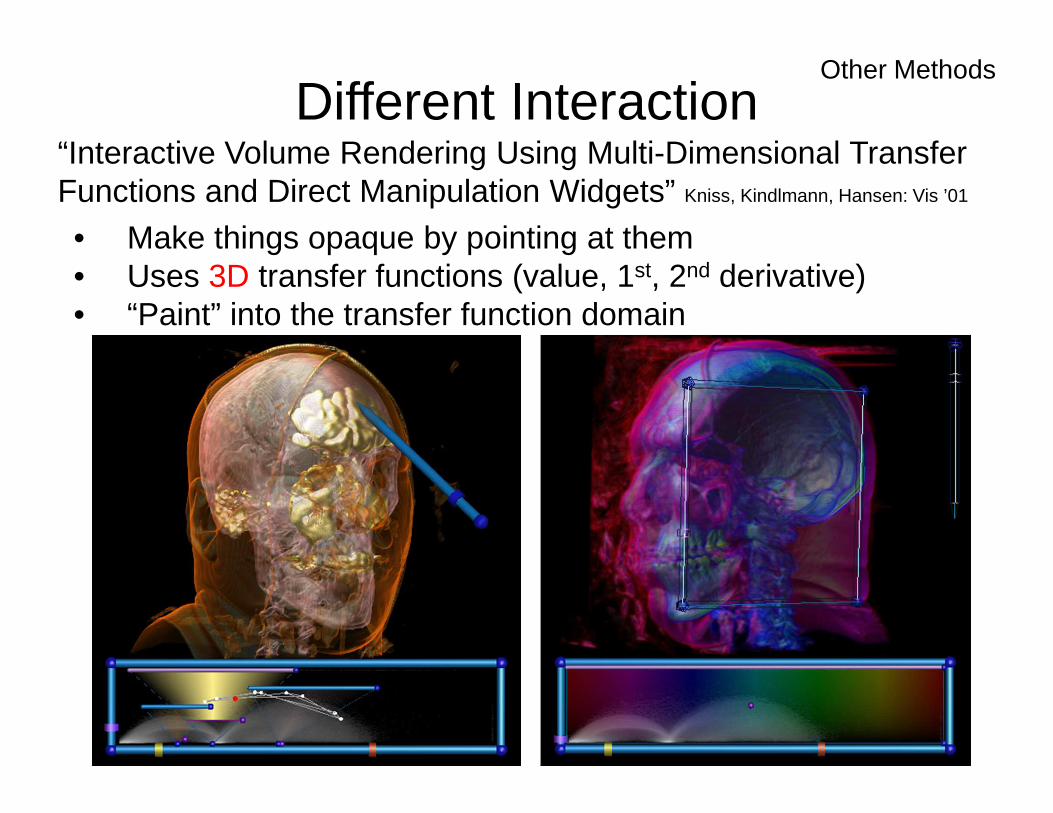
Different InteractionOther Methods
“Interactive Volume Rendering Using Multi-Dimensional Transfer Functions and Direct Manipulation Widgets” Kniss, Kindlmann, Hansen: Vis ’01
• Make things opaque by pointing at them• Uses 3D transfer functions (value, 1st, 2nd derivative)• “Paint” into the transfer function domain