TOXICOLOGICAL REVIEW OF TETRAHYDROFURAN€”TOXICOLOGICAL REVIEW OF TETRAHYDROFURAN ... GABA...
208
EPA/635/R-11/006F www.epa.gov/iris TOXICOLOGICAL REVIEW OF TETRAHYDROFURAN (CAS No. 109-99-9) In Support of Summary Information on the Integrated Risk Information System (IRIS) February 2012 U.S. Environmental Protection Agency Washington, DC
Transcript of TOXICOLOGICAL REVIEW OF TETRAHYDROFURAN€”TOXICOLOGICAL REVIEW OF TETRAHYDROFURAN ... GABA...
EPA/635/R-11/006F www.epa.gov/iris
TOXICOLOGICAL REVIEW
OF
TETRAHYDROFURAN
(CAS No. 109-99-9)
In Support of Summary Information on the Integrated Risk Information System (IRIS)
February 2012
U.S. Environmental Protection Agency Washington, DC

ii
DISCLAIMER
This document has been reviewed in accordance with U.S. Environmental Protection
Agency policy and approved for publication. Mention of trade names or commercial products
does not constitute endorsement or recommendation for use.
iii
CONTENTS—TOXICOLOGICAL REVIEW OF TETRAHYDROFURAN
(CAS No. 109-99-9)
LIST OF TABLES ......................................................................................................................... vi
LIST OF FIGURES ..................................................................................................................... viii
ABBREVIATIONS AND ACRONYMS ...................................................................................... ix
FOREWORD ................................................................................................................................. xi
AUTHORS, CONTRIBUTORS, AND REVIEWERS ................................................................ xii
1. INTRODUCTION .................................................................................................................. 1-1
2. CHEMICAL AND PHYSICAL INFORMATION ................................................................ 2-1
3. TOXICOKINETICS ............................................................................................................... 3-1 3.1. ABSORPTION .............................................................................................................. 3-1
3.1.1. Gastrointestinal Absorption ................................................................................ 3-1 3.1.2. Respiratory Tract Absorption ............................................................................. 3-4 3.1.3. Dermal Absorption ............................................................................................. 3-5
3.2. DISTRIBUTION ........................................................................................................... 3-5 3.3. METABOLISM ........................................................................................................... 3-10 3.4. ELIMINATION ........................................................................................................... 3-13 3.5. BIOACCUMULATION .............................................................................................. 3-15 3.6. PHYSIOLOGICALLY BASED PHARMACOKINETIC MODELS ......................... 3-16 3.7. SUMMARY ................................................................................................................. 3-17
4. HAZARD IDENTIFICATION ............................................................................................... 4-1 4.1. STUDIES IN HUMANS—EPIDEMIOLOGY, CASE REPORTS, CLINICAL
CONTROLS .................................................................................................................. 4-1 4.2. SUBCHRONIC AND CHRONIC STUDIES AND CANCER BIOASSAYS IN
ANIMALS—ORAL AND INHALATION ................................................................... 4-3 4.2.1. Subchronic Studies ............................................................................................. 4-3
4.2.1.1. Oral ...................................................................................................... 4-3 4.2.1.2. Inhalation ............................................................................................. 4-3
4.2.2. Chronic Studies and Cancer Bioassays ............................................................ 4-10 4.2.2.1. Oral .................................................................................................... 4-10 4.2.2.2. Inhalation ........................................................................................... 4-10
4.3. REPRODUCTIVE/DEVELOPMENTAL TOXICITY STUDIES—ORAL AND INHALATION ............................................................................................................ 4-13 4.3.1. Oral ................................................................................................................... 4-13 4.3.2. Inhalation .......................................................................................................... 4-23
4.4. OTHER DURATION- OR ENDPOINT-SPECIFIC STUDIES ................................. 4-25 4.5. MECHANISTIC DATA AND OTHER STUDIES ..................................................... 4-26 4.6. SYNTHESIS AND EVALUATION OF MAJOR NONCANCER EFFECTS ........... 4-26
4.6.1. Oral ................................................................................................................... 4-26 4.6.2. Inhalation .......................................................................................................... 4-29
iv
4.7. EVALUATION OF CARCINOGENICITY ................................................................ 4-38 4.7.1. Summary of Overall Weight of Evidence ........................................................ 4-38 4.7.2. Synthesis of Human, Animal, and Other Supporting Evidence ....................... 4-39 4.7.3. Mode of Action Information ............................................................................ 4-40
4.7.3.1. Kidney Tumors .................................................................................. 4-40 4.7.3.2. Liver Tumors ..................................................................................... 4-46
4.8. SUSCEPTIBLE POPULATIONS AND LIFE STAGES ............................................ 4-50 4.8.1. Possible Childhood Susceptibility .................................................................... 4-50 4.8.2. Possible Gender Differences ............................................................................ 4-51 4.8.3. Other ................................................................................................................. 4-52
5. DOSE-RESPONSE ASSESSMENTS .................................................................................... 5-15.1. ORAL REFERENCE DOSE (RfD) ............................................................................... 5-1
5.1.1. Choice of Principal Study and Candidate Critical Effects—with Rationale and Justification ........................................................................................................ 5-1
5.1.2. Methods of Analysis ........................................................................................... 5-3 5.1.3. RfD Derivation—Including Application of Uncertainty Factors (UFs) ............. 5-5 5.1.4. Previous RfD Assessment .................................................................................. 5-7
5.2. INHALATION REFERENCE CONCENTRATION (RfC) ......................................... 5-7 5.2.1. Choice of Principal Study and Critical Effect—with Rationale and
Justification ........................................................................................................ 5-7 5.2.2. Methods of Analysis ......................................................................................... 5-11
5.2.2.1. Calculation of HECs .......................................................................... 5-11 5.2.2.2. Dose-Response Modeling .................................................................. 5-12
5.2.3. RfC Derivation—Including Application of Uncertainty Factors (UFs) ........... 5-14 5.2.4. Previous RfC Assessment ................................................................................. 5-16
5.3. CANCER ASSESSMENT ........................................................................................... 5-16 5.3.1. Evaluation of Inhalation Cancer Data .............................................................. 5-16 5.3.2. Previous Cancer Assessment ............................................................................ 5-18
6. MAJOR CONCLUSIONS IN THE CHARACTERIZATION OF HAZARD AND DOSERESPONSE............................................................................................................................ 6-1 6.1. HUMAN HAZARD POTENTIAL ................................................................................ 6-1
6.1.1. Oral Noncancer ................................................................................................... 6-1 6.1.2. Inhalation Noncancer .......................................................................................... 6-2 6.1.3. Cancer ................................................................................................................. 6-4
7. REFERENCES ....................................................................................................................... R-1
APPENDIX A. SUMMARY OF EXTERNAL PEER REVIEW AND PUBLIC COMMENTS AND DISPOSITION ............................................................................................................ A-1
APPENDIX B. DOSE-RESPONSE MODELING .....................................................................B-1 B.1. NONCANCER ENDPOINTS ...................................................................................... B-1
B.1.1. Methods ............................................................................................................. B-1 B.1.2. Modeling Results for Noncancer Effects Resulting from Oral Exposure .........B-4 B.1.3. Modeling Results for Noncancer Effects Resulting from Inhalation
Exposure ..........................................................................................................B-18
v
B.2. DERIVATION OF AN INHALATION CANCER RISK ESTIMATE USING A LINEAR LOW-DOSE EXTRAPOLATION APPROACH FOR THF ...................... B-24 B.2.1. Rationale and Methods for Deriving a Cancer Risk Estimate .........................B-24 B.2.2. Modeling Results for Cancer Effects Resulting from Inhalation Exposure ....B-27 B.2.3. Details of Modeling Results for Cancer Effects ..............................................B-29
APPENDIX C. SUPPLEMENTAL INFORMATION ...............................................................C-1 C.1. OTHER DURATION- OR ENDPOINT-SPECIFIC STUDIES .................................. C-1
C.1.1. Acute Toxicity Studies .......................................................................................C-1 C.1.2. Short-term Studies .............................................................................................C-5 C.1.3. Neurotoxicity Studies ........................................................................................C-8
C.2. METABOLITE AND MECHANISTIC DATA AND OTHER STUDIES ............... C-10 C.2.1. Metabolite Studies ...........................................................................................C-10 C.2.2. Mechanistic Studies .........................................................................................C-13
C.2.2.1. Cytotoxicity ..................................................................................... C-13 C.2.2.2. CYP450 Activity, Cell Proliferation, and Apoptosis ....................... C-14 C.2.2.3. Initiation ........................................................................................... C-21 C.2.2.4. Inhibition of Gap Junctional Intercellular Communication ............. C-22
C.2.3. Noncancer Mode of Action Information .........................................................C-26
vi
LIST OF TABLES
Table 2-1. Chemical and physical properties of THF ................................................................. 2-1
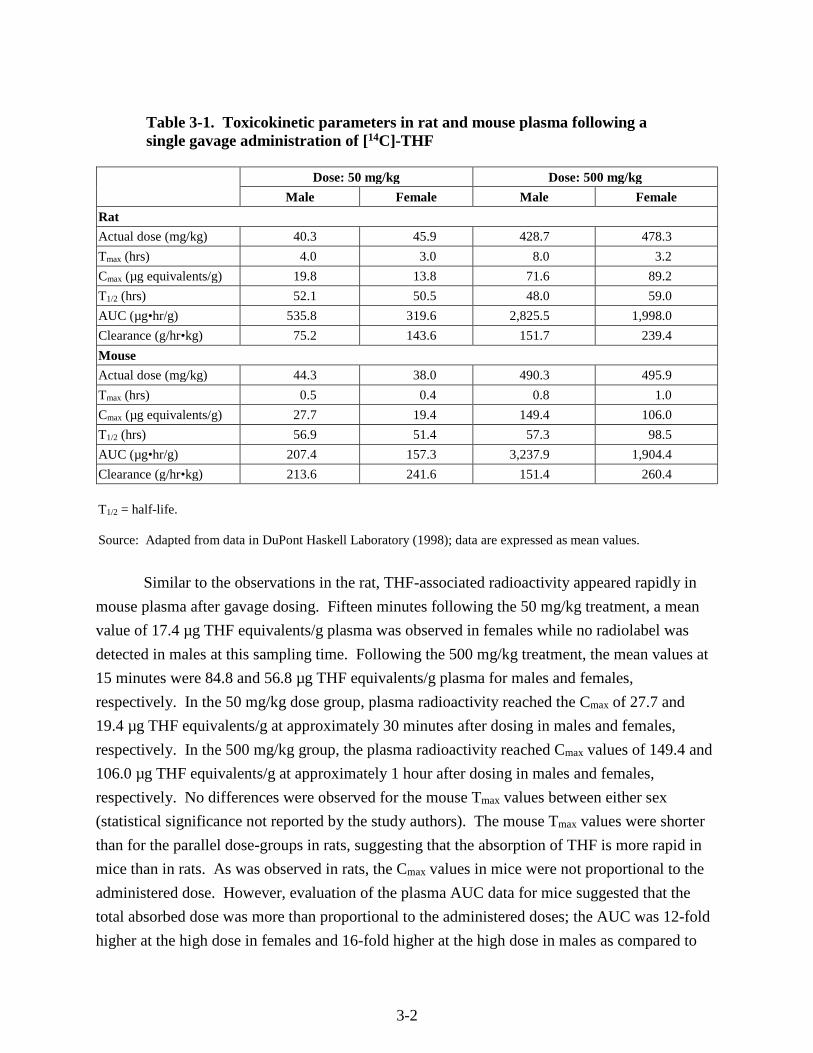
Table 3-1. Toxicokinetic parameters in rat and mouse plasma following a single gavage administration of [14C]-THF ........................................................................................................ 3-2
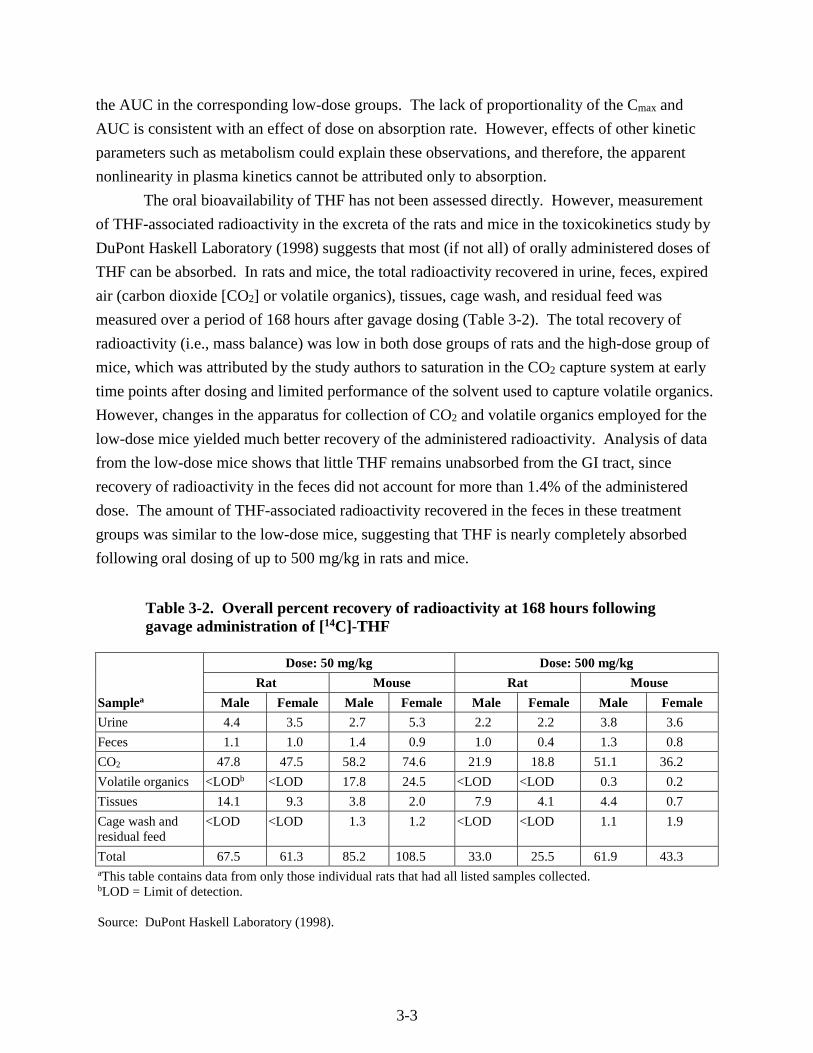
Table 3-2. Overall percent recovery of radioactivity at 168 hours following gavage administration of [14C]-THF ........................................................................................................ 3-3
Table 3-3. Radiolabel concentration in tissues of rats and mice at 168 hours following gavage administration of [14C]-THF ........................................................................................................ 3-7
Table 4-1. Changes in absolute and relative thymus and liver weights of F344/N rats and B6C3F1 mice following subchronic inhalation exposure to THF ................................................ 4-5
Table 4-2. Incidences of selected non-neoplastic lesions in B6C3F1 mice following subchronic inhalation exposure to THF ......................................................................................................... 4-7
Table 4-3. Renal findings in male F344/N rats exposed to THF for 2 years ............................ 4-11
Table 4-4. Liver findings in female B6C3F1 mice exposed to THF for 2 years ....................... 4-12
Table 4-5. Selected findings from one-generation reproductive toxicity study in Wistar rats exposed to THF in drinking water ............................................................................................. 4-14
Table 4-6. Selected findings from a two-generation reproductive toxicity study in Wistar rats exposed to THF in drinking water ............................................................................................. 4-16
Table 4-7. Correlations between decreased pup body weight gain and each of three independent variables: maternal water intake, THF intake, and number of pups in each litter ..................... 4-22
Table 4-8. Summary of effect levels observed in the two-generation reproduction study in Wistar rats exposed to THF in drinking water ........................................................................... 4-23
Table 4-9. Summary of effects observed in drinking water toxicity studies with THF ............ 4-28
Table 4-10. Summary of findings in developmental, subchronic, and chronic inhalation studies with THF .................................................................................................................................... 4-35
Table 5-1. F1 and F2 Pup body weight gain changes for RfD derivation from the two-generation reproductive toxicity study in Wistar rats exposed to THF in drinking water ............................. 5-4
Table 5-2. BMD modeling results for pup body weight gain in the Wistar rat two-generation reproductive toxicity study .......................................................................................................... 5-5
Table 5-3. Subchronic and chronic inhalation toxicity studies of THF in mice and rats (NTP, 1998): Exposure concentrations and examined non-neoplastic parameters ............................. 5-10
Table 5-4. Measures of liver toxicity in B6C3F1 male mice following subchronic inhalation exposure to THF ........................................................................................................................ 5-12
Table 5-5. BMC modeling results for noncancer liver effects in male mice resulting from subchronic inhalation exposure to THF ..................................................................................... 5-13
Table B-1. Dose-response modeling results for pup body weight gain in the Wistar rat two-generation reproductive toxicity study of orally administered THF ........................................... B-4
vii
Table B-2. Dose-response modeling results for noncancer effects resulting from subchronic inhalation exposure to THF ...................................................................................................... B-18
Table B-3. Incidences of neoplastic lesions of the livers of female B6C3F1 mice and kidneys of male F344/N rats exposed via inhalation to THF 6 hours/day, 5 days/week for 105 weeks (NTP, 1998) .............................................................................................................................. B-26
Table B-4. Cancer multistage modeling results for THF ......................................................... B-27
Table B-5. Summary of model selection and modeling results for best-fitting multistage models for cancer effects resulting from chronic inhalation exposure to THF reported by NTP (1998) ............................................................................................................................... B-29
Table C-1. Comparison of target organ toxicity for THF and its metabolites ......................... C-11
Table C-2. Comparative effects of single and multiple daily dosing of GHB ......................... C-13
Table C-3. Mode of action study findings in male F344 rat kidneys following exposure to THF by inhalation ..................................................................................................................... C-16
Table C-4. BrdU labeling and MI as a measure of cell proliferation in female B6C3F1 mouse livers following exposure to THF by inhalation ....................................................................... C-18
Table C-5. Summary of studies on the direct mutagenicity/genotoxicity of THF................... C-22
viii
LIST OF FIGURES
Figure 3-1. Possible metabolic pathways of THF. .................................................................... 3-11 Figure B-1. Pup body weight, F1 male rats. ............................................................................... B-5 Figure B-2. Pup body weight, F1 female rats. ............................................................................ B-8 Figure B-3. Pup body weight, F2 male rats. ............................................................................. B-11 Figure B-4. Pup body weight, F2 female rats. .......................................................................... B-15 Figure B-5. Liver centrilobular cytomegaly, male mice. .......................................................... B-19 Figure B-6. Absolute liver weight, male mice. ......................................................................... B-21 Figure B-7. Hepatocellular adenomas or carcinomas, female mice. ........................................ B-30 Figure B-8. Renal adenomas or carcinomas, male rats. ............................................................ B-32
ix
ABBREVIATIONS AND ACRONYMS
ABT 1-aminobenzotriazole ACGIH American Conference of Governmental Industrial Hygienists AIC Akaike Information Criterion ALT alanine aminotransferase AST aspartate aminotransferase ATH atypical tubule hyperplasia ATPase adenosine triphosphatase AUC area under the curve BASF Badische Anilin- und Sodafabrik BMC benchmark concentration BMCL 95% lower bound on the BMC BMD benchmark dose BMDL 95% lower bound on the BMD BMDS BMD software BMR benchmark response BPE benzo[a]pyrene-trans-7,8-dihydrodiol-9,10-epoxide BrdU 5-bromo-2-deoxyuridine BW body weight CASRN Chemical Abstracts Service Registry Number cDNA complementary DNA Cmax maximum plasma concentration following administration of a chemical CNS central nervous system CO2 carbon dioxide CPN chronic progressive nephropathy CYP450 cytochrome P450 dUTP deoxyuridine triphosphate EEG electroencephalogram EPA U.S. Environmental Protection Agency EROD ethoxyresorufin-O-deethylase FOB functional observational battery GABA γ-aminobutyric acid GBL γ-butyrolactoneGGT γ-glutamyl transferase GHB γ-hydroxybutyric acid GI gastrointestinal GJIC gap junctional intercellular communication HEC human equivalent concentration i.p. intraperitoneal IRIS Integrated Risk Information System IUR inhalation unit risk LA labeled area LC labeled cell LC50 median lethal concentration
x
LD50 median lethal dose LI labeling index LOAEL lowest-observed-adverse-effect level LOD limit of detection LOEL lowest-observed-effect level MI mitotic index MOA mode of action NADP+ nicotinamide adenine dinucleotide phosphate NADPH the reduced form of NADP+ NCI National Cancer Institute NIOSH National Institute for Occupational Safety and Health NOAEL no-observed-adverse-effect level NPH nitrophenol hydroxylase NRC National Research Council NSF National Sanitation Foundation NTP National Toxicology Program PBPK physiologically based pharmacokinetic PCNA proliferating cell nuclear antigen PI50 50% reduction of cell protein content PND postnatal day POD point of departure PON paraoxonase PROD pentoxyresorufin-O-depentylase PWG Pathology Working Group RBC red blood cell RfC reference concentration RfD reference dose RGDR regional gas dose ratio SD standard deviation SSA succinic semialdehyde T1/2 half-life THF tetrahydrofuran Tmax the time after administration of a chemical when the maximum plasma
concentration is reached; when the rate of absorption equals the rate of elimination
TUNEL terminal deoxynucleotidyl dUTP nick-end-labeling staining TWA time-weighted average UF uncertainty factor VOC volatile organic compound
xi
FOREWORD
The purpose of this Toxicological Review is to provide scientific support and rationale
for the hazard and dose-response assessment in IRIS pertaining to chronic exposure to
tetrahydrofuran. It is not intended to be a comprehensive treatise on the chemical or
toxicological nature of tetrahydrofuran.
The intent of Section 6, Major Conclusions in the Characterization of Hazard and Dose
Response, is to present the major conclusions reached in the derivation of the reference dose,
reference concentration and cancer assessment, where applicable, and to characterize the overall
confidence in the quantitative and qualitative aspects of hazard and dose response by addressing
the quality of data and related uncertainties. The discussion is intended to convey the limitations
of the assessment and to aid and guide the risk assessor in the ensuing steps of the risk
assessment process.
For other general information about this assessment or other questions relating to IRIS,
the reader is referred to EPA’s IRIS Hotline at (202) 566-1676 (phone), (202) 566-1749 (fax), or
[email protected] (email address).
xii
AUTHORS, CONTRIBUTORS, AND REVIEWERS
CHEMICAL MANAGER Ghazi A. Dannan, Ph.D. National Center for Environmental Assessment Office of Research and Development U.S. Environmental Protection Agency Washington, DC AUTHORS Ghazi A. Dannan, Ph.D. National Center for Environmental Assessment Office of Research and Development U.S. Environmental Protection Agency Washington, DC David Lai, Ph.D., DABT Office of Pollution Prevention and Toxics U.S. Environmental Protection Agency Washington, DC Elizabeth Margosches, Ph.D. Office of Pollution Prevention and Toxics U.S. Environmental Protection Agency Washington, DC Jamie B. Strong, Ph.D. National Center for Environmental Assessment Office of Research and Development U.S. Environmental Protection Agency Washington, DC CONTRIBUTORS Karen Hogan, M.S. National Center for Environmental Assessment Office of Research and Development U.S. Environmental Protection Agency Washington, DC John Fox, Ph.D. National Center for Environmental Assessment Office of Research and Development U.S. Environmental Protection Agency Washington, DC
xiii
Babasaheb Sonawane, Ph.D. National Center for Environmental Assessment Office of Research and Development U.S. Environmental Protection Agency Washington, DC U.S. EPA EXECUTIVE DIRECTION Vincent Cogliano, Ph.D. National Center for Environmental Assessment Office of Research and Development U.S. Environmental Protection Agency Washington, DC Lynn Flowers, Ph.D., DABT National Center for Environmental Assessment Office of Research and Development U.S. Environmental Protection Agency Washington, DC Samantha Jones, Ph.D. National Center for Environmental Assessment Office of Research and Development U.S. Environmental Protection Agency Washington, DC CONTRACTOR SUPPORT Andrew Maier, Ph.D., C.I.H. Joan Strawson, M.S., M.T.S.C., J.D. Andrea Wullenweber, M.S. Jay Zhao, Ph.D. Toxicology Excellence for Risk Assessment
REVIEWERS
This document was provided for review to EPA scientists, interagency reviewers from
other federal agencies and White House offices, and the public, and peer reviewed by
independent scientists external to EPA. A summary and EPA’s disposition of the comments
received from the independent external peer reviewers and from the public is included in
Appendix A.
INTERNAL EPA REVIEWERS Michael Beringer, M.S. Region 7 U.S. EPA
xiv
J. Michael Davis, Ph.D. National Center for Environmental Assessment Office of Research and Development U.S. EPA EXTERNAL PEER REVIEWERS
John Christopher, Ph.D. California Environmental Protection Agency George Corcoran, Ph.D. Wayne State University David William Gaylor, Ph.D. Gaylor and Associates, LLC Nancy Kerkvliet, Ph.D. Oregon State University Lisa Peterson, Ph.D. The Cancer Center, University of Minnesota Karl Rozman, M.D. (Chair) The University of Kansas Medical Center
1-1
1. INTRODUCTION
This document presents background information and justification for the Integrated Risk
Information System (IRIS) Summary of the hazard and dose-response assessment of
tetrahydrofuran (THF). IRIS Summaries may include oral reference dose (RfD) and inhalation
reference concentration (RfC) values for chronic and other exposure durations, and a
carcinogenicity assessment.
The RfD and RfC, if derived, provide quantitative information for use in risk assessments
for health effects known or assumed to be produced through a nonlinear (presumed threshold)
mode of action. The RfD (expressed in units of mg/kg-day) is defined as an estimate (with
uncertainty spanning perhaps an order of magnitude) of a daily exposure to the human
population (including sensitive subgroups) that is likely to be without an appreciable risk of
deleterious effects during a lifetime. The inhalation RfC (expressed in units of mg/m3) is
analogous to the oral RfD, but provides a continuous inhalation exposure estimate. The
inhalation RfC considers toxic effects for both the respiratory system (portal-of-entry) and for
effects peripheral to the respiratory system (extrarespiratory or systemic effects). Reference
values are generally derived for chronic exposures (up to a lifetime), but may also be derived for
acute (≤24 hours), short-term (>24 hours up to 30 days), and subchronic (>30 days up to 10% of
lifetime) exposure durations, all of which are derived based on an assumption of continuous
exposure throughout the duration specified. Unless specified otherwise, the RfD and RfC are
derived for chronic exposure duration.
The carcinogenicity assessment provides information on the carcinogenic hazard
potential of the substance in question and quantitative estimates of risk from oral and inhalation
exposure may be derived. The information includes a weight-of-evidence judgment of the
likelihood that the agent is a human carcinogen and the conditions under which the carcinogenic
effects may be expressed. Quantitative risk estimates may be derived from the application of a
low-dose extrapolation procedure. If derived, the oral slope factor is a plausible upper bound on
the estimate of risk per mg/kg-day of oral exposure. Similarly, an inhalation unit risk is a
plausible upper bound on the estimate of risk per µg/m3 air breathed.
Development of these hazard identification and dose-response assessments for
tetrahydrofuran has followed the general guidelines for risk assessment as set forth by the
National Research Council (NRC, 1983). EPA Guidelines and Risk Assessment Forum technical
panel reports that may have been used in the development of this assessment include the
following: Guidelines for the Health Risk Assessment of Chemical Mixtures (U.S. EPA, 1986a),
Guidelines for Mutagenicity Risk Assessment (U.S. EPA, 1986b), Recommendations for and
Documentation of Biological Values for Use in Risk Assessment (U.S. EPA, 1988), Guidelines
1-2
for Developmental Toxicity Risk Assessment (U.S. EPA, 1991a), Interim Policy for Particle Size
and Limit Concentration Issues in Inhalation Toxicity (U.S. EPA, 1994a), Methods for
Derivation of Inhalation Reference Concentrations and Application of Inhalation Dosimetry
(U.S. EPA, 1994b), Use of the Benchmark Dose Approach in Health Risk Assessment (U.S. EPA,
1995), Guidelines for Reproductive Toxicity Risk Assessment (U.S. EPA, 1996), Guidelines for
Neurotoxicity Risk Assessment (U.S. EPA, 1998), Science Policy Council Handbook: Risk
Characterization (U.S. EPA, 2000a), Benchmark Dose Technical Guidance Document (U.S.
EPA, 2000b), Supplementary Guidance for Conducting Health Risk Assessment of Chemical
Mixtures (U.S. EPA, 2000c), A Review of the Reference Dose and Reference Concentration
Processes (U.S. EPA, 2002), Guidelines for Carcinogen Risk Assessment (U.S. EPA, 2005a),
Supplemental Guidance for Assessing Susceptibility from Early-Life Exposure to Carcinogens
(U.S. EPA, 2005b), Science Policy Council Handbook: Peer Review (U.S. EPA, 2006a), and A
Framework for Assessing Health Risks of Environmental Exposures to Children (U.S. EPA,
2006b).
The literature search strategy employed for tetrahydrofuran was based on the chemical
name, Chemical Abstracts Service Registry Number (CASRN), and multiple common
synonyms. Any pertinent scientific information submitted by the public to the IRIS Submission
Desk was also considered in the development of this document. Primary, peer-reviewed
literature identified through December 2010 was included where that literature was determined
to be critical to the assessment. The relevant literature included publications on tetrahydrofuran
that were identified through Toxicology Literature Online (TOXLINE), PubMed, the Toxic
Substance Control Act Test Submission Database (TSCATS), the Registry of Toxic Effects of
Chemical Substances (RTECS), the Chemical Carcinogenesis Research Information System
(CCRIS), the Developmental and Reproductive Toxicology/Environmental Teratology
Information Center (DART/ETIC), the Hazardous Substances Data Bank (HSDB), the Genetic
Toxicology Data Bank (GENE-TOX), Chemical abstracts, and Current Contents. Other peer-
reviewed information, including health assessments developed by other organizations, review
articles, and independent analyses of the health effects data were retrieved and may be included
in the assessment where appropriate. It should be noted that references have been added to the
Toxicological Review after the external peer review in response to public comments and for the
sake of completeness. The addition of these references has not changed the overall qualitative
and quantitative conclusions. See Section 7 for a list of the references added after peer review.
2-1
2. CHEMICAL AND PHYSICAL INFORMATION
Tetrahydrofuran (THF) is a synthesized organic compound that is not found in the natural
environment (ACGIH, 2001). It is a colorless, volatile liquid with an ethereal or acetone-like
smell and is miscible in water and most organic solvents. Table 2-1 summarizes the physical and
chemical properties of THF. THF is highly flammable and upon thermal decomposition may
form carbon monoxide and carbon dioxide. Under certain conditions, such as prolonged storage
in contact with air, THF can decompose into explosive peroxides.
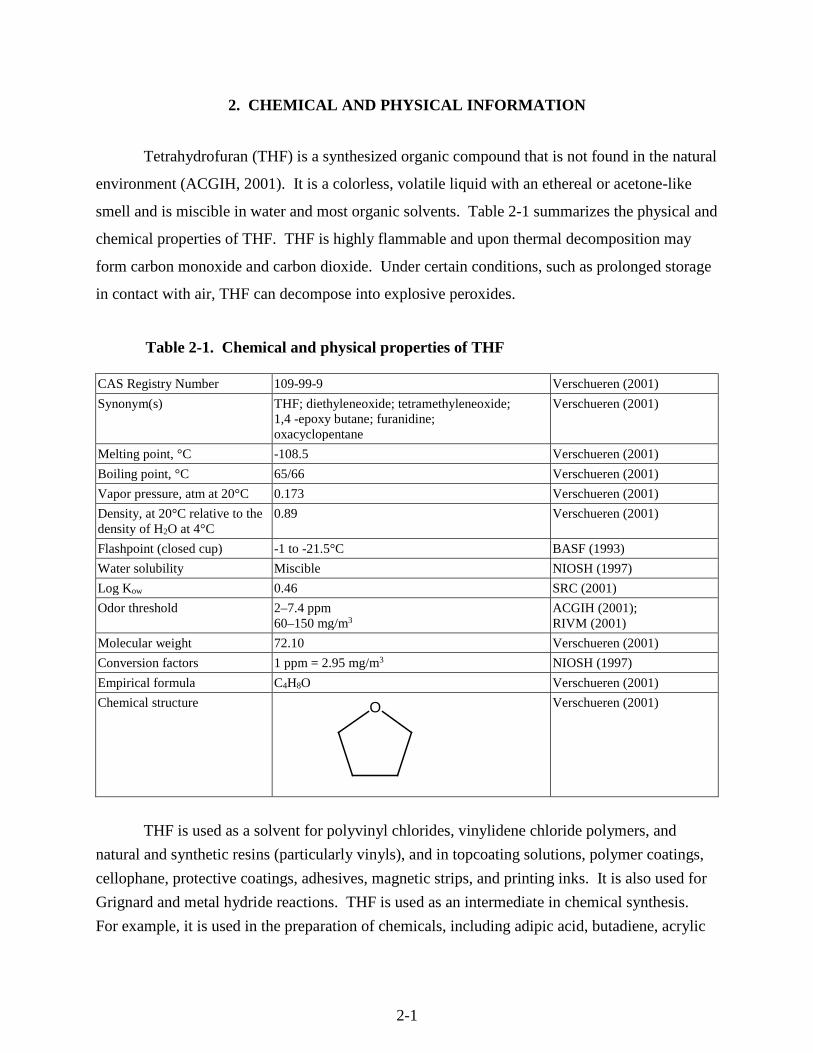
Table 2-1. Chemical and physical properties of THF
CAS Registry Number 109-99-9 Verschueren (2001)
Synonym(s) THF; diethyleneoxide; tetramethyleneoxide; 1,4 -epoxy butane; furanidine; oxacyclopentane
Verschueren (2001)
Melting point, °C -108.5 Verschueren (2001)
Boiling point, °C 65/66 Verschueren (2001)
Vapor pressure, atm at 20°C 0.173 Verschueren (2001)
Density, at 20°C relative to the density of H2O at 4°C
0.89 Verschueren (2001)
Flashpoint (closed cup) -1 to -21.5°C BASF (1993)
Water solubility Miscible NIOSH (1997)
Log Kow 0.46 SRC (2001)
Odor threshold 2–7.4 ppm 60–150 mg/m3
ACGIH (2001); RIVM (2001)
Molecular weight 72.10 Verschueren (2001)
Conversion factors 1 ppm = 2.95 mg/m3 NIOSH (1997)
Empirical formula C4H8O Verschueren (2001)
Chemical structure
Verschueren (2001)
THF is used as a solvent for polyvinyl chlorides, vinylidene chloride polymers, and
natural and synthetic resins (particularly vinyls), and in topcoating solutions, polymer coatings,
cellophane, protective coatings, adhesives, magnetic strips, and printing inks. It is also used for
Grignard and metal hydride reactions. THF is used as an intermediate in chemical synthesis.
For example, it is used in the preparation of chemicals, including adipic acid, butadiene, acrylic
O
2-2
acid, butyrolactone, succinic acid, 1,4-butanediol diacetate, motor fuels, vitamins, hormones,
pharmaceuticals, synthetic perfumes, organometallic compounds, and insecticides. It is also
used in the manufacture of polytetramethylene ether glycol, polyurethane elastomers, and elastic
polymers. THF can be used in the fabrication of materials for food packaging, transport, and
storage. When THF is used in food processing, it can be an indirect food additive (National
Toxicology Program [NTP], 1998).
Potential exposures to humans result from anthropogenic sources, primarily from
occupational exposures related to THF’s use as a solvent for resins, adhesives, printers’ ink, and
coatings. Exposure to THF is primarily through inhalation or dermal absorption in the
workplace. Nonoccupational exposure is uncommon, but may occur via inhalation and oral
routes from contamination of the environment (air and water) (NTP, 1998).
3-1
3. TOXICOKINETICS
3.1. ABSORPTION
3.1.1. Gastrointestinal Absorption
No information on THF absorption from the human gastrointestinal (GI) tract is
available. However, blood and tissue concentration data from a toxicokinetic study in rats and
mice conducted by DuPont Haskell Laboratory (1998) have demonstrated that THF is readily
absorbed from the GI tract. In this study, single gavage doses of approximately 50 or 500 mg/kg
[14C]-THF dissolved in water were administered to male and female F344 rats and B6C3F1 mice,
and the level of THF-associated radioactivity in plasma was monitored for up to 168 hours. The
mean values of selected toxicokinetic parameters for plasma identified in this study are presented
in Table 3-1.
In both rats and mice, radioactivity appeared in the plasma soon after the THF treatment,
demonstrating the rapid absorption of THF from the GI tract. In rats, detectable levels of
radioactivity were present in the plasma as early as 15 minutes after dosing (the earliest time
point measured). Maximum plasma concentrations were reached after approximately 4 hours in
the low-dose rats and after 4–8 hours in the high-dose rats. In the low-dose group, the plasma
concentration reached a maximum (Cmax) of 19.8 µg THF equivalents/g in males at 4 hours and
13.8 µg THF equivalents/g in females at 3 hours. In the high-dose group, the Cmax was 71.6 µg
THF equivalents/g plasma in males at 8.0 hours and 89.2 µg THF equivalents/g plasma in
females at 3.2 hours. The Tmax (the time after administration of a chemical when the maximum
plasma concentration is reached; when the rate of absorption equals the rate of elimination) in
females was highly variable. Maximum plasma concentrations were not proportional to the
administered dose, since Cmax values differed by approximately fourfold for males and sevenfold
for females between dose groups, while the administered dose differed by 10-fold.
A similar evaluation of the plasma area under the curve (AUC) data revealed the same
pattern of nonproportionality with dose. This phenomenon could reflect the saturability of
absorption processes at high doses. Also, independent of absorption, dose-dependent changes in
first-pass metabolism could possibly explain this result. Since GI tract absorption rates have not
been measured directly, the data are not adequate to attribute the nonlinearity in maximum
plasma concentrations or AUCs to absorption kinetics. As the values of many of the kinetic
parameters are highly variable (Table 3-1), the study authors (DuPont Haskell Laboratory, 1998)
indicated that there were no gender differences for any of the kinetic parameters in the rat
(statistical significance not reported by the study authors).
3-2
Table 3-1. Toxicokinetic parameters in rat and mouse plasma following a single gavage administration of [14C]-THF
Dose: 50 mg/kg Dose: 500 mg/kg
Male Female Male Female
Rat
Actual dose (mg/kg) 40.3 45.9 428.7 478.3
Tmax (hrs) 4.0 3.0 8.0 3.2
Cmax (µg equivalents/g) 19.8 13.8 71.6 89.2
T1/2 (hrs) 52.1 50.5 48.0 59.0
AUC (µg•hr/g) 535.8 319.6 2,825.5 1,998.0
Clearance (g/hr•kg) 75.2 143.6 151.7 239.4
Mouse
Actual dose (mg/kg) 44.3 38.0 490.3 495.9
Tmax (hrs) 0.5 0.4 0.8 1.0
Cmax (µg equivalents/g) 27.7 19.4 149.4 106.0
T1/2 (hrs) 56.9 51.4 57.3 98.5
AUC (µg•hr/g) 207.4 157.3 3,237.9 1,904.4
Clearance (g/hr•kg) 213.6 241.6 151.4 260.4
T1/2 = half-life.
Source: Adapted from data in DuPont Haskell Laboratory (1998); data are expressed as mean values.
Similar to the observations in the rat, THF-associated radioactivity appeared rapidly in
mouse plasma after gavage dosing. Fifteen minutes following the 50 mg/kg treatment, a mean
value of 17.4 µg THF equivalents/g plasma was observed in females while no radiolabel was
detected in males at this sampling time. Following the 500 mg/kg treatment, the mean values at
15 minutes were 84.8 and 56.8 µg THF equivalents/g plasma for males and females,
respectively. In the 50 mg/kg dose group, plasma radioactivity reached the Cmax of 27.7 and
19.4 µg THF equivalents/g at approximately 30 minutes after dosing in males and females,
respectively. In the 500 mg/kg group, the plasma radioactivity reached Cmax values of 149.4 and
106.0 µg THF equivalents/g at approximately 1 hour after dosing in males and females,
respectively. No differences were observed for the mouse Tmax values between either sex
(statistical significance not reported by the study authors). The mouse Tmax values were shorter
than for the parallel dose-groups in rats, suggesting that the absorption of THF is more rapid in
mice than in rats. As was observed in rats, the Cmax values in mice were not proportional to the
administered dose. However, evaluation of the plasma AUC data for mice suggested that the
total absorbed dose was more than proportional to the administered doses; the AUC was 12-fold
higher at the high dose in females and 16-fold higher at the high dose in males as compared to
3-3
the AUC in the corresponding low-dose groups. The lack of proportionality of the Cmax and
AUC is consistent with an effect of dose on absorption rate. However, effects of other kinetic
parameters such as metabolism could explain these observations, and therefore, the apparent
nonlinearity in plasma kinetics cannot be attributed only to absorption.
The oral bioavailability of THF has not been assessed directly. However, measurement
of THF-associated radioactivity in the excreta of the rats and mice in the toxicokinetics study by
DuPont Haskell Laboratory (1998) suggests that most (if not all) of orally administered doses of
THF can be absorbed. In rats and mice, the total radioactivity recovered in urine, feces, expired
air (carbon dioxide [CO2] or volatile organics), tissues, cage wash, and residual feed was
measured over a period of 168 hours after gavage dosing (Table 3-2). The total recovery of
radioactivity (i.e., mass balance) was low in both dose groups of rats and the high-dose group of
mice, which was attributed by the study authors to saturation in the CO2 capture system at early
time points after dosing and limited performance of the solvent used to capture volatile organics.
However, changes in the apparatus for collection of CO2 and volatile organics employed for the
low-dose mice yielded much better recovery of the administered radioactivity. Analysis of data
from the low-dose mice shows that little THF remains unabsorbed from the GI tract, since
recovery of radioactivity in the feces did not account for more than 1.4% of the administered
dose. The amount of THF-associated radioactivity recovered in the feces in these treatment
groups was similar to the low-dose mice, suggesting that THF is nearly completely absorbed
following oral dosing of up to 500 mg/kg in rats and mice.
Table 3-2. Overall percent recovery of radioactivity at 168 hours following gavage administration of [14C]-THF
Samplea
Dose: 50 mg/kg Dose: 500 mg/kg
Rat Mouse Rat Mouse
Male Female Male Female Male Female Male Female
Urine 4.4 3.5 2.7 5.3 2.2 2.2 3.8 3.6
Feces 1.1 1.0 1.4 0.9 1.0 0.4 1.3 0.8
CO2 47.8 47.5 58.2 74.6 21.9 18.8 51.1 36.2
Volatile organics <LODb <LOD 17.8 24.5 <LOD <LOD 0.3 0.2
Tissues 14.1 9.3 3.8 2.0 7.9 4.1 4.4 0.7
Cage wash and residual feed
<LOD <LOD 1.3 1.2 <LOD <LOD 1.1 1.9
Total 67.5 61.3 85.2 108.5 33.0 25.5 61.9 43.3 aThis table contains data from only those individual rats that had all listed samples collected. bLOD = Limit of detection. Source: DuPont Haskell Laboratory (1998).
3-4
3.1.2. Respiratory Tract Absorption
The results from several human studies show that THF is readily absorbed from the
respiratory tract. A study of workers in a videotape manufacturing plant (Ong et al., 1991)
suggested that THF is absorbed by the inhalation route. In a group of 58 workers, full shift
personal sampling was conducted to estimate breathing zone concentrations of THF. THF
concentrations in the blood, exhaled air, and urine of the workers were determined at the end of
the final work shift of the workweek. Time-weighted average exposures ranged from 0.2 to
143.0 ppm (0.59–422 mg/m3). The measured air concentrations correlated best with urinary
THF levels (0.88), followed by blood (0.68), and exhaled air (0.61). A limitation of the study
was the inability to estimate the rate of THF absorption from the respiratory tract since the
overall contribution of dermal exposure (described as extensive for some workers) and the
systemic THF levels were not determined. It was also unclear whether dermal exposure might
correlate with THF levels in breathing zone air. Another study of THF workers (Ong et al.,
1991) reported that the degree of THF absorption from the respiratory tract is 70% under heavy
workloads and 60% during normal breathing.
Kageyama (1988) investigated the toxicokinetics of THF in volunteers exposed by the
inhalation route. In the first experiment, subjects (1–20 per group) were exposed for 6 minutes
to THF concentrations of 108–395 ppm, and exhaled air was sampled. The authors calculated
the THF uptake ratio based on the concentrations of THF in the inhaled air divided by the
concentration of THF in the exhaled air. The average uptake ratio was 64.8% for males and
72.7% for females during normal breathing and 78.4% for males and 81.3% for females during
deep breathing. No consistent concentration-related effects on uptake were apparent. These
results suggested that as much as 81.3% of the THF was absorbed or retained in the lung under
acute exposure conditions. In a second experiment, five male subjects were exposed for 3 hours
to mean concentrations of 56 ppm THF, followed by a 1-hour recovery period and then a second
3-hour exposure. Exhaled air was monitored throughout the first 3-hour exposure period. The
percentage of THF in expired air relative to inhaled air was reported as 40% during normal
breathing and 27% during deep breathing. These results correspond to uptake ratios of 60 and
73%, respectively. The same results were observed for five male subjects exposed for a single
3-hour exposure period to a mean THF concentration of 193 ppm THF (experiment 3). The
authors also exposed five male volunteers to approximately 200 ppm (207 ppm for first exposure
and 178 ppm for second exposure) THF for sequential 3-hour exposure periods with a 1-hour
recovery period in between (experiment 4). Blood samples were collected for several of the
exposure protocols (experiments 2, 3, and 4). THF kinetics in blood were highly variable among
individuals. However, the appearance of THF in the blood demonstrates the systemic absorption
of THF from the lungs in exposed humans.
3-5
Wagner (1974) also reported on the respiratory tract absorption of THF in four
volunteers. The volunteers were exposed to 100 ppm THF for 20 minutes. The absorption rate
of THF was reported to be 60%. The author suggested that the reported absorption rate
represented 80% of the steady-state absorption rate normally reached over a period of several
hours. This value is similar to reports in other human volunteer studies (Teramoto et al., 1989;
Kageyama, 1988).
Tissue distribution studies in animals also provide evidence for absorption of THF
through the respiratory tract, since measurable levels of THF were found in a variety of tissues in
rats exposed through the inhalation route (Elovaara et al., 1984; Kawata and Ito, 1984).
3.1.3. Dermal Absorption
Limited information is available on the dermal absorption of THF in either humans or
animals. Systemic toxicity observed in acute dermal toxicity studies (Stasenkova and
Kochetkova, 1963) showed that THF can be absorbed through the skin. Brooke et al. (1998)
demonstrated that uptake of vapor of industrial solvents across the skin can also occur in
humans, but the degree of dermal uptake appears to be negligible (compared to inhalation).
Under the conditions of the study in which four volunteers, two with and two without masks,
were exposed to 150 ppm THF vapor for 4 hours, dermal uptake of THF vapor (in volunteers
with masks) was found to contribute around 1–2% of the body burden received following whole-
body (including inhalation) exposure (in volunteers without masks).
3.2. DISTRIBUTION
No tissue distribution studies have been conducted for humans exposed to THF by any
route of exposure. However, Ong et al. (1991) reported that occupational exposures (potentially
inhalation and dermal) to THF resulted in measurable blood and urine THF levels. Kageyama
(1988) and Droz et al. (1999) reported measurable blood concentrations of THF in volunteers
exposed by the inhalation route. These results demonstrate the potential for wide tissue
distribution of THF.
Tissue distribution of THF has been studied comprehensively in rats and mice following
oral dosing (DuPont Haskell Laboratory, 1998). Single gavage doses of [14C]-THF at target
concentrations of 50 or 500 mg/kg were administered to male and female F344 rats or B6C3F1
mice, and radioactive residues were measured in the plasma, red blood cells (RBCs), skin, whole
blood, bone marrow, brain, fat, heart, lungs, spleen, liver, kidney, GI tract and GI tract contents,
ovaries, testes, adrenals, plasma, uterus, muscle, bone, and carcass.
For rats, plasma and RBCs were collected at multiple time points, and, at 168 hours after
dosing, the animals were sacrificed and tissues were harvested for analysis of THF-associated
3-6
radioactivity. The presence of radioactivity in plasma demonstrates that THF or its metabolites
are available for systemic distribution. Comparison of kinetic data for plasma and RBCs
provides information on partitioning of THF (or its metabolites) in the blood compartment. The
Cmax values for plasma were consistently higher than Cmax values for RBCs, ranging from 2.7- to
4.8-fold among both dose groups in males and females. When the AUC data are compared for
plasma versus RBCs, the opposite relationship was observed (i.e., AUC values were higher in
RBCs than in plasma), consistent with the longer biological half-life (T1/2) in RBCs as compared
to plasma (see Table 3-1). No data on protein binding in the plasma were available. These data
suggest that THF-associated radioactivity partitions rapidly to the plasma, resulting in higher
peak concentrations in the plasma than in RBCs.
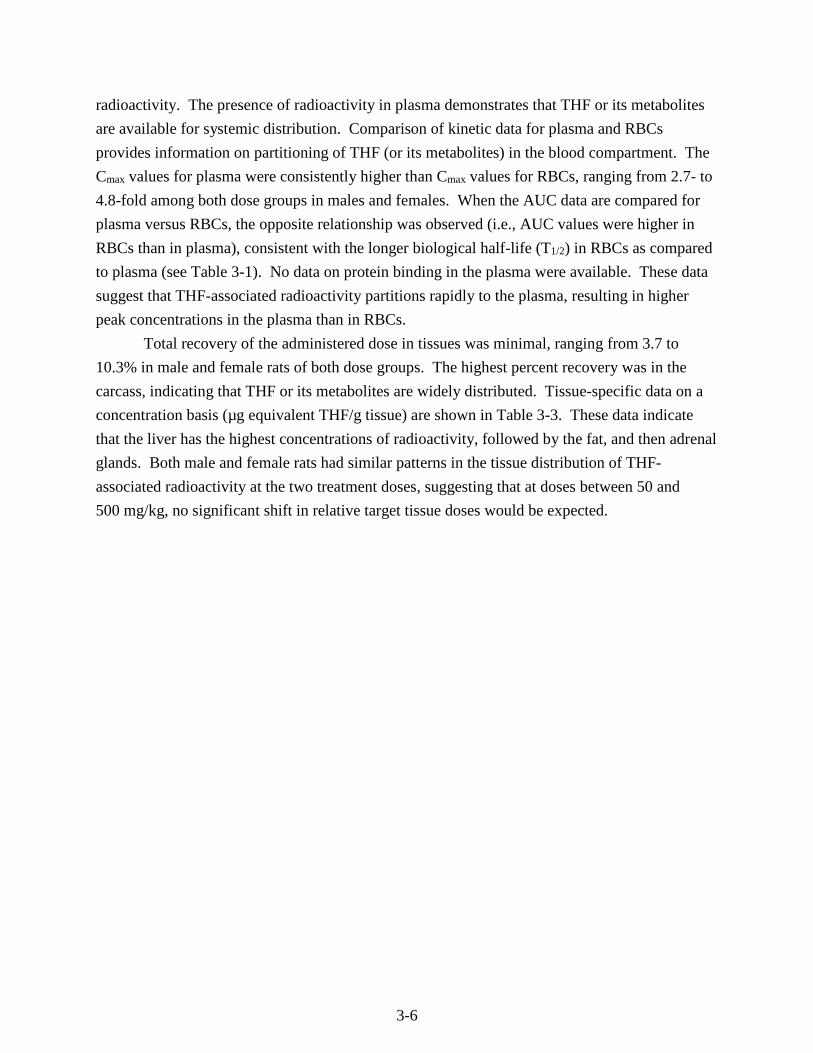
Total recovery of the administered dose in tissues was minimal, ranging from 3.7 to
10.3% in male and female rats of both dose groups. The highest percent recovery was in the
carcass, indicating that THF or its metabolites are widely distributed. Tissue-specific data on a
concentration basis (µg equivalent THF/g tissue) are shown in Table 3-3. These data indicate
that the liver has the highest concentrations of radioactivity, followed by the fat, and then adrenal
glands. Both male and female rats had similar patterns in the tissue distribution of THF-
associated radioactivity at the two treatment doses, suggesting that at doses between 50 and
500 mg/kg, no significant shift in relative target tissue doses would be expected.
3-7
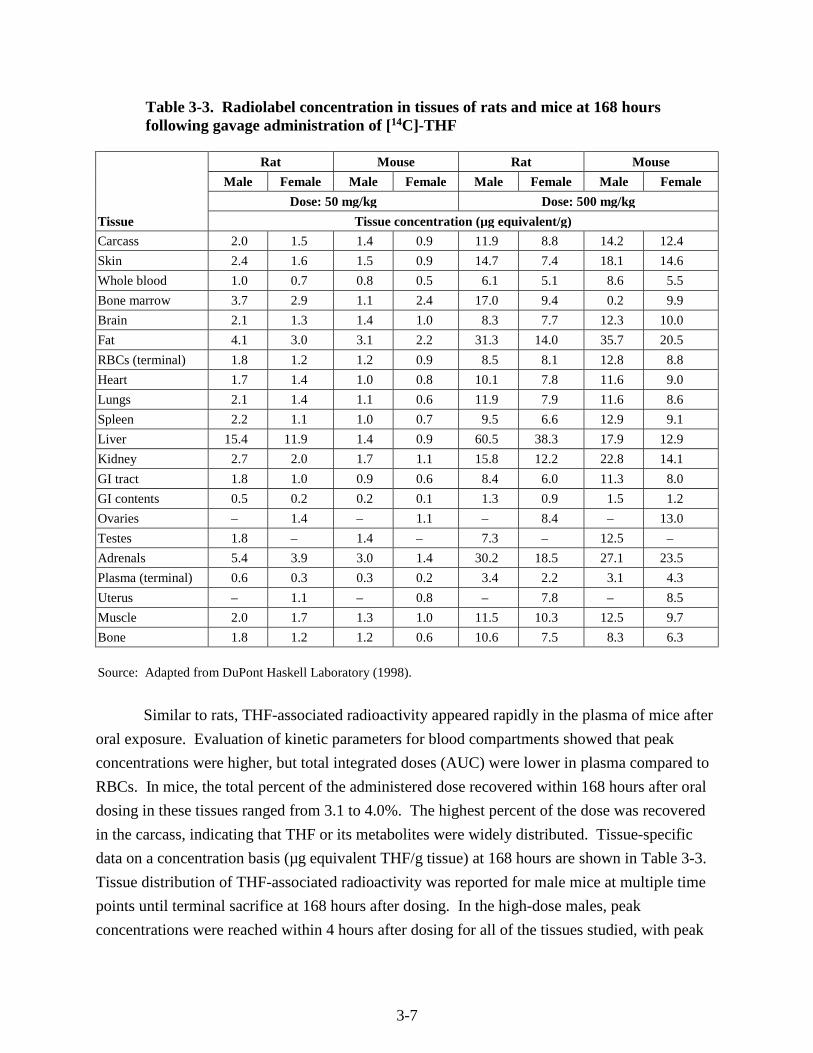
Table 3-3. Radiolabel concentration in tissues of rats and mice at 168 hours following gavage administration of [14C]-THF
Tissue
Rat Mouse Rat Mouse
Male Female Male Female Male Female Male Female
Dose: 50 mg/kg Dose: 500 mg/kg
Tissue concentration (µg equivalent/g)
Carcass 2.0 1.5 1.4 0.9 11.9 8.8 14.2 12.4
Skin 2.4 1.6 1.5 0.9 14.7 7.4 18.1 14.6
Whole blood 1.0 0.7 0.8 0.5 6.1 5.1 8.6 5.5
Bone marrow 3.7 2.9 1.1 2.4 17.0 9.4 0.2 9.9
Brain 2.1 1.3 1.4 1.0 8.3 7.7 12.3 10.0
Fat 4.1 3.0 3.1 2.2 31.3 14.0 35.7 20.5
RBCs (terminal) 1.8 1.2 1.2 0.9 8.5 8.1 12.8 8.8
Heart 1.7 1.4 1.0 0.8 10.1 7.8 11.6 9.0
Lungs 2.1 1.4 1.1 0.6 11.9 7.9 11.6 8.6
Spleen 2.2 1.1 1.0 0.7 9.5 6.6 12.9 9.1
Liver 15.4 11.9 1.4 0.9 60.5 38.3 17.9 12.9
Kidney 2.7 2.0 1.7 1.1 15.8 12.2 22.8 14.1
GI tract 1.8 1.0 0.9 0.6 8.4 6.0 11.3 8.0
GI contents 0.5 0.2 0.2 0.1 1.3 0.9 1.5 1.2
Ovaries – 1.4 – 1.1 – 8.4 – 13.0
Testes 1.8 – 1.4 – 7.3 – 12.5 –
Adrenals 5.4 3.9 3.0 1.4 30.2 18.5 27.1 23.5
Plasma (terminal) 0.6 0.3 0.3 0.2 3.4 2.2 3.1 4.3
Uterus – 1.1 – 0.8 – 7.8 – 8.5
Muscle 2.0 1.7 1.3 1.0 11.5 10.3 12.5 9.7
Bone 1.8 1.2 1.2 0.6 10.6 7.5 8.3 6.3
Source: Adapted from DuPont Haskell Laboratory (1998).
Similar to rats, THF-associated radioactivity appeared rapidly in the plasma of mice after
oral exposure. Evaluation of kinetic parameters for blood compartments showed that peak
concentrations were higher, but total integrated doses (AUC) were lower in plasma compared to
RBCs. In mice, the total percent of the administered dose recovered within 168 hours after oral
dosing in these tissues ranged from 3.1 to 4.0%. The highest percent of the dose was recovered
in the carcass, indicating that THF or its metabolites were widely distributed. Tissue-specific
data on a concentration basis (µg equivalent THF/g tissue) at 168 hours are shown in Table 3-3.
Tissue distribution of THF-associated radioactivity was reported for male mice at multiple time
points until terminal sacrifice at 168 hours after dosing. In the high-dose males, peak
concentrations were reached within 4 hours after dosing for all of the tissues studied, with peak
3-8
concentrations notably higher in the adrenal glands, liver, and kidney. The rate of decrease in
the levels of radioactivity was tissue dependent. Most notably, at longer time points, fat had
higher levels of radioactivity than liver. At the low dose, the peak concentrations of radioactivity
in the liver and kidney, but not adrenal glands, were higher than in other tissues. As in the high-
dose group, the concentration of radioactivity in the fat of the low-dose group at 168 hours was
higher than in other tissues measured.
Hara et al. (1987) investigated the distribution of THF by giving 300 and 700 mg/kg THF
orally to male Wistar rats and rabbits (strain unspecified), respectively. Blood and tissue
samples were collected for analysis of THF concentrations from groups of three rats at 10 and
30 minutes and at 1, 2, 3, and 5 hours. Blood and tissue samples were also collected for analysis
of THF from two rabbits at 7 or 8.5 hours after administration. No significant differences were
observed between the two species. Ratios of tissue levels to blood levels were approximately
1.5–2.0 in adipose tissue and kidney and about 1.0 in the brain, liver, spleen, and muscle for both
rats and rabbits.
The distribution of THF has also been studied following inhalation exposures in animals.
Elovaara et al. (1984) measured the distribution of THF into the brain and fat tissue of rats
exposed to 0, 200, 1,000, or 2,000 ppm (0, 590, 2,950, and 5,900 mg/m3) THF 6 hours/day,
5 days/week for 2–18 weeks. The exposed rats were sacrificed at 2, 8, 13, or 18 weeks, and THF
concentrations were measured in the brain and perirenal fat. At all of the time points, THF
concentrations in the fat were consistently higher than in the brain by a factor of approximately
two- to threefold. THF in both tissues increased with THF exposure concentration. As the
treatment extended from 2 to 18 weeks, the THF concentrations in both tissues gradually
decreased. The authors suggested that the decrease in tissue levels with longer exposure duration
was due to induction of the oxidative metabolism of THF, as evidenced by increases in 7-
ethoxycoumarin O-deethylase activity (as a marker for metabolic enzyme activity) in the liver
and kidney of THF-exposed animals beginning at 2 weeks (not duration-dependent). However,
the observed statistically significant increases in enzymatic activity appeared to reflect a decrease
in the activity in control animals rather than an increase in activity in the treated animals. No
changes in liver cytochrome P450 (CYP450) content were observed at the end of the study.
Comparison with the highest exposure concentration showed that tissue levels of THF were
greater than the 10-fold difference in dose. This result is consistent with the greater partitioning
of THF as the parent compound into fatty tissues as discussed above for the oral dosing study in
mice.
Kawata and Ito (1984) compared the distribution of THF following several different
inhalation exposure regimens. Male Wistar rats (5/control group and 25/experimental group)
were exposed to 15,000 ppm (44,250 mg/m3) THF for a single 30-minute exposure or for seven
3-9
daily 30-minute exposures. In addition, rats were exposed to 3,000 ppm (8,850 mg/m3) THF
vapor for 1 hour/day, 5 days/week for 12 weeks. THF concentration was determined in tissues
immediately and 1, 3, 6, and 12 hours following the last exposure. Tissues evaluated in the study
were the brain, thymus, lung, heart, liver, kidney, spleen, and blood. For the single exposure
group, immediately after exposure, the pattern of THF distribution in organs was: blood > brain
= kidneys = heart > liver = spleen = thymus = lungs. Within 1 hour, differences among the
tissue levels began to decrease, with only the lung levels being significantly lower and blood
levels being significantly higher than the other tissues. No significant difference in THF levels
was observed among the tissues within 3 hours postexposure. The study authors suggested that
lower levels of THF in the lung reflected elimination of unmetabolized THF. Lower levels of
THF in the liver and kidney would be consistent with the metabolic capacity of these organs,
since THF was measured as the parent compound in this study. Repeated exposure to 15,000
ppm THF resulted in a similar pattern of tissue level, except that immediately after exposure only
the lung (significantly lower) and blood (significantly higher) levels were different from the
other tissues.
In the rats exposed to 3,000 ppm THF for 12 weeks, a different pattern of distribution
was observed. Immediately after the last exposure, THF tissue levels were greatest in the
thymus, followed by spleen > brain = heart > lung > blood > liver = kidney. The concentration
of THF in thymus was significantly higher than THF concentration in other tissues and remained
higher for up to 12 hours postexposure. Tissue levels of THF measured immediately after the
last exposure for the 1-day and the 6- or 12-week 3,000 ppm exposure regimens were compared.
THF levels were proportionally higher with increasing duration of exposure from 1 day to
6 weeks, although for many tissues THF levels at 6 weeks were similar to those observed at
12 weeks. Daily tissue accumulation was most apparent for the thymus, in which tissue
concentrations were nearly twice as high as for the other tissues immediately after the last
exposure at 12 weeks. Beginning at 6 weeks of exposure, THF concentrations were also notably
higher in the spleen than in other tissues. Taken together, these data show that THF is taken up
in the blood and is widely distributed following exposure by the inhalation route. Longer
duration exposures may generate daily accumulation in some organs, although tissue levels
decrease to background levels rapidly after cessation of exposure. THF distributed preferentially
to the thymus and spleen following subchronic exposures. The study authors suggested that
higher THF concentrations in the thymus after longer-term exposures might reflect increased
age-associated fattening of the thymus periphery, which seems to coincide with the normal age-
related atrophy in the parenchyma of this organ. However, the spleen was also noted as an organ
with high tissue concentrations, suggesting to the study authors (Kawata and Ito, 1984) the
possibility of THF distribution through the lymph system.
3-10
Pellizzari et al. (1982) reported the presence of THF in the milk from mothers who were
living in one of four urban areas in the United States. THF was found in one of eight samples
that were analyzed. This study did not provide quantitative data on the concentrations of THF
that were present or information on mothers’ exposure.
No data on placental transfer of THF or fetal distribution is available in humans or in
animal studies.
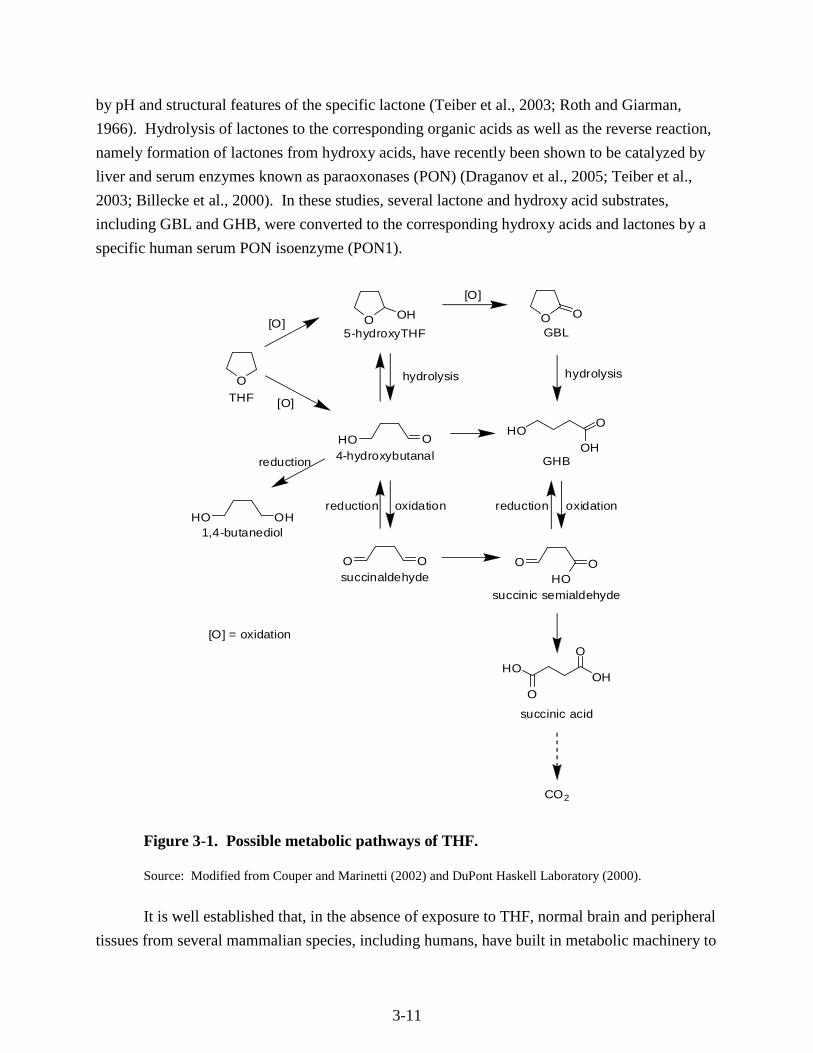
3.3. METABOLISM
Several lines of evidence suggest that THF undergoes oxidative metabolism by liver
microsomal CYP450 enzymes followed by further hydrolysis catalyzed by lactonase (also
known as paraoxonase1 or PON1) and additional oxidation by cytosolic dehydrogenases. Based
on the available in vivo and in vitro data, the ultimate metabolite of THF is CO2 and the
proposed metabolic pathway for this conversion is presented in Figure 3-1 (Couper and
Marinetti, 2002; DuPont Haskell Laboratory, 2000). According to this pathway, THF undergoes
oxidative metabolism to form the intermediates 5-hydroxy-THF and 4-hydroxybutanal which
may undergo further oxidation to γ-butyrolactone (GBL), γ-hydroxybutyric acid (GHB), and
succinaldehyde.
In vivo studies on THF metabolism indicate that CO2 is the major terminal metabolite, as
shown in Table 3-2 (DuPont Haskell Laboratory, 1998). In mice administered a single gavage
dose of 50 mg/kg [14C]-THF, the percent of the radioactivity recovered as CO2 was 58.2% in
males and 74.6% in females. Volatile organics (possibly as unmetabolized THF) accounted for
17.8% of the administered dose in males and 24.5% of the administered dose in females. In mice
administered a single dose of 500 mg/kg [14C]-THF, the percent of the administered dose
recovered as CO2 was 51.1 and 36.2% for males and females, respectively. Rat metabolism
studies also demonstrated that oxidative metabolism of THF to CO2 is an important pathway. In
rats given a single gavage dose of 50 mg/kg of [14C]-THF, 47.8 and 47.5% of [14C]-THF in
males and females, respectively, was recovered in the form of CO2. In rats given 500 mg/kg of
radiolabeled THF, these percentages were 21.9% in males and 18.8% in females.
In both sexes of mice and rats, metabolism of THF to CO2 was greater at the low dose,
suggesting that metabolism may be saturated at higher doses. Although the data suggest that
there might be species differences in the contribution of CO2 to THF metabolism, potential
saturation of the CO2 trap, and therefore loss of CO2 in the rat study makes comparison of the rat
and mice data unreliable.
The metabolism of GBL and GHB has also been studied extensively (NSF, 2003). GBL
may readily convert to GHB, as lactones are known to readily equilibrate in aqueous media
between their closed (lactone) and open (hydroxyl acid) forms, a process that may be influenced
3-11
by pH and structural features of the specific lactone (Teiber et al., 2003; Roth and Giarman,
1966). Hydrolysis of lactones to the corresponding organic acids as well as the reverse reaction,
namely formation of lactones from hydroxy acids, have recently been shown to be catalyzed by
liver and serum enzymes known as paraoxonases (PON) (Draganov et al., 2005; Teiber et al.,
2003; Billecke et al., 2000). In these studies, several lactone and hydroxy acid substrates,
including GBL and GHB, were converted to the corresponding hydroxy acids and lactones by a
specific human serum PON isoenzyme (PON1).
O
O OH
HO O4-hydroxybutanal
5-hydroxyTHF
O Osuccinaldehyde
O O
GBL
O OHO
HO OH1,4-butanediol
succinic semialdehyde
O
O
OHHO
[O]
[O]
reduction
reduction oxidation
hydrolysis
[O]
HOO
OH
hydrolysis
GHB
reduction oxidation
succinic acid
CO2
THF
[O] = oxidation
Figure 3-1. Possible metabolic pathways of THF.
Source: Modified from Couper and Marinetti (2002) and DuPont Haskell Laboratory (2000).
It is well established that, in the absence of exposure to THF, normal brain and peripheral
tissues from several mammalian species, including humans, have built in metabolic machinery to
3-12
produce and process GHB. High concentrations of GHB have been found in normal brain and in
peripheral tissues including brown fat, liver, heart, spleen, and kidneys from human and other
species where endogenous formation of brain GHB is thought to come from the neurotransmitter
γ-aminobutyric acid (GABA) and possibly 1,4-butanediol (Nelson et al., 1981; Doherty et al.,
1978; Roth and Giarman, 1968). More recently, a GHB receptor from a human brain frontal
cortex cDNA library has also been cloned and characterized (Andriamampandry et al., 2007).
GHB can be oxidized to succinic semialdehyde (SSA) by a cytosolic NADP+ dependent
GHB dehydrogenase commonly found in brain as well as several other tissues including brown
fat, liver, heart, spleen, and kidneys (Kaufman and Nelson, 1987; Kaufman et al., 1979). An
enzyme known as succinic semialdehyde dehydrogenase then oxidizes SSA to succinic acid
(Kaufman and Nelson, 1987; Gibson et al., 1983) which is an intermediate in the citric acid cycle
that ultimately generates CO2, water, and usable energy. As discussed earlier, the in vivo
metabolism studies of THF have shown that CO2 is the predominant metabolite.
In an in vitro experiment with hepatic microsomal preparations from rats, mice, or
humans, the only metabolite of THF identified was GHB (DuPont Haskell Laboratory, 2000).
The T1/2 for disappearance of THF in these reactions was 40 hours for rat microsomes, 28 hours
for human microsomes, and 9 hours for mouse microsomes. The data suggest that liver
microsomes in mice may have a greater capacity to metabolize THF than do human or rat
microsomes. No data are available to confirm whether these relative rates of metabolism by
microsomes are predictive of THF metabolism among species in vivo. Further, though no
attempt was made to characterize the role of specific metabolizing enzymes, the fact that
microsomes were used, in the presence of an NADPH-generating system (DuPont Haskell
Laboratory, 2000), strongly suggests that one or more of the CYP450 isoenzymes were involved.
The metabolism of THF to GBL is further supported by metabolic studies of p-dioxane, a
structural analogue of THF. p-Dioxane-2-one, a lactone with a six-member ring analogous to
GBL, has actually been identified as the major urinary metabolite of p-dioxane in rats (Woo et
al., 1977). In addition, in vitro studies of structurally related compounds with a THF ring or
similar ring structures indicate that there are a number of possible pathways (see Figure 3-1) for
the metabolism of THF to GHB, including (1) α-hydroxylation (by microsomal CYP450
enzymes) to 5-hydroxy-THF, which can be rapidly converted to GBL and GHB (Woo et al.,
1977; Fujita and Suzuoki, 1973); (2) oxidation of THF (by cytosolic enzymes) to
4-hydroxybutanal, followed by immediate oxidation to GHB and GBL or reversibly reduced to
1,4-butanediol (El Sayed and Sadée, 1983; Roth and Giarman, 1968); and (3) direct oxidation of
THF to succinaldehyde (by microsomal CYP450 enzymes)—not shown in Figure 3-1, followed
by reversible reduction to 4-hydroxybutanal and oxidation to GBL or GHB in the presence of
cytosolic soluble enzymes. The formation of GBL or GHB from succinaldehyde by soluble
3-13
enzymes could also occur by oxidation to SSA, followed by reversible reduction (El Sayed and
Sadée, 1983).
The implication of these metabolic intermediates to the overall toxicity of THF is unclear.
Many of these intermediates (i.e., 5-hydroxy-THF, 4-hydroxybutanal, 1,4-butanediol,
succinaldehyde) are expected to be unstable and rapidly undergo further metabolism to GHB.
Studies in rats have shown that 1,4-butanediol is metabolized in the blood and brain to GHB and
that GHB is the active intermediate responsible for the central nervous system (CNS) effects of
1,4-butanediol (Roth and Giarman, 1968). In fact, in vitro and in vivo studies have shown that
GHB can be converted to the neurotransmitter, GABA (Vayer et al., 1985; DeFeudis and Collier,
1970), which provides a possible mechanistic link between THF and its potential for causing
CNS effects. Appreciable amounts of radioactive-labeled GABA were detected in the brains of
mice 60, 120, and 180 minutes after intraperitoneal (i.p.) injection of 1-[14C]-GHB (DeFeudis
and Collier, 1970). Increased tissue level of GABA and putrescine (the primary source of
GABA in many tissues) may also be hypothesized to play a role in the THF-induced cell
proliferation and carcinogenicity in the liver (see Section 4.7.3.2).
3.4. ELIMINATION
The available human data suggest that expiration is an important route of excretion for
THF. In a human occupational study (Ong et al., 1991), workers exposed to THF by the
inhalation and dermal routes excreted THF in exhaled air and in the urine. Kageyama (1988)
measured exhaled air concentrations of THF in volunteers exposed by the inhalation route. THF
was present in the exhaled air for several hours after exposure to a concentration of 200 ppm,
suggesting that THF is excreted in exhaled air. Droz et al. (1999) summarized the results from
several additional human volunteer studies that support the conclusion that THF is rapidly
excreted from the body via exhaled air and urine. Exposure periods were for as long as 8 hours
to concentrations as high as 200 ppm. In all cases, THF levels in breath, blood, or urine declined
rapidly and reached background levels within a period of approximately 12 hours.
Oral dosing studies in animals provide further evidence for the important role that
exhaled air plays as a route of excretion for THF. In rats exposed to an oral dose of 50 mg/kg
THF, 47% of the oral dose was recovered in the expired air as CO2, while only about 4% of the
radioactivity was detected in the urine and 1% in the feces. In the mice exposed to the same dose
of THF, 58–75% of the oral dose was recovered in expired air as CO2 and 18–25% as volatile
organic compounds (VOCs), while 3–5% of the radioactivity was detected in the urine and 1%
was detected in the feces. A similar pattern was observed in the animals exposed to the high
dose of 500 mg/kg, but relatively less radioactivity, 19–22% as CO2 in rats and 36–51% as CO2
in mice, was recovered in the expired air. Because of some technical difficulties in recovery of
3-14
VOCs from the expired air, significant losses of trapped VOCs occurred in most of the
measurements. Among all the data available for VOCs, the only adequate data were from the
mice exposed to the low dose of THF. Nevertheless, the available data indicate that expiration
was the major route of excretion of absorbed THF, and CO2 was the major final product. The
study authors suggested that the VOCs in the exhaled air were likely to be parent THF. Urine
and feces were relatively minor routes of THF excretion (DuPont Haskell Laboratory, 1998).
In the DuPont Haskell Laboratory (1998) study, the time course of THF in the plasma of
exposed rats and mice was also studied. The results are summarized in Table 3-1. In the rats
exposed to the low dose (50 mg/kg), the T1/2 of the radioactivity in the plasma was 52 hours in
the males and 51 hours in the females. Following exposure to the high dose (500 mg/kg) THF,
the plasma T1/2 was estimated to be 48 (males) and 59 (females) hours. In the mice exposed to
the low dose, the plasma T1/2 was 57 hours for males and 51 hours for females. Following
exposure to the high dose (500 mg/kg) THF, the serum T1/2 was 57 (males) and 99 (females)
hours. Based on these data, there were no apparent differences in the plasma T1/2 between rats
and mice. At the 50 mg/kg dose level, male and female animals had a comparable T1/2, while at
500 mg/kg THF the males had shorter plasma half-lives than the females. The half-lives
reported in this study are not the biological half-lives of THF but only represent radioactivity
measured in plasma and serum. The radioactivity present is likely derivatives of THF that are
either covalently bound to cellular macromolecules or have been incorporated into the primary
carbon pool. Available data indicate that the biological T1/2 of THF is about 5–7 hours. Hara et
al. (1987) reported a T1/2 of 5.2 hours in rats, following oral administration of 300 mg/kg, and a
T1/2 of 5.1 hours in rabbits at a dose of 700 mg/kg.
The AUCs for the THF-associated radioactivity in the plasma were estimated for the
exposed rats and mice in the study conducted by the DuPont Haskell Laboratory (1998). In the
rats exposed to 50 mg/kg THF, the plasma AUC in males and females was 536 and 320 µg THF
equivalents-hour/g plasma, respectively. In rats exposed to 500 mg/kg THF, the plasma AUC in
males and females was 2,826 and 1,998 µg THF equivalents-hour/g plasma, respectively (see
Table 3-1). At either the low or high doses, the AUC was always higher in the male rats than in
female rats. A similar difference between sexes was observed in mice. In the 50 mg/kg dose
group, the plasma AUC was 207 (male) and 157 (female) µg THF equivalents-hour/g plasma.
The plasma AUC in males and females was 3,238 and 1,904 in the high-dose group (500 mg/kg),
respectively. Based on these findings, the same oral dose of THF resulted in a higher internal
dose of THF and/or its metabolites in male rats or mice than in females of the corresponding
species. However, the toxicological implications of this result are difficult to interpret since the
AUC reflects a combination of THF and its metabolites, while the toxic moiety has not been
3-15
identified. Nevertheless, in general, the greater AUC for males would be consistent with a
greater degree of systemic dose in males versus females.
The AUC data from this study can be used to estimate the body clearance of THF. The
clearance was calculated based on the ratio of administered dose/AUC. All the relevant kinetic
parameters and estimated clearance values are summarized in Table 3-1. In both rats and mice,
females had a higher clearance rate than males. The more rapid clearance (i.e., due to lower
AUC values) observed in females might reflect differences in excretion kinetics or alternatively
might reflect differences in the degree of THF absorption, since the administered dose was used
for this calculation rather than the absorbed dose. The clearance rates in rats of the low-dose
group were lower than the high-dose group, while there was no such variance in mice.
Kawata and Ito (1984) compared the blood and tissue distribution and elimination of
THF, following several different inhalation exposure regimens. In male Wistar rats exposed to
15,000 ppm (44,250 mg/m3) THF for a single 30-minute exposure, 70–80% of the THF was
eliminated from the organs within 1 hour following exposure. After 1 hour, concentration of
THF decreased slowly and was almost completely eliminated by 12–13 hours following
exposure. In animals that received seven exposures of 15,000 ppm, only 18–39% of THF was
eliminated from the organs in 1 hour following exposure, indicating some saturability in the
elimination kinetics for these organs at very high concentrations. In these animals, the rate of
THF decrease was 31% at 3 hours following last exposure and 68% at 6 hours following last
exposure; by 12 hours THF was almost completely eliminated. Similar to the acute dosing
studies, THF was nearly completely eliminated from blood and tissues within 12 hours after the
last exposure in the 12-week exposure protocol. These data indicate that, for exposure
concentrations as high as 15,000 ppm, THF is rapidly eliminated from blood and other tissues.
3.5. BIOACCUMULATION
Two toxicokinetic studies employed longer-term exposure regimens that provide
information useful for assessing the potential for bioaccumulation of THF in tissues. Kawata
and Ito (1984) measured tissue levels of THF immediately after the last exposure period
following daily inhalation exposures to 3,000 ppm THF for 1 day, 6 weeks, or 12 weeks. Daily
levels increased in some tissues, particularly from 1 day to 6 weeks. In the thymus and spleen,
tissue levels continued to increase through the 12-week exposure period. These data suggest
some potential for tissue accumulation with repeated daily exposure. However, it is notable that
even in animals exposed for 12 weeks, tissue levels declined rapidly after the end of the last
exposure period (within hours). Thus, the rate of uptake of THF is likely more rapid than the
rate of excretion. Therefore, during periods of continuous exposure, there is some potential for
3-16
tissue levels of THF to accumulate. However, periods of intermittent exposure would allow for
clearance of the THF body burden and thus limit the potential bioaccumulation.
Elovaara et al. (1984) measured the distribution of THF into the brain and fat tissue of
rats exposed to 0, 200, 1,000, or 2,000 ppm (0, 590, 2,950, and 5,900 mg/m3) THF 6 hours/day,
5 days/week for 2–18 weeks. As the treatment extended from 2 to 18 weeks, the THF
concentrations in both tissues of the exposed rats gradually decreased. The observed decline in
brain and fat THF levels suggests that THF may not bioaccumulate in these tissues.
Evaluation of human volunteer studies to derive a physiologically based pharmacokinetic
model for THF revealed rapid elimination of THF from the body (Droz et al., 1999). The
resulting model predicted that no significant accumulation of THF would be expected over the
workweek or across workweeks. THF elimination rates observed in inhalation (Elovaara et al.,
1984; Kawata and Ito, 1984) and oral studies (DuPont Haskell Laboratory, 1998) in animals
support this conclusion. Taken together, the data support the general conclusion that THF is not
likely to bioaccumulate.
3.6. PHYSIOLOGICALLY BASED PHARMACOKINETIC MODELS
A human physiologically based pharmacokinetic (PBPK) model has been developed by
Droz et al. (1999) to estimate THF concentrations in the blood, breath, and urine, following an
inhalation exposure for the purpose of determining biological exposure indices in these media
that would equate to an occupational exposure level of 200 ppm THF. The PBPK model was
constructed with seven compartments: lungs, muscles and skin, fatty tissue, liver, kidneys, brain,
and other tissues. Physiological parameters (tissue volumes, blood flow rates, etc.) were
calculated from body weight and height and from physical workload by using formulas
previously developed by the author (Droz et al., 1989). Blood-air and tissue-air partition
coefficients were estimated from in vitro experiments. THF metabolism was assumed to follow
first order kinetics. Urinary excretions were calculated assuming a urine flow of 1 mL/min and a
creatinine excretion rate of 1.4 g/day. The model was validated by using four discrete sets of
human exposure data from workers or human volunteer studies. The model provided an
adequate fit to three out of four data sets. The reason for the lack of fit for one of these data sets
was not determined. Based on the model predictions, repeated inhalation exposures to 200 ppm
THF would yield end-of-the-work-shift levels of THF in biological samples of 5.1 ppm in breath,
57 µmol/L in blood, and 100 µmol/L in urine. However, this model does not account for the
toxicokinetic variability in humans and no PBPK models have been developed in animals. Also,
there are no comparative toxicokinetic or toxicodynamic studies following exposure to THF by
the oral route in humans and animals. Therefore, this model is not adequate for calculating
human equivalent exposure concentrations from the available rodent study data.
3-17
3.7. SUMMARY
Overall, the available data demonstrate that THF is readily absorbed through multiple
routes, is systemically distributed, and is rapidly metabolized and excreted. THF is readily
absorbed from the respiratory tract, based on the observed rapid increase of THF in biological
samples or calculated uptake rates in human studies (Droz et al., 1999; Ong et al., 1991;
Kageyama, 1988; Wagner, 1974). Although no human data are available to evaluate the rate or
degree of absorption of THF following exposure through the oral route, oral dosing studies in
rats and mice show that radiolabeled THF is readily absorbed from the GI tract with wide tissue
distribution; however, total recovery of radioactivity in tissues represented only a small fraction
of the administered dose (DuPont Haskell Laboratory, 1998). No studies on dermal absorption
were identified, but the observed systemic toxicity in a dermal toxicity study in mice and rabbits
(Stasenkova and Kochetkova, 1963) demonstrated that THF can be absorbed through the skin.
A metabolic pathway has been proposed in which THF is oxidatively metabolized to
succinic acid, which being an intermediate in the citric acid cycle, undergoes a series of reactions
ultimately leading to the release of CO2 from the parent molecule. In addition, several
intermediate metabolites are expected to be unstable and rapidly undergo further metabolism to
GHB which can be converted to the neurotransmitter GABA. Several enzymes, including
CYP450, PON1, and dehydrogenases, may be involved in metabolizing THF and some of its
intermediate metabolites (see Section 3.3 and Figure 3.1).
The available human data suggest that THF is rapidly excreted. Excretion in exhaled air
and urine were correlated with exposure concentration in an occupational study (Ong et al.,
1991). Human volunteer studies demonstrate that THF is rapidly excreted in exhaled air and
urine, with concentrations of THF in these tissues generally returning to background levels
within hours of cessation of exposure (Droz et al., 1999; Kageyama, 1988). The rapid excretion
of THF observed in human studies is supported by an inhalation study in rats (Kawata and Ito,
1984) in which tissue levels of THF decline rapidly during the postexposure period. THF is also
rapidly cleared from the body following oral dosing, with exhaled air serving as the primary
route of excretion (DuPont Haskell Laboratory, 1998). Analysis of the mass balance of
radioactivity in the exhaled air, excreta, and tissues showed that nearly the entire administered
dose was excreted in the exhaled air as CO2 or volatile organics (possibly unmetabolized THF).
The rate of excretion was rapid. The half-lives in the plasma were approximately 50 hours for
most groups, although blood and tissue levels of radioactivity decreased rapidly, and tissue levels
of radioactivity represented only a small percentage of the administered dose within 168 hours of
exposure. Available data indicate that the biological T1/2 of THF is about 5–7 hours (Hara et al.,
1987).
4-1
4. HAZARD IDENTIFICATION
4.1. STUDIES IN HUMANS—EPIDEMIOLOGY, CASE REPORTS, CLINICAL
CONTROLS
There are a number of occupational exposure studies and case reports on humans exposed
to THF that identify effects on the nervous system and liver. Most of these studies do not
identify THF exposure levels and all of them report coexposures to other chemicals, including
neurotoxic solvents.
Garnier et al. (1989) reported two cases of occupational exposure to THF. In both cases,
the men (ages 35 and 55) worked as plumbers repairing pipes in confined spaces with a glue that
contained THF. No exposure information was provided. Symptoms included nausea, headache,
dizziness, chest pain, cough, dyspnea, and epigastric pain. In both men, blood count and renal
function were normal. However, the serum liver enzymes aspartate aminotransferase (AST),
alanine aminotransferase (ALT), and γ-glutamyl ransferase (GGT) were elevated several times
above the normal range. Clinical symptoms resolved in about 2 days and liver enzymes
returned to normal within 2 weeks. The authors suggested that THF exposure may result in
irritation, CNS effects, and transient liver toxicity in humans.
Emmett (1976) reported the case of a 41-year-old pipe fitter exposed for about 3 months
to a mixture of THF and other solvents in a pipe cleaning solution and a pipe glue. Other
solvents present in the solution included acetone and cyclohexanone. No information was
provided on exposure concentrations. The only effects reported by the patient were a slight
rhinorrhea (runny nose) during exposure and a gradual onset, over 10 weeks, of a constant
unpleasant smell or loss of sense of smell. No other clinical signs were reported. A neurological
exam, radiography of skull and sinuses, and hematological exam were all normal. Within 6
weeks after cessation of exposure, some sense of smell returned. However, by 7 months after the
initial diagnosis, sense of smell was still diminished.
Edling (1982) reported the occupational exposure of a shoemaker to a mixture of solvents
that included THF, acetone, chloroform, and trichloroethylene. No information on exposure
concentrations was provided. In addition, the patient had concurrent exposure to acetylsalicylic
acid to treat lumbago (back pain). Clinical chemistry results revealed increased liver enzymes
including GGT and ALT. Liver biopsy showed centriacinar fatty change and siderosis.
Juntunen et al. (1984) reported cerebral convulsions in a patient following occupational
exposure to both THF and enfluran anesthesia. The patient was a 45-year-old man who worked
as a plumber, using a solvent containing THF to insulate the inside of a water piping system. For
2 weeks, the patient had been working with THF in enclosed spaces with no ventilation. No
information was provided on the resulting exposure concentration. The patient reported that he
4-2
had felt unusually tired and had a headache in the week before he was admitted to the hospital
for an appendectomy. On awakening from the enfluran anesthesia, the patient had several
convulsions. In addition, liver enzymes were slightly elevated following the surgery. The
authors concluded that THF exposure was the main contributing factor for the convulsions
because the patient was exposed to high concentrations of THF for 2 weeks before the surgery.
In addition he had never had epilepsy or neurological disease and his clinical status and
computed tomography results were normal.
Albrecht et al. (1987) reported a case of autoimmune glomerulonephritis in a plumber
working with pipe cement containing THF. The 28-year-old male plumber had been working
with pipe cement for over 9 years. The initial symptom was gross hematuria. A needle biopsy
of the kidney revealed segmental proliferative glomerulonephritis with immunoglobulin A
deposits, capillary adhesions to the Bowman’s capsule, and fibrin in the glomerular mesangial
deposits. Industrial hygiene monitoring identified 15-minute exposures to THF, ranging from
389–757 ppm (1,148–2,233 mg/m3) during periods that pipe cement was in use.
The National Institute for Occupational Safety and Health (NIOSH) (1991) investigated
reports of adverse health effects at a plant that manufactured flexible hose. Environmental
monitoring was conducted for respirable particulates, respirable silica, THF, total dust, metals,
nitrosamines, and other organic compounds. Approximately 35–40 employees were interviewed
by NIOSH investigators. In addition, the medical records of six employees who had sought
medical attention for a work-related health problem and the death certificates of nine employees
who were thought to have had work-related health problems were reviewed by NIOSH
investigators. THF was detected in five air samples collected during a sealing operation. The
concentrations ranged from 20 to 83 ppm (59–245 mg/m3), but none of the sampling results were
above the Occupational Safety and Health Administration standard of 200 ppm. However, the
backup sections on the sampling apparatus also contained THF, indicating that breakthrough had
occurred and suggesting that the THF exposure concentrations may have been higher. In
addition to THF, other organic solvents detected in the air monitoring samples included acetone,
toluene, methyl ethyl ketone, and 1,1,1-trichloroethane. The interviewed employees reported a
variety of symptoms, including eye and respiratory tract irritation, headaches, lightheadedness,
and drowsiness. The authors suggested that these symptoms may be related to solvent exposure
but could not associate specific symptoms with individual chemicals.
Horiuchi et al. (1967) evaluated the health of workers employed in a vinyl chloride hose-
manufacturing facility where THF was used as an adhesive. THF was detected in workplace air
samples at concentrations as high as 1,000 ppm (2,950 mg/m3). Workers who handled THF
reported fatigue in the lower extremities. Clinical findings included decreased specific gravity of
4-3
whole blood (more predominant in females), decreased white blood cell count, increased serum
ALT activity, palpable liver, and hypotension.
Two human dermal THF exposure studies were identified. A study by BASF (1938) did
not observe contact dermatitis or sensitization in dermal tests in 196 volunteers exposed to THF
(exposure concentration not reported by study authors). Hofmann and Oettel (1954) reported
that THF applied to the skin of six people produced irritation that was more severe when THF
was allowed to evaporate. The authors concluded that THF itself was nonirritating, and the
irritation was caused by impurities that remained after THF had evaporated away. No additional
information was provided to evaluate the adequacy of this study.
4.2. SUBCHRONIC AND CHRONIC STUDIES AND CANCER BIOASSAYS IN
ANIMALS—ORAL AND INHALATION
4.2.1. Subchronic Studies
4.2.1.1. Oral
No subchronic studies in animals by the oral route of exposure were identified.
4.2.1.2. Inhalation
Horiguchi et al. (1984) evaluated the subchronic inhalation toxicity of THF in rats. Male
Sprague-Dawley rats (11–12/group) were exposed to THF vapors 5 days/week, 4 hours/day for
12 weeks. Two experiments using different concentrations were conducted. THF concentrations
for the first experiment were 0, 200, or 1,000 ppm (0, 590, or 2,950 mg/m3) and for the second
experiment were 0, 100, or 5,000 ppm (0, 295, or 14,750 mg/m3). Body weights and clinical
signs of intoxication were observed daily during the exposure period. Rats were sacrificed on
the second day following termination of exposure. Blood was drawn for hematological and
serum chemistry evaluation. Major organs were weighed and evaluated histopathologically.
Body weight in rats exposed to 5,000 ppm was significantly lower than controls for the entire
exposure period; no differences from controls were observed in the other treated groups.
Animals in the 5,000 ppm group displayed signs of local irritation and CNS effects, which were
described by the study authors as similar to those observed for the acute study (Horiguchi et al.,
1984). These local irritation and CNS effects were reported as moderating with continued
exposure. There were statistically significant increases in serum AST at exposures ≥200 ppm;
however, the magnitudes of the increases were minimal and were not dependent on the exposure
levels (the highest increase was 50% greater than controls at 1,000 ppm while at 5,000 ppm it
only increased by 18%). Compared to the control values, the following parameters were also
changed in the 1,000 and/or 5,000 ppm exposure groups. At 1,000 and 5,000 ppm,
cholinesterase was slightly but significantly increased by 8 and 15%, respectively, while blood
4-4
sugar was significantly decreased by 20 and 39%, respectively. Serum ALT, cholesterol, and
bilirubin were significantly increased only in the 5,000 ppm group (by 100, 44, and 46%,
respectively). White blood cell count was significantly decreased (by about 24%) in the 5,000
ppm group compared with controls. Relative organ weights were significantly increased (by 7–
28%) only in the 5,000 ppm group, including brain, lung, liver, pancreas, and kidney, while the
relative spleen weight was decreased (by 13%). All histopathological findings were comparable
between treated and control groups. Based on body weight, organ weight changes, local
irritation and CNS effects, and serum chemistry parameter changes, EPA identified 5,000 ppm
(14,750 mg/m3) as the study lowest-observed-adverse-effect level (LOAEL) and the no-
observed-adverse-effect level (NOAEL) as 1,000 ppm (2,950 mg/m3). The results of Horiguchi
et al. (1984) were also reported in an earlier Japanese publication from the same laboratory
(Katahira et al., 1982).
In an NTP subchronic inhalation study (NTP, 1998; Chhabra et al., 1990), F344/N rats
and B6C3F1 mice (10/sex/group) were exposed to target concentrations of 0, 66, 200, 600, 1,800,
or 5,000 ppm THF vapor (0, 195, 590, 1,770, 5,310, or 14,750 mg/m3) 6 hours/day, 5 days/week
for 90 days. Animals were observed for morbidity and mortality, body weight, and clinical
observations. Within 24 hours after last exposure, animals were euthanized, and blood and
tissues were collected. All major tissues were fixed in formalin and processed.
Histopathological examination was performed on all tissues from the high-concentration group
and controls and on all gross lesions and target tissues from all exposure groups. Organ weights
were measured for heart, liver, lung, right kidney, spleen, and thymus. Standard hematology and
clinical parameters were evaluated in rats only. Thymus and liver weights and relative weights
are summarized in Table 4-1.
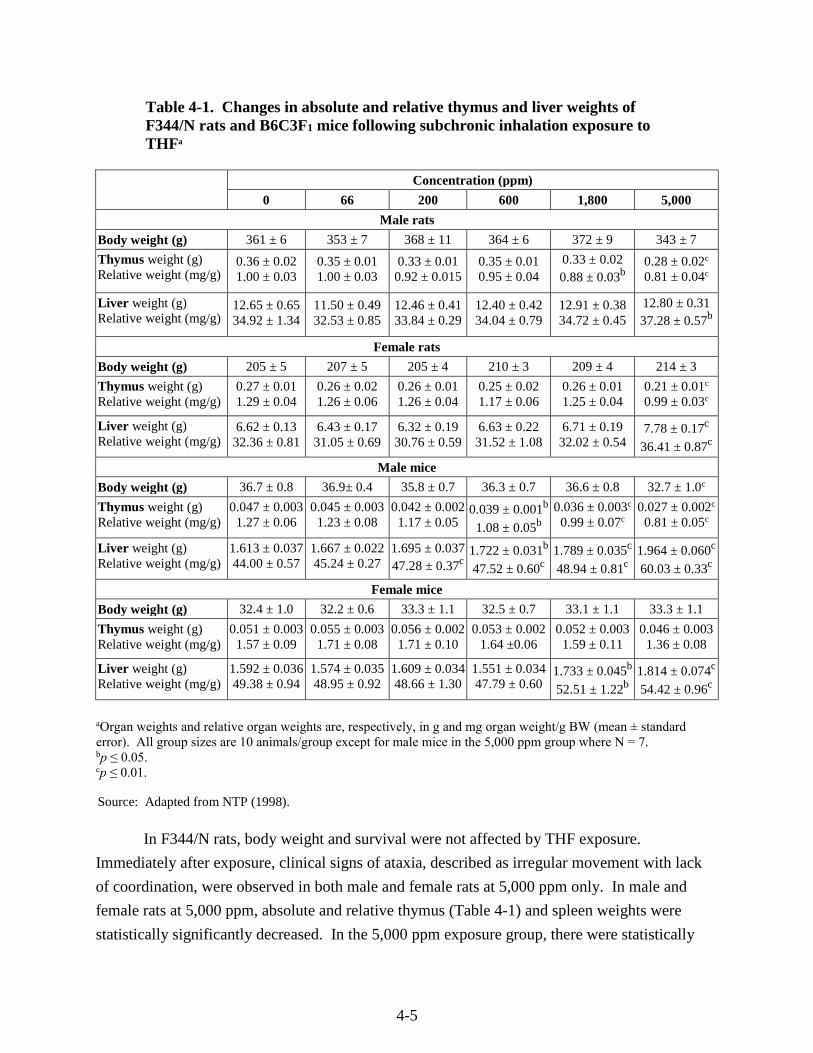
4-5
Table 4-1. Changes in absolute and relative thymus and liver weights of F344/N rats and B6C3F1 mice following subchronic inhalation exposure to THFa
Concentration (ppm)
0 66 200 600 1,800 5,000
Male rats
Body weight (g) 361 ± 6 353 ± 7 368 ± 11 364 ± 6 372 ± 9 343 ± 7
Thymus weight (g) Relative weight (mg/g)
0.36 ± 0.02 1.00 ± 0.03
0.35 ± 0.01 1.00 ± 0.03
0.33 ± 0.01 0.92 ± 0.015
0.35 ± 0.01 0.95 ± 0.04
0.33 ± 0.02 0.88 ± 0.03b
0.28 ± 0.02c 0.81 ± 0.04c
Liver weight (g) Relative weight (mg/g)
12.65 ± 0.65 34.92 ± 1.34
11.50 ± 0.49 32.53 ± 0.85
12.46 ± 0.41 33.84 ± 0.29
12.40 ± 0.42 34.04 ± 0.79
12.91 ± 0.38 34.72 ± 0.45
12.80 ± 0.31 37.28 ± 0.57b
Female rats
Body weight (g) 205 ± 5 207 ± 5 205 ± 4 210 ± 3 209 ± 4 214 ± 3
Thymus weight (g) Relative weight (mg/g)
0.27 ± 0.01 1.29 ± 0.04
0.26 ± 0.02 1.26 ± 0.06
0.26 ± 0.01 1.26 ± 0.04
0.25 ± 0.02 1.17 ± 0.06
0.26 ± 0.01 1.25 ± 0.04
0.21 ± 0.01c 0.99 ± 0.03c
Liver weight (g) Relative weight (mg/g)
6.62 ± 0.13 32.36 ± 0.81
6.43 ± 0.17 31.05 ± 0.69
6.32 ± 0.19 30.76 ± 0.59
6.63 ± 0.22 31.52 ± 1.08
6.71 ± 0.19 32.02 ± 0.54
7.78 ± 0.17c
36.41 ± 0.87c
Male mice
Body weight (g) 36.7 ± 0.8 36.9± 0.4 35.8 ± 0.7 36.3 ± 0.7 36.6 ± 0.8 32.7 ± 1.0c
Thymus weight (g) Relative weight (mg/g)
0.047 ± 0.003 1.27 ± 0.06
0.045 ± 0.003 1.23 ± 0.08
0.042 ± 0.002 1.17 ± 0.05
0.039 ± 0.001b 1.08 ± 0.05b
0.036 ± 0.003c 0.99 ± 0.07c
0.027 ± 0.002c 0.81 ± 0.05c
Liver weight (g) Relative weight (mg/g)
1.613 ± 0.037 44.00 ± 0.57
1.667 ± 0.022 45.24 ± 0.27
1.695 ± 0.037 47.28 ± 0.37c
1.722 ± 0.031b 47.52 ± 0.60c
1.789 ± 0.035c 48.94 ± 0.81c
1.964 ± 0.060c 60.03 ± 0.33c
Female mice
Body weight (g) 32.4 ± 1.0 32.2 ± 0.6 33.3 ± 1.1 32.5 ± 0.7 33.1 ± 1.1 33.3 ± 1.1
Thymus weight (g) Relative weight (mg/g)
0.051 ± 0.003 1.57 ± 0.09
0.055 ± 0.003 1.71 ± 0.08
0.056 ± 0.002 1.71 ± 0.10
0.053 ± 0.002 1.64 ±0.06
0.052 ± 0.003 1.59 ± 0.11
0.046 ± 0.003 1.36 ± 0.08
Liver weight (g) Relative weight (mg/g)
1.592 ± 0.036 49.38 ± 0.94
1.574 ± 0.035 48.95 ± 0.92
1.609 ± 0.034 48.66 ± 1.30
1.551 ± 0.034 47.79 ± 0.60
1.733 ± 0.045b 52.51 ± 1.22b
1.814 ± 0.074c 54.42 ± 0.96c
Source: Adapted from NTP (1998).
aOrgan weights and relative organ weights are, respectively, in g and mg organ weight/g BW (mean ± standard error). All group sizes are 10 animals/group except for male mice in the 5,000 ppm group where N = 7. bp ≤ 0.05. cp ≤ 0.01.
In F344/N rats, body weight and survival were not affected by THF exposure.
Immediately after exposure, clinical signs of ataxia, described as irregular movement with lack
of coordination, were observed in both male and female rats at 5,000 ppm only. In male and
female rats at 5,000 ppm, absolute and relative thymus (Table 4-1) and spleen weights were
statistically significantly decreased. In the 5,000 ppm exposure group, there were statistically
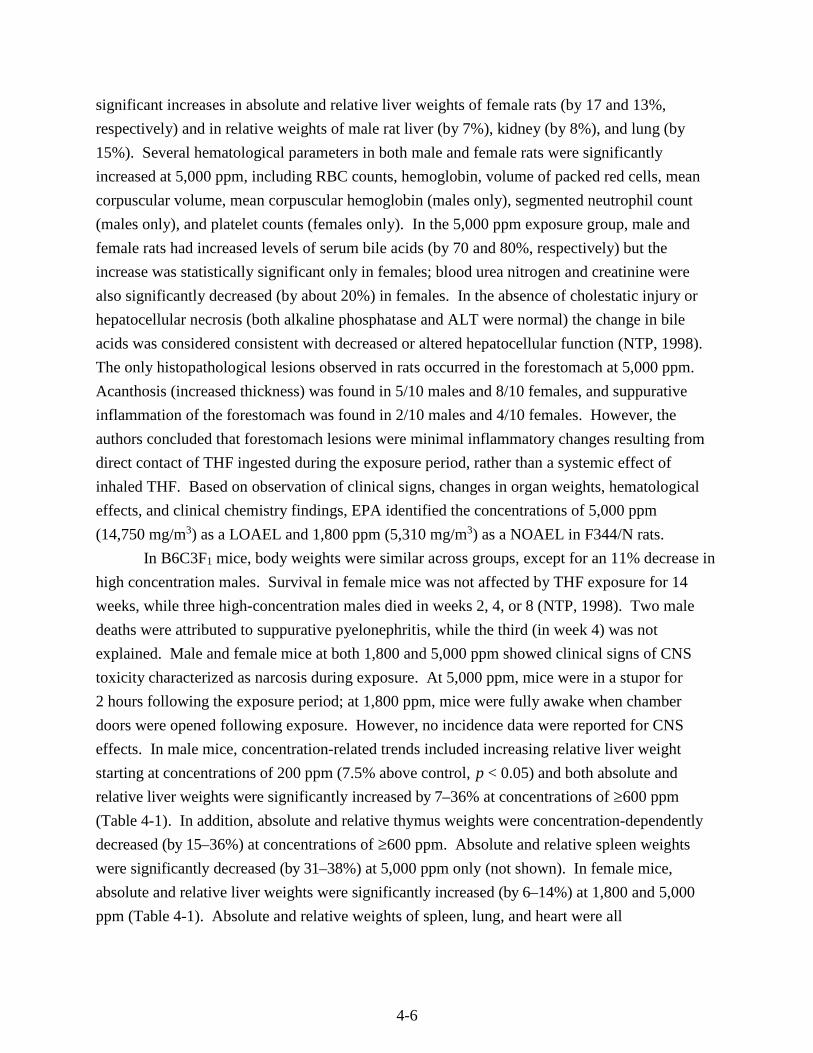
4-6
significant increases in absolute and relative liver weights of female rats (by 17 and 13%,
respectively) and in relative weights of male rat liver (by 7%), kidney (by 8%), and lung (by
15%). Several hematological parameters in both male and female rats were significantly
increased at 5,000 ppm, including RBC counts, hemoglobin, volume of packed red cells, mean
corpuscular volume, mean corpuscular hemoglobin (males only), segmented neutrophil count
(males only), and platelet counts (females only). In the 5,000 ppm exposure group, male and
female rats had increased levels of serum bile acids (by 70 and 80%, respectively) but the
increase was statistically significant only in females; blood urea nitrogen and creatinine were
also significantly decreased (by about 20%) in females. In the absence of cholestatic injury or
hepatocellular necrosis (both alkaline phosphatase and ALT were normal) the change in bile
acids was considered consistent with decreased or altered hepatocellular function (NTP, 1998).
The only histopathological lesions observed in rats occurred in the forestomach at 5,000 ppm.
Acanthosis (increased thickness) was found in 5/10 males and 8/10 females, and suppurative
inflammation of the forestomach was found in 2/10 males and 4/10 females. However, the
authors concluded that forestomach lesions were minimal inflammatory changes resulting from
direct contact of THF ingested during the exposure period, rather than a systemic effect of
inhaled THF. Based on observation of clinical signs, changes in organ weights, hematological
effects, and clinical chemistry findings, EPA identified the concentrations of 5,000 ppm
(14,750 mg/m3) as a LOAEL and 1,800 ppm (5,310 mg/m3) as a NOAEL in F344/N rats.
In B6C3F1 mice, body weights were similar across groups, except for an 11% decrease in
high concentration males. Survival in female mice was not affected by THF exposure for 14
weeks, while three high-concentration males died in weeks 2, 4, or 8 (NTP, 1998). Two male
deaths were attributed to suppurative pyelonephritis, while the third (in week 4) was not
explained. Male and female mice at both 1,800 and 5,000 ppm showed clinical signs of CNS
toxicity characterized as narcosis during exposure. At 5,000 ppm, mice were in a stupor for
2 hours following the exposure period; at 1,800 ppm, mice were fully awake when chamber
doors were opened following exposure. However, no incidence data were reported for CNS
effects. In male mice, concentration-related trends included increasing relative liver weight
starting at concentrations of 200 ppm (7.5% above control, p < 0.05) and both absolute and
relative liver weights were significantly increased by 7–36% at concentrations of ≥600 ppm
(Table 4-1). In addition, absolute and relative thymus weights were concentration-dependently
decreased (by 15–36%) at concentrations of ≥600 ppm. Absolute and relative spleen weights
were significantly decreased (by 31–38%) at 5,000 ppm only (not shown). In female mice,
absolute and relative liver weights were significantly increased (by 6–14%) at 1,800 and 5,000
ppm (Table 4-1). Absolute and relative weights of spleen, lung, and heart were all
4-7
significantly decreased at 5,000 ppm (not shown). Histopathological lesions in mice were
observed in liver, uterus, and adrenal gland (Table 4-2).
Table 4-2. Incidences of selected non-neoplastic lesions in B6C3F1 mice following subchronic inhalation exposure to THFa
Concentration (ppm)
0 66 200 600 1,800 5,000
Male mice
Liver
Cytomegaly, Centrilobular
0 −b − − 1 (1.0)c 7d (2.0)
Female mice
Adrenal Cortex
Degeneration, X-zone
0 − − − 0 10d (2.0)
Liver
Cytomegaly, Centrilobular
0 − − − 0 10d (1.0)
Uterus
Atrophy 0 − − − 0 10d (2.0)
aAll examined group sizes are 10 animals/group.bTissue not examined. cAverage severity grade of lesions in affected animals: 1 = minimal, 2 = mild, 3 = moderate, 4 = marked. dSignificantly different (p ≤ 0.01) from the control group by the Fisher’s exact test.
Source: Adapted from NTP (1998).
Liver centrilobular cytomegaly was observed in 7/10 male mice (graded mild) and
10/10 female mice (graded minimal) at 5,000 ppm (statistically significant) and 1/10 male mice
(graded minimal) at 1,800 ppm. In addition, 10/10 female mice at 5,000 ppm demonstrated
uterine atrophy and degenerative changes of the adrenal cortex. EPA identified the LOAEL for
this study as 1,800 ppm (5,310 mg/m3) based on statistically significant liver effects and clinical
signs of toxicity (narcosis); the NOAEL is 600 ppm (1,770 mg/m3).
BASF (Gamer et al., 2002; BASF, 2001a) evaluated a series of endpoints in male F344
rats (6/group plus 5/group) and female B6C3F1 mice (10/group plus 5) in tissues for which THF-
treated animals developed tumors in the NTP cancer bioassay (NTP, 1998). Animals were
placed in one of three groups that were exposed 6 hours/day for either 5 consecutive days,
5 consecutive days followed by a 21-day observation period, or 20 consecutive days over a
period of approximately 28 days. Test animals were exposed “nose only” to average THF
concentrations of 0, 598, 1,811, or 5,382 mg/m3 (0, 199, 604, or 1,794 ppm), corresponding to
4-8
the concentrations used in the NTP (1998) cancer bioassay. Concentrations adjusted for
continuous exposure were 0, 107, 323, or 961 mg/m3. For the animals in each of the four
concentration groups, a full necropsy was done, including histopathological evaluation of the
kidney (rat), liver (mouse), and uterus (mouse). No clinical effects, body weight changes, kidney
weight changes, or gross pathology related to THF exposures were reported for male rats. In the
low-concentration group, no gross or histopathological effects were observed. No clinical effects
or gross pathology changes related to the THF exposures were reported for female mice. In mice
exposed for 5 days, absolute and relative uterus weights were decreased in the high-
concentration group. In mice exposed for 5 days and followed for a 21-day recovery period,
relative uterus weights were decreased (up to 21%) and appeared to decrease in a concentration-
dependent manner, although this decrease was not statistically significant. In mice exposed for
20 days, statistically significant increases in absolute body weight (5%), absolute liver weight
(11%), and relative liver weight (6%) were reported. The absolute and relative uterus weights
were decreased by 11 and 15%, respectively. None of the uterus weight changes for any of the
groups were statistically significant. No treatment-related histopathological effects were
observed in the uterus at any concentration. Histopathological effects in the form of fatty
phanerosis (unmasking of previously invisible fat in the cytoplasm), especially in zones 3
(centrilobular) and 2 (midzonal), were observed in the livers of mice exposed to THF for 5 days
or 20 days, but not in mice that had 5 days of THF exposure followed by a 21-days recovery
period. Specifically, the study authors reported that fatty phanerosis was present in 5/10 and
10/10 animals exposed for 5 consecutive days at the mid and high THF concentration,
respectively. Similar fatty changes were also seen in livers from all mice that were exposed for
20 days to the high THF concentration. It should be noted that “fatty phanerosis” is an obsolete
term (Popjak, 1945) and that “fatty infiltration,” “fatty degeneration,” or “fatty change” may be
more appropriate to describe the morphological manifestation of altered fat metabolism of the
parenchyma cells. The report indicated that there were no additional liver changes including
cloudy swelling, vacuolar degeneration, or necrosis. Other histopathological changes in the
high-concentration 5-day exposure group included a change in the hepatocyte cytoplasm to a
more homogeneously eosinophilic appearance as compared with hepatocytes in control livers.
Kawata and Ito (1984) evaluated the health effects of THF following several different
inhalation exposure regimens. Male Wistar rats (5/control group and 25/experimental group)
were exposed to 15,000 ppm (44,250 mg/m3) THF for a single 30-minute exposure or for seven
30-minute daily exposures. Another group of rats were exposed to 3,000 ppm (8,850 mg/m3)
THF vapor for 1 hour/day, 5 days/week for 12 weeks. Animals were observed for clinical signs
and body weight. Blood was collected for serum chemistry analysis from animals exposed to
3,000 ppm only. The following tissues were collected for histopathology: brain, thymus, lung,
4-9
heart, liver, kidney, and spleen. Animals exposed to 15,000 ppm developed clinical signs of
face-washing, shaking head, and rubbing face with paws. These behaviors were weaker and had
shorter duration compared with those observed in rats that received repeated exposures (either
seven 30-minute exposures to 15,000 or 3,000 ppm for 12 weeks). In addition, rats receiving
seven exposures to 15,000 ppm developed irritation of skin and mucous membranes as evidenced
by severe salivation and nasal discharge. Rats exposed to 3,000 ppm for 12 weeks also
developed irritation symptoms that were milder than those observed at 15,000 ppm. No effects
on body weight were observed after either single or multiple exposures to 15,000 ppm.
However, by the fourth week of exposure, rats exposed to 3,000 ppm had significantly reduced
body weight compared with controls. Serum chemistry parameters were comparable between
treated and control animals. No histopathological lesions were observed in either of the groups
exposed to 15,000 ppm. In the animals exposed to 3,000 ppm, histopathological lesions were
observed in both lungs and kidney. Papillary hyperplasia and catarrhal (inflammation of mucus
membranes) degeneration were observed in lungs and bronchial epithelium. Protein casts and
hyaline droplet degeneration were observed in the kidney tubule lumen epithelium in kidneys.
Based on lung and kidney histopathological lesions, EPA identified 3,000 ppm (8,850 mg/m3) as
a LOAEL; a NOAEL was not established.
BASF (1938) investigated the subchronic effects of THF exposure in dogs. Four dogs
(strain and sex not specified) were exposed by inhalation to THF vapor at a concentration of
200 ppm (590 mg/m3) 6 hours/day, 5 days/week for 9 weeks, followed by exposure to a
concentration of 366 ppm (1,080 mg/m3) 6 hours/day, 5 days/week for 3 weeks. At the end of
the 12 weeks, two of the four dogs were exposed on 2 successive days to a THF concentration of
approximately 2,100 ppm (5,250 mg/m3). Blood pressure was measured in each dog in the
morning and afternoon for a 4-week pre-exposure control period and then before and after each
daily exposure during the 12-week exposure period. Hematology, urinalysis, and limited
pathological evaluations were also performed. Pulse pressure was decreased in 3/4 dogs
following exposure to 200 ppm during weeks 3–4 of the study. In addition, increasing the THF
concentration to 366 ppm resulted in a decrease in blood pressure compared to the control period
in 3/4 dogs. In the two dogs exposed to 2,100 ppm THF, a “sharp drop” in systolic, diastolic,
and pulse pressure was reported by the study authors after the second day of exposure. No signs
of narcosis or eye or respiratory tract irritation were observed in these two dogs. In one dog,
hemoglobin decreased and white blood cells increased compared to the control levels. However,
examination of the urine did not reveal any abnormality in kidney function. No gross or
microscopic pathology was observed in the heart, lungs, spleen, pancreas, or kidneys of any of
the dogs. Based on alterations in blood pressure, the study authors (BASF, 1938) reported a
LOAEL of 200 ppm (590 mg/m3).
4-10
4.2.2. Chronic Studies and Cancer Bioassays
4.2.2.1. Oral
No chronic studies in animals by the oral route of exposure were identified.
4.2.2.2. Inhalation
Stasenkova and Kochetkova (1963) evaluated the effects of a 6-month inhalation
exposure on rats. Male rats (20/group, strain not specified) in a single exposure group were
exposed to air concentrations of 1–2 mg/L (1,000–2,000 mg/m3) 4 hours/day, 7 days/week for
6 months. Endpoints evaluated included clinical signs, body weight changes, blood cell count,
blood pressure, and functional condition of the neurovascular system, liver, and kidney. At the
end of the 6-month treatment period, animals were sacrificed and histopathological examination
of major organs was conducted. No effects were observed on behavior, body weight, liver and
kidney function, or neuromuscular irritability of treated rats compared with controls. Within 2–
3 months of treatment, exposed rats developed increased numbers of leukocytes, which remained
elevated compared with controls for the remainder of the experimental period. After 3–
4 months, blood pressure in treated rats was reduced compared to controls, and this observation
continued for the remainder of the treatment period. Histopathological lesions included mild
hypertrophy in the muscle fibers of the bronchi walls and arteries of lungs and spleen. Because
of poor reporting of this study, no NOAEL or LOAEL can be identified.
NTP (1998) reported on the chronic toxicity and carcinogenicity of THF inhalation
exposure in rats and mice. In the 2-year study, groups of F344/N rats and B6C3F1 mice
(50/sex/group) were exposed to 0, 200, 600, or 1,800 ppm (0, 590, 1,770, or 5,310 mg/m3) THF
6 hours/day, 5 days/week for 105 weeks. Survival of treated rats was comparable to chamber
controls at all exposure levels. Neither mean body weight differences nor clinical findings
related to THF exposure were reported for either male or female rats. Pathology noted at
sacrifice in male rats included apparent increases of renal tubular epithelial adenoma (at 600 and
1,800 ppm) and two renal tubular epithelial carcinomas (at 1,800 ppm), which, when combined
with the adenomas, suggested a treatment-related trend. The incidences of adenoma or
carcinoma in the 600 and 1,800 ppm males exceeded the historical range for chamber controls in
the 2-year NTP (1998) inhalation studies, and the overall trend was statistically significant (p =
0.037). Table 4-3 summarizes the incidence of neoplastic and non-neoplastic changes in the
kidney of male rats. No treatment-related changes in the incidence of neoplastic or non-
neoplastic lesions in other tissues in the male or female rats were observed.
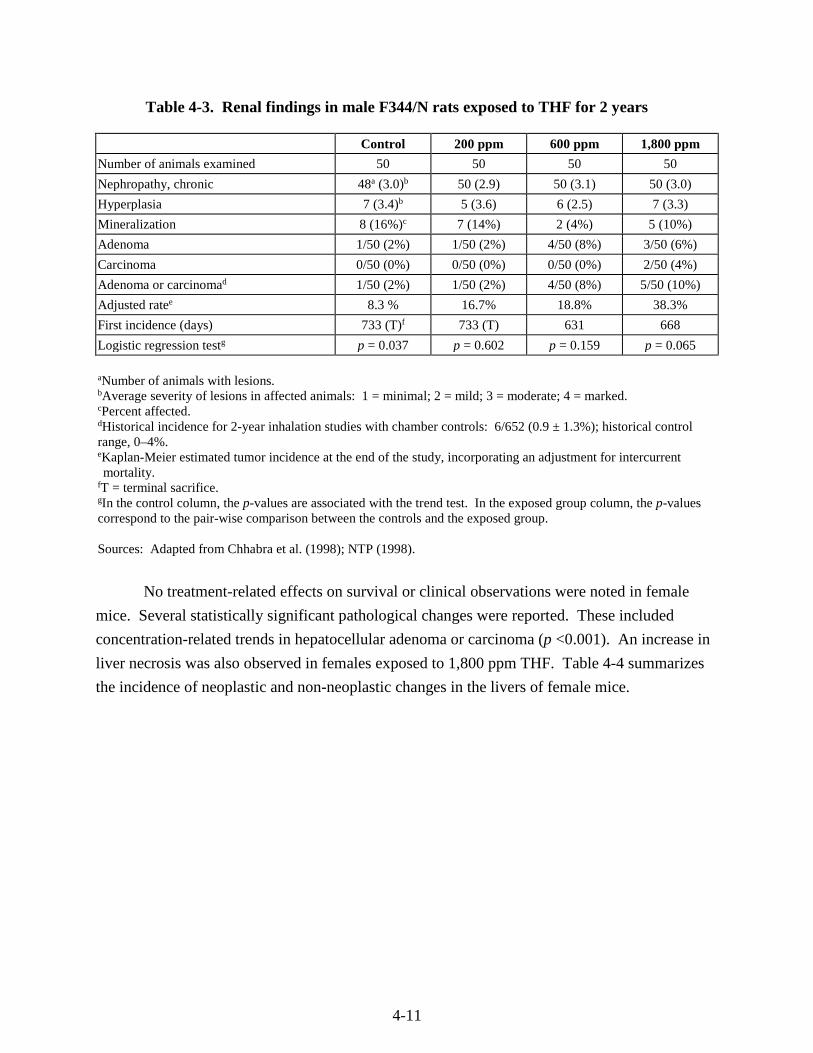
4-11
Table 4-3. Renal findings in male F344/N rats exposed to THF for 2 years
Control 200 ppm 600 ppm 1,800 ppm
Number of animals examined 50 50 50 50
Nephropathy, chronic 48a (3.0)b 50 (2.9) 50 (3.1) 50 (3.0)
Hyperplasia 7 (3.4)b 5 (3.6) 6 (2.5) 7 (3.3)
Mineralization 8 (16%)c 7 (14%) 2 (4%) 5 (10%)
Adenoma 1/50 (2%) 1/50 (2%) 4/50 (8%) 3/50 (6%)
Carcinoma 0/50 (0%) 0/50 (0%) 0/50 (0%) 2/50 (4%)
Adenoma or carcinomad 1/50 (2%) 1/50 (2%) 4/50 (8%) 5/50 (10%)
Adjusted ratee 8.3 % 16.7% 18.8% 38.3%
First incidence (days) 733 (T)f 733 (T) 631 668
Logistic regression testg p = 0.037 p = 0.602 p = 0.159 p = 0.065
aNumber of animals with lesions. bAverage severity of lesions in affected animals: 1 = minimal; 2 = mild; 3 = moderate; 4 = marked. cPercent affected. dHistorical incidence for 2-year inhalation studies with chamber controls: 6/652 (0.9 ± 1.3%); historical control range, 0–4%. eKaplan-Meier estimated tumor incidence at the end of the study, incorporating an adjustment for intercurrent mortality.
fT = terminal sacrifice. gIn the control column, the p-values are associated with the trend test. In the exposed group column, the p-values correspond to the pair-wise comparison between the controls and the exposed group. Sources: Adapted from Chhabra et al. (1998); NTP (1998).
No treatment-related effects on survival or clinical observations were noted in female
mice. Several statistically significant pathological changes were reported. These included
concentration-related trends in hepatocellular adenoma or carcinoma (p <0.001). An increase in
liver necrosis was also observed in females exposed to 1,800 ppm THF. Table 4-4 summarizes
the incidence of neoplastic and non-neoplastic changes in the livers of female mice.
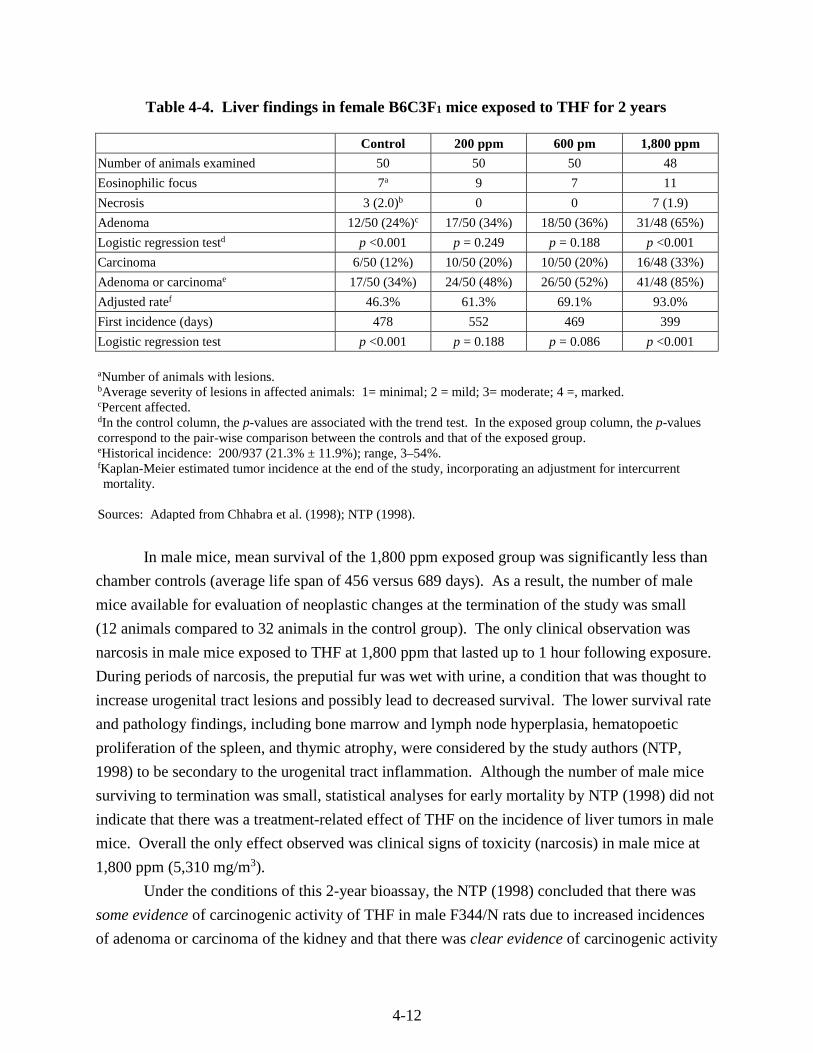
4-12
Table 4-4. Liver findings in female B6C3F1 mice exposed to THF for 2 years
Control 200 ppm 600 pm 1,800 ppm
Number of animals examined 50 50 50 48
Eosinophilic focus 7a 9 7 11
Necrosis 3 (2.0)b 0 0 7 (1.9)
Adenoma 12/50 (24%)c 17/50 (34%) 18/50 (36%) 31/48 (65%)
Logistic regression testd p <0.001 p = 0.249 p = 0.188 p <0.001
Carcinoma 6/50 (12%) 10/50 (20%) 10/50 (20%) 16/48 (33%)
Adenoma or carcinomae 17/50 (34%) 24/50 (48%) 26/50 (52%) 41/48 (85%)
Adjusted ratef 46.3% 61.3% 69.1% 93.0%
First incidence (days) 478 552 469 399
Logistic regression test p <0.001 p = 0.188 p = 0.086 p <0.001
aNumber of animals with lesions. bAverage severity of lesions in affected animals: 1= minimal; 2 = mild; 3= moderate; 4 =, marked. cPercent affected. dIn the control column, the p-values are associated with the trend test. In the exposed group column, the p-values correspond to the pair-wise comparison between the controls and that of the exposed group. eHistorical incidence: 200/937 (21.3% ± 11.9%); range, 3–54%. fKaplan-Meier estimated tumor incidence at the end of the study, incorporating an adjustment for intercurrent mortality.
Sources: Adapted from Chhabra et al. (1998); NTP (1998).
In male mice, mean survival of the 1,800 ppm exposed group was significantly less than
chamber controls (average life span of 456 versus 689 days). As a result, the number of male
mice available for evaluation of neoplastic changes at the termination of the study was small
(12 animals compared to 32 animals in the control group). The only clinical observation was
narcosis in male mice exposed to THF at 1,800 ppm that lasted up to 1 hour following exposure.
During periods of narcosis, the preputial fur was wet with urine, a condition that was thought to
increase urogenital tract lesions and possibly lead to decreased survival. The lower survival rate
and pathology findings, including bone marrow and lymph node hyperplasia, hematopoetic
proliferation of the spleen, and thymic atrophy, were considered by the study authors (NTP,
1998) to be secondary to the urogenital tract inflammation. Although the number of male mice
surviving to termination was small, statistical analyses for early mortality by NTP (1998) did not
indicate that there was a treatment-related effect of THF on the incidence of liver tumors in male
mice. Overall the only effect observed was clinical signs of toxicity (narcosis) in male mice at
1,800 ppm (5,310 mg/m3).
Under the conditions of this 2-year bioassay, the NTP (1998) concluded that there was
some evidence of carcinogenic activity of THF in male F344/N rats due to increased incidences
of adenoma or carcinoma of the kidney and that there was clear evidence of carcinogenic activity
4-13
of THF in female B6C3F1 mice due to increased incidences of hepatocellular adenomas or
carcinomas.
4.3. REPRODUCTIVE/DEVELOPMENTAL TOXICITY STUDIES—ORAL AND
INHALATION
4.3.1. Oral
BASF (1994) reported the results of a one-generation reproductive toxicity range-finding
study in rats given THF in drinking water. Male and female Wistar rats (10/sex/dose) were
given THF at concentrations of 0, 4,000, 8,000, or 12,000 ppm in drinking water for 7 weeks
prior to mating and throughout cohabitation, gestation, and lactation. THF intake values
estimated from measured water consumption and body weights are shown in Table 4-5. The F0
females were allowed to litter and rear pups (F1 generation) for 4 days postpartum, at which time
the litters were culled to eight pups/litter (ideally four of each sex). Culled pups were sacrificed
and examined for gross pathologic lesions, and the surviving F1 pups were sacrificed after
weaning on postnatal day (PND) 21. Clinical chemistry, hematology, and urinalysis parameters
were measured in the F0 animals near the end of the study (approximately 12 weeks from
initiating exposure), after which the F0 animals were sacrificed and assessed for gross pathology.
Key treatment-related findings are also summarized in Table 4-5.
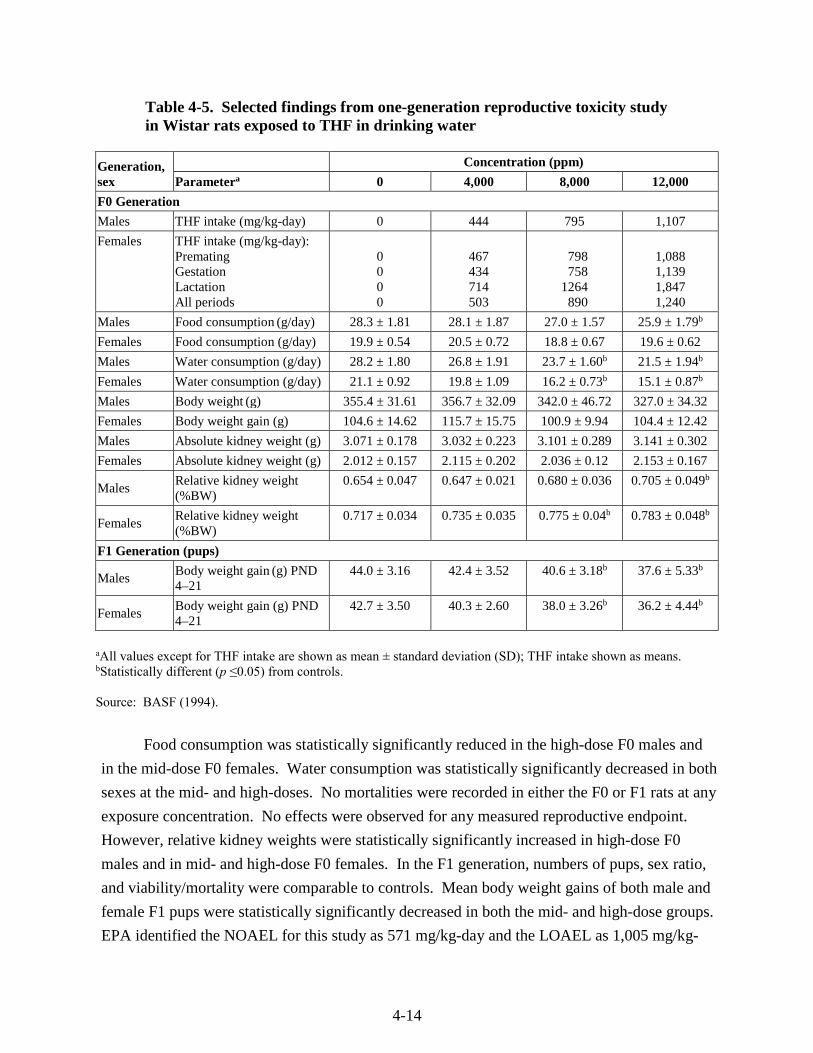
4-14
Table 4-5. Selected findings from one-generation reproductive toxicity study in Wistar rats exposed to THF in drinking water
Generation, sex
Concentration (ppm)
Parametera 0 4,000 8,000 12,000
F0 Generation
Males THF intake (mg/kg-day) 0 444 795 1,107
Females THF intake (mg/kg-day): Premating Gestation Lactation All periods
0 0 0 0
467 434 714 503
798 758 1264 890
1,088 1,139 1,847 1,240
Males Food consumption (g/day) 28.3 ± 1.81 28.1 ± 1.87 27.0 ± 1.57 25.9 ± 1.79b
Females Food consumption (g/day) 19.9 ± 0.54 20.5 ± 0.72 18.8 ± 0.67 19.6 ± 0.62
Males Water consumption (g/day) 28.2 ± 1.80 26.8 ± 1.91 23.7 ± 1.60b 21.5 ± 1.94b
Females Water consumption (g/day) 21.1 ± 0.92 19.8 ± 1.09 16.2 ± 0.73b 15.1 ± 0.87b
Males Body weight (g) 355.4 ± 31.61 356.7 ± 32.09 342.0 ± 46.72 327.0 ± 34.32
Females Body weight gain (g) 104.6 ± 14.62 115.7 ± 15.75 100.9 ± 9.94 104.4 ± 12.42
Males Absolute kidney weight (g) 3.071 ± 0.178 3.032 ± 0.223 3.101 ± 0.289 3.141 ± 0.302
Females Absolute kidney weight (g) 2.012 ± 0.157 2.115 ± 0.202 2.036 ± 0.12 2.153 ± 0.167
Males Relative kidney weight (%BW)
0.654 ± 0.047 0.647 ± 0.021 0.680 ± 0.036 0.705 ± 0.049b
Females Relative kidney weight (%BW)
0.717 ± 0.034 0.735 ± 0.035 0.775 ± 0.04b 0.783 ± 0.048b
F1 Generation (pups)
Males Body weight gain (g) PND 4–21
44.0 ± 3.16 42.4 ± 3.52 40.6 ± 3.18b 37.6 ± 5.33b
Females Body weight gain (g) PND 4–21
42.7 ± 3.50 40.3 ± 2.60 38.0 ± 3.26b 36.2 ± 4.44b
aAll values except for THF intake are shown as mean ± standard deviation (SD); THF intake shown as means. bStatistically different (p ≤0.05) from controls.
Source: BASF (1994).
Food consumption was statistically significantly reduced in the high-dose F0 males and
in the mid-dose F0 females. Water consumption was statistically significantly decreased in both
sexes at the mid- and high-doses. No mortalities were recorded in either the F0 or F1 rats at any
exposure concentration. No effects were observed for any measured reproductive endpoint.
However, relative kidney weights were statistically significantly increased in high-dose F0
males and in mid- and high-dose F0 females. In the F1 generation, numbers of pups, sex ratio,
and viability/mortality were comparable to controls. Mean body weight gains of both male and
female F1 pups were statistically significantly decreased in both the mid- and high-dose groups.
EPA identified the NOAEL for this study as 571 mg/kg-day and the LOAEL as 1,005 mg/kg-
4-15
day based on decreased pup body weight gain and using time-weighted average maternal THF
intake during gestation and lactation.
The results from this range-finding study were used to select dose levels for a two-
generation developmental and reproductive toxicity study of THF administered to rats in
drinking water (Hellwig et al., 2002; BASF, 1996). Wistar rats (25/sex/group) received THF in
their drinking water at concentrations of 0, 1,000, 3,000, or 9,000 ppm for 70 days prior to
mating and throughout cohabitation, gestation, and lactation. THF intake values estimated from
measured water consumption and body weights are shown in Table 4-6. Before weaning,
25 F1 pups/sex/group were randomly selected to be the F1 parental animals. The remaining
F1 pups were sacrificed. After the F1 generation pups were weaned, the F0 animals were
sacrificed. The F1 animals were exposed continuously to THF at the same concentrations as
their parents from weaning and throughout cohabitation, gestation, and lactation. THF intake
values estimated from measured water consumption and body weights are shown in Table 4-6.
Endpoints evaluated in F0 and F1 parental animals included food and water consumption,
body weight, mortality, and clinical signs. In addition, necropsy was performed on all parental
animals at sacrifice, and organ weights were obtained for kidney, liver, testes, and epididymis.
Histopathology was performed on all gross lesions, liver, kidney, reproductive organs, and GI
organs of sacrificed parental animals. Reproductive endpoints evaluated include mating index,
fertility index, gestation index, and live birth index. Litter/delivery endpoints for both F1 and F2
generations included total number of pups, number of live and stillborn pups, sex ratio, clinical
signs, body weight, viability index, and lactation index. In addition, pups were evaluated for
developmental stages (pinna unfolding, opening of auditory canal, opening of eyes) and
behavioral tests (grip reflex, acoustic startle, and pupil constriction). Culled pups, surplus pups,
and all pups that died before weaning were assessed macroscopically and, if abnormalities were
found, were evaluated by skeletal staining and histological processing of the head. Key
treatment-related findings are summarized in Table 4-6.
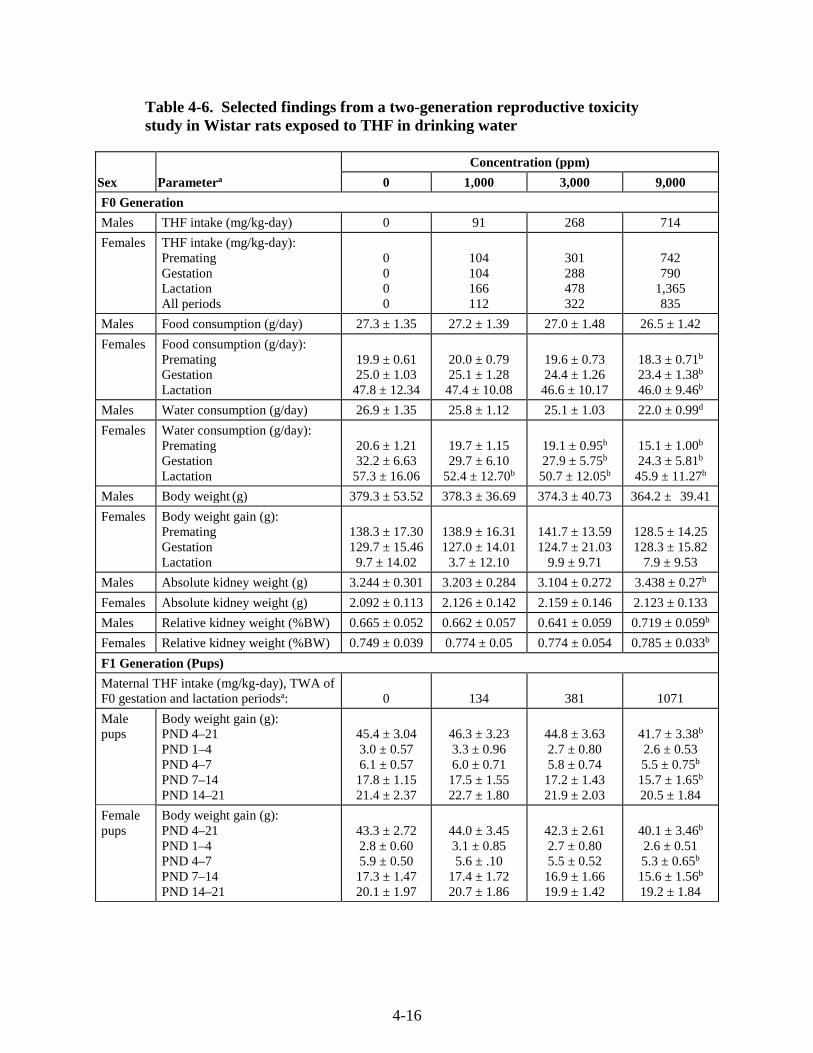
4-16
Table 4-6. Selected findings from a two-generation reproductive toxicity study in Wistar rats exposed to THF in drinking water
Sex Parametera
Concentration (ppm)
0 1,000 3,000 9,000
F0 Generation
Males THF intake (mg/kg-day) 0 91 268 714
Females THF intake (mg/kg-day): Premating Gestation Lactation All periods
0 0 0 0
104 104 166 112
301 288 478 322
742 790
1,365 835
Males Food consumption (g/day) 27.3 ± 1.35 27.2 ± 1.39 27.0 ± 1.48 26.5 ± 1.42
Females Food consumption (g/day): Premating Gestation Lactation
19.9 ± 0.61 25.0 ± 1.03
47.8 ± 12.34
20.0 ± 0.79 25.1 ± 1.28
47.4 ± 10.08
19.6 ± 0.73 24.4 ± 1.26
46.6 ± 10.17
18.3 ± 0.71b 23.4 ± 1.38b 46.0 ± 9.46b
Males Water consumption (g/day) 26.9 ± 1.35 25.8 ± 1.12 25.1 ± 1.03 22.0 ± 0.99d
Females Water consumption (g/day): Premating Gestation Lactation
20.6 ± 1.21 32.2 ± 6.63
57.3 ± 16.06
19.7 ± 1.15 29.7 ± 6.10
52.4 ± 12.70b
19.1 ± 0.95b 27.9 ± 5.75b
50.7 ± 12.05b
15.1 ± 1.00b 24.3 ± 5.81b
45.9 ± 11.27b
Males Body weight (g) 379.3 ± 53.52 378.3 ± 36.69 374.3 ± 40.73 364.2 ± 39.41
Females Body weight gain (g): Premating Gestation Lactation
138.3 ± 17.30 129.7 ± 15.46 9.7 ± 14.02
138.9 ± 16.31 127.0 ± 14.01
3.7 ± 12.10
141.7 ± 13.59 124.7 ± 21.03
9.9 ± 9.71
128.5 ± 14.25 128.3 ± 15.82
7.9 ± 9.53
Males Absolute kidney weight (g) 3.244 ± 0.301 3.203 ± 0.284 3.104 ± 0.272 3.438 ± 0.27b
Females Absolute kidney weight (g) 2.092 ± 0.113 2.126 ± 0.142 2.159 ± 0.146 2.123 ± 0.133
Males Relative kidney weight (%BW) 0.665 ± 0.052 0.662 ± 0.057 0.641 ± 0.059 0.719 ± 0.059b
Females Relative kidney weight (%BW) 0.749 ± 0.039 0.774 ± 0.05 0.774 ± 0.054 0.785 ± 0.033b
F1 Generation (Pups)
Maternal THF intake (mg/kg-day), TWA of F0 gestation and lactation periodsa:
0
134
381
1071
Male pups
Body weight gain (g): PND 4–21 PND 1–4 PND 4–7 PND 7–14 PND 14–21
45.4 ± 3.04 3.0 ± 0.57 6.1 ± 0.57
17.8 ± 1.15 21.4 ± 2.37
46.3 ± 3.23 3.3 ± 0.96 6.0 ± 0.71
17.5 ± 1.55 22.7 ± 1.80
44.8 ± 3.63 2.7 ± 0.80 5.8 ± 0.74
17.2 ± 1.43 21.9 ± 2.03
41.7 ± 3.38b 2.6 ± 0.53 5.5 ± 0.75b 15.7 ± 1.65b 20.5 ± 1.84
Female pups
Body weight gain (g): PND 4–21 PND 1–4 PND 4–7 PND 7–14 PND 14–21
43.3 ± 2.72 2.8 ± 0.60 5.9 ± 0.50
17.3 ± 1.47 20.1 ± 1.97
44.0 ± 3.45 3.1 ± 0.85 5.6 ± .10
17.4 ± 1.72 20.7 ± 1.86
42.3 ± 2.61 2.7 ± 0.80 5.5 ± 0.52
16.9 ± 1.66 19.9 ± 1.42
40.1 ± 3.46b 2.6 ± 0.51 5.3 ± 0.65b 15.6 ± 1.56b 19.2 ± 1.84
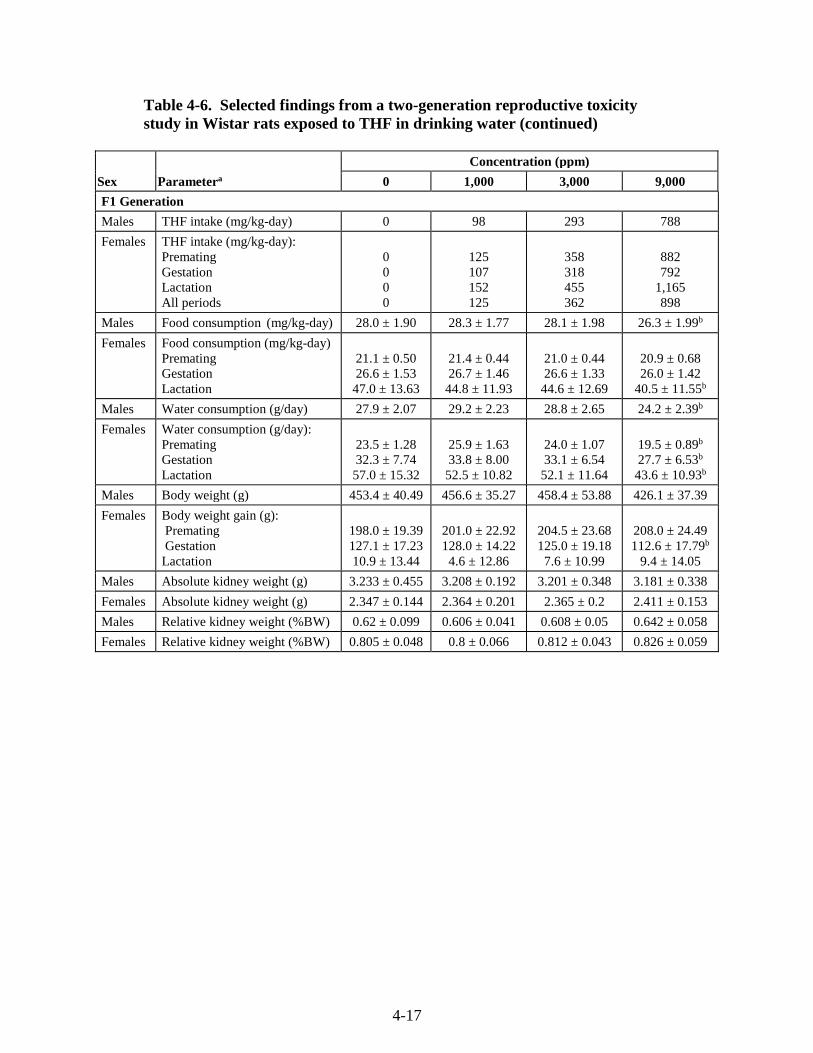
4-17
Table 4-6. Selected findings from a two-generation reproductive toxicity study in Wistar rats exposed to THF in drinking water (continued)
Sex Parametera
Concentration (ppm)
0 1,000 3,000 9,000
F1 Generation
Males THF intake (mg/kg-day) 0 98 293 788
Females THF intake (mg/kg-day): Premating Gestation Lactation All periods
0 0 0 0
125 107 152 125
358 318 455 362
882 792
1,165 898
Males Food consumption (mg/kg-day) 28.0 ± 1.90 28.3 ± 1.77 28.1 ± 1.98 26.3 ± 1.99b
Females Food consumption (mg/kg-day) Premating Gestation Lactation
21.1 ± 0.50 26.6 ± 1.53
47.0 ± 13.63
21.4 ± 0.44 26.7 ± 1.46
44.8 ± 11.93
21.0 ± 0.44 26.6 ± 1.33
44.6 ± 12.69
20.9 ± 0.68 26.0 ± 1.42
40.5 ± 11.55b
Males Water consumption (g/day) 27.9 ± 2.07 29.2 ± 2.23 28.8 ± 2.65 24.2 ± 2.39b
Females Water consumption (g/day): Premating Gestation Lactation
23.5 ± 1.28 32.3 ± 7.74 57.0 ± 15.32
25.9 ± 1.63 33.8 ± 8.00
52.5 ± 10.82
24.0 ± 1.07 33.1 ± 6.54
52.1 ± 11.64
19.5 ± 0.89b
27.7 ± 6.53b 43.6 ± 10.93b
Males Body weight (g) 453.4 ± 40.49 456.6 ± 35.27 458.4 ± 53.88 426.1 ± 37.39
Females Body weight gain (g): Premating Gestation Lactation
198.0 ± 19.39 127.1 ± 17.23 10.9 ± 13.44
201.0 ± 22.92 128.0 ± 14.22 4.6 ± 12.86
204.5 ± 23.68 125.0 ± 19.18 7.6 ± 10.99
208.0 ± 24.49 112.6 ± 17.79b
9.4 ± 14.05
Males Absolute kidney weight (g) 3.233 ± 0.455 3.208 ± 0.192 3.201 ± 0.348 3.181 ± 0.338
Females Absolute kidney weight (g) 2.347 ± 0.144 2.364 ± 0.201 2.365 ± 0.2 2.411 ± 0.153
Males Relative kidney weight (%BW) 0.62 ± 0.099 0.606 ± 0.041 0.608 ± 0.05 0.642 ± 0.058
Females Relative kidney weight (%BW) 0.805 ± 0.048 0.8 ± 0.066 0.812 ± 0.043 0.826 ± 0.059
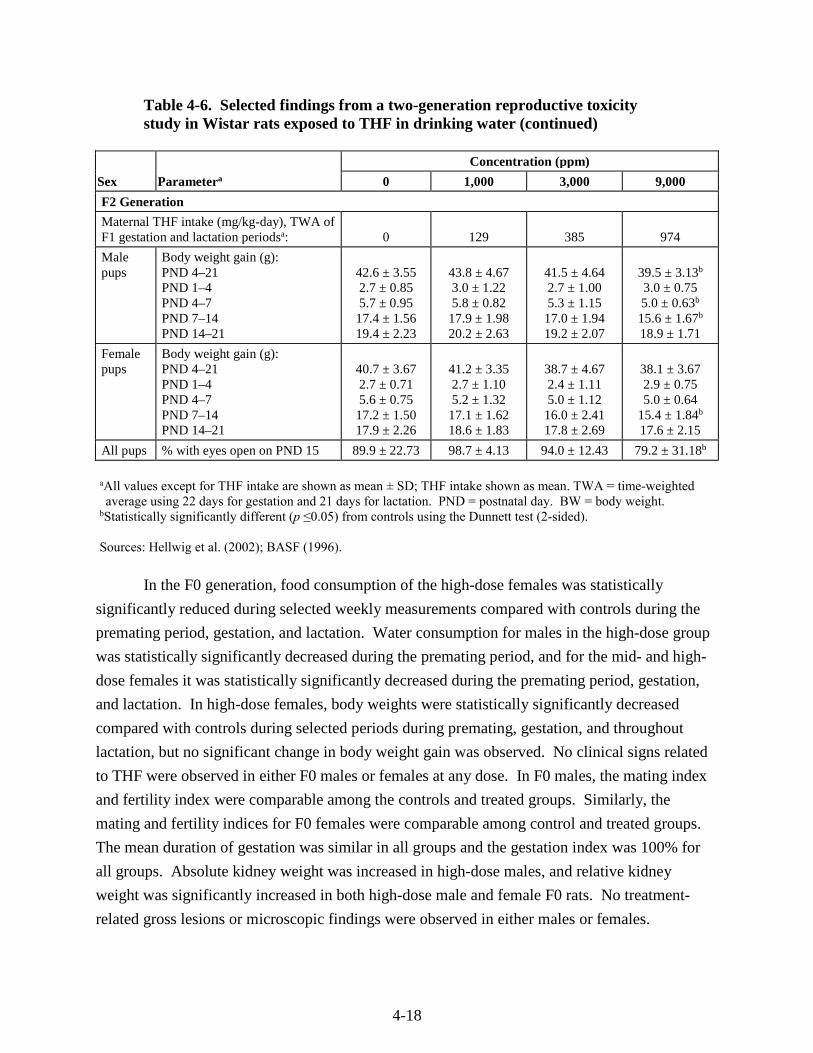
4-18
Table 4-6. Selected findings from a two-generation reproductive toxicity study in Wistar rats exposed to THF in drinking water (continued)
Sex Parametera
Concentration (ppm)
0 1,000 3,000 9,000
F2 Generation
Maternal THF intake (mg/kg-day), TWA of F1 gestation and lactation periodsa: 0 129 385 974
Male pups
Body weight gain (g): PND 4–21 PND 1–4 PND 4–7 PND 7–14 PND 14–21
42.6 ± 3.55 2.7 ± 0.85 5.7 ± 0.95
17.4 ± 1.56 19.4 ± 2.23
43.8 ± 4.67 3.0 ± 1.22 5.8 ± 0.82
17.9 ± 1.98 20.2 ± 2.63
41.5 ± 4.64 2.7 ± 1.00 5.3 ± 1.15
17.0 ± 1.94 19.2 ± 2.07
39.5 ± 3.13b 3.0 ± 0.75 5.0 ± 0.63b 15.6 ± 1.67b 18.9 ± 1.71
Female pups
Body weight gain (g): PND 4–21 PND 1–4 PND 4–7 PND 7–14 PND 14–21
40.7 ± 3.67 2.7 ± 0.71 5.6 ± 0.75
17.2 ± 1.50 17.9 ± 2.26
41.2 ± 3.35 2.7 ± 1.10 5.2 ± 1.32
17.1 ± 1.62 18.6 ± 1.83
38.7 ± 4.67 2.4 ± 1.11 5.0 ± 1.12
16.0 ± 2.41 17.8 ± 2.69
38.1 ± 3.67 2.9 ± 0.75 5.0 ± 0.64
15.4 ± 1.84b 17.6 ± 2.15
All pups % with eyes open on PND 15 89.9 ± 22.73 98.7 ± 4.13 94.0 ± 12.43 79.2 ± 31.18b
aAll values except for THF intake are shown as mean ± SD; THF intake shown as mean. TWA = time-weighted average using 22 days for gestation and 21 days for lactation. PND = postnatal day. BW = body weight.
bStatistically significantly different (p ≤0.05) from controls using the Dunnett test (2-sided).
Sources: Hellwig et al. (2002); BASF (1996).
In the F0 generation, food consumption of the high-dose females was statistically
significantly reduced during selected weekly measurements compared with controls during the
premating period, gestation, and lactation. Water consumption for males in the high-dose group
was statistically significantly decreased during the premating period, and for the mid- and high-
dose females it was statistically significantly decreased during the premating period, gestation,
and lactation. In high-dose females, body weights were statistically significantly decreased
compared with controls during selected periods during premating, gestation, and throughout
lactation, but no significant change in body weight gain was observed. No clinical signs related
to THF were observed in either F0 males or females at any dose. In F0 males, the mating index
and fertility index were comparable among the controls and treated groups. Similarly, the
mating and fertility indices for F0 females were comparable among control and treated groups.
The mean duration of gestation was similar in all groups and the gestation index was 100% for
all groups. Absolute kidney weight was increased in high-dose males, and relative kidney
weight was significantly increased in both high-dose male and female F0 rats. No treatment-
related gross lesions or microscopic findings were observed in either males or females.
4-19
The total number of F1 pups delivered, the number of live and stillborn pups, and the sex
ratio were comparable among the groups. In the low-dose group, nine F1 pups from a single
litter died between days 1 and 10. Also, two dams in the mid-dose group cannibalized pups.
Therefore, the lactation index for these dose groups is statistically significantly decreased
compared to controls. However, the authors concluded that this decrease is not related to
administration of THF, because there was no dose-response relationship. The mean body
weights and body weight gains of the F1 pups in the high-dose group were significantly
decreased during PNDs 4–7 and PNDs 7–14. The treated F1 pups did not demonstrate any
clinical signs, changes in developmental stages, changes on behavioral tests, or findings on
necropsy compared with controls.
Food consumption was significantly decreased in high-dose F1 male adult rats during the
premating period and in high-dose F1 female rats during lactation. Water consumption was
significantly decreased in high-dose F1 male rats during the premating period and in the high-
dose F1 females during the premating period, gestation, and lactation. In high-dose F1 males,
slight but significant decreases in body weight were observed throughout the study, but no effect
on body weight gain was observed. No effects on body weight or body weight gain were
observed in F1 female adults. No clinical signs related to THF were observed in either F1 males
or females at any dose. In F1 males and females, the mating and fertility indices were
comparable among the controls and treated groups. The mean duration of gestation was similar
in all groups, and the gestation index was 100% for all groups. No treatment-related effects on
organ weight, gross lesions, or microscopic findings were observed in either the male or female
F1 adult rats at any exposure concentration.
The mean number of delivered F2 pups/litter was decreased 16% in the high-dose group
compared with control (12.4, 13.0, 12.9, and 10.4 in the 0, 1,000, 3,000, and 9,000 ppm dose
groups, respectively) and was outside the range of historical control values of 11.1–16.4
(Hellwig et al., 2002; BASF, 1996). The study authors concluded that this was a spontaneous
finding and was not related to treatment since it was not seen in the F0 generation or in the range-
finding study; the decrease was limited to a few litters with ≤6 pups/litter (BASF, 1996). Data
on the number of implantations and resorptions were not reported. Also, one F1 parental male
rat in the high dose group was found to be infertile which, in the absence of corroborating
histopathology findings, was considered a spontaneous finding (BASF, 1996). The number of
stillborn pups was statistically significantly increased in the two lower dose groups, but not in the
high-dose group. Based on the lack of dose-response relationship, the authors concluded that all
of these findings were spontaneous and not related to THF administration. In the low- and mid-
dose groups, there was an increase in the number of pups cannibalized or dead before scheduled
sacrifice. As a result, the viability index was statistically significantly decreased in the low-dose
4-20
group; the viability indices for the mid- and high-dose groups were comparable to controls.
Body weight gain was statistically significantly reduced in the high-dose male and female F2
pups during PNDs 7–14. A significant number of F2 pups/litter in the high dose group had
delayed opening of eyes (% with eyes open on PND 15); 79 compared to 90% in controls,
historical control range 85–100%). Also, there was an increase in the number of sloped incisors
in the high dose F2 litters (mean 1.5% of pups/litter compared to 0% in controls; historical
control range 0–2.9%). The study authors considered this finding to be consistent with a slight
developmental delay (Hellwig et al., 2002). The mean percentage of F2 pups/litter with open
auditory canal was 96.4, 100, 88.9, and 98.9% in the 0, 1,000, 3,000, and 9,000 ppm dose
groups, respectively. This finding was discounted by the study authors because it was not dose-
related and the statistically significantly different value of 88.9% in the mid-dose group fell
within the historical control range of 81–100%. Values for lactation index, sex ratio, clinical
signs, behavioral tests, and necropsy findings were comparable between controls and treated
animals.
In the high dose groups, general toxicity was indicated by slight to marginal decreased
food consumption, decreased body weight, and increased kidney weight in F0 adults and
decreased food consumption and body weight gain in F1 adults. However, decreased adult body
weights were only observed during selected periods during the study, were of minimal severity,
and were not generally reflected by changes in body weight gain. Therefore, the adult body
weight changes were not considered to be of sufficient magnitude to identify an adverse effect
level.
No clinical signs (in the one- or two-generation studies) or clinical chemistry changes
(only measured in the one-generation study) consistent with dehydration were observed,
suggesting that the decrease in water consumption was not inducing changes in maternal health.
The study authors stated that the reduced water consumption observed in the mid- and high-dose
F0 and high-dose F1 parental rats was most likely due to reduced palatability of the THF in
drinking water. The reduction in water intake averaged 7% during premating and 12–14%
during gestation and lactation following exposure to 3,000 ppm THF. There were no
corresponding decreases in food consumption at this dose during these time periods. Thus,
Hellwig et al. (2002) concluded that the reduction in water consumption was biologically
insignificant and that the NOAEL for systemic toxicity (increased relative kidney weight, body
weight gain, and food consumption) in F0 and F1 parental rats was 3,000 ppm.
Pup body weight gain was reduced at the high dose during PNDs 4–7 and 7–14 in both
F1 and F2 pups. This reduction in weight gain may be due to reduced maternal milk production,
but the study authors indicated that it was not related to maternal body weight or water
consumption. Specifically, maternal body weight was reduced significantly in the F0 dams and
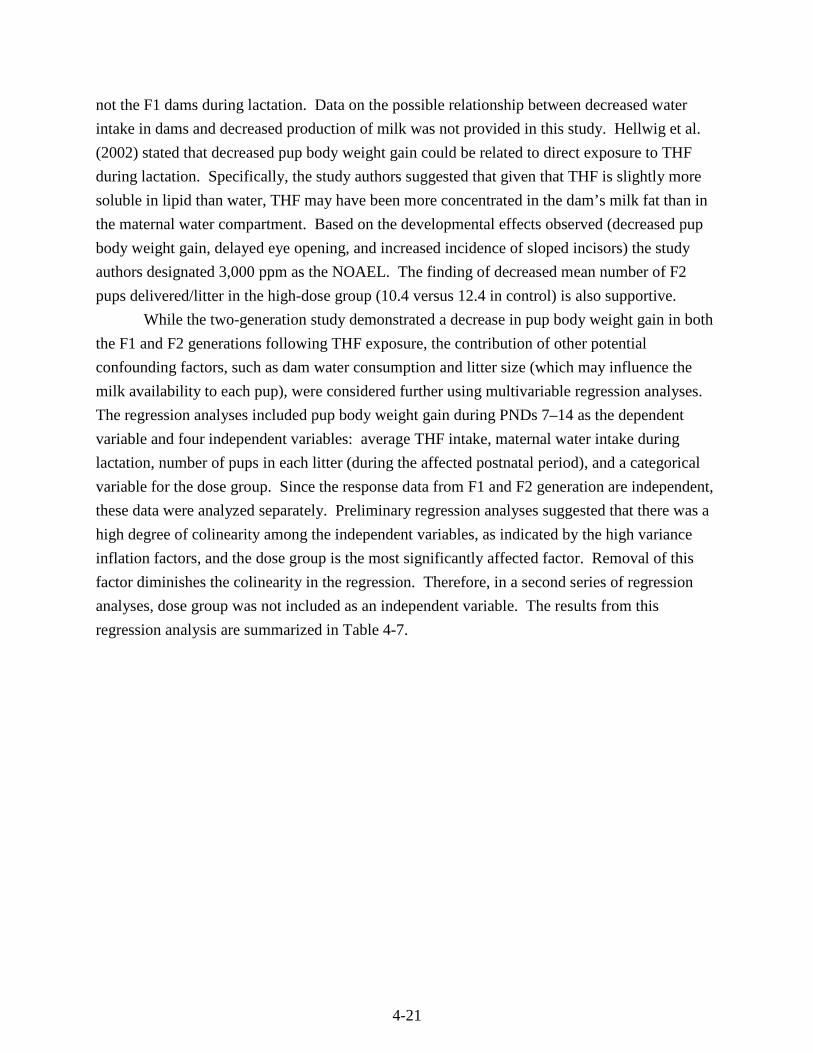
4-21
not the F1 dams during lactation. Data on the possible relationship between decreased water
intake in dams and decreased production of milk was not provided in this study. Hellwig et al.
(2002) stated that decreased pup body weight gain could be related to direct exposure to THF
during lactation. Specifically, the study authors suggested that given that THF is slightly more
soluble in lipid than water, THF may have been more concentrated in the dam’s milk fat than in
the maternal water compartment. Based on the developmental effects observed (decreased pup
body weight gain, delayed eye opening, and increased incidence of sloped incisors) the study
authors designated 3,000 ppm as the NOAEL. The finding of decreased mean number of F2
pups delivered/litter in the high-dose group (10.4 versus 12.4 in control) is also supportive.
While the two-generation study demonstrated a decrease in pup body weight gain in both
the F1 and F2 generations following THF exposure, the contribution of other potential
confounding factors, such as dam water consumption and litter size (which may influence the
milk availability to each pup), were considered further using multivariable regression analyses.
The regression analyses included pup body weight gain during PNDs 7–14 as the dependent
variable and four independent variables: average THF intake, maternal water intake during
lactation, number of pups in each litter (during the affected postnatal period), and a categorical
variable for the dose group. Since the response data from F1 and F2 generation are independent,
these data were analyzed separately. Preliminary regression analyses suggested that there was a
high degree of colinearity among the independent variables, as indicated by the high variance
inflation factors, and the dose group is the most significantly affected factor. Removal of this
factor diminishes the colinearity in the regression. Therefore, in a second series of regression
analyses, dose group was not included as an independent variable. The results from this
regression analysis are summarized in Table 4-7.
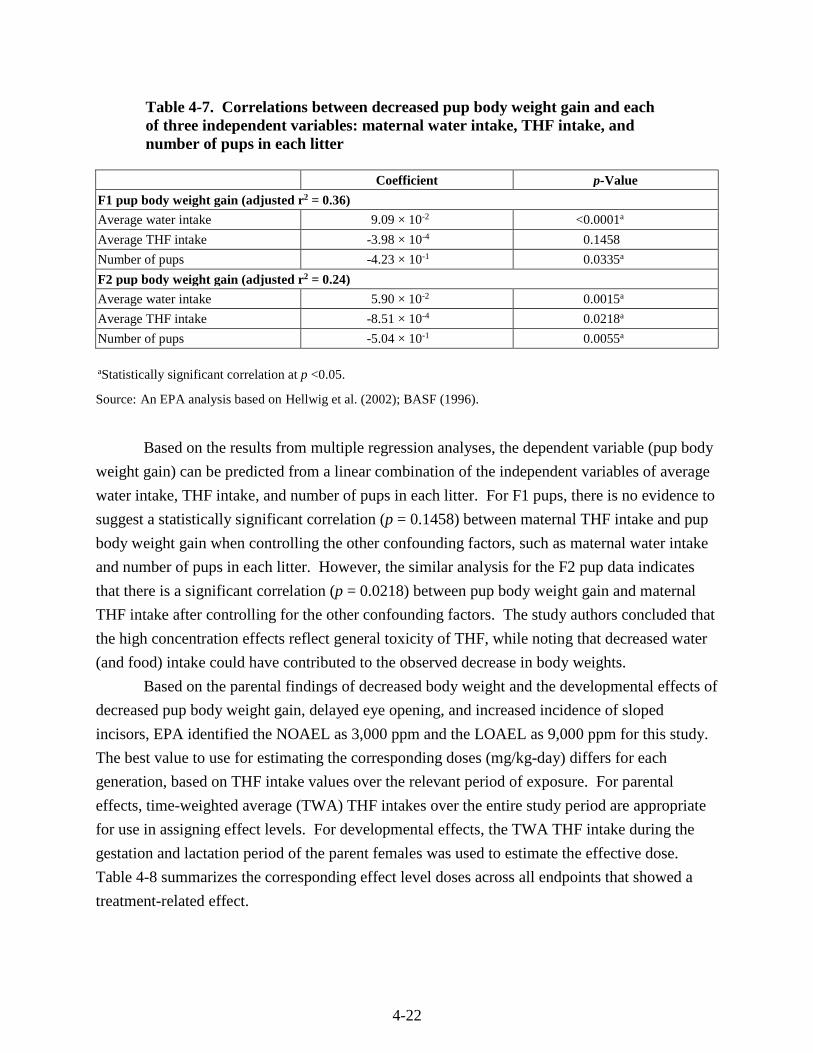
4-22
Table 4-7. Correlations between decreased pup body weight gain and each of three independent variables: maternal water intake, THF intake, and number of pups in each litter
Coefficient p-Value
F1 pup body weight gain (adjusted r2 = 0.36)
Average water intake 9.09 × 10⁻² <0.0001a
Average THF intake -3.98 × 10⁻⁴ 0.1458
Number of pups -4.23 × 10⁻¹ 0.0335a
F2 pup body weight gain (adjusted r2 = 0.24)
Average water intake 5.90 × 10⁻² 0.0015a
Average THF intake -8.51 × 10⁻⁴ 0.0218a
Number of pups -5.04 × 10⁻¹ 0.0055a
aStatistically significant correlation at p <0.05.
Source: An EPA analysis based on Hellwig et al. (2002); BASF (1996).
Based on the results from multiple regression analyses, the dependent variable (pup body
weight gain) can be predicted from a linear combination of the independent variables of average
water intake, THF intake, and number of pups in each litter. For F1 pups, there is no evidence to
suggest a statistically significant correlation (p = 0.1458) between maternal THF intake and pup
body weight gain when controlling the other confounding factors, such as maternal water intake
and number of pups in each litter. However, the similar analysis for the F2 pup data indicates
that there is a significant correlation (p = 0.0218) between pup body weight gain and maternal
THF intake after controlling for the other confounding factors. The study authors concluded that
the high concentration effects reflect general toxicity of THF, while noting that decreased water
(and food) intake could have contributed to the observed decrease in body weights.
Based on the parental findings of decreased body weight and the developmental effects of
decreased pup body weight gain, delayed eye opening, and increased incidence of sloped
incisors, EPA identified the NOAEL as 3,000 ppm and the LOAEL as 9,000 ppm for this study.
The best value to use for estimating the corresponding doses (mg/kg-day) differs for each
generation, based on THF intake values over the relevant period of exposure. For parental
effects, time-weighted average (TWA) THF intakes over the entire study period are appropriate
for use in assigning effect levels. For developmental effects, the TWA THF intake during the
gestation and lactation period of the parent females was used to estimate the effective dose.
Table 4-8 summarizes the corresponding effect level doses across all endpoints that showed a
treatment-related effect.
4-23
Table 4-8. Summary of effect levels observed in the two-generation reproduction study in Wistar rats exposed to THF in drinking water
Effect NOAEL
(mg/kg-day) LOAEL
(mg/kg-day)
F0 Males—increased kidney weight 268 714
F0 Females—decreased body weight, increased kidney weight 322 835
F1 Adult males—decreased body weight gain 293 788
F1 Adult females—decreased body weight gain 362 898
F1 Pups—decreased body weight gain 381 1,071
F2 Pups—decreased body weight gain, delayed eye opening and increased incidence of sloped incisors
385 974
Sources: Hellwig et al. (2002); BASF (1996).
4.3.2. Inhalation
Mast et al. (1992) assessed developmental toxicity of THF in mice and rats. Female
CD-1 mice (10 virgin and 30 mated animals/group) were exposed to 0, 600, 1,800, or 5,000 ppm
(0, 1,770, 5,310, or 14,750 mg/m3) THF vapor for 6 hours/day, 7 days/week on gestation days 6–
17. Female mice in the 5,000 ppm group demonstrated a high toxicity, with >25% mortality
observed after only 6 days of exposure. Consequently, mice in this group were removed from
exposure at this time and placed in a chamber with fresh air until time of scheduled sacrifice.
Developmental evaluations were conducted on pregnant mice euthanized on gestation day 18.
Developmental endpoints included gross maternal toxicity and number, position, and status of
implantation sites. Live fetuses were weighed, sexed, and examined for gross defects. Half of
the live fetuses and any fetus with gross defects were examined for visceral defects, and the
heads were examined for soft-tissue craniofacial abnormalities. All fetal carcasses were
examined for gross changes in cartilage and ossified bone. Maternal deaths occurred in the high-
concentration group. Other statistically significant maternal effects that were observed at
concentrations of ≥1,800 ppm included narcosis, decreased terminal body weight, reduced
adjusted maternal weight gain (adjusted for uterine weight), and reduced gravid uterine weight.
A reduction in the percent live pups/litter and delayed ossification of the sternum were observed
at concentrations of ≥1,800 ppm. Surviving pregnant mice in the high concentration group had
litters with a 95% resorption incidence; however, if the conceptus survived, development
continued normally. There were no effects on the number of implantations, the fetal sex ratio, or
the incidence of abnormalities in fetuses. Based on decreased gravid uterine weight in dams and
reduced fetal survival, EPA identified the LOAEL as 1,800 ppm (5,310 mg/m3) and the NOAEL
as 600 ppm (1,770 mg/m3) in mice.
4-24
Pregnant Sprague-Dawley rats (10 virgin and 30 mated animals/group) were exposed to
0, 600, 1,800, or 5,000 ppm (0, 17, 70, 5,310, or 14,750 mg/m3) THF vapor for 6 hours/day,
7 days/week on gestation days 6–19 (Mast et al., 1992). Developmental evaluations were
conducted on pregnant rats euthanized on gestation day 20. Developmental endpoints included
gross maternal toxicity and the number, position, and status of implantation sites. Live fetuses
were weighed, sexed, and examined for gross defects. Half of the live fetuses and any fetus with
gross defects were examined for visceral defects, and the heads were examined for soft-tissue
craniofacial abnormalities. All fetal carcasses were examined for cartilage and ossified bone. In
dams, the cumulative body weights were significantly reduced in the high concentration group
throughout the exposure period. In addition, nonsignificant reductions of gravid uterine weight
and extragestational weight gain (adjusted for uterine weight) were observed in the high
concentration group. Fetal rat weights were significantly reduced at 5,000 ppm. There were no
effects on the number of implantations, fetal sex ratio, or incidence of fetal abnormalities. Based
on decreased maternal and fetal weight, EPA identified the LOAEL as 5,000 ppm (14,750
mg/m3) and the NOAEL as 1,800 ppm (5,310 mg/m3) in rats.
DuPont Haskell Laboratory (1980) investigated the effects of inhaled THF on the
developing fetus in rats. The authors first performed a range-finding study in which Crl:CD®
rats (7–14/group) were exposed by inhalation (whole body exposure) to THF at nominal
concentrations of 0, 200, 500, 2,500 and 5,000 ppm (0, 590, 1,475, 7,375, or 14,750 mg/m3)
6 hours/day on gestation days 6–15. In a follow-up study, Crl:CD® rats (29/group) were exposed
to nominal THF concentrations of 0, 1,000, and 5,000 ppm (0, 2,950, or 14,750 mg/m3) 6
hours/day on gestation days 6–15. Body weight, clinical signs, and feed consumption were
observed in dams during the exposure period. Dams were sacrificed on gestation day 21 and
were examined for gross pathologic changes, liver weight, and reproductive status. The number
of corpora lutea, implantation sites, and live and dead fetuses were recorded. Live fetuses were
weighed, sexed, and examined for external alterations. One-third of all fetuses and all stunted or
malformed fetuses were examined for visceral alterations, and the heads were fixed for
evaluation of eye malformations. Remaining fetuses were fixed and stained for examination of
skeletal alterations. The same endpoints were examined in both parts of the study.
No mortality was observed in dams in either study. In both studies, dams in the high-
concentration group demonstrated decreased response to noise stimulus, reduced muscle tone,
and staggering gait that persisted for about 1 hour following each daily exposure period. In
addition, dams in the lower concentration group (7,375 mg/m3 in the range-finding study and
2,950 mg/m3 in the main study) had a diminished response to noise stimulus. Food consumption
in the main study high-concentration group was significantly reduced compared to controls. In
both studies, dams in the high-concentration group had significantly reduced body weight gain
4-25
compared to controls. The number of implants/dam and mean fetal body weight both were
significantly decreased with increasing exposure (although no information is provided on which
concentration-level significance was first observed). In addition, fetuses in the high-
concentration group exhibited a significantly decreased incidence of sternal ossification. Based
on decreased fetal weight and skeletal alterations, EPA identified the developmental LOAEL as
14,750 mg/m3 and the NOAEL as 7,375 mg/m3. Based on clinical signs of sedation (diminished
response to noise stimulus), the maternal LOAEL and NOAEL were 2,950 and 1,475 mg/m3,
respectively.
4.4. OTHER DURATION- OR ENDPOINT-SPECIFIC STUDIES
Several short-term oral studies in animals are available (see Appendix C for study
descriptions). In rats treated with a total of six gavage doses of THF in distilled water, increased
mortality was observed at doses >2,000 mg/kg (Stasenkova and Kochetkova, 1963). Toxicity
observed in this study included CNS toxicity (immobility, drowsiness, reduced response to
external stimuli) and necrosis, edema, and hemorrhage of stomach, brain, liver, heart, spleen, and
kidneys. However, it is not possible to more fully characterize the specific histopathology
endpoints in the study by Stasenkova and Kochetkova (1963). In a 4-week study of THF in
drinking water administered to rats (Komsta et al., 1988), doses as high as 96 mg/kg-day had no
effect on mortality and did not produce clinical signs of CNS toxicity in rats. Histopathologic
lesions in liver (increased cytoplasmic homogeneity and anisokaryosis) and kidney (tubular
cytoplasmic inclusions) were observed in the high-dose group males and females.
Several acute inhalation studies in animals suggest that the primary effects observed
following single exposures to THF—ranging from 30 minutes to several hours—are CNS
toxicity and respiratory tract irritation. Symptoms of CNS toxicity, including sedation, coma,
altered respiration, and decreased response to external stimuli, were observed in dogs (Stoughton
and Robbins, 1936), mice (Stasenkova and Kochetkova, 1963; Stoughton and Robbins, 1936),
and rats (Horiguchi et al., 1984; DuPont Haskell Laboratory, 1979; Stasenkova and Kochetkova,
1963). Clinical signs of respiratory tract irritation, observed only in rat studies, included
scratching, head shaking, face washing, tearing, salivation, and bleeding from the nose
(Horiguchi et al., 1984; DuPont Haskell Laboratory, 1979). In addition, several other acute
studies observed structural or functional changes in respiratory tissue (suggesting respiratory
tract irritation), including congested mottled lungs in rats (Henderson and Smith, 1936), edema
and hemorrhage in lungs and bronchi of rats (Stasenkova and Kochetkova, 1963), and decreased
ciliary beat frequency and vacuolation/degeneration of both nasal mucosa (Ohashi et al., 1983)
and tracheal mucosa (Ikeoka et al., 1988) in rabbits, and nasal and tracheal histopathology
changes in rats (Horiguchi et al., 1984). Two studies report histopathological lesions in other
4-26
organs such as liver (Stasenkova and Kochetkova, 1963; Henderson and Smith, 1936), kidney,
brain, and spleen (Stasenkova and Kochetkova, 1963). However, Hofmann and Oettel (1954)
specifically examined the liver and kidney and found no effects. These studies are further
described in Appendix C.
4.5. MECHANISTIC DATA AND OTHER STUDIES
Genotoxicity.
Only one study that evaluated genotoxicity endpoints in humans was identified. Funes-
Cravioto et al. (1977) reported increased chromosome breaks in peripheral lymphocytes from
solvent-exposed versus nonexposed adults. However, of the seven occupational groups that were
pooled for the statistical analysis, only one was identified as having used THF in the workplace
(no exposure information was provided by the study authors), thus suggesting that agents other
than THF likely played a greater role in the observed genotoxicity.
NTP (1998) presented the results of a battery of mutagenicity/genotoxicity tests of THF.
The in vitro tests included the Salmonella typhimurium bacterial mutagenicity assay (with and
without S9 microsomal activation), induction of sister chromatid exchange and chromosomal
aberrations in the Chinese hamster ovary cell system, and in vivo in mouse bone marrow cells.
Micronuclei frequency in peripheral blood erythrocytes following 14-day inhalation exposure of
mice to THF was also evaluated. NTP (1998) concluded that there was little evidence of
mutagenic activity, with most data determined to be conclusively negative.
In summary, the genotoxic potential of THF has been evaluated in a variety of in vitro
and in vivo assays. Nearly all the results are conclusively negative, with equivocal findings
reported in a small number of assays that have been conducted. The genotoxicity data are
summarized in Table C-5 and discussed in more detail in Appendix C.2. Taken together, these
data support the conclusion that THF is not likely genotoxic.
4.6. SYNTHESIS AND EVALUATION OF MAJOR NONCANCER EFFECTS
A summary and synthesis of the major noncancer effects observed following oral and
inhalation exposure to THF are described in the following sections. The modes of action for the
noncancer effects are not known; however, mechanistic data relating to the potential modes of
action for the noncancer effects are further described in Appendix C.
4.6.1. Oral
No human studies of THF following oral exposure are available and the oral database for
animal studies is limited. A summary of the effects observed in the subchronic oral studies is
presented in Table 4-9. In a one-generation reproductive toxicity study (BASF, 1994) of THF
4-27
administered to rats in drinking water, symptoms of general toxicity—including decreased food
(males) and water consumption (males and females) and increased kidney weight (males and
females)—were observed in parental generation rats administered 8,000 ppm THF (795 mg/kg-
day for males and 890 mg/kg-day for females). At this concentration, male and female pups had
significantly decreased body weight gain compared with controls. A follow-up two-generation
reproductive toxicity study (Hellwig et al., 2002; BASF, 1996) of THF administered to rats in
drinking water demonstrated similar results as the one-generation study in the parental
generation rats, including decreased food consumption (F0 females, F0/F1 males), decreased
water consumption (F0/F1 both sexes), decreased body weight (F0/F1 both sexes), and increased
kidney weight (F0 both sexes) at 9,000 ppm THF (714 mg/kg-day for F0 males, 788 mg/kg-day
for F1 males, 835 mg/kg-day for F0 females, 898 mg/kg-day for F1 females). At these same
concentrations, the F1 and F2 pups had significantly reduced body weight gain compared with
controls, and the F2 pups also demonstrated delayed eye opening and increased incidence of
sloped incisors compared with controls at the highest dose (see Table 4-6). Histopathology
examination on parental rats included liver, kidney, reproductive organs, and digestive tract
organs and demonstrated no observed effects. Exposure at the high concentration of THF in
drinking water may have a subtle effect on male rat fertility/fecundity based on a 16% decrease
in the mean number of delivered F2 pups (not statistically significant but below the range of
historical control values) and a finding of one infertile F1 parental male rat in the high dose
group. In both studies, no effects were observed on any other reproductive parameters measured.
Although the data indicate that THF induced an increase in kidney weight in rats, the
severity of the impact on the kidneys appears to be minimal. This conclusion is supported by
several considerations that were summarized under Section 4.3.1. THF exposure had no effect
on absolute or relative kidney weight in F1 generation adults. Furthermore, the kidney weight
changes that were observed in the F0 generation were not accompanied by gross kidney
pathology or clinical chemistry findings consistent with an effect on renal function (in the one-
generation study) or by histopathological examination (in the two-generation study).
Additionally, evaluation of the overall database for THF including the inhalation studies does not
suggest that THF is a potent kidney toxicant. For example, most of the available human case
reports have not identified the kidney as a target of THF exposure. Furthermore, in the
subchronic and chronic inhalation NTP (1998) studies, changes in kidney weight or pathology
were not particularly sensitive to THF exposure.
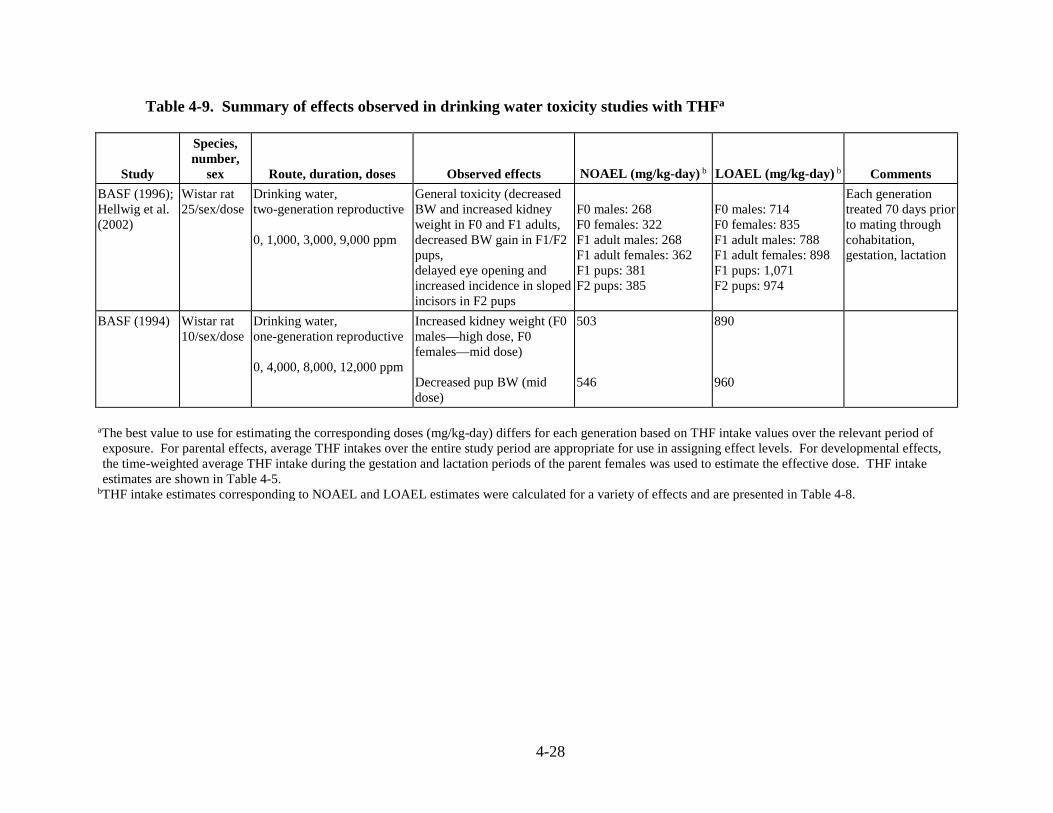
4-28
Table 4-9. Summary of effects observed in drinking water toxicity studies with THFa
Study
Species, number,
sex Route, duration, doses Observed effects NOAEL (mg/kg-day) b LOAEL (mg/kg-day) b Comments
BASF (1996); Hellwig et al. (2002)
Wistar rat 25/sex/dose
Drinking water, two-generation reproductive 0, 1,000, 3,000, 9,000 ppm
General toxicity (decreased BW and increased kidney weight in F0 and F1 adults, decreased BW gain in F1/F2 pups, delayed eye opening and increased incidence in sloped incisors in F2 pups
F0 males: 268 F0 females: 322 F1 adult males: 268 F1 adult females: 362 F1 pups: 381 F2 pups: 385
F0 males: 714 F0 females: 835 F1 adult males: 788 F1 adult females: 898 F1 pups: 1,071 F2 pups: 974
Each generation treated 70 days prior to mating through cohabitation, gestation, lactation
BASF (1994) Wistar rat 10/sex/dose
Drinking water, one-generation reproductive 0, 4,000, 8,000, 12,000 ppm
Increased kidney weight (F0 males—high dose, F0 females—mid dose) Decreased pup BW (mid dose)
503
546
890 960
aThe best value to use for estimating the corresponding doses (mg/kg-day) differs for each generation based on THF intake values over the relevant period of exposure. For parental effects, average THF intakes over the entire study period are appropriate for use in assigning effect levels. For developmental effects, the time-weighted average THF intake during the gestation and lactation periods of the parent females was used to estimate the effective dose. THF intake estimates are shown in Table 4-5.
bTHF intake estimates corresponding to NOAEL and LOAEL estimates were calculated for a variety of effects and are presented in Table 4-8.
4-29
Additionally, several effects were noted in short-term studies, (Komsta et al., 1988;
Stasenkova and Kochetkova, 1963; described in Appendix C). Increased mortality and effects
including CNS toxicity (immobility, drowsiness, reduced response to external stimuli), and
necrosis, edema, and hemorrhage of stomach, brain, liver, heart, spleen, and kidneys were
observed in rats administered THF in distilled water via gavage (Stasenkova and Kochetkova,
1963). Another short-term study of lower doses of THF administered to rats in drinking water
(Komsta et al., 1988), had no effect on mortality and did not produce clinical signs of CNS
toxicity. Histopathologic lesions in liver (increased cytoplasmic homogeneity and anisokaryosis)
and kidney (tubular cytoplasmic inclusions) were observed in the male and female rats.
4.6.2. Inhalation
Although no epidemiological studies of THF have been conducted, several case studies in
humans illustrate the potential for health effects following inhalation exposure in an occupational
setting. In almost all of the cases, workers were exposed to THF through activities where THF
was present as a component of solvents or adhesives. In general, workers were exposed for a
period of a few weeks to a few months before symptoms were reported. Target organs in
humans appear to be the CNS, respiratory tract, liver, and kidney. Symptoms of CNS toxicity
included headache, dizziness, fatigue, loss of the sense of smell (Garnier et al., 1989; Emmett,
1976; Horiuchi et al., 1967), and convulsions (following enfluran anesthesia in a worker exposed
to THF in the weeks prior to surgery) (Juntunen et al., 1984). Symptoms of respiratory tract
irritation included cough, chest pain, rhinorrhea, and dyspnea (Garnier et al., 1989; Emmett,
1976). In three cases, liver enzymes (ALT, AST, and GGT) were elevated above normal values
(Garnier et al., 1989; Edling, 1982; Horiuchi et al., 1967), and in one case a liver biopsy revealed
fatty changes following THF exposure (Edling, 1982). In one study, hematological changes and
decreased white blood cell counts were reported in THF-exposed workers (Horiuchi et al., 1967).
In one case study, autoimmune glomerulonephritis was observed in a man who worked with
THF in adhesives for 9 years (Albrecht et al., 1987). The human case studies suggest that CNS
toxicity, respiratory tract irritation, and liver and kidney toxicity are the potential health effects
following inhalation exposure to THF.
An uncertainty associated with all of the reported human case studies is the fact that
workers were exposed to other solvents and chemicals in addition to THF, so it is not possible to
conclusively attribute the observed effects to THF exposure alone. In addition, in most cases
quantitative estimates of exposure were not provided.
In animals, subchronic and chronic studies reported several systemic effects following
inhalation exposure to THF; a summary of these effects is presented in Table 4-10. Decreased
body weight has been observed in rats (Horiguchi et al., 1984; Kawata and Ito, 1984). Decreased
4-30
blood pressure was observed in dogs (BASF, 1938) and rats (Stasenkova and Kochetkova, 1963).
Altered hematological parameters were observed in rats (NTP, 1998; Horiguchi et al., 1984),
mice (NTP, 1998; Stasenkova and Kochetkova, 1963), and dogs (BASF, 1938). Following 14
weeks of inhalation exposure, rats of both sexes had significantly increased relative and absolute
liver weight (NTP, 1998). In the same study, mice of both sexes showed increased relative and
absolute liver weight (NTP, 1998). In addition, Horiguchi et al. (1984) observed increased
relative weights of liver. Changes in mice included liver centrilobular cytomegaly in both sexes
following 14 weeks of exposure to THF (NTP, 1998). Increased incidence of hepatocellular
necrosis was also observed in female mice in the 2-year inhalation study (NTP, 1998).
Inhalation exposure to THF appears to also result in symptoms of CNS toxicity and
respiratory tract irritation. In a subchronic neurotoxicity assay (DuPont Haskell Laboratory,
1996b) the only effects observed were transient symptoms of CNS toxicity that were not
observed on mornings prior to the start of the weekly exposures. No permanent neurotoxic
effects were observed on motor activity or in any functional observational battery (FOB)
parameter. Altered brain catecholamine levels were observed following 8 weeks of inhalation
exposure (Kawata et al., 1986), and altered EEGs were observed following i.p. injection (Marcus
et al., 1976). While the clinical significance of these findings is uncertain in terms of assigning
adverse effect levels for THF, the observation that similar brain alterations are induced by the
THF metabolites GBL and GHB (NSF, 2003) suggests that these metabolites may be responsible
for the observed neurotoxicity of THF.
In two subchronic studies, authors specifically note that symptoms of CNS toxicity (NTP,
1998; Horiguchi et al., 1984) appeared to moderate with continued exposures. Based on findings
in Elovaara et al. (1984) of decreased concentrations of THF in rat brain and fat tissues with
extended exposure, the authors of the NTP (1998) study considered it likely that the apparent
tolerance to the CNS effects may be due to stimulation by THF of its own metabolism. They
also concluded that it is not possible to ascertain whether the clinical findings of CNS toxicity
(narcosis) were primary (i.e., specific to THF or its metabolites) or secondary (i.e., nonspecific
due to solvent interaction with cell membranes of the nervous system as seen with other
solvents) and that further research is needed to better characterize THF neurotoxicity.
However, support for the THF-induced CNS effects was provided by evidence of these
effects in the subchronic and chronic studies as well as short-term and acute studies. Several
acute inhalation studies in animals suggest that one of the primary effects observed following
single exposures to THF is CNS toxicity (including sedation, coma, altered respiration, and
decreased response to external stimuli in dogs [Stoughton and Robbins, 1936], mice [Stasenkova
and Kochetkova, 1963; Stoughton and Robbins, 1936], and rats [Horiguchi et al., 1984; DuPont
Haskell Laboratory, 1979; Stasenkova and Kochetkova, 1963]).
4-31
Additional effects observed include respiratory tract irritation, kidney effects, thymus
weight changes, and effects associated with immunotoxicity and developmental toxicity.
Histopathological changes in the respiratory tract were observed in one subchronic study at 3,000
ppm (Kawata and Ito, 1984) and in several acute and short-term studies (Ikeoka et al., 1988;
Horiguchi et al., 1984; Ohashi et al., 1983; Stasenkova and Kochetkova, 1963) with some at
relatively low exposure concentrations. Specifically, Horiguchi et al. (1984) found nasal
histopathology after a 3-week exposure to 100 or 5,000 ppm THF but no such effects were
reported following exposure to 5,000 ppm for 12 weeks. Changes in the tracheal mucosa in the
group exposed to 5,000 ppm were described as occurring in the cilia, with disorder of the
epithelial architecture and darkening of cell bodies. However, the study authors did not clarify
whether the nasal effects at 100 ppm were the same as the tracheal effects at 100 or 5,000 ppm,
although it was presumed that it was the tracheal effects at 5,000 ppm that were being equated to
the 100 ppm nasal effects. The authors did not describe any results for the tracheal mucosa at
100 ppm. A major deficiency in this study is that the results represent a single animal per
exposure level at each time point. Based on the small sample size, duration of exposure, absence
of clear documentation of the severity of the nasal histopathology, and uncertainty regarding the
concentration at which nasal changes were observed, this study provided equivocal results
regarding respiratory toxicity. Also, symptoms of eye and respiratory tract irritation as well as
changes in the threshold of neuromuscular irritability were found in rats and mice following
2 months of exposure (6,000–8,000 mg/m3), but similar symptoms were not reported following
6 months of exposure to lower concentrations (1,000–2,000 mg/m3) (Stasenkova and
Kochetkova, 1963). These data demonstrate that the irritation effects induced by THF were not
consistently observed with increasing duration of exposure. These effects were observed at
higher exposure concentrations than those where liver effects were observed. In addition, there
are limitations in documentation and reporting.
Clinical signs of respiratory tract irritation, observed in studies in rats only, included
scratching, head shaking, face washing, tearing, salivation, and bleeding from the nose
(Horiguchi et al., 1984; DuPont Haskell Laboratory, 1979). In addition, several other acute
studies observed structural or functional changes in respiratory tissue (suggesting respiratory
tract irritation), including congested mottled lungs in rats (Henderson and Smith, 1936), edema
and hemorrhage in lungs and bronchi of rats (Stasenkova and Kochetkova, 1963), and decreased
ciliary beat frequency and vacuolation/degeneration of both nasal mucosa (Ohashi et al., 1983)
and tracheal mucosa (Ikeoka et al., 1988) in rabbits, and nasal and tracheal histopathology
changes in rats (Horiguchi et al., 1984). Two studies report histopathological lesions in other
organs such as liver (Stasenkova and Kochetkova, 1963; Henderson and Smith, 1936), kidney,
4-32
brain, and spleen (Stasenkova and Kochetkova, 1963). However, Hofmann and Oettel (1954)
specifically examined the liver and kidney and found no effects.
As reported by NTP (1998), absolute and relative thymus weights were statistically
significantly decreased, beginning at 1,770 mg/m3 in male mice. The thymus weight changes
were not accompanied by histopathological changes in the subchronic study. The study authors
indicated that the significance of the thymus weight changes was unclear and suggested that
these changes might have been due to stress associated with THF administration. However, the
thymus weight changes were concentration-dependent, suggesting that if they were stress related,
this response would have been secondary to the effects of THF. Organ weights were not
reported for the chronic study, and therefore, it is not possible to determine if thymus weight is
similarly affected by long-term exposure. Histopathological analysis of the thymus in the
chronic study revealed an increase in the incidence of thymic atrophy that was statistically
significant in the 5,310 mg/m3 exposure group. This finding was attributed by the authors to be a
secondary response, based on the high incidence of urogenital inflammation observed in the
males of the high-concentration group. However, since the increase in infections occurred in the
same group that had thymic changes, it cannot be determined whether the thymus weight and
histopathology effects increased susceptibility to infection or the inflammation had a stress-
related effect on the thymus.
It is unclear whether the observed effects on the thymus in the subchronic and chronic
studies (NTP, 1998) represent a functional effect on the immune system, and no data are
available to differentiate between mechanisms involving a generalized stress response versus
other mechanisms directly targeting the immune system. Evaluation of the THF database as a
whole provides inconsistent results related to immune effects, with some studies identifying
effects and others showing no effect. Nevertheless, some of the available studies show evidence
for potential immunotoxicity. For example, decreased white blood cell counts were reported in a
study of workers (Horiuchi et al., 1967) and changes in white blood cell counts were reported in
an oral drinking water study (Pozdnyakova, 1965) and in a subchronic inhalation study
(Horiguchi et al., 1984). Both thymus and spleen weights were reduced in male and female rats
in the subchronic NTP (1998) study. In addition, data for THF metabolites are consistent with
potential immunotoxicity. For example, thymic depletion was reported at 262 mg/kg-day GBL
in mice in a gavage study (NTP, 1992), although this may have been secondary to an
inflammatory response or a factor leading to the susceptibility to inflammation. Toxicokinetic
information also provides a possible connection between THF exposure and immune effects, in
which the tissue distribution study by Kawata and Ito (1984) reported that the thymus and spleen
had significantly higher THF concentrations than other tissues following inhalation exposure to
3,000 ppm THF for 12 weeks.
4-33
The predictivity of thymus weight changes for functional immune responses has been
studied by Luster et al. (1992) who determined the ability of a variety of common measures of
immune toxicity, including thymus/body weight ratios, to predict the immunotoxicity of a series
of test compounds in mice. When evaluated as a single measure, thymus/body weight ratios
were characterized as an unreliable indicator of immunotoxicity (68% concordance—the ability
to correctly identify compounds of known immunotoxic potential). However, thymus/body
weight ratio was part of several testing configurations that showed 100% concordance with
immunotoxicity, suggesting that this measure can contribute to the immunotoxicity assessment.
In addition, the authors noted that the lack of concordance for most assays was generally due to a
decreased sensitivity (i.e., failure to detect positive immunotoxicants) not a decrease in
specificity (i.e., the ability to correctly identify negative compounds). This suggests that
thymus/body weight ratios might underreport immunotoxicity. In a follow-up publication by
Luster et al. (1993), a good correlation was reported between immune function assays and
changes in host resistance (e.g., increased susceptibility to infection from a challenge agent),
although the predictivity of individual assays varied (the concordance was 76% for thymus/body
weight ratios).
In summary, there are no studies of host resistance or data from other types of
immunotoxicity studies following inhalation exposure to THF. Also, it is unclear whether the
observed thymus weight changes had a functional impact on the immune system of mice in the
subchronic study (NTP, 1998). For this reason, the biological significance of the decrease in
thymus weight is questionable. An area of uncertainty exists for the potential effects of THF on
the immune system, specifically with regard to decreased thymus weight.
Developmental studies by the inhalation route have been conducted in both rats (Mast et
al., 1992; DuPont Haskell Laboratory, 1980) and mice (Mast et al., 1992). In both studies and
both species, maternal toxicity included significant decreases in body weight accompanied by
decreases in gravid uterine weight (Mast et al., 1992) or food consumption (DuPont Haskell
Laboratory, 1980). Decreased fetal weight was observed at the same concentration that resulted
in maternal toxicity in rats (Mast et al., 1992). In both mice (Mast et al., 1992) and rats (DuPont
Haskell Laboratory, 1980), decreased fetal survival also occurred at the same concentrations that
resulted in maternal toxicity. However, as noted in Section 3.1.1.4 of the EPA Guidelines for
Developmental Toxicity Risk Assessment (U.S. EPA, 1991a), developmental effects occurring at
the same exposure levels as maternal toxicity are still considered to represent developmental
toxicity and should not be discounted as being secondary to maternal toxicity. With regard to
potential teratogenic effects, Mast et al. (1992) noted that in mice that survived the exposure
period, no increase was observed in the incidence of fetal abnormalities. However, an increased

4-34
incidence of incomplete sternal ossification in rat fetuses was observed (DuPont Haskell
Laboratory, 1980).
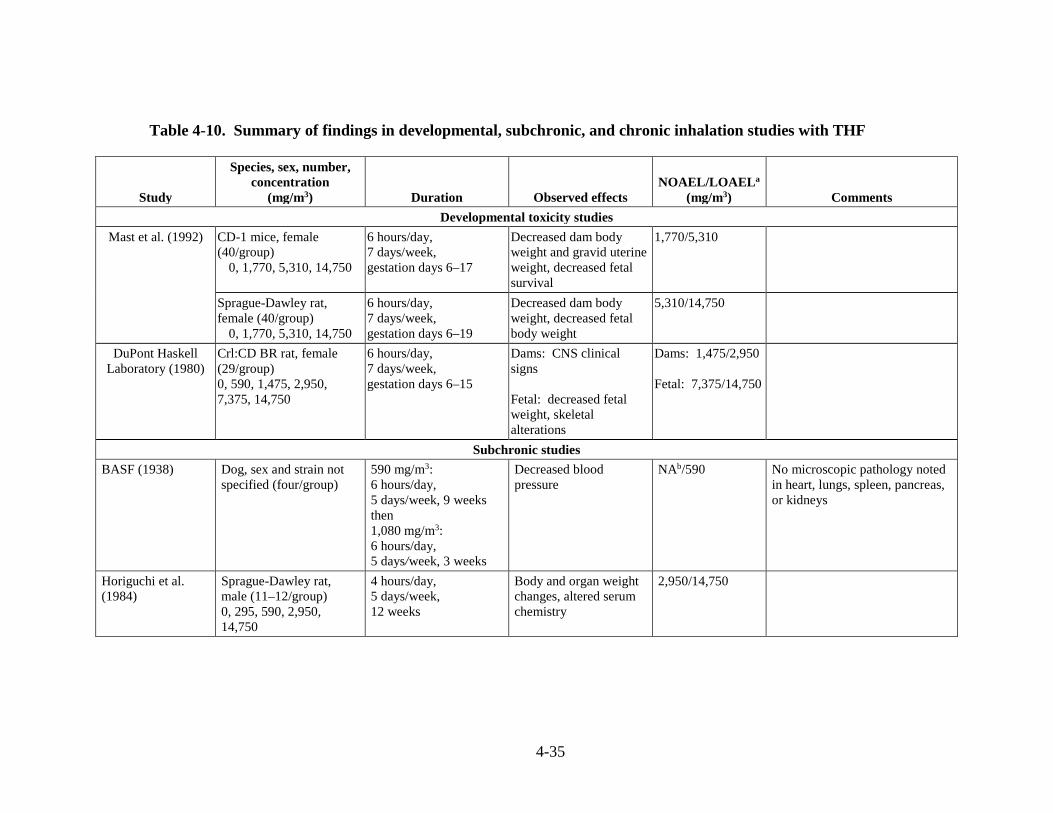
4-35
Table 4-10. Summary of findings in developmental, subchronic, and chronic inhalation studies with THF
Study
Species, sex, number, concentration
(mg/m3) Duration Observed effects NOAEL/LOAELa
(mg/m3) Comments
Developmental toxicity studies
Mast et al. (1992) CD-1 mice, female (40/group)
0, 1,770, 5,310, 14,750
6 hours/day, 7 days/week, gestation days 6–17
Decreased dam body weight and gravid uterine weight, decreased fetal survival
1,770/5,310
Sprague-Dawley rat, female (40/group)
0, 1,770, 5,310, 14,750
6 hours/day, 7 days/week, gestation days 6–19
Decreased dam body weight, decreased fetal body weight
5,310/14,750
DuPont Haskell Laboratory (1980)
Crl:CD BR rat, female (29/group) 0, 590, 1,475, 2,950, 7,375, 14,750
6 hours/day, 7 days/week, gestation days 6–15
Dams: CNS clinical signs Fetal: decreased fetal weight, skeletal alterations
Dams: 1,475/2,950 Fetal: 7,375/14,750
Subchronic studies
BASF (1938) Dog, sex and strain not specified (four/group)
590 mg/m3: 6 hours/day, 5 days/week, 9 weeks then 1,080 mg/m3: 6 hours/day, 5 days/week, 3 weeks
Decreased blood pressure
NAb/590 No microscopic pathology noted in heart, lungs, spleen, pancreas, or kidneys
Horiguchi et al. (1984)
Sprague-Dawley rat, male (11–12/group) 0, 295, 590, 2,950, 14,750
4 hours/day, 5 days/week, 12 weeks
Body and organ weight changes, altered serum chemistry
2,950/14,750
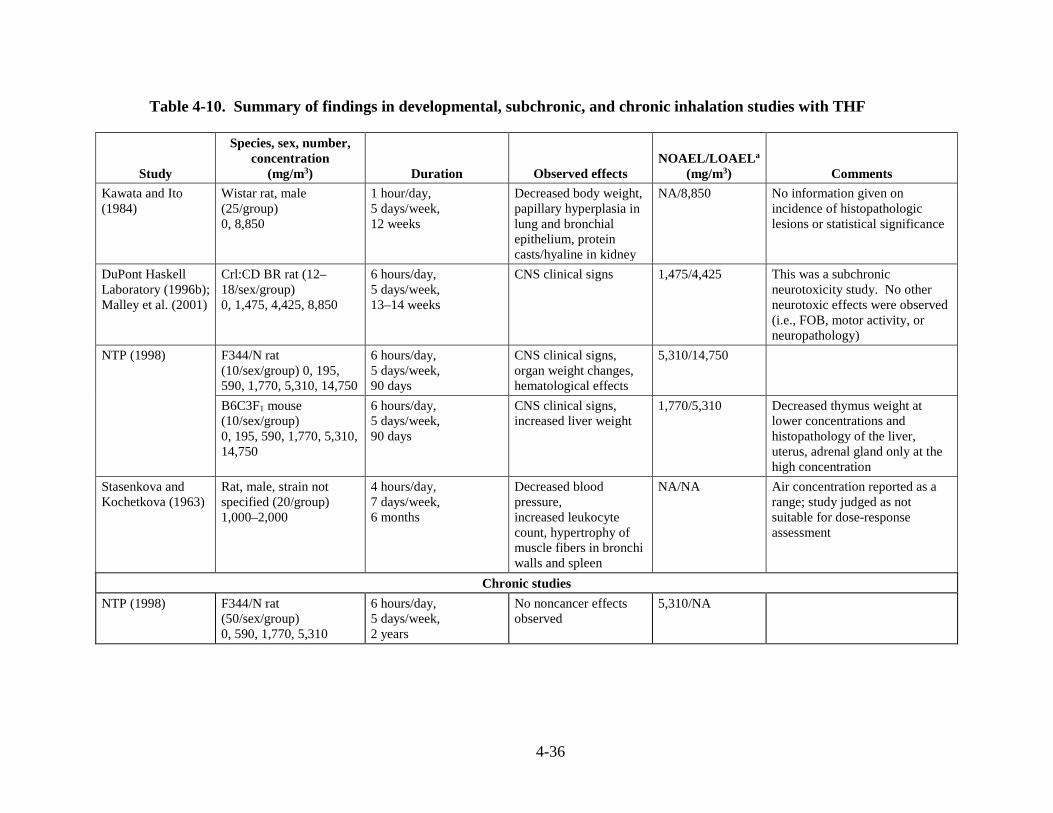
4-36
Table 4-10. Summary of findings in developmental, subchronic, and chronic inhalation studies with THF
Study
Species, sex, number, concentration
(mg/m3) Duration Observed effects NOAEL/LOAELa
(mg/m3) Comments
Kawata and Ito (1984)
Wistar rat, male (25/group) 0, 8,850
1 hour/day, 5 days/week, 12 weeks
Decreased body weight, papillary hyperplasia in lung and bronchial epithelium, protein casts/hyaline in kidney
NA/8,850 No information given on incidence of histopathologic lesions or statistical significance
DuPont Haskell Laboratory (1996b); Malley et al. (2001)
Crl:CD BR rat (12–18/sex/group) 0, 1,475, 4,425, 8,850
6 hours/day, 5 days/week, 13–14 weeks
CNS clinical signs
1,475/4,425 This was a subchronic neurotoxicity study. No other neurotoxic effects were observed (i.e., FOB, motor activity, or neuropathology)
NTP (1998)
F344/N rat (10/sex/group) 0, 195, 590, 1,770, 5,310, 14,750
6 hours/day, 5 days/week, 90 days
CNS clinical signs, organ weight changes, hematological effects
5,310/14,750
B6C3F1 mouse (10/sex/group) 0, 195, 590, 1,770, 5,310, 14,750
6 hours/day, 5 days/week, 90 days
CNS clinical signs, increased liver weight
1,770/5,310 Decreased thymus weight at lower concentrations and histopathology of the liver, uterus, adrenal gland only at the high concentration
Stasenkova and Kochetkova (1963)
Rat, male, strain not specified (20/group) 1,000–2,000
4 hours/day, 7 days/week, 6 months
Decreased blood pressure, increased leukocyte count, hypertrophy of muscle fibers in bronchi walls and spleen
NA/NA Air concentration reported as a range; study judged as not suitable for dose-response assessment
Chronic studies
NTP (1998) F344/N rat (50/sex/group) 0, 590, 1,770, 5,310
6 hours/day, 5 days/week, 2 years
No noncancer effects observed
5,310/NA
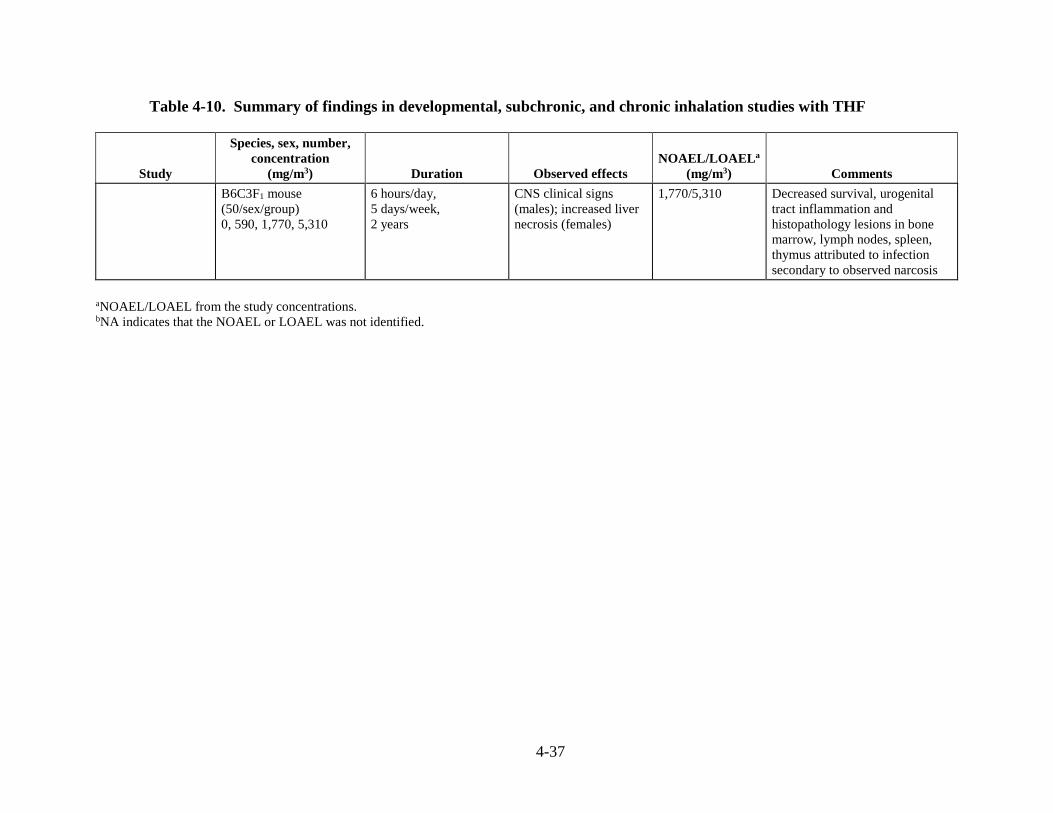
4-37
Table 4-10. Summary of findings in developmental, subchronic, and chronic inhalation studies with THF
Study
Species, sex, number, concentration
(mg/m3) Duration Observed effects NOAEL/LOAELa
(mg/m3) Comments
B6C3F1 mouse (50/sex/group) 0, 590, 1,770, 5,310
6 hours/day, 5 days/week, 2 years
CNS clinical signs (males); increased liver necrosis (females)
1,770/5,310 Decreased survival, urogenital tract inflammation and histopathology lesions in bone marrow, lymph nodes, spleen, thymus attributed to infection secondary to observed narcosis
aNOAEL/LOAEL from the study concentrations. bNA indicates that the NOAEL or LOAEL was not identified.
4-38
4.7. EVALUATION OF CARCINOGENICITY
4.7.1. Summary of Overall Weight of Evidence
Under EPA’s Guidelines for Carcinogen Risk Assessment (U.S. EPA, 2005a), the
database for THF provides “suggestive evidence of carcinogenic potential.” No human data are
available to assess the carcinogenic potential of THF. A 2-year NTP (1998) inhalation cancer
bioassay reported an increased incidence of renal tubule adenomas and carcinomas in male
F344/N rats (statistically significant exposure-response trend) and an increased incidence of
hepatocellular adenomas and carcinomas in female B6C3F1 mice (statistically significant trend).
No other treatment-related increases in tumor incidence were observed. NTP (1998) concluded
that the data provided some evidence for THF carcinogenicity in male rats (renal tubular
adenomas and carcinomas) and clear evidence of carcinogenicity in female mice (hepatocellular
adenomas and carcinomas). There was no evidence of carcinogenic activity in female rats or
male mice reported by NTP (1998).
There are some data suggesting that the observed renal tumors in the male rats may be
secondary to α2u-globulin accumulation; however, a review of the data available for THF
indicates that the data do not support an α2u-globulin-related mode of action (MOA) (Section
4.7.3.1). Another consideration regarding the renal tumors is the possibility that advanced
chronic progressive nephropathy (CPN), a spontaneous age-related renal disease of laboratory
rodents, may play a role in the incidence of atypical tubule hyperplasia (ATH) and perhaps the
THF-induced kidney tumors in male rat kidneys. The NTP 2-year carcinogenicity study on THF
(1998) reported no difference in the incidence or severity of CPN in the control versus treated
male rats. Although THF did not exacerbate development of CPN, it is possible that it may have
exacerbated the development of proliferative lesions within CPN-affected tissue; however, there
is no direct evidence in support of this. Thus, the kidney tumors observed in male rats are
considered relevant to the assessment of the carcinogenic potential of THF to humans.
For the liver tumors in mice, some mechanistic data suggest that THF may induce cell
proliferation and lead to a promotion in the growth of pre-initiated cells. However, key
precursor events linked to observed cell proliferation have not been identified and the available
data are insufficient to establish a mode of action for the THF liver tumor induction (Section
4.7.3.2). Thus, the liver tumors observed in female mice are considered relevant to the
assessment of the carcinogenic potential of THF to humans.
U.S. EPA’s Guidelines for Carcinogen Risk Assessment (U.S. EPA, 2005a) indicate that
for tumors occurring at a site other than the initial point of contact, the weight of evidence for
carcinogenic potential may apply to all routes of exposure that have not been adequately tested at
sufficient doses. An exception occurs when there is convincing toxicokinetic data that
absorption does not occur by other routes. Information available on the carcinogenic effects of
4-39
THF via the inhalation route demonstrates that tumors occur in tissues remote from the site of
absorption. Information on the carcinogenic effects of THF via the oral and dermal routes in
humans or animals is not available. Based on the observance of systemic tumors following
inhalation exposure, and in the absence of information to indicate otherwise, it is assumed that an
internal dose will be achieved regardless of the route of exposure. Therefore, there is
“suggestive evidence of carcinogenic potential” following exposure to THF by all routes of
exposure.
4.7.2. Synthesis of Human, Animal, and Other Supporting Evidence
As discussed in Section 4.1, there are no human studies investigating the carcinogenic
effects of THF following inhalation exposure. However, the NTP (1998) chronic inhalation
exposure bioassay in laboratory animals was adequately designed to assess the carcinogenic
potential of lifetime inhalation exposure to THF. This study involved exposure of F344/N rats
(50/sex/group) and B6C3F1 mice (50/sex/group) to 0, 200, 600, and 1,800 ppm (0, 590, 1,770,
and 5,310 mg/m3) THF for 6 hours/day, 5 days/week for 105 weeks. For the male rats, a
statistically significant treatment-related trend was observed for combined incidences of renal
tubular epithelial adenomas or carcinomas (1/50, 1/50, 4/50, and 5/50) (NTP, 1998). The
response was predominantly benign except for two carcinomas present at the high exposure
concentration. The individual incidences of the kidney adenomas or carcinomas in the high
exposure male rats exceeded the incidence of these tumors in F344/N historical controls (rate:
0.9 ± 1.3%; range: 0–4%) but were not statistically significant when compared with the
concurrent controls (NTP, 1998).
In female mice, there was a statistically significant increase in incidences of
hepatocellular adenomas or carcinomas at the high concentration (1,800 ppm) and a positive
trend for these hepatocellular neoplasms across exposure to 200, 600, and 1,800 ppm THF
compared with controls (17/50, 24/50, 26/50, and 41/48) (NTP, 1998). The females also showed
a statistically significant positive trend in hepatocellular carcinomas (albeit not a significantly
increased incidence; 6/50, 10/50, 10/50, and 16/48). There was no significant increase in
incidences of hepatocellular adenomas or carcinomas in male mice (35/50, 31/50, 30/50, and
18/50), even after adjustment for differential survival.
A 2-year cancer bioassay by the oral route has been conducted for the THF metabolite
GBL (NTP, 1992), which showed no evidence of carcinogenicity in rats (male and female) or
female mice, although an increased incidence of adrenal medulla pheochromocytomas and
hyperplasia were observed. The authors concluded that there was equivocal evidence of
carcinogenic potential. Mechanistic studies for THF following exposure by the inhalation route
also suggest that THF itself rather than a metabolite might be responsible for the observed liver
4-40
and kidney responses. Based on mode of action data and the difference in tumor responses for
THF and GBL in NTP (1998, 1992) bioassays, EPA concluded that the cancer bioassay data for
THF metabolites were not relevant for the assessment of THF carcinogenicity in humans.
As discussed in Section 4.5, results from genotoxicity and mutagenicity studies for THF
are mostly negative and provide very limited evidence to suggest a mutagenic mode of action.
All bacterial mutation assays were negative for THF. In vitro genotoxicity assays with
eukaryotic cells were also negative with the exception of a slight increase in chromosomal
aberrations in Chinese hamster ovary cells with metabolic activation (Galloway et al., 1987). In
vivo studies suggest that THF is not likely to be mutagenic; however, studies have not been
conducted in target tissues.
4.7.3. Mode of Action Information
Both renal and hepatocellular adenomas and carcinomas are observed following
inhalation exposure to THF (NTP, 1998). There are mechanistic data suggesting that the
induction of kidney tumors in male rats and liver tumors in female mice may involve the
accumulation of α2u-globulin in the kidney and increased cell proliferation in the liver,
respectively. However, an analysis of the data as outlined below indicates that there is
insufficient evidence to establish the roles of α2u-globulin in THF-induced kidney tumors or cell
proliferation in THF-induced liver tumors. THF is not likely to be genotoxic, as the results of
the genotoxicity and mutagenicity assays provide little evidence of genotoxic or mutagenic
activity, with most data determined to be conclusively negative (Section 4.5). Therefore, the
mode of carcinogenic action of THF has not been established.
4.7.3.1. Kidney Tumors
Description of the hypothesized mode of action.
Generally, kidney tumors observed in cancer bioassays in laboratory animals are assumed
to be relevant to humans. However, a number of chemicals have been shown to induce renal
tumors as a result of accumulation of α2u-globulin in hyaline droplets. This accumulation
initiates a sequence of events that leads to renal nephropathy and, eventually, renal tubular tumor
formation. The phenomenon is unique to the male rat since female rats and other laboratory
mammals administered the same chemicals do not accumulate α2u-globulin in the kidney and do
not subsequently develop renal tubule tumors (Doi et al., 2007; U.S. EPA, 1991b). Some
experimental data suggest that the development of kidney tumors in male rats following
exposure to THF may involve an α2u-globulin-mediated mode of action; therefore, an analysis of
the data is outlined in the following sections.
4-41
Identification of key events.
For chemicals inducing kidney tumors in male rats involving the α2u-globulin
accumulation mode of action, the following events occur after binding of the chemicals or their
metabolites specifically, but reversibly, to α2u-globulin:
• Increased number and size of hyaline droplets in renal proximal tubule cells of treated male rats;
• Accumulation of hyaline droplets containing α2u-globulin in renal proximal tubules due to the resistance of the α2u-globulin chemical complex to hydrolytic degradation by lysosomal enzymes; and
• Induction of typical pathological lesions associated with α2u-globulin nephropathy (e.g., single-cell necrosis, exfoliation of epithelial cells into the proximal tubular lumen, formation of granular casts, linear mineralization of papillary tubules, and tubule hyperplasia).
Experimental support for the hypothesized mode of action.
Strength, consistency, specificity of association.
Chhabra et al. (1998) published a summary of the NTP (1998) bioassay and presented
data on the accumulation of α2u-globulin (as indicated by protein droplets) in the male rat kidney
following 13 weeks of exposure to 1,800 ppm THF. The NTP study reported qualitative
differences in the appearance of protein droplets of the kidneys of control versus male rats
exposed to 1,800 ppm THF. Differences in the appearance and location of protein droplets in the
male rat kidneys for control and high-concentration exposed rats were noted. Protein droplets
were described as finer and more densely and diffusely distributed in tubular epithelial cells in
the outer cortex for control rats. In the high-concentration exposed rats, protein droplets were
characterized as coarser and concentrated in scattered foci in the outer cortex. However, the
average severity grades for the accumulation of protein droplets did not differ and no other
differences in the incidence of non-neoplastic lesions in the male rat kidneys were observed.
Therefore, no clear signs of treatment-related pathological lesions in the kidney were found in
the NTP (1998) study (Chhabra et al., 1998).
BASF (1998) re-evaluated kidney tissues of male rats to examine the relationship
between cell proliferation responses and an increase in kidney tumors following THF
administration in the NTP (1998) study. Histopathological examination and evaluation of cell
proliferation as measured by proliferating cell nuclear antigen (PCNA) staining was conducted
for tissue samples from the 0, 200, 600, and 1,800 ppm (0, 590, 1,770, and 5,310 mg/m3)
exposure groups (10/group) from the NTP (1998) 13 week, subchronic study. Kidney tissues
from the cortex, outer stripe of the outer medulla, inner stripe of the outer medulla, and the inner
4-42
medulla were evaluated separately. The histopathological examination revealed an increased
incidence of moderate grade hyaline droplet accumulation in the male rat kidney tissues of the
high-concentration exposure group as compared with controls, but these changes were not
accompanied by evidence of cell degeneration. No increase in cell proliferation was found in
any of the individual kidney compartments or in evaluation of all compartments combined. Cell
proliferation index was statistically significantly decreased in individual kidney compartments,
although these changes did not show a concentration-dependent pattern. No other differences
among controls and exposure groups were noted.
Gamer et al. (2002; BASF, 2001a) conducted a series of mode of action studies for
kidney effects in male F344 rats (6/group) at similar THF-exposure concentrations to those that
were used in the NTP (1998) cancer bioassay. Endpoints, including α2u-globulin accumulation,
cell proliferation, and apoptosis, were evaluated. Animals were placed in one of three groups
that were exposed 6 hours/day for either 5 consecutive days, 5 consecutive days followed by a
21-day observation period, or 20 consecutive days over a period of approximately 28 days. Test
animals were exposed “nose-only” to average THF concentrations of 0, 598, 1,811, or 5,382
mg/m3 (0, 199, 604, or 1,794 ppm), corresponding to the concentrations used in the NTP (1998)
cancer bioassay. For the animals in each of the four concentration groups, a full necropsy was
done, including histopathological evaluation of the kidney. Additional evaluations in these same
organs included measurements of cell proliferation (S-phase response by 5-bromo-2-
deoxyuridine [BrdU] staining) and terminal deoxynucleotidyl dUTP nick-end-labeling staining
(TUNEL) apoptosis assay.
Results of the study (Gamer et al., 2002; BASF, 2001a) provide some evidence for
α2u-globulin accumulation. Specifically, THF exposure induced α2u-globulin accumulation in
male rats in an exposure-related manner (see Table C-3) after 5- or 20-day exposures (6
hours/day). The accumulation of α2u-globulin as measured by immunohistochemistry was
supported by histopathological evaluation of hyaline droplets in the kidneys of control and high-
concentration animals exposed to THF for 20 days. The incidence of proximal tubule cells with
grade 2 (slightly increased) staining for hyaline droplets (putatively α2u-globulin) was 5/6 for
exposed animals versus 1/6 for controls. The study also showed that focal areas of α2u-globulin
accumulation corresponded to areas of increased cell proliferation. Although no significant
increase in labeling index in the renal cortex was determined by standard assessment methods,
focal areas of increased BrdU labeling were noted. Quantitation of these areas revealed
increased cell proliferation in subcapsular proximal tubules (cortex 1) in animals exposed to THF
at the mid and high concentrations for 20 days and at the high concentration for 5 consecutive
days. No increase in labeling was observed in the groups given a 21-day recovery period. An

4-43
increase in cell proliferation was also noted in the proximal tubules between the outer stripe of
the outer medulla and the subcapsular layer (cortex 2) at the highest concentration following 20
exposures. The number of cells undergoing apoptosis was significantly increased in the high-
concentration groups exposed for 5 days and observed for 21 days or after 20 exposure days.
Marginal increases were observed in the mid-concentration groups for these two exposure
regimens, but the results were not statistically significant (see Table C-3).
Kawata and Ito (1984) reported protein casts and hyaline droplets in the kidneys of THF-
exposed male Wistar rats. No other details of the study are available.
Dose-response concordance.
THF exposure induced α2u-globulin accumulation in male rats treated under all three
exposure regimens in the study by Gamer and coworkers (Gamer et al., 2002; BASF, 2001a).
Increases were generally concentration related, with increases at the high concentration ranging
from 175 to 280% of control levels for cortex 1 and from 188 to 324% of control levels for
cortex 2 among the three exposure regimens. When the whole cortex was used as the labeled
area for the analysis, accumulation was significantly elevated beginning at the low concentration
and following 5 consecutive days or 20 days of exposure. Maximum effects observed at the high
concentration ranged from 178 to 299% of controls among the three exposure regimens.
Increased cell proliferation and apoptosis in kidneys of animals exposed to THF for 20 days also
appeared to show a dose-response relationship (see Table C-3).
Temporal relationship.
The mode of action data were obtained from short-term exposures (5 or 20 days) of THF.
Except for some qualitative differences in the appearance of protein droplets of the kidneys of
control versus male rats exposed to 1,800 ppm THF, no signs of treatment-related pathological
lesions in the kidney were found in the 2-year bioassay of NTP (1998). No increase in cell
proliferation was found in any of the kidney compartments in the 13-week study of BASF
(1998). Therefore, a temporal relationship of the key events to male rat kidney tumor induction
cannot be established.
Biological plausibility and coherence.
The concordance between α2u-globulin accumulation, cell proliferation, and induction of
apoptosis in the renal cortex with exposure concentrations that induced kidney tumors in the
cancer bioassay, lends support to the involvement of these mechanisms in THF-induced rat
kidney tumors. However, no increase in renal tubule hyperplasia or mineralization was observed
4-44
in the NTP (1998) study. The detection of α2u-globulin accumulation only when sensitive
detection methods were used (i.e., immunohistochemical staining as opposed to standard staining
for histopathological examination) suggests that the responses are weak (Chhabra et al., 1998;
NTP, 1998). Furthermore, the observed cell proliferation response, which was increased to a
maximum of 298% of controls when selected for focal areas of proliferation, was minimal when
compared with cell proliferation responses induced by other well-characterized inducers of
α2u-globulin accumulation (Gamer et al., 2002; BASF, 2001a; U.S. EPA, 1991b). There is also
an uncertainty regarding the specificity of the relationship between cell proliferation (a putative
tumor precursor event) and the observed α2u-globulin accumulation, since the mode of action
study by Gamer and colleagues (Gamer et al., 2002; BASF, 2001a) did not include a similar
analysis of cell proliferation in female rat kidneys. A major area of uncertainty arises from the
absence of detectable histopathological lesions characteristic of this mode of action. No
treatment-related renal histopathology or hyaline or granular casts were noted in the BASF study
(Gamer, et al., 2002; BASF, 2001a). Because of the weak response in α2u-globulin accumulation
and cell proliferation and the absence of the detectable pathological findings, the evidence for
this mode of action is equivocal.
Other possible modes of action.
It is possible that advanced CPN may play a role in kidney toxicity and perhaps THF-
induced kidney tumors in male rat kidneys. CPN is an age-related renal disease of laboratory
rodents that occurs spontaneously and generally with high incidence. Accelerated tubular cell
degeneration and regeneration associated with CPN could be involved in the development of
proliferative lesions observed in the kidneys of THF-exposed rats. These slight increases in cell
proliferation may have contributed to the development of adenomas in male rats in the chronic
cancer bioassay.
A comprehensive review that analyzed renal tubule findings from NTP/National Cancer
Institute (NCI) bioassays for 69 chemicals, including THF, stated that while the NTP criteria
differ in descriptive detail from those of the Society of Toxicologic Pathology, in practice, the
actual diagnoses of atypical (focal) tubule hyperplasia (ATH), adenoma, and carcinoma are
usually in accord (Lock and Hard, 2004; Hard et al., 1995). Additionally, in a study that
examined the utility of multiple-section kidney sampling in the histopathologic evaluation of
several NTP bioassays, renal tubule hyperplasia, also termed in the same study as focal renal
tubule hyperplasia or focal hyperplasia was differentiated as a potentially preneoplastic lesion
that is distinguished from the background regenerative changes of the tubule epithelium that
accompany renal toxicity or the common age-related degenerative diseases of the kidney in rats
4-45
and mice (Eustis et al., 1994). In the same study by Eustis et al. (1994), focal hyperplasia,
adenoma, and carcinoma of the renal tubule were considered to constitute a morphological
continuum in the development and progression of neoplasia, and that other hyperplastic lesions,
specifically focal oncocytic hyperplasia and oncocytoma, were not combined with rat renal
tubule hyperplasia because their histogenesis were considered uncertain.
The Society of Toxicologic Pathology Hyperplasia Working Group evaluated the
contribution of hyperplastic lesions in 2-year rodent carcinogenicity studies to human hazard
identification and risk assessment (Boorman et al., 2003). While acknowledging that ATH is
generally considered a preneoplastic lesion, the Society of Toxicologic Pathology asserted that
the appearance of neoplasms is the only conclusive evidence of a carcinogenic response and that
qualitative evaluation of hyperplastic lesions is more appropriate than statistical analysis. It is
not appropriate to combine hyperplastic and neoplastic lesions for statistical analysis (Boorman
et al., 2003). The incidences of renal tubule tumors were separated from the findings of ATH
although consideration was given, in a qualitative sense, to supporting information from
hyperplasia (Lock and Hard, 2004).
In a study aimed at discriminating lesions common to advanced CPN from those that are
precursors of renal tubule neoplasia, namely ATH, several archived NTP carcinogenicity studies,
including THF, were re-evaluated (Hard and Seely, 2005). Hard and Seely (2005) reported foci
of ATH were considered synonymous with renal tubule hyperplasia in NTP reports; simple
tubular hyperplasia would not be considered preneoplastic but rather associated with CPN.
Utilizing the criteria described in Hard and Seely (2005), a Pathology Working Group (PWG)
convened to review the NTP (1998) 2-year inhalation carcinogenicity study of THF (Bruner et
al., 2010; PWG, 2009). The PWG pathologists confirmed the NTP conclusions that renal cell
adenomas were increased (not statistically significant) in high exposure male rats compared to
controls. However, the PWG concluded that when including only ATH as preneoplastic, the
incidence of combined preneoplastic and neoplastic lesions was similar between treated and
control male rats and further noted that neither α2u-globulin nor CPN-related regenerative
processes could be ruled out in THF-induced renal tumors (Bruner et al., 2010).
There was no difference in the incidence or severity of CPN in male rats in the NTP
(1998) 2-year carcinogenicity study of THF (both the control and high-exposure groups had the
same incidence of end-stage renal CPN). Specifically, against a background of nephropathy that
was uniform across all groups, there were more renal tubular tumors in treated rats than in the
controls, and those in the higher concentration group animals were larger in size (NTP, 1998).
Although THF did not exacerbate development of CPN, it was postulated that it may have
exacerbated the development of proliferative lesions within CPN-affected tissue. Taken
4-46
together, the data are equivocal, and based on the available evidence this potential MOA is not
sufficiently supported.
Conclusions about the hypothesized modes of action.
Generally, kidney tumors observed in cancer bioassays are assumed to be relevant for
assessment of human carcinogenic potential. However, for male rat kidney tumors, when the
mode of action evidence convincingly demonstrates that the response is secondary to
α2u-globulin accumulation, the tumor data are not used in the cancer assessment (U.S. EPA,
1991b). There are some data suggesting that male rat kidney tumors, following the inhalation
exposure observed in the NTP (1998) bioassay, may be due to the accumulation of α2u-globulin.
The criteria for demonstrating this mode of action for risk assessment purposes have been
described (U.S. EPA, 1991b). Three core criteria are considered to be most important: (1)
increase in hyaline droplets in the renal proximal tubule cells; (2) determination that the
accumulating protein in the droplets is α2u-globulin; and (3) presence of additional pathological
lesions associated with α2u-globulin. Review of the mode of action data of THF indicates that
criteria (1) and (2) are met but criterion (3) is not. An area of uncertainty is the absence of
detectable histopathological lesions characteristic of this mode of action (BASF, 2001a; NTP,
1998). The specificity of the response is also difficult to ascertain in the absence of an
evaluation of potential α2u-globulin accumulation or other potential precursor events (e.g., cell
proliferation) in female rats. However, no increased incidence of kidney tumors was observed in
female rats in the NTP (1998) study. Thus, the mode of carcinogenic action of THF-induced
renal tumors has not been established.
4.7.3.2. Liver Tumors
Description of the hypothesized mode of action.
Induction of a cell proliferation response in the liver by chemicals is generally considered
a possible mode of action for liver tumorigenesis that can occur in rodents. Sustained increase in
cell proliferation may lead to the promotion of growth of preinitiated cells and subsequently to
tumorigenesis. Changes in cellular apoptosis rates can also impact the net rate of tissue growth.
Key events for this mode of action may include histopathological evidence of
cytotoxicity/necrosis, regenerative growth, and/or apoptosis. Some experimental data suggest
that the development of liver tumors in female mice following exposure to THF may involve a
cell proliferation-related mode of action; therefore, an analysis of the data is outlined below.
Experimental support for the hypothesized mode of action.
4-47
Strength, consistency, specificity of association.
BASF (1998) evaluated the liver tissues from female mice from the NTP (1998) study to
examine the relationship between cell proliferation responses and increase in tumors observed in
these tissues following THF administration. Histopathological examination and evaluation of
cell proliferation as measured by PCNA staining was conducted for tissue samples from the 0,
200, 600, and 1,800 ppm (0, 590, 1,770, and 5,310 mg/m3) exposure groups (10/group) from the
NTP (1998) subchronic (13 weeks) study. No treatment-related histopathology was observed in
the female mouse liver tissues. The cell proliferation index was increased (39% over controls) in
tissues from the high-concentration exposed mice. However, this result was not statistically
significant and was noted as being predominantly based on the results from 2/10 animals.
Furthermore, no clear concentration-response pattern was observed, and a significant decrease in
proliferation index was observed in the mid-concentration group. Based on these results, the
study authors concluded that the examination of the tissues from the 13-week NTP (1998) study
revealed no clear increase in cell replication that could be correlated to a tumorigenic
mechanism. Gamer and colleagues (Gamer et al., 2002; BASF, 2001a) evaluated a series of
endpoints in female B6C3F1 mice (10/group plus 5 in the control and high-concentration enzyme
assays) in liver tissues in a short-term, repeated exposure study. Test animals were exposed
“nose only” to average THF concentrations of 0, 598, 1,811, or 5,382 mg/m3 (0, 199, 604, or
1,794 ppm), corresponding to the concentrations used in the NTP (1998) cancer bioassay.
Concentrations adjusted for continuous exposure were 0, 107, 323, or 961 mg/m3. For the
animals in each of the four concentration groups, a full necropsy was done, including
histopathological evaluation of the liver in addition to measurements of cell proliferation (S-
phase response by BrdU staining) and a TUNEL apoptosis assay in the same organ. Since
chemical exposures can have varying affects in different regions of the liver lobule, cell
proliferation was evaluated separately for zone 1 (periportal, the region adjacent to the portal
triad), zone 3 (centrilobular, the region adjacent to the central vein), and zone 2 (midzonal, the
area of the lobule intermediate between zones 1 and 3).
THF exposure appeared to induce cell proliferation (see Table C-4) in the female mouse
liver. Increased cell proliferation was observed in zones 2 and 3 of the liver of the high-exposure
mice following THF exposure for 5 days and in zone 3 following 20 exposures. Coincident with
the increase in BrdU labeling, the mitotic index was increased in zone 3 after 5 or 20 exposures
in the high-concentration groups. No concentration-dependent increase in BrdU labeling was
observed in the animals given a 21-day recovery period, suggesting that the increases in cell
proliferation may be an adaptive effect. No treatment-related change in the number of liver cells
undergoing apoptosis was observed.
4-48
Dose-response concordance.
Gamer and colleagues (Gamer et al., 2002; BASF, 2001a) reported increased cell
proliferation following short-term inhalation exposures at concentrations corresponding to those
that were tumorigenic in the NTP (1998) bioassay. Therefore, this event appeared consistent
with the expected dose response as compared to the tumor outcome.
Temporal relationship.
Gamer and colleagues (Gamer et al., 2002; BASF, 2001a) reported increased cell
proliferation in the liver of the high-exposure female mice following short-term inhalation
exposures (5 or 20 days) of THF. However, no concentration-dependent increase in BrdU
labeling was observed in the animals given a 21-day recovery period.
Biological plausibility and coherence.
Although increased cell proliferation was noted in short-term mode of action studies, the
data are not adequate to identify key events that precede this effect. In the earlier of these two
mode of action studies (Gamer et al., 2002; BASF, 2001a) it was not clear if the lower degree of
BrdU staining after 20 exposures as compared to 5 exposures (see Table C-4) represented
fluctuation around an average increase in cell proliferation or a decrease in the rate of
proliferation with continued exposure. While the observation that the mitotic index did not
similarly decrease after 20 exposures supports the former conclusion, the absence of a significant
increase in cell proliferation in tissues obtained from the subchronic NTP (1998) study as
reported by BASF (1998) suggests that cell proliferation might not be a sustained response even
with continued dosing and fails to explain the late onset of tumors. In the NTP (1998) bioassay,
no clear concentration-dependent increase in necrosis was observed, although the incidence of
necrosis appeared slightly elevated at the high exposure concentration. Gamer and colleagues
(Gamer et al., 2002; BASF, 2001a) reported no histopathological evidence of cell degeneration at
concentrations that induced cell proliferation. Other in vitro studies did not suggest that THF is
cytotoxic (Matthews et al., 1993; Dierickx, 1989; Curvall et al., 1984). Taken together, these
data indicate that THF-induced cell proliferation is not secondary to regenerative hyperplasia.
Changes in cellular apoptosis rates can also impact the net rate of tissue growth.
However, the single study that evaluated this endpoint (Gamer et al., 2002; BASF, 2001a)
suggested that THF exposure has little impact on apoptosis in the livers of female mice.
Therefore, the available data are not sufficient to determine key events associated with cell
proliferation that would likely be involved in carcinogenesis.
4-49
Other possible modes of action.
One possible mode of carcinogenic action is the ability of THF to inhibit gap junctional
intercellular communication (GJIC). In a study by Chen et al. (1984), co-cultures of
6-thioguanine-sensitive and resistant Chinese hamster V79 fibroblast cells were treated with
THF, and the degree of metabolic cooperation was determined by the survival of the resistant
cells. The killing of resistant cells serves as an indicator of metabolic cooperation because the
toxic 6-thioguanine metabolite that is formed only in the sensitive cells can be passed on to
normally resistant cells when gap junctions are intact. Therefore, robust growth of the resistant
cells in this assay system would suggest that GJIC is inhibited. THF was judged to be positive
(as defined by at least a doubling in recovery of resistant colonies) in the metabolic cooperation
assays, suggesting that THF can inhibit GJIC. The recovery rate of resistant cells increased with
increasing concentration (up to 100 µL of THF/5 mL of medium). Although there appears to be
a correlation between inhibition of GJIC and mouse liver carcinogenesis by some nongenotoxic
carcinogens, the mechanism is unclear (Klaunig et al., 1998). The data on GJIC presented by
Chen et al. (1984) are too limited to establish that this is the mode of action for the liver tumor
induction of THF.
As the major metabolite of THF, GHB, can be converted to GABA, and it has been
hypothesized that the production of GABA from THF may perturb the cellular level of
putrescine (1,4-diaminobutane), since putrescine is the primary source of GABA in many tissues.
Putrescine is required for proper functioning of the cell cycle and for cell growth (Lopez et al.,
1999) and has been shown to induce cell transformation and stimulate the expression of c-fos, a
proto-oncogene (Tabib and Bachrach, 1999). Therefore, it is possible that THF exposure would
increase tissue levels of GABA and putrescine, which in turn might promote cell growth and
carcinogenesis. However, the link between GABA and putrescine has not been investigated.
While this mode of action provides a possible basis for THF-induced cell proliferation and
subsequent carcinogenesis, it has not been investigated directly for THF.
Conclusions about the hypothesized mode of action.
Although increased cell proliferation was noted in short-term studies, the data are not
adequate to support the hypothesized mode of action. The absence of a significant increase in
cell proliferation in tissues obtained from the subchronic NTP (1998) study suggests that cell
proliferation might not be a sustained response even with continued dosing. Therefore, while the
cell proliferation event meets the requirement of showing the expected temporal relationship at
early time points, it is not clear that the effect is sustained for a sufficient duration to adequately
explain the late onset of tumors. Furthermore, key precursor events linked to observed cell
4-50
proliferation have not been identified. The data on other potential modes of action are too
limited to establish a mode of action for the THF-induced liver tumors.
4.8. SUSCEPTIBLE POPULATIONS AND LIFE STAGES
4.8.1. Possible Childhood Susceptibility
No adequate studies on the potential reproductive or developmental toxicity of THF in
humans were available. However, these endpoints have been evaluated following oral and
inhalation exposures to THF in animal studies and oral studies with THF metabolites. A one-
generation screening assay (BASF, 1994) and a more comprehensive two-generation assay
(Hellwig et al., 2002; BASF, 1996) were conducted for THF administered in the drinking water
of rats. Decreased body weights in both male and female pups and delayed eye opening and
increased incidence of sloped incisors in F2 pups were observed. There are no data that indicate
why developmental delays in eye opening are observed in male pups but not female pups. These
developmental effects were observed at doses that also induced maternal effects (although the
maternal effects were only of minimal severity). However, as noted in Section 3.1.1.4 of the
EPA Guidelines for Developmental Toxicity Risk Assessment (U.S. EPA, 1991a), developmental
effects occurring at the same exposure levels as maternal toxicity are still considered to represent
developmental toxicity and should not be discounted as being secondary to maternal toxicity.
For the THF metabolite GBL, no maternal or developmental effects were observed in rats
(Kronevi et al., 1988). Since no effects were observed, this study is not informative in
comparing relative susceptibility of adult and young animals. Decreased testicular weight was
reported in a short-term reproductive study for GBL (Debeljuk et al., 1983), but no impairment
of fertility was reported in the oral two-generation study for THF (Hellwig et al., 2002; BASF,
1996). Developmental studies by the inhalation route have been conducted in both rats (Mast et
al., 1992; DuPont Haskell Laboratory, 1980) and mice (Mast et al., 1992). Mast et al. (1992)
reported decreased fetal survival and incidence of sternal ossification in mice and decreased fetal
body weight in rats. DuPont Haskell Laboratory (1980) reported decreased fetal weight and
skeletal alterations. In these inhalation studies, developmental effects were observed at
concentrations that also induced maternal toxicity, but not considered secondary to maternal
toxicity (U.S. EPA, 1991a).
Comparisons of maternal to developmental effect levels can be useful for evaluating the
susceptibility of young animals. The inhalation data for THF suggest that fetuses are not likely
to be more susceptible than adult animals. This conclusion is supported by the observation that
in the inhalation toxicity database (see Table 4-10) the LOAELs for systemic toxicity in adult
animals are significantly lower than the LOAELs for developmental toxicity. In the only
available multigeneration study for THF, postnatal development (decreased pup body weight
4-51
gain, delayed eye opening, and increased incidence of sloped incisors) was affected at drinking
water concentrations that had minimal effects on the dams. The results from the two-generation
study indicate that the early postnatal period is a period of increased susceptibility, but this
conclusion is uncertain since the changes in pup body weight gain may be explained by effects
on maternal water intake. Furthermore, the related measure of fetal weight at the end of the
prenatal period was not affected in the inhalation developmental studies or in the oral
developmental study for GBL.
Only one study was identified that specifically evaluated the effect of age on toxicity of
THF. Kimura et al. (1971) estimated oral median lethal dose (LD50) values for a variety of
solvents—including THF—for newborn, 14-day-old, young adult, and older adult rats. The oral
LD50 values for THF were estimated at 2.3 mL/kg for 14-day-old rats, 3.6 mL/kg for young adult
rats, and 3.2 mL/kg for older adult rats; none of these values were statistically different.
However, the authors report that the newborn animals were much more susceptible than the other
age groups, in which doses of 1 mL/kg of all the solvents tested were generally fatal. Since
sensitivity was increased in newborns for all the solvents tested, it is not clear whether the
increased sensitivity to THF was due to its inherent toxicity to newborn rats or whether some
other aspect of the study protocol was responsible. The study results suggest that young animals
are at best marginally more susceptible to oral THF exposure than adult animals to high-dose
effects.
No toxicokinetic data are available to evaluate potential childhood susceptibility. As a
result, the role of age-dependent differences in THF metabolism could not be evaluated. It is
important to note, however, that in addition to possible genetic variability (polymorphism) as
discussed in Section 4.8.3, age-dependent variability may also exist among key THF-
metabolizing enzymes including CYP450 and lactonase (PON1).
The overall data are not sufficient to conclude with certainty whether children are likely
to be more susceptible to THF toxicity than adults. Adequate studies directly testing the
systemic effects of THF in animals of different ages, as well as data on relevant metabolic
parameters are lacking. However, the occurrence of developmental toxicity only at maternally
toxic doses suggests that children may not be more susceptible to THF than adults.
4.8.2. Possible Gender Differences
No adequate human studies on gender-based differences in THF toxicity are available.
Several toxicity studies of acute, subchronic, or chronic duration in animals have evaluated the
toxicity of THF in both males and females administered similar doses. In general, a similar
spectrum of noncancer endpoints and effect levels has been observed in both sexes for oral
(Hellwig et al., 2002; BASF, 1996; Komsta et al., 1988) and inhalation (NTP, 1998; DuPont
4-52
Haskell Laboratory, 1996b) exposure studies. However, in the NTP (1998) subchronic study,
uterine histopathology changes were observed in mice, but no histopathological effects on the
uterus were noted in the companion chronic bioassay (NTP, 1998) or in a short-term inhalation
study that evaluated histopathology of the uterus (BASF, 2001a). Changes in uterine weight (not
statistically significant) were reported in the short-term study (BASF, 2001a).
In addition, a comprehensive toxicokinetics study of THF following oral dosing of rats
and mice of both sexes was conducted by DuPont Haskell Laboratory (1998). The AUC was
higher in males, and the corresponding clearance of THF-associated radioactivity from the blood
was lower in males of both species. This result might suggest that there are gender differences in
THF metabolism, since absorption and distribution of THF were similar for males and females.
The available data suggest that THF metabolism is extensive and that oxidative metabolism is
due to CYP450 isozymes. However, the identities of the isozymes responsible for THF
metabolism have not been elucidated. In vitro evidence suggests that there are species
differences in THF metabolism (DuPont Haskell Laboratory, 2000), and, therefore, the
differences in THF metabolism between male and female rodents cannot be used to infer the
relationship in THF metabolism between sexes in humans. As noted above, whether THF or one
of its metabolites is responsible for each of the observed toxic effects has not been demonstrated.
As a result of these considerations, the implications of sex-based differences in metabolism
cannot be determined.
A significant gender difference in response observed following exposure to THF is the
sex-specific induction of kidney tumors in male rats and liver tumors in female mice (see
Section 4.7.2), although the absence of an effect in male mice may be due to the apparently
higher susceptibility to narcosis (and resulting mortality) in male mice in the chronic inhalation
bioassay (NTP, 1998).
The overall similarity in noncancer toxicity between male and female rodents in a variety
of bioassays and the absence of functional effects on male or female fertility suggest that gender-
based differences in susceptibility to THF are likely to be limited. However, a number of
findings raise questions about the potential for increased susceptibility based on gender,
including potential effects in the uterus of mice, apparent sex-specific tumor formation, and
toxicokinetic differences between male and female rodents.
4.8.3. Other
Possible genetic variability (polymorphism) and/or age-dependent variability in key THF
metabolizing enzymes may contribute to interindividual variability in toxicokinetics and possibly
to increased sensitivity to THF among certain individuals within the population. As discussed in
Section 3.3, the oxidative metabolism of THF to GBL may be catalyzed by one or more of the
4-53
liver microsomal CYP450 isoenzymes which may be subject to interindividual variation due to
genetic polymorphism. Recent investigations have shown that all members of the PON family
(e.g., PON1, PON2, and PON3), which are known to be highly conserved in mammals, have
lactonase activity and that lactones, including GBL are the preferred substrates for hydrolysis by
these isoenzymes (Draganov et al., 2005; Khersonsky and Tawfik, 2005; Billecke et al., 2000).
The THF metabolite, GBL, may undergo further metabolism to GHB by the lactonase PON1
enzyme, which also has been known to have genetic variability (polymorphism) in expression
and activity of up to 13-fold (van Himbergen et al., 2006); including a possible link to oxidative
stress and cardiovascular risk (Bhattacharyya et al., 2008). Additionally, lifestyle factors such as
smoking and alcohol consumption may also affect PON1 activity (van Himbergen et al., 2006).
It is not clear if and to what extent genetic variability in CYP450 and PON1 may influence the
respective oxidative metabolism of THF to GBL or the metabolism of GBL to GHB, and how, in
turn, such variability might influence human risk to THF exposure. In addition to possible
variability in THF toxicokinetics due to genetic polymorphism of key metabolizing enzymes,
other variables could also contribute to the degree of interindividual variability including hepatic
blood flow and compensating metabolic pathways (Ginsberg et al., 2009).
5-1
5. DOSE-RESPONSE ASSESSMENTS
5.1. ORAL REFERENCE DOSE (RfD)
5.1.1. Choice of Principal Study and Candidate Critical Effects—with Rationale and
Justification
A number of human occupational exposure and case report studies following exposure to
THF are available (see Section 4.1), and identified effects on both the CNS and liver. However,
these studies are unsuitable for the derivation of the RfD because they do not report levels of
exposure to THF. In addition, all of these studies report concomitant exposures to other
chemicals including solvents that are potentially neurotoxic.
The oral database for characterizing the potential hazards posed by THF in laboratory
animals is limited. A one-generation reproductive toxicity (dose range-finding) study (BASF,
1994) and a two-generation reproductive toxicity study (Hellwig et al., 2002; BASF, 1996) in
rats (both in drinking water) exist. Both of these studies identified increased kidney weight in
adult rats, and decreased pup body weight gain in pups as sensitive effects. Additionally, the two
–generation study also observed delayed eye opening and increased incidence of sloped incisors
in F2 pups. The two-generation study was selected as the principal study for the RfD. It is a
well-conducted, reproductive toxicity study and is considered to be more appropriate for use as
the principal study, compared with the one-generation study, because it used a narrower range of
exposure concentrations and larger group sizes, and is the more comprehensive of the two
studies. The one-generation study was considered supportive.
Regarding kidney weight effects, increased relative kidney weight was observed at
similar doses in the parental F0 males and females in both the one- and two-generation studies
(less than 10% of the control mean). Treatment-related effects on absolute kidney weight were
not as pronounced. For example, the only group for which both relative and absolute kidney
weights were significantly increased (p <0.05) was F0 males in the two-generation study,
although smaller increases (that were not statistically significant) were noted in other groups.
The observation that, at least for one group, both absolute and relative kidney weights were
increased indicate that these changes reflect the effects of THF on the kidney itself and are not
due solely to body weight changes. This conclusion is supported by the general absence of an
effect of THF on body weight gain in adult animals. Kidney weight changes that were observed
in the F0 generation were not accompanied by gross kidney pathology, or clinical chemistry
findings consistent with an effect on renal function (in the one-generation study) or by
histopathological examination (in the two-generation reproductive toxicity study). In addition,
exposure to THF had no effect on absolute or relative kidney weight in F1 generation adults.
5-2
Thus, the kidney data were not considered further in the selection of the critical effect for the
derivation of the RfD.
Decreases in pup body weight gain in F1 and F2 pups and delayed eye opening and
increased incidence in sloped incisors in F2 pups observed in rats of the two-generation
reproductive toxicity study were considered candidate critical effects for RfD derivation. The
decreases in body weight gain were consistently observed in both the F1 and F2 generation pups,
and were most pronounced during PND 7–14. The decreases were dose-related, with a positive
test for trend (p < 0.01), for both male and female pups of both generations. Specifically, body
weight gain was decreased by approximately 10-12% at the high dose in the F1 pups and 3-7%
and 10% at the mid and high doses, respectively, in the F2 pups. The body weight gain
decreases in F2 pups were accompanied by other developmental delays (i.e., delayed eye
opening and increased incidence in sloped incisors). These changes occurred in the absence of
significant maternal body weight changes or other overt signs of systemic toxicity. EPA
concluded that these endpoints indicated delayed or altered growth following exposure to THF;
an effect which is one of four major manifestations of developmental toxicity. These endpoints
in pups are considered common markers of an adverse toxicological effect on development and
are consistent with the principles and practices of the EPA’s Guidelines for Developmental
Toxicity Risk Assessment (U.S. EPA, 1991a).
On account of the small oral database for THF, alternative approaches for deriving the
RfD were considered, including the application of a route-to-route extrapolation approach using
the inhalation data and or use of the oral data for metabolites of THF. A human PBPK model
has been developed by Droz et al. (1999) to estimate the THF concentrations in the blood,
breath, and urine following an inhalation exposure for the purpose of determining biological
exposure indices that would equate to an occupational exposure level of 200 ppm THF. Human
PBPK models with both oral and inhalation portals of entry have not been developed, and no
animal PBPK models have been developed. Also, there are no comparative toxicokinetic or
toxicodynamic studies following exposure to THF by the oral route in humans and animals. In
the absence of PBPK models that include oral and inhalation routes of exposure, and lacking
inhalation absorption efficiency data in humans and rats, a route-to-route extrapolation from
inhalation to oral exposure for THF would be highly uncertain (U.S. EPA, 2002; 1994b) and was
not considered further for development of the RfD.
The use of metabolite data to calculate a reference value may be appropriate when there
are no adequate data for the parent compound or when the data indicate that the active form that
induces the critical effect is a metabolite derived from the parent compound. In both cases, the
kinetics of metabolism would need to be sufficiently understood in order to calculate the
administered dose of parent compound from the target tissue dose of the active metabolite. A
5-3
basic requirement for using the data on metabolites in a quantitative fashion for the dose-
response assessment is a demonstration that the critical effects following THF administration can
be attributed to the toxicity of metabolites. While THF metabolites also induce CNS toxicity
(narcosis), and may be more potent than THF, it is not known if this is true for other target tissue
toxicity, such as liver or kidney, as well as effects on postnatal development since evidence is
lacking that these effects are due to the action of THF metabolites. Additionally, it is not known
whether first pass hepatic metabolism of THF is or is not a detoxifying event in the absence of
information on the roles that the intermediate metabolites may play. The available data suggest
that the parent compound may be responsible for THF-induced toxicity. Therefore, the oral data
for THF, and not a metabolite, are most appropriate to serve as the basis for deriving the RfD.
5.1.2. Methods of Analysis
The candidate critical effects from the two-generation reproductive toxicity study
(Hellwig et al., 2002; BASF, 1996) considered for benchmark dose (BMD) modeling were the
F1 and F2 pup body weight gains during PND 7–14, as well as F2 pup delayed eye opening on
PND 15 and an increased incidence of sloped incisors. However, visual inspection of the data
set for delayed eye opening in F2 pups (Table 4-6) suggested that the results were not amenable
to modeling. The data were only available as average percentages of affected pups per litter.
The dose-response was not clearly monotonic, with the control group showing a larger delay on
average than the two lowest dose groups, although a statistically significantly increased delay
was indicated in the highest dose group. In addition, the data showed significant heterogeneity
in variances which was not amenable to modeling. For sloped incisors, the data were only
available as average percentages of affected pups per litter. Thus, data reported for delayed eye
opening in F2 pups on PND 15 and sloped incisors in F2 pups were insufficient to support dose-
response modeling, and these endpoints are represented by a NOAEL of 3,000 ppm (385 mg/kg-
day) and a LOAEL of 9,000 ppm (974 mg/kg-day). The decreases in body weight gain were
consistently observed in both the F1 and F2 generation pups, while the delayed eye opening and
sloped incisors were only observed in F2 pups. Thus, decreased pup body weight gain was
selected as the critical effect, and the related developmental effects are considered supportive of
the decreased pup body weight gain. Table 5-1 summarizes the pup body weight gain data.
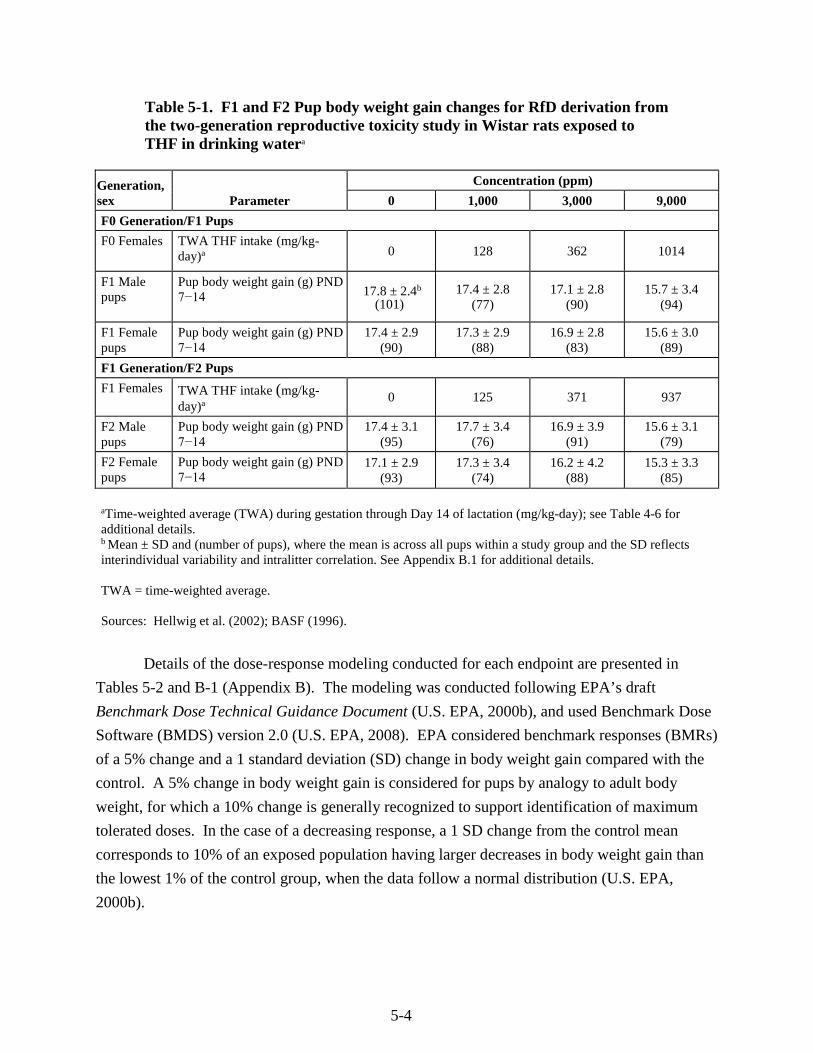
5-4
Table 5-1. F1 and F2 Pup body weight gain changes for RfD derivation from the two-generation reproductive toxicity study in Wistar rats exposed to THF in drinking watera
Generation, sex Parameter
Concentration (ppm)
0 1,000 3,000 9,000
F0 Generation/F1 Pups
F0 Females TWA THF intake (mg/kg-day)a 0 128 362 1014
F1 Male pups
Pup body weight gain (g) PND 7−14 17.8 ± 2.4b
(101) 17.4 ± 2.8
(77) 17.1 ± 2.8
(90) 15.7 ± 3.4
(94)
F1 Female pups
Pup body weight gain (g) PND 7−14
17.4 ± 2.9 (90)
17.3 ± 2.9 (88)
16.9 ± 2.8 (83)
15.6 ± 3.0 (89)
F1 Generation/F2 Pups
F1 Females TWA THF intake (mg/kg-day)a 0 125 371 937
F2 Male pups
Pup body weight gain (g) PND 7−14
17.4 ± 3.1 (95)
17.7 ± 3.4 (76)
16.9 ± 3.9 (91)
15.6 ± 3.1 (79)
F2 Female pups
Pup body weight gain (g) PND 7−14
17.1 ± 2.9 (93)
17.3 ± 3.4 (74)
16.2 ± 4.2 (88)
15.3 ± 3.3 (85)
aTime-weighted average (TWA) during gestation through Day 14 of lactation (mg/kg-day); see Table 4-6 for additional details. b Mean ± SD and (number of pups), where the mean is across all pups within a study group and the SD reflects interindividual variability and intralitter correlation. See Appendix B.1 for additional details.
TWA = time-weighted average.
Sources: Hellwig et al. (2002); BASF (1996).
Details of the dose-response modeling conducted for each endpoint are presented in
Tables 5-2 and B-1 (Appendix B). The modeling was conducted following EPA’s draft
Benchmark Dose Technical Guidance Document (U.S. EPA, 2000b), and used Benchmark Dose
Software (BMDS) version 2.0 (U.S. EPA, 2008). EPA considered benchmark responses (BMRs)
of a 5% change and a 1 standard deviation (SD) change in body weight gain compared with the
control. A 5% change in body weight gain is considered for pups by analogy to adult body
weight, for which a 10% change is generally recognized to support identification of maximum
tolerated doses. In the case of a decreasing response, a 1 SD change from the control mean
corresponds to 10% of an exposed population having larger decreases in body weight gain than
the lowest 1% of the control group, when the data follow a normal distribution (U.S. EPA,
2000b).
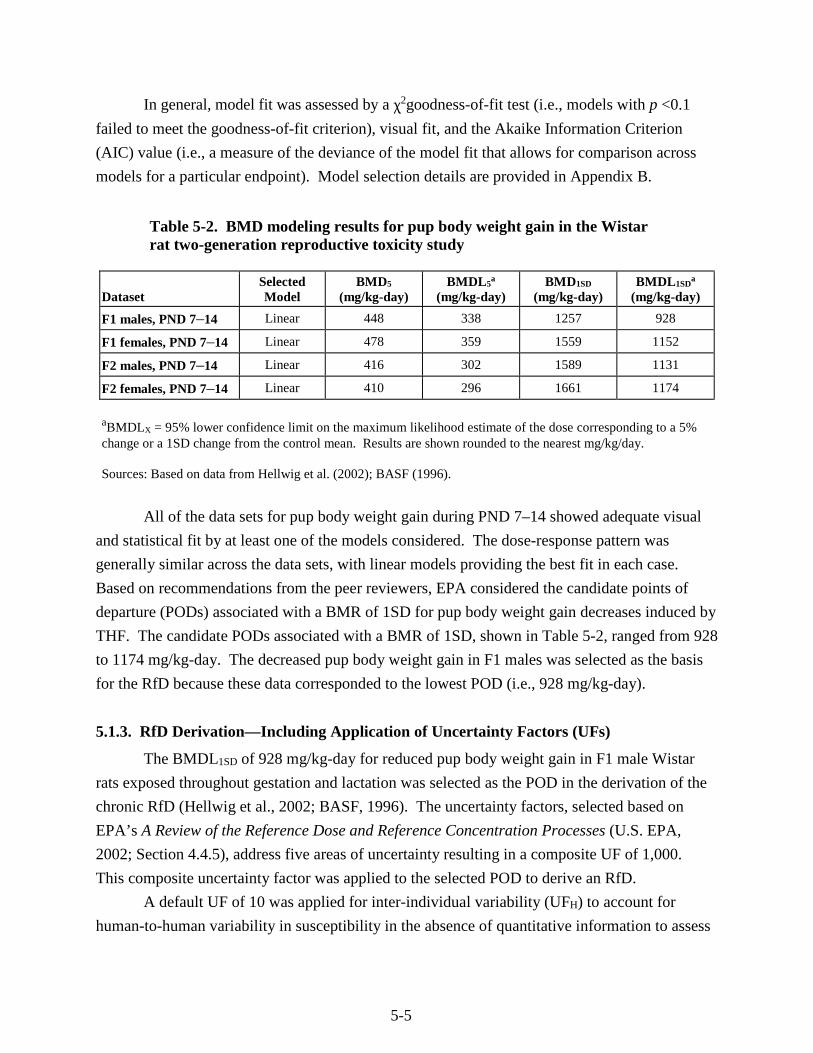
5-5
In general, model fit was assessed by a χ2goodness-of-fit test (i.e., models with p <0.1
failed to meet the goodness-of-fit criterion), visual fit, and the Akaike Information Criterion
(AIC) value (i.e., a measure of the deviance of the model fit that allows for comparison across
models for a particular endpoint). Model selection details are provided in Appendix B.
Table 5-2. BMD modeling results for pup body weight gain in the Wistar rat two-generation reproductive toxicity study
Dataset Selected Model
BMD5
(mg/kg-day) BMDL5
a
(mg/kg-day) BMD1SD
(mg/kg-day) BMDL1SD
a
(mg/kg-day)
F1 males, PND 7–14 Linear 448 338 1257 928
F1 females, PND 7–14 Linear 478 359 1559 1152
F2 males, PND 7–14 Linear 416 302 1589 1131
F2 females, PND 7–14 Linear 410 296 1661 1174
aBMDLX = 95% lower confidence limit on the maximum likelihood estimate of the dose corresponding to a 5%change or a 1SD change from the control mean. Results are shown rounded to the nearest mg/kg/day.
Sources: Based on data from Hellwig et al. (2002); BASF (1996).
All of the data sets for pup body weight gain during PND 7–14 showed adequate visual
and statistical fit by at least one of the models considered. The dose-response pattern was
generally similar across the data sets, with linear models providing the best fit in each case.
Based on recommendations from the peer reviewers, EPA considered the candidate points of
departure (PODs) associated with a BMR of 1SD for pup body weight gain decreases induced by
THF. The candidate PODs associated with a BMR of 1SD, shown in Table 5-2, ranged from 928
to 1174 mg/kg-day. The decreased pup body weight gain in F1 males was selected as the basis
for the RfD because these data corresponded to the lowest POD (i.e., 928 mg/kg-day).
5.1.3. RfD Derivation—Including Application of Uncertainty Factors (UFs)
The BMDL1SD of 928 mg/kg-day for reduced pup body weight gain in F1 male Wistar
rats exposed throughout gestation and lactation was selected as the POD in the derivation of the
chronic RfD (Hellwig et al., 2002; BASF, 1996). The uncertainty factors, selected based on
EPA’s A Review of the Reference Dose and Reference Concentration Processes (U.S. EPA,
2002; Section 4.4.5), address five areas of uncertainty resulting in a composite UF of 1,000.
This composite uncertainty factor was applied to the selected POD to derive an RfD.
A default UF of 10 was applied for inter-individual variability (UFH) to account for
human-to-human variability in susceptibility in the absence of quantitative information to assess
5-6
the toxicokinetics and toxicodynamics of THF in humans. Although a human PBPK model
based on inhalation exposure of volunteers (Droz et al., 1999) is available, information on the
human variability in response to exposure to THF is not available.
A default UF of 10 was applied for interspecies extrapolation (UFA) to account for
uncertainty in extrapolating from laboratory animals to humans (i.e., interspecies variability)
because information was unavailable to quantitatively assess toxicokinetic or toxicodynamic
differences between animals and humans for THF.
An UF of 1 was applied to account for subchronic to chronic extrapolation (UFS) because
developmental toxicity resulting from a narrow period of exposure was used as the critical effect.
The developmental period is recognized as a susceptible life stage when exposure during a time
window of development is more relevant to the induction of developmental effects than lifetime
exposure (U.S. EPA, 1991a).
An UF of 1 was applied for LOAEL-to-NOAEL extrapolation (UFL) because the current
approach is to address this factor as one of the considerations in selecting a BMR for benchmark
dose modeling. In this case, a BMR of a 1 SD decrease from the control mean in body weight
gain of F1 male rat pups was selected.
An UF of 10 was selected to account for deficiencies in the oral database (UFD). The oral
database for THF contains a two-generation reproductive toxicity study and a range-finding one-
generation reproductive study (Hellwig et al., 2002; BASF, 1996, 1994). The one-generation
study did not include a histopathological examination of tissues. The two-generation study
provided the results of histopathologic examinations limited to evaluations of the liver, kidney,
digestive, and reproductive organs in male and female rats. There are no available human
occupational or epidemiological studies or standard toxicity studies via the oral route of
exposure. Additionally, the database is lacking developmental toxicity studies. Although route-
to-route extrapolation was not possible due to inadequate PBPK models (see Section 3.6 and
5.1.1), the inhalation database was considered. Following inhalation exposure, there are
developmental toxicity studies (no two-generation reproductive toxicity studies are available)
and chronic and subchronic studies available in rats and mice (NTP, 1998; Mast et al., 1992;
DuPont Haskell Laboratory, 1980). The inhalation developmental studies provided evidence of
effects on the fetus. The subchronic and chronic studies reported systemic toxicity (CNS effects
and liver weight changes) at exposure concentrations lower than those inducing developmental
toxicity; suggesting that prenatally exposed fetuses may not be more sensitive than adult animals.
Thus, the lack of studies examining endpoints other than reproductive toxicity (i.e., standard
toxicity studies examining a comprehensive array of endpoints and developmental studies)
following oral exposure is a database deficiency; a 10-fold UF was applied.
5-7
The RfD based on the BMDL1SD for decreased pup body weight gain (Hellwig et al.,
2002; BASF, 1996) was derived as follows:
RfD = BMDL1SD ÷ (UFH × UFA × UFD) = 928 mg/kg-day ÷ (10 × 10 × 10) = 928 mg/kg-day ÷ 1,000 = 0.928 mg/kg-day = 9 × 10⁻¹ (rounded to 1 significant figure).
5.1.4. Previous RfD Assessment
This is the first IRIS assessment for THF; thus, an oral RfD was not previously available
on IRIS.
5.2. INHALATION REFERENCE CONCENTRATION (RfC)
5.2.1. Choice of Principal Study and Critical Effect—with Rationale and Justification
Human occupational exposure studies and case reports have investigated the health
effects following exposure to THF. These studies indicate that the nervous system and liver may
be targets of toxicity of THF. However, all of the published human studies contain insufficient
data on the duration and/or concentration of THF exposure. In addition, the human exposure
studies indicate the potential for coexposure to other solvents. Thus, the available human studies
are not considered suitable for use in the derivation of an RfC.
Animal studies are available that examine inhalation effects of THF following subchronic
exposure in rats and mice (NTP, 1998; DuPont Haskell Laboratory, 1996b; Malley et al., 2001;
Horiguchi et al., 1984; Kawata and Ito, 1984; Stasenkova and Kochetkova, 1963) and 2-year
exposure in rats and mice (NTP, 1998), in addition to developmental toxicity studies in both
mice (Mast et al., 1992) and rats (Mast et al., 1992; DuPont Haskell Laboratory, 1980). Several
of these studies reported portal-of-entry findings, including irritation of the nasal and respiratory
tracts (Horiguchi et al., 1984; Kawata and Ito, 1984; Stasenkova and Kochetkova, 1963) but
were not considered suitable for RfC derivation due to concerns about lack of consistency among
study findings, reporting of these effects, and study design (see Section 4.6.2).
Following chronic exposure, no clinical findings were observed in female mice; however,
clinical signs of CNS toxicity (narcosis) were the only effects observed in male mice during and
up to 1 hour after cessation of exposure to THF at 5,310 mg/m3 (NTP, 1998; chronic). Similar
effects were observed following subchronic exposure to THF in which CNS toxicity (narcosis)
was reported in both male and female rats at 14,750 mg/m3 THF and mice at e 5,310 mg/m3,
respectively (NTP, 1998; subchronic). Immediately after exposure, both male and female rats in
5-8
the high exposure group showed ataxia (irregular movement with lack of coordination). Male
and female mice exposed to 5,310, and 14,750 mg/m3 were in a state of narcosis (stupor) during
exposure, but were alert and fully awake immediately after exposure to 5,310 mg/m3 while mice
in the 14,750 mg/m3 group required up to 2 hours for recovery (NTP, 1998; chronic). It should
be noted that it is possible that the rats and mice may have developed a tolerance to THF
exposure considering the effects were observed at similar concentrations (5,310 mg/m3) in the
subchronic and chronic studies by NTP (1998). However, this cannot be determined due to the
lack of reporting of incidence data for these effects and because the chronic study did not include
the higher exposure group (14,750 mg/m3) for comparison.
Further support for THF-induced CNS effects is provided by neurotoxicity,
developmental, acute, and short-term studies. The only findings in a neurotoxicity study were
sedative effects in male and female rats at 4,425 and 8,850 mg/m3 (DuPont Haskell Laboratory,
1996b; Malley et al., 2001). Developmental studies conducted in both rats and mice reported
maternal toxicity including CNS effects (Mast et al., 1992). Following acute and short-term
exposure, symptoms of CNS toxicity, including sedation, coma, altered respiration, and
decreased response to external stimuli, were observed in dogs (Stoughton and Robbins, 1936),
mice (Stasenkova and Kochetkova, 1963; Stoughton and Robbins, 1936), and rats (Horiguchi et
al., 1984; DuPont Haskell Laboratory, 1979; Stasenkova and Kochetkova, 1963) (See Appendix
C for study descriptions). Additionally, as reported in Section 4.1, human CNS effects may
result from THF occupational exposure. Based on the above findings, the CNS toxicity was
further considered as a candidate critical effect in the derivation of the RfC.
Chronic exposure to THF resulted in a slight increase in liver necrosis in the 5,310 mg/m3
exposure group for female mice (from 3/50 in controls to 7/48) (NTP, 1998; chronic). No other
non-neoplastic findings were seen in male or female mice or rats following chronic exposure.
Subchronic exposure to THF (NTP, 1998; subchronic) provided evidence of increased liver
weights (both absolute and relative) in the 14,750 mg/m3 female rats and this finding was
accompanied by increased serum bile acid concentration in the absence of cholestasis or
hepatocellular necrosis. The study authors indicated that these changes were consistent with
decreased or altered hepatic function. In male mice, absolute and relative liver weights were
concentration-dependently and statistically significantly increased (7 – 36% above control)
following exposure to concentrations of ≥1,770 mg/m3. The increases in absolute and relative
liver weights in male mice were supported by an increased incidence of centrilobular cytomegaly
(graded mild), statistically significant at 14,750 mg/m3 (7/10 compared to 0/10 in the next lower
exposure group and the controls). Also, relative and absolute liver weights were significantly
increased (6 – 14% above control) in female mice beginning at 5,310 mg/m3 and were
accompanied by centrilobular cytomegaly (graded minimal) at 14,750 mg/m3 (10/10 animals
5-9
compared to 0/10 in the next lower exposure group and the controls) (NTP, 1998; subchronic).
The affected hepatocytes were additionally described as having slight karyomegaly (enlarged
nucleus), increased cytoplasmic volume, and granular cytoplasm with less vacuolation than that
of midzonal and periportal hepatocytes (NTP, 1998; subchronic). Liver tissues from male and
female mice of the three lower exposure groups were not examined. Additionally, no clinical
chemistry measurements were performed in mice; however, the finding of increased bile acids in
rats, in the absence of increased serum liver enzymes, was interpreted as possibly signifying
decreased or altered hepatocellular function in the 14,750 mg/m3 exposure group.
Further support in the database exists for liver effects following THF exposure.
Specifically, fatty liver degeneration (or infiltration) which was observed following short-term
inhalation exposure in female mice (Gamer et al., 2002; BASF, 2001a), is a likely adverse effect
since certain drugs which evoke fatty liver changes may predispose the liver to oxidative stress,
lipid peroxidation, and possible mitochondrial and organ damage (Begriche et al., 2006; Letteron
et al., 1996). In another subchronic inhalation toxicity study, Horiguchi et al. (1984) reported
mild liver toxicity in male rats in the form of increased serum liver enzymes, bilirubin, and
cholesterol at THF exposure concentrations of 2,950 and 14,750 mg/m3 in addition to increased
relative liver weight at 14,750 mg/m3 but no liver histopathology findings were reported (Section
4.2.1.2). Some earlier studies also reported liver effects when THF was administered in animals
using exposure routes other than inhalation (Komsta et al., 1988; Stasenkova and Kochetkova,
1963). As reported in Section 4.1, the human liver also may be a target organ for THF
occupational exposure settings. While the reported liver findings may be confounded by the
likelihood of coexposure to other chemicals, it is reasonable to conclude that repeated
occupational exposure to high concentrations of THF may have contributed to the large increases
in serum liver enzymes and the palpable liver findings in some of the human studies (Garnier et
al., 1989; Horiuchi et al., 1967).
Subchronic exposure also resulted in effects including altered organ weights (thymus and
spleen), increased bile acids, and altered hematological parameters at 14,750 mg/m3 THF in male
and female rats; however, no histopathological lesions were identified (NTP, 1998; subchronic).
The biological significance of the decrease in thymus weight was considered questionable
(Section 4.6.2). Degeneration of the adrenal cortex and uterine atrophy in the 14,750 mg/m3
female mice was also observed. According to the study authors, degeneration of the adrenal
cortex and uterine atrophy may have been a direct effect of THF on these tissues or may be the
result of a hormonal effect, possibly through perturbation of the pituitary-hypothalamic-end
organ axis (NTP, 1998; subchronic). On the other hand, no histopathological effects on the
uterus or adrenals were noted in the companion chronic bioassay (NTP, 1998; chronic) or in a
short-term inhalation study that evaluated histopathology of the uterus (BASF, 2001a). The
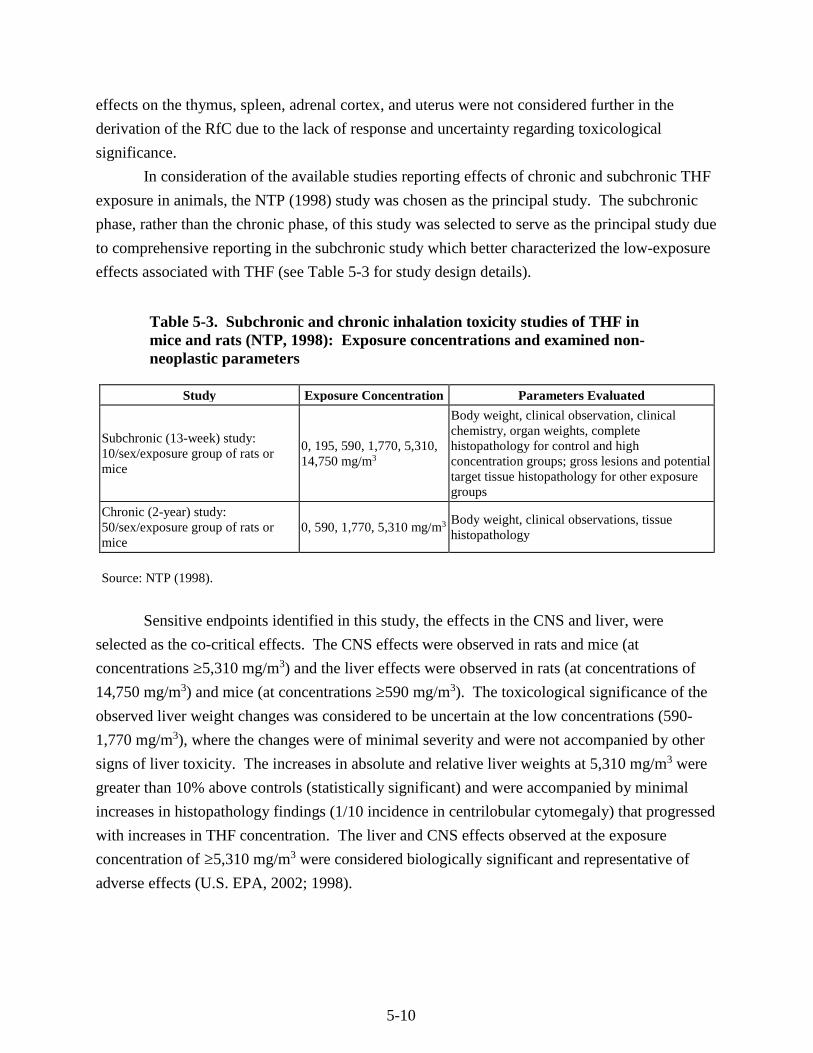
5-10
effects on the thymus, spleen, adrenal cortex, and uterus were not considered further in the
derivation of the RfC due to the lack of response and uncertainty regarding toxicological
significance.
In consideration of the available studies reporting effects of chronic and subchronic THF
exposure in animals, the NTP (1998) study was chosen as the principal study. The subchronic
phase, rather than the chronic phase, of this study was selected to serve as the principal study due
to comprehensive reporting in the subchronic study which better characterized the low-exposure
effects associated with THF (see Table 5-3 for study design details).
Table 5-3. Subchronic and chronic inhalation toxicity studies of THF in mice and rats (NTP, 1998): Exposure concentrations and examined non-neoplastic parameters
Study Exposure Concentration Parameters Evaluated
Subchronic (13-week) study: 10/sex/exposure group of rats or mice
0, 195, 590, 1,770, 5,310, 14,750 mg/m3
Body weight, clinical observation, clinical chemistry, organ weights, complete histopathology for control and high concentration groups; gross lesions and potential target tissue histopathology for other exposure groups
Chronic (2-year) study: 50/sex/exposure group of rats or mice
0, 590, 1,770, 5,310 mg/m3 Body weight, clinical observations, tissue histopathology
Source: NTP (1998).
Sensitive endpoints identified in this study, the effects in the CNS and liver, were
selected as the co-critical effects. The CNS effects were observed in rats and mice (at
concentrations ≥5,310 mg/m3) and the liver effects were observed in rats (at concentrations of
14,750 mg/m3) and mice (at concentrations ≥590 mg/m3). The toxicological significance of the
observed liver weight changes was considered to be uncertain at the low concentrations (590-
1,770 mg/m3), where the changes were of minimal severity and were not accompanied by other
signs of liver toxicity. The increases in absolute and relative liver weights at 5,310 mg/m3 were
greater than 10% above controls (statistically significant) and were accompanied by minimal
increases in histopathology findings (1/10 incidence in centrilobular cytomegaly) that progressed
with increases in THF concentration. The liver and CNS effects observed at the exposure
concentration of ≥5,310 mg/m3 were considered biologically significant and representative of
adverse effects (U.S. EPA, 2002; 1998).
5-11
5.2.2. Methods of Analysis
The most relevant endpoints for deriving the POD for the quantitative assessment were
CNS effects, hepatic centrilobular cytomegaly, and increased liver weights in male mice in the
NTP (1998) subchronic study. Data in mice, rather than rats, were modeled because mice were
more sensitive to the THF-induced liver and CNS effects. The selection of the male mouse data
was based on the fact that the liver weight increased more steadily from lower administered
exposure in males than in females. Suitable data were available to model the liver weight and
liver histopathology findings using dose-response modeling methods (see Table 5-4). Note that
because there was very little effect on body weight until the highest exposure, the absolute and
relative liver weight changes were essentially the same, and only the absolute liver weights were
considered for modeling. For CNS effects, no incidence data were available from the NTP
(1998) study, therefore dose-response modeling could not be conducted for this endpoint, and a
NOAEL was identified for the candidate POD. See Table 5-4 for the data considered for
candidate POD derivation for the liver effects.
Human equivalent concentrations (HECs) for the potential critical effects were derived
(Section 5.2.2.1), and the final selection of the POD for the RfC was made after the evaluation of
effect levels among multiple endpoints from the principal study (Section 5.2.2.2).
5.2.2.1. Calculation of HECs
The Methods for Derivation of Inhalation Reference Concentrations and Application of
Inhalation Dosimetry (hereafter referred to as the RfC Methodology) recommends converting the
POD[ADJ] (ADJ, adjusted for continuous exposure) to a human equivalent concentration (HEC)
(U.S. EPA, 1994b). For the purposes of this assessment, the induction of extrarespiratory tract
effects in the liver and CNS is consistent with properties of a category 3 gas as described under
the RfC methodology (U.S. EPA, 1994b).
For category 3 gases, HECs are calculated by multiplying the duration-adjusted exposure
concentration by the regional gas dose ratio (RGDR) for the extrarespiratory region. The RGDR
for extrarespiratory effects is calculated by finding the ratio of the animal-to-human blood:gas
(air) partition coefficients. In cases where there are either no data available or where the animal
partition coefficient is larger than the human coefficient, a default value of 1 is used for the
RGDR. For THF, a human blood:gas partition coefficient was available from Ong et al. (1991);
however, no value was available for animals. Therefore, the default of 1 was applied in
estimating the HECs for extrarespiratory effects. For example, for the concentration of
1,770 mg/m3, which corresponds to the NOAEL for the CNS toxicity (narcosis) in male and
female mice in the NTP (1998) study, the HEC based on the equation for a category 3 gas was
calculated by estimating continuous equivalent exposure and applying the RGDR, as follows:
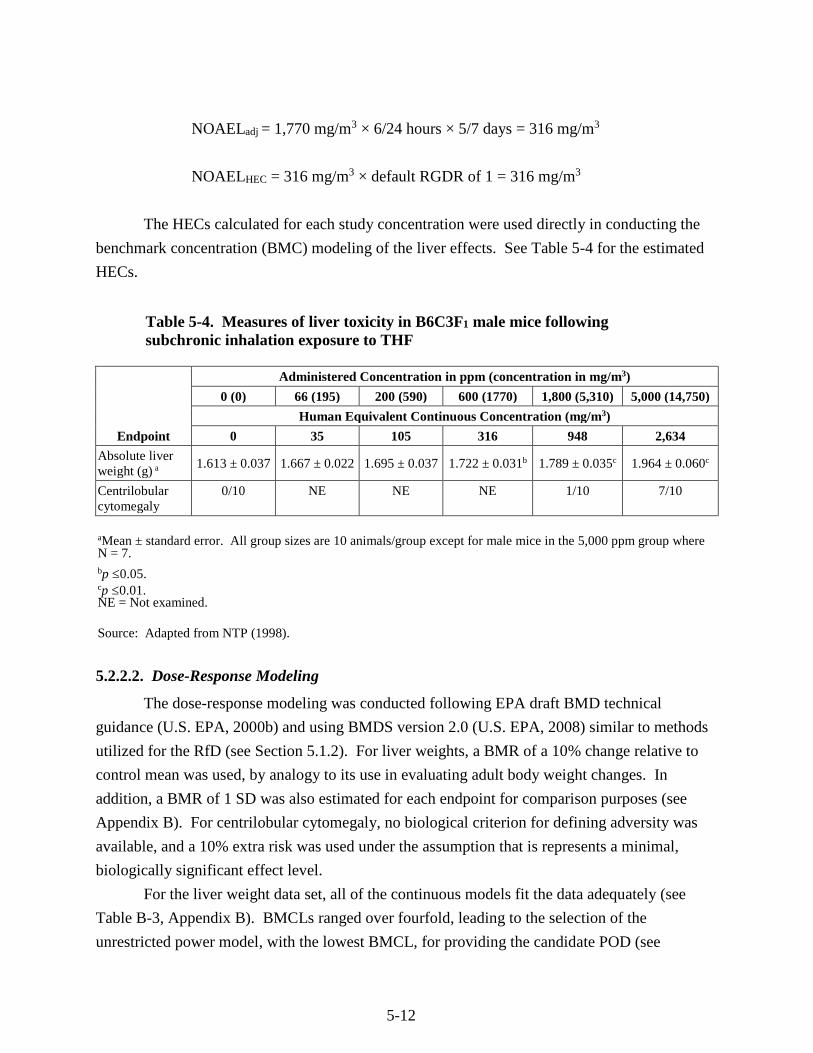
5-12
NOAELadj = 1,770 mg/m3 × 6/24 hours × 5/7 days = 316 mg/m3
NOAELHEC = 316 mg/m3 × default RGDR of 1 = 316 mg/m3
The HECs calculated for each study concentration were used directly in conducting the
benchmark concentration (BMC) modeling of the liver effects. See Table 5-4 for the estimated
HECs.
Table 5-4. Measures of liver toxicity in B6C3F1 male mice following subchronic inhalation exposure to THF
Endpoint
Administered Concentration in ppm (concentration in mg/m3)
0 (0) 66 (195) 200 (590) 600 (1770) 1,800 (5,310) 5,000 (14,750)
Human Equivalent Continuous Concentration (mg/m3)
0 35 105 316 948 2,634
Absolute liver weight (g) a
1.613 ± 0.037 1.667 ± 0.022 1.695 ± 0.037 1.722 ± 0.031b 1.789 ± 0.035c 1.964 ± 0.060c
Centrilobular cytomegaly
0/10 NE NE NE 1/10 7/10
aMean ± standard error. All group sizes are 10 animals/group except for male mice in the 5,000 ppm group where N = 7. bp ≤0.05.cp ≤0.01.NE = Not examined.
Source: Adapted from NTP (1998).
5.2.2.2. Dose-Response Modeling
The dose-response modeling was conducted following EPA draft BMD technical
guidance (U.S. EPA, 2000b) and using BMDS version 2.0 (U.S. EPA, 2008) similar to methods
utilized for the RfD (see Section 5.1.2). For liver weights, a BMR of a 10% change relative to
control mean was used, by analogy to its use in evaluating adult body weight changes. In
addition, a BMR of 1 SD was also estimated for each endpoint for comparison purposes (see
Appendix B). For centrilobular cytomegaly, no biological criterion for defining adversity was
available, and a 10% extra risk was used under the assumption that is represents a minimal,
biologically significant effect level.
For the liver weight data set, all of the continuous models fit the data adequately (see
Table B-3, Appendix B). BMCLs ranged over fourfold, leading to the selection of the
unrestricted power model, with the lowest BMCL, for providing the candidate POD (see
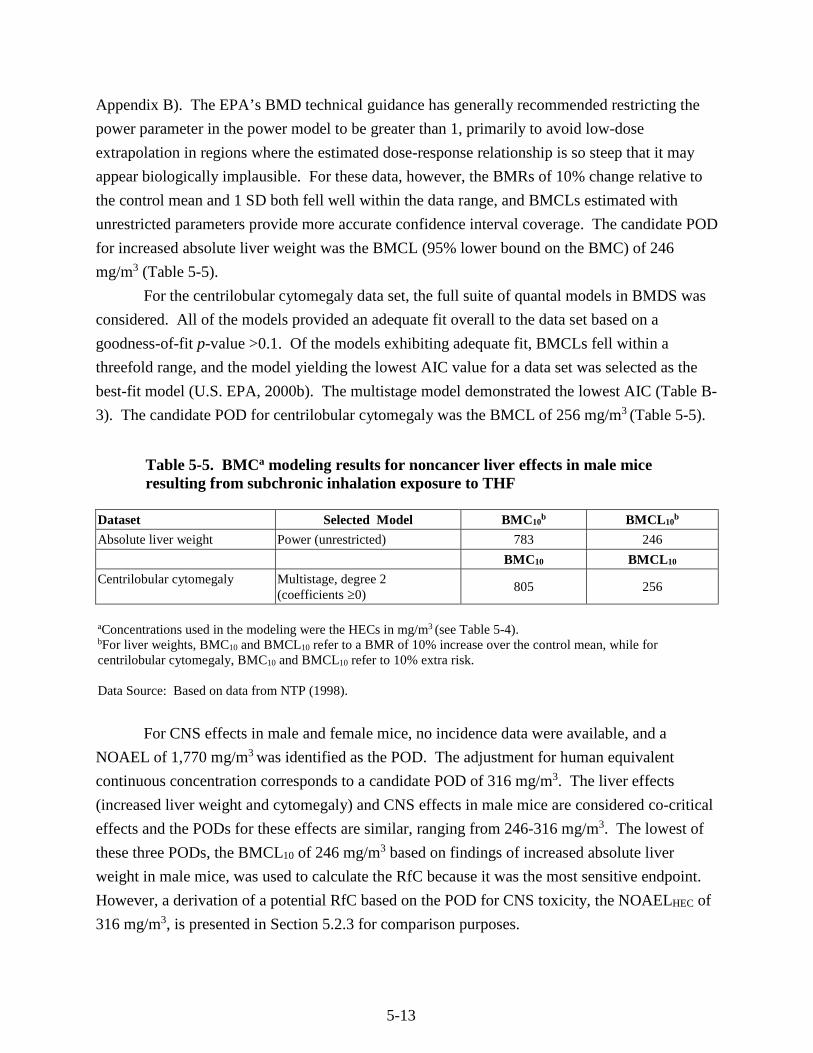
5-13
Appendix B). The EPA’s BMD technical guidance has generally recommended restricting the
power parameter in the power model to be greater than 1, primarily to avoid low-dose
extrapolation in regions where the estimated dose-response relationship is so steep that it may
appear biologically implausible. For these data, however, the BMRs of 10% change relative to
the control mean and 1 SD both fell well within the data range, and BMCLs estimated with
unrestricted parameters provide more accurate confidence interval coverage. The candidate POD
for increased absolute liver weight was the BMCL (95% lower bound on the BMC) of 246
mg/m3 (Table 5-5).
For the centrilobular cytomegaly data set, the full suite of quantal models in BMDS was
considered. All of the models provided an adequate fit overall to the data set based on a
goodness-of-fit p-value >0.1. Of the models exhibiting adequate fit, BMCLs fell within a
threefold range, and the model yielding the lowest AIC value for a data set was selected as the
best-fit model (U.S. EPA, 2000b). The multistage model demonstrated the lowest AIC (Table B-
3). The candidate POD for centrilobular cytomegaly was the BMCL of 256 mg/m3 (Table 5-5).
Table 5-5. BMCa modeling results for noncancer liver effects in male mice resulting from subchronic inhalation exposure to THF
Dataset Selected Model BMC10b BMCL10
b
Absolute liver weight Power (unrestricted) 783 246
BMC10 BMCL10
Centrilobular cytomegaly Multistage, degree 2 (coefficients ≥0)
805 256
aConcentrations used in the modeling were the HECs in mg/m3 (see Table 5-4). bFor liver weights, BMC10 and BMCL10 refer to a BMR of 10% increase over the control mean, while for centrilobular cytomegaly, BMC10 and BMCL10 refer to 10% extra risk.
Data Source: Based on data from NTP (1998).
For CNS effects in male and female mice, no incidence data were available, and a
NOAEL of 1,770 mg/m3 was identified as the POD. The adjustment for human equivalent
continuous concentration corresponds to a candidate POD of 316 mg/m3. The liver effects
(increased liver weight and cytomegaly) and CNS effects in male mice are considered co-critical
effects and the PODs for these effects are similar, ranging from 246-316 mg/m3. The lowest of
these three PODs, the BMCL10 of 246 mg/m3 based on findings of increased absolute liver
weight in male mice, was used to calculate the RfC because it was the most sensitive endpoint.
However, a derivation of a potential RfC based on the POD for CNS toxicity, the NOAELHEC of
316 mg/m3, is presented in Section 5.2.3 for comparison purposes.
5-14
5.2.3. RfC Derivation—Including Application of Uncertainty Factors (UFs)
The BMCL10 of 246 mg/m3 for increased absolute liver weight in male B6C3F1 mice
exposed to THF for 6 hours/day, 5 days/week for 90 days (NTP, 1998) was selected as the POD
in the derivation of the RfC. The uncertainty factors, selected based on EPA’s A Review of the
Reference Dose and Reference Concentration Processes (U.S. EPA, 2002; Section 4.4.5),
address five areas of uncertainty resulting in a composite UF of 100. This composite uncertainty
factor was applied to the selected POD to derive an RfC.
A default UF of 10 was applied for inter-individual variability (UFH) to account for
human-to-human variability in susceptibility in the absence of quantitative information to assess
the toxicokinetics and toxicodynamics of THF in humans. Although a human PBPK model
based on inhalation exposure of volunteers (Droz et al., 1999) is available, information on human
variability relating to toxicodynamics and toxicokinetics in response to exposure to THF is not
available.
An UF of 3 (i.e., 101/2 = 3.16 rounded to 3) was applied for interspecies extrapolation
(UFA) to account for the uncertainty in extrapolating from laboratory animals to humans. This
value is adopted by convention where an adjustment from an animal-specific PODADJ to a
PODHEC has been incorporated. Application of an UF of 10 would depend on two areas of
uncertainty (i.e., toxicokinetic and toxicodynamic uncertainties). In this assessment, the
toxicokinetic component associated with exposure to THF is mostly addressed by the
determination of an HEC as described in the RfC methodology (U.S. EPA, 1994b). The
toxicodynamic uncertainty is also accounted for to a certain degree by the use of the applied
dosimetry method and an UF of 3 is retained to account for the remaining uncertainty regarding
the toxicodynamic differences between mice and humans.
An UF of 1 was applied to account for extrapolation from subchronic-to-chronic
exposure (UFS), due to the lack of evidence that increased duration of exposure to THF may
increase the incidence or severity of these effects. The 14-week study for THF (NTP, 1998;
subchronic), selected as the principal study, reported critical findings of CNS effects and
increased liver weight which was supported by hepatic centrilobular cytomegaly. In the chronic
exposure phase of the study, while no organ weights were taken, no hepatic cytomegaly was
identified at any exposure level including the high exposure group of 5,310 mg/m3. However,
the incidence of liver necrosis in the female mice of the 5,310 mg/m3 exposure group (NTP,
1998; chronic) was increased (although not statistically significant) from 3/50 in the control to
7/48. The available chronic information suggests that liver damage observed in rodents
following subchronic exposure to THF (NTP, 1998) may not progress to more severe effects
following chronic exposures near the POD, considering that cytomegaly was not reported at
chronic exposures ≤ 5,310 mg/m3 and that necrosis was only observed at 5,310 mg/m3 (the
5-15
highest concentration in chronic study), the same concentration as the LOAEL for the CNS and
liver effects in the subchronic study. Additionally, the CNS effects were observed following
exposure to 5,310 mg/m3 in both the subchronic and chronic studies but with no evidence of
effects at lower concentrations in the chronic study. A full comparison of the studies is not
possible given the incidence data were not reported for these effects in either study. However,
the available evidence suggests that increased duration of exposure to THF may not increase the
incidence or severity of these effects; thus, an UF of 1 was applied.
An UF of 1 was applied for LOAEL-to-NOAEL extrapolation (UFL) because the current
approach is to address this factor as one of the considerations in selecting a BMR for benchmark
dose modeling. In this case, a BMR of 10% change in absolute liver weight in male mice was
selected as a minimal biologically significant change.
An UF of 3 was applied to account for deficiencies in the database (UFD) for THF.
Chronic and subchronic inhalation bioassays and developmental toxicity studies are available in
rats and mice (NTP, 1998; Mast et al., 1992; DuPont Haskell Laboratory, 1980). The inhalation
data for THF (see Section 4.2) suggest that fetuses may not be more sensitive than adult animals
given that the observed LOAELs for developmental effects were greater than the LOAELs for
systemic toxicity (CNS and liver weight changes) in adult animals (see Table 4-10). In the oral
two-generation reproductive toxicity study for THF, postnatal development (decreased pup body
weight gain, in addition to delayed eye opening and increased incidence of sloped incisors) was
affected at drinking water concentrations that had minimal effects on the dams. No two-
generation reproductive toxicity study by the inhalation route is available. Therefore, a database
UF of 3 was applied to account for the lack of a two-generation reproductive study.
The RfC based on the BMCL10 for increased absolute liver weight (supported by the co-
critical effects, comprising CNS effects and increased incidence of centrilobular cytomegaly) in
male B6C3F1 mice (NTP, 1998), was derived as follows:
RfC = BMCL10 ÷ (UFH × UFA × UFD)
= 246 mg/m3 ÷ (10 × 3 × 3)
= 246 mg/m3 ÷ 100
= 2.46 mg/m3
= 2 mg/m3 (rounded to 1 significant figure).
For comparison, a potential RfC can be derived from the PODHEC based on the NOAEL
for CNS effects as follows:
5-16
RfC = NOAELHEC ÷ (UFH × UFA × UFD)
= 316 mg/m3 ÷ 100
= 3.16 mg/m3
= 3 mg/m3 (rounded to 1 significant figure).
5.2.4. Previous RfC Assessment
This is the first IRIS assessment for THF; thus, an inhalation RfC was not previously
available on IRIS.
5.3. CANCER ASSESSMENT
Under EPA’s Guidelines for Carcinogen Risk Assessment (U.S. EPA, 2005a), the
database for THF provides “suggestive evidence of carcinogenic potential” by all routes of
exposure based on an increased incidence of hepatocellular adenomas and carcinomas in female
B6C3F1 mice and renal tubule adenomas and carcinomas in male F344/N rats following
inhalation exposure to THF. There was no evidence of carcinogenic activity in male mice or
female rats reported by NTP (1998), and no other treatment-related increases in tumor incidence
were observed. No studies evaluating the carcinogenicity of THF by the oral or inhalation routes
were identified in humans (see Section 4.1).
5.3.1. Evaluation of Inhalation Cancer Data
A 2-year NTP (1998) inhalation cancer bioassay reported an increased incidence of
hepatocellular adenomas and carcinomas in female B6C3F1 mice (statistically significant trend)
and an increased incidence of renal tubule adenomas and carcinomas in male F344/N rats
(statistically significant trend) following inhalation exposure to 200, 600, and 1,800 ppm THF
(NTP, 1998) (see Section 4.7.2).
The U.S. EPA Guidelines for Carcinogen Risk Assessment (U.S. EPA, 2005a) state:
"When there is suggestive evidence, the Agency generally would not attempt a dose-response
assessment, as the nature of the data generally would not support one; however, when the
evidence includes a well-conducted study, quantitative analyses may be useful for some
purposes, for example, providing a sense of the magnitude and uncertainty of potential risks,
ranking potential hazards, or setting research priorities. In each case, the rationale for the
quantitative analysis is explained, considering the uncertainty in the data and the suggestive
nature of the weight of evidence. These analyses generally would not be considered Agency
consensus estimates."
In this case, the NTP (1998) cancer bioassay for THF is a well-conducted study showing
hepatocellular adenoma or carcinomas in female mice that were increased in a dose-related
5-17
manner, starting at an approximate 15% increase over controls at the lowest exposure. The
adjusted rate of renal adenoma or carcinoma in male rats was also increased in a dose-related
manner, starting at an approximate 9% increase over controls at the lowest exposure. The data
from this study are amenable to modeling; EPA would generally derive a cancer risk estimate
from such data.
However, a majority of the external peer review panel members (see Appendix A:
Summary of External Peer Review and Public Comments and Disposition) stated that derivation
of an inhalation unit risk (IUR) for THF would result in an overestimation of cancer risk if a
linear low-dose extrapolation approach was utilized. Although the reviewers agreed with EPA’s
conclusion that based on the available data the modes of action for both liver and kidney tumors
induced by THF are not well understood, they suggested that THF is a weak, nongenotoxic
carcinogen that would have a threshold. Specifically, they stated that THF does not appear to be
genotoxic, does not produce irreversible damage and/or proliferative lesions that are
preneoplastic, is rapidly metabolized, and is not bioaccumulative, and thus recommended the use
of a nonlinear extrapolation approach to quantify cancer risk for THF. The reviewers who
recommended a nonlinear approach suggested that a nongenotoxic carcinogen would
consequently have a nonlinear cancer response at low dose. This concept is recognized as
controversial in the scientific community.
The U.S. EPA Guidelines for Carcinogen Risk Assessment (U.S. EPA, 2005a)
recommend that the method used to characterize and quantify cancer risk for a chemical is
determined by what is known about the mode of action of the carcinogen and the shape of the
cancer dose-response curve. The linear approach is recommended if the mode of action of
carcinogenicity is not understood (U.S. EPA, 2005a). In the case of THF, very little data are
available to inform the mode of action and no data are available to indicate the shape of the dose-
response curve at low doses. If data were available to better inform the mode of action, and the
data were indicative of a threshold response, then a reference value could be derived based on a
precursor endpoint (i.e., key event in the mode of action) and considered for the RfC for THF. In
such a case, the reference value would be considered protective against tumor development
following inhalation exposures. For THF, there were no reported noncancer effects that could
serve as a precursor endpoint upon which to base a nonlinear analysis. EPA considered whether
the cell proliferation reported in the livers of mice following short-term exposure to THF was a
potential key event in the development of female mouse liver tumors; however, given the
absence of proliferation data in any of the subchronic or chronic studies, the use of this endpoint
is not supported. Thus, the nonlinear analysis recommended by the peer reviewers cannot be
readily implemented.
5-18
Based on the peer reviewers’ concern for the potential overestimation of risk in deriving
an IUR for THF using a linear low-dose extrapolation approach combined with the uncertainty
associated with the carcinogenic potential for THF, EPA did not derive an IUR. However,
because there may be some circumstances for which a cancer risk estimate for THF would be
useful, EPA has presented what the inhalation cancer risk estimate would be if it were derived
using a linear low-dose approach. This derivation can be found in Appendix B. Risk assessors
should use caution when considering the use of this value due to the uncertainty associated with
the potential overestimation of risk related to the linear low-dose extrapolation approach
employed in its derivation and the suggestive nature of the tumorigenic response.
5.3.2. Previous Cancer Assessment
This is the first IRIS assessment for THF; thus, a cancer assessment was not previously
available on IRIS.
6-1
6. MAJOR CONCLUSIONS IN THE CHARACTERIZATION OF HAZARD
AND DOSE RESPONSE
6.1. HUMAN HAZARD POTENTIAL
6.1.1. Oral Noncancer
The database for oral toxicity of THF is limited. No human data following oral exposure
to THF are available. A number of human occupational exposure and case report studies
suggesting CNS and liver effects following THF exposure are available; however, these studies
do not report levels of THF exposure and all studies included exposures to other chemicals
known to cause similar toxicity. CNS toxicity appears to be the primary health effect following
acute exposure in animals, although no CNS effects were reported in the rodent drinking water
reproductive toxicity studies of longer exposure duration. Short-term and subchronic oral
exposure studies (4 weeks to approximately 90 days) suggest that general toxicity (characterized
by altered food and water consumption and decreased body weight) and liver and kidney toxicity
are potential health effects of oral exposure to THF. The available reproductive toxicity studies
suggest that THF induces effects in the offspring of exposed dams.
The two-generation reproductive toxicity in rats (Hellwig et al., 2002; BASF, 1996) was
selected as the principal study for the derivation of the RfD. The RfD of 0.9 mg/kg-day is based
on a BMDL1SD of 928 mg/kg-day for decreased pup body weight gain (Hellwig et al., 2002;
BASF, 1996). A composite UF of 1,000 was used. This factor is based on selection of an
uncertainty factor of 10 to account for intrahuman variability, 10 for interspecies extrapolation,
and 10 for uncertainties in the database.
No sensitive subpopulations have been identified. The developmental effects were
observed at doses that also induced maternal effects (although the maternal effects were only of
minimal severity). Therefore, the existing data do not provide convincing evidence for age-
related differences in sensitivity to noncancer effects following oral exposure to THF. Overall,
there is some uncertainty about systemic toxicity following exposure to THF by the oral route.
Specifically, the available data on parental rats was limited to body weight, food and water
intake, reproductive performance, and histopathology of limited organs. There is uncertainty
regarding other non-examined parameters following exposure by the oral route including
possible developmental neurobehavioral effects, hematotoxicity, functional immunity, and a
more inclusive histopathology assessment.
A confidence level of high, medium, or low is assigned to the study used to derive the
RfD, the overall database, and the RfD itself, as described in Section 4.3.9.2 of EPA’s Methods
for Derivation of Inhalation Reference Concentrations and Application of Inhalation Dosimetry
(U.S. EPA, 1994). There is medium confidence in the principal study (Hellwig et al., 2002;
6-2
BASF, 1996); however, the overall confidence in the oral THF database is low, with several key
data gaps identified, including lack of a full systemic toxicity study and developmental toxicity
studies. Therefore, the confidence in the RfD is characterized as low-to-medium.
6.1.2. Inhalation Noncancer
Although no epidemiological studies of THF have been conducted, several occupational
exposure case studies in humans suggest that target organs in humans are the CNS, respiratory
tract, liver, and kidney (Garnier et al., 1989; Albrecht et al., 1987; Juntunen et al., 1984; Edling,
1982; Emmett, 1976). The major uncertainties associated with all of the reported human case
studies are that none reported actual exposure levels for THF and the workers were exposed to
other solvents and chemicals in addition to THF; therefore, it is not possible to attribute the
observed effects to THF exposure alone. Nevertheless, inhalation studies in animals generally
identified a similar array of target organs (see Table 4-10) including clinical signs of CNS
toxicity and liver toxicity.
Respiratory tract irritation was reported in multiple human and animal studies. One
consideration in evaluating the potential health consequences due to THF-induced respiratory
tract irritation is the role of the exposure duration on the severity of the effect. Several acute or
short-term exposure studies (Ikeoka et al., 1988; Horiguchi et al., 1984; Ohashi et al., 1983)
identified concentrations inducing irritant responses that were lower than the concentrations that
induced toxicity in subchronic and chronic studies (NTP, 1998). There is direct evidence that
respiratory tract responses are transient in nature, waning with increasing exposure duration
(Horiguchi et al., 1984). These data suggest that irritant responses not observed with subchronic
or chronic exposure could occur in individuals who were not previously exposed.
Several systemic effects have been observed following subchronic or chronic inhalation
exposure to THF. Decreased body weight has been observed in rats (Horiguchi et al., 1984;
Kawata and Ito, 1984). Decreased blood pressure was observed in dogs (BASF, 1938) and rats
(Stasenkova and Kochetkova, 1963). Altered hematological parameters were observed in rats
(NTP, 1998; Horiguchi et al., 1984), mice (NTP, 1998; Stasenkova and Kochetkova, 1963), and
dogs (BASF, 1938). Following 14 weeks of inhalation exposure, rats of both sexes had
significantly increased relative liver weight and significantly relative weights for thymus and
spleen; male rats also had significantly increased relative kidney and lung weights (NTP, 1998).
In the same study, mice of both sexes showed increased relative liver weight and decreased
relative spleen weight, while male mice only had decreased relative thymus weight and female
mice had a slightly reduced relative lung weight (NTP, 1998). In addition, Horiguchi et al.
(1984) observed increased relative weights of brain, lung, liver, pancreas, spleen, and kidney.
6-3
Developmental studies by the inhalation route have been conducted in both rats (Mast et
al., 1992; DuPont Haskell Laboratory, 1980) and mice (Mast et al., 1992). In both studies and
both species, maternal toxicity included symptoms of CNS effects and significant decreases in
body weight accompanied by decreases in gravid uterine weight (Mast et al., 1992) or food
consumption (DuPont Haskell Laboratory, 1980). Decreased fetal weight was observed at the
same concentration that resulted in maternal toxicity in rats (Mast et al., 1992). In both mice
(Mast et al., 1992) and rats (DuPont Haskell Laboratory, 1980), decreased fetal survival also
occurred at the same concentrations that resulted in maternal toxicity. However, as noted in
Section 3.1.1.4 of the EPA Guidelines for Developmental Toxicity Risk Assessment (U.S. EPA,
1991a), developmental effects occurring at the same exposure levels as maternal toxicity are still
considered to represent developmental toxicity and should not be discounted as being secondary
to maternal toxicity. With regard to potential teratogenic effects, Mast et al. (1992) noted that in
mice that survived the exposure period, no increase was observed in the incidence of fetal
abnormalities. However, an increased incidence of incomplete sternal ossification in rat fetuses
was observed (DuPont Haskell Laboratory, 1980).
After consideration of all endpoints, the CNS effects and liver toxicity, observed in the
subchronic NTP (1998) study, were determined to be the most sensitive effects. Furthermore,
the THF database contains additional support for these endpoints from both human and animal
studies (Gamer et al., 2002; BASF, 2001a; Garnier et al., 1989; Komsta et al., 1988; Horiguchi et
al., 1984; DuPont Haskell Laboratory, 1979; 1980; 1996a; 1996b; Horiuchi et al., 1967;
Stasenkova and Kochetkova, 1963).
The subchronic toxicity study in mice (NTP, 1998; subchronic) was selected as the
principal study for the derivation of the RfC. The RfC of 2 mg/m3 is based on findings of CNS
and liver toxicity in male mice (NTP, 1998), with a POD of 246 mg/m3 derived from the
BMCL10 value for increased absolute liver weight. A composite UF of 100 was used. This
factor is based on a default factor of 10 to account for intrahuman variability, 3 for extrapolation
from an animal study for which effect levels were adjusted by appropriate animal-to-human
dosimetry, and 3 to account for uncertainties in the overall inhalation toxicity database.
No sensitive subpopulations have been identified. The existing data do not provide
convincing evidence for age- or gender-related differences in sensitivity to noncancer effects of
THF, although there is uncertainty regarding the potential effects on postnatal development
following inhalation exposure. A number of findings raise questions about the potential for
increased susceptibility based on gender, including potential effects in the uterus of mice,
apparent sex-specific tumor formation, and toxicokinetic differences between male and female
rodents.
6-4
As noted in Section 6.1.1, a confidence level of high, medium, or low is assigned to the
study used to derive the RfC, the overall database, and the RfC itself, as described in EPA (U.S.
EPA, 1994), Section 4.3.9.2. The principal study used to derive the RfC (NTP, 1998) was a
well-conducted and documented study reflecting high confidence. The study included
subchronic and chronic exposure duration components in two species by the relevant route of
exposure, evaluated a comprehensive array of tissues, and covered a well-spaced concentration
range. Confidence in the supporting database is medium to high. Although chronic toxicity
studies (NTP, 1998) and developmental toxicity studies (Mast et al., 1992; DuPont Haskell
Laboratory, 1980) were available for the inhalation route, no multigeneration reproductive
toxicity study by the inhalation route is available. Both the inhalation developmental toxicity
studies (Mast et al., 1992; DuPont Haskell Laboratory, 1980) and the oral two-generation
reproductive toxicity study (Hellwig et al., 2002; BASF, 1996) show that effects in fetuses and
pups occur at exposures that cause at least minimal maternal effects and that these concentrations
are higher than the NOAEL for organ weight changes in mice (NTP, 1998). Based on high
confidence in the well-conducted principal study and medium-to-high confidence in the
database, the overall confidence in the RfC can be characterized as medium to high.
6.1.3. Cancer
Under the U.S. EPA Guidelines for Carcinogen Risk Assessment (U.S. EPA, 2005a), the
database for THF provides “suggestive evidence of carcinogenic potential” by all routes of
exposure. No epidemiological studies were identified that evaluated the carcinogenic potential
of THF via the oral, inhalation, or dermal routes of exposure. A 2-year NTP (1998) inhalation
cancer bioassay reported an increased incidence of hepatocellular adenomas and carcinomas in
female B6C3F1 mice (statistically significant trend) and an increased incidence of renal tubule
adenomas and carcinomas in male F344/N rats (statistically significant trend) following
inhalation exposure to 200, 600, and 1,800 ppm of THF (NTP, 1998).
The available mechanistic information and possible modes of action were evaluated for
the male rat kidney tumors and female mouse liver tumors. For the rat kidney tumors, there were
some data suggesting that following the inhalation exposure in the NTP (1998) bioassay, tumors
developed due to the accumulation of α2u-globulin. However, the data were insufficient to
establish this mode of action. Also, the available evidence is not sufficient to support CPN as a
potential MOA for the increase in male rat kidney tumors. For mouse liver tumors, although
increased cell proliferation was noted in short-term studies, these data were not adequate to
establish this mode of action. The absence of a significant increase in cell proliferation in tissues
obtained from the subchronic NTP (1998) study also suggests that cell proliferation might not be
a sustained response even with continued dosing. Furthermore, key precursor events linked to
6-5
observed cell proliferation were not identified. The data on other potential modes of action were
too limited to establish the mode of action for liver tumors induced by THF.
An IUR was not derived based on peer reviewers’ concern for the potential
overestimation of risk in deriving an IUR using a linear low-dose extrapolation approach
combined with the uncertainty associated with the carcinogenic potential for THF. Because
there may be some circumstances for which a cancer risk estimate for THF would be useful,
EPA has presented, in Apprendix B, what the inhalation cancer risk estimate would be if it were
derived using a linear low-dose approach. Risk assessors should use caution when considering
the use of this value due to the uncertainty associated with the potential overestimation of risk
related to the linear low-dose extrapolation approach employed in its derivation and the
suggestive nature of the tumorigenic response.
R-1
7. REFERENCES
ACGIH (American Conference of Governmental Industrial Hygienists). (2001) Tetrahydrofuran. In: Documentation of the threshold limit values and biological exposure indices. Cincinnati, OH: American Conference of Governmental Industrial Hygienists.
Adams, TB; Greer, DB; Doull, J; et al. (1998) The FEMA GRAS assessment of lactones used as flavour ingredients. Food Chem Toxicol 36:249–278.
Addolorato, G; Cibin, M; Caprista, E; et al. (1998) Maintaining abstinence from alcohol with γ -hydroxybutyric acid. Lancet 351:38.
Albrecht, WN; Boiano, JM; Smith, RD. (1987) IgA glomerulonephritis in a plumber working with solvent-based pipe cement. Ind Health 25:157–158.
Andriamampandry, C; Taleb, O; Kemmel, V; et al. (2007) Cloning and functional characterization of a gamma-hydroxybutyrate receptor identified in the human brain. FASEB J 21:885–895.
Arimoto, S; Nakano, N; Ohara, Y; et al. (1982) A solvent effect on the mutagenicity of tryptophan-pyrolysate mutagens in the Salmonella/mammalian microsome assay. Mutat Res 102(2):105–112.
BASF (Badische Anilin- und Sodafabrik). (1938) Toxicity of tetrahydrofuran, with cover letter dated 05/10/94 (sanitized). Submitted under TSCA Section 8D; EPA Document No. 86940000738S; NTIS No. OTS0557148.
BASF. (1993) Safety data sheet of pure distilled tetrahydrofuran.
BASF. (1994) Brief report: One-generation reproduction toxicity study of tetrahydrofuran in rats; administration in the drinking water; range-finding study. Project No. 16R0144/93020.
BASF. (1996) Tetrahydrofuran: two-generation reproduction toxicity study in Wistar rats, continuous administration in the drinking water, with cover letter dated 8/30/96. Study No. 71R0144/93038. Submitted under TSCA Section 8D. EPA Document No. 86960000573. NTIS No. OTS558774.
BASF. (1998) Tetrahydrofuran: study on cell proliferation in F344/N rats and B6C3F1 mice, with cover letter dated 10/14/1998. Study No. 97055. Submitted under TSCA Section 8D. EPA Document No. 86990000001. NTIS No. OTS0573851.
BASF. (2001a) Tetrahydrofuran: subacute inhalation study in F344 rats and B6C3F1 mice 20 exposures to vapors including interim sacrifices of satellite groups after 5 exposures, with a cover letter from the Tetrahydrofuran Task Force dated 04/10/2001. Study No. 9910151/99007.
BASF. (2001b) Tetrahydrofuran: 5-day inhalation study in female B6C3F1 mice vapor exposure. Study No. 9910151/99129.
Begriche, K; Igoudjil, A; Pessayre, D; et al. (2006) Mitochondrial dysfunction in NASH: causes, consequences and possible means to prevent it. Mitochondrion 6(1):1–28.
Billecke, SD; Draganov, R; Counsell, P; et al. (2000) Human serum paraoxonase (PON1) isozymes Q and R hydrolyze lactones and cyclic carbonate esters. Drug Metab Dispos 28(11):1335–1342.
Boorman, G; Dixon, D; Elwell, M; et al.. (2003) Assessment of hyperplastic lesions in rodent carcinogenicity studies. Toxicol Pathol 31(6):709–710.
Brooke, I; Cocker, J; Delic, JL; et al. (1998) Dermal uptake of solvents from the vapor phase: an experimental study in humans. Ann Occup Hyg 42:531–540.
R-2
Cascorbi, I. (2006) Genetic basis of toxic reactions to drugs and chemicals. Toxicol Lett 162(1):16–28.
Chen, TH; Kavanagh, TJ; Chang, CC; et al. (1984) Inhibition of metabolic cooperation in Chinese hamster V79 cells by various organic solvents and simple compounds. Cell Biol Toxicol 1(1):155–171.
Chhabra, RS; Elwell, MR; Chou, B; et al. (1990) Subchronic toxicity of tetrahydrofuran vapors in rats and mice. Fundam Appl Toxicol 14(2):338–345.
Chhabra, RS; Herbert, RA; Roycroft, JH; et al. (1998) Carcinogenesis studies of tetrahydrofuran vapors in rats and mice. Toxicol Sci 41(2):183–188.
Collins, JL; Patek, PQ; Cohn, M. (1982) In vivo surveillance of tumorigenic cells transformed in vitro. Nature 299(5879):169–171.
Couper, FJ; Marinetti, LJ. (2002) y-Hydroxybutyrate (GHB)—Effects on human performance and behavior. Forensic Sci Rev 14(1):101–121.
Crump, KS. (1995) Calculation of benchmark doses from continuous data. Risk Anal 15(1):79–89.
Curvall, M; Enzell, CR; Pettersson, B. (1984) An evaluation of the utility of four in vitro short term tests for predicting the cytotoxicity of individual compounds derived from tobacco smoke. Cell Biol Toxicol 1(1):173–193.
Dammann, M. (2005) Statistical analysis of the THF (tetrahydrofuran) kidney carcinomas and adenomas of the male rat based on the expert report by Dr. Gordon C. Hard dated March 14, 2005. BASF, Germany, May 9, 2005. (unpublished report available through the IRIS Submission Desk).
Debeljuk, L; del Carmen Diaz, M; Maines, VM; et al. (1983) Prolonged treatment with γ-aminobutyric acid (gaba)-mimetic substances in prepubertal male rats. Arch Androl 10:239–243.
DeFeudis, FV; Collier, B. (1970). Conversion of γ-hydroxybutyrate to γ-aminobutyrate by mouse brain in vivo. Experientia 26:1072–1073.
Dierickx, PJ. (1989) Cytotoxicity testing of 114 compounds by the determination of the protein content in HepG2 cell cultures. Toxicol In Vitro 3(3):189–193.
Dietert, RR; Etzel, RA; Chen, D; et al. (2000) Workshop to identify critical windows of exposure for children's health: Immune and respiratory systems work group summary. Environ Health Perspect 108(Suppl 3):483–490.
Doherty, JD; Hattox, SE; Snead, OC; et al. (1978) Identification of endogenous γ-hydroxybutyrate in human and bovine brain and its regional distribution in human, guinea pigs and rhesus monkey brain. J Pharmacol Exp Ther 207:130–139.
Doi, AM; Hill, G; Seely, J; et al. (2007). Alpha 2µ-globulin nephropathy and renal tumors in national toxicology program studies. Toxicol Pathol 35(2):533–540.
Draganov, DI; Teiber, JF; Speelman, A; et al. (2005) Human paraoxonases (PON1, PON2, and PON3) are lactonases with overlapping and distinct substrate specificities. J Lipid Res 46(6):1239–1247.
Droz, PO; Wu, MM; Cumberlan, WG; et al. (1989) Variability in biological monitoring of solvent exposure. I. Development of a population physiological model. Br J Ind Med 46:447–460.
Droz, PO; Berode, M; Jang, JY. (1999) Biological monitoring of tetrahydrofuran: contribution of a physiologically based pharmacokinetic model. Am Ind Hyg Assoc J 60(2):243–248.
R-3
DuPont Haskell Laboratory. (1979) Initial submission: acute inhalation toxicity with tetrahydrofuran in rats with cover letter dated 061592 and attachments. E.I. DuPont de Nemours and Company, Newark, DE; HLR-848-79. Submitted under TSCA Section 8ECP; EPA Document No. 88-920004255; NTIS No. OTS0540603. DuPont Haskell Laboratory. (1980) Tetrahydrofuran (THF) inhalation: effect on the rat conceptus. E.I. DuPont de Nemours and Company, Newark, DE; HLR-750-82. Submitted under TSCA Section 8ECP; EPA Document No. 88-920001524; NTIS No. OTS0535908. DuPont Haskell Laboratory. (1996a) Acute inhalation neurotoxicity study of tetrahydrofuran in rats. E.I. DuPont de Nemours and Company, Newark, DE; Haskel Laboratory Report No. 548-94. Submitted under U.S. EPA Pesticide Guidelines, Subdivision F, 82-7. DuPont Haskell Laboratory. (1996b) 90-Day inhalation neurotoxicity study with tetrahydrofuran in rats, with cover letter dated 11/26/96. E.I. DuPont de Nemours and Company, Newark, DE; HLR-97-96. Submitted under TSCA Section 4; EPA Document No. 44635; NTIS No. OTS0558874. DuPont Haskell Laboratory. (1998) 14C-Tetrahydrofuran: disposition and pharmacokinetics in rats and mice, with cover letter dated 10/14/1998. E.I. DuPont de Nemours and Company, Newark, DE; HLR-1998-01377. Submitted under TSCA Section 8D; EPA Document No. 86990000002; NTIS No. OTS0573852. DuPont Haskell Laboratory. (2000) Tetrahydrofuran: comparative in vitro microsomal metabolism. E.I. DuPont de Nemours and Company, Newark, DE; DuPont-1103. Dusdiecker, LB; Booth, BM; Stumbo, PJ; et al. (1985) Effect of supplemental fluids on human milk production. J Pediatr 106(2):207–211. Edling, C. (1982) Interaction between drugs and solvents as a cause of fatty change in the liver? Br J Ind Med 39(2):198–199. Eldefors, S; Ravn-Jonsen, A. (1992) Effect of organic solvents on nervous cell membrane as measured by changes in the (Ca2+/Mg2+) ATPase activity and fluidity of synaptosomal membrane. Pharmacol Toxicol 70:181–187. Elovaara, E; Pfaffli, P; Savolainen, H. (1984) Burden and biochemical effects of extended tetrahydrofuran vapour inhalation of three concentration levels. Acta Pharmacol Toxicol (Copenh) 54(3):221–226. El Sayed, YM; Sadée, W. (1983) Metabolic activation of R,S-1-(tetrahydro-2-furanyl)-5-fluorouracil (ftorafur) to 5-fluorouracil by soluble enzymes. Cancer Res 43:4039–4044. Emmett, EA. (1976) Parosmia and hyposmia induced by solvent exposure. Br J Ind Med 33(3):196–198. Eustis, SL; Hailey, JR; Boorman, GA; et al. (1994) The utility of multiple sampling in the histopathological evaluation of the kidney for carcinogenicity studies. Toxicol Pathol 22(5):457–472. Ferrara, SD; Giorgetti, R; Zancaner, S; et al. (1999) Effects of single dose of gamma-hydroxybutyric acid and lorazepam on psychomotor performance and subjective feelings in healthy volunteers. Eur J Clin Pharmacol 54:821–827. Florin, I; Rutberg, L; Curvall, M; et al. (1980) Screening of tobacco smoke constituents for mutagenicity using the Ames’ test. Toxicology 18(3):219–232. Fujita, T; Suzuoki, Z. (1973). Enzymatic studies on the metabolism of the tetrahydrofuran mercaptan moiety of thiamine tetrahydrofurfuryl disulfide. III. Oxidative cleavage of the tetrahydrofuran moiety. J Biochem 74:733–738. Funes-Cravioto, F; Zapata-Gayon, C; Kolmodin-Hedman, B; et al. (1977) Chromosome aberrations and sister-chromatid exchange in workers in chemical laboratories and a rotoprinting factory and in children of women laboratory workers. Lancet 2(8033):322–325.
R-4
Gallimberti, L; Ferri, M; Ferrara, SD; et al. (1992) Gamma-hydroxybutyric acid in the treatment of alcohol dependence: a double-blind study. Alcohol Clin Exp Res 16(4):673–676. Gallimberti, L; Cibin, M; Pagnin, P; et al. (1993) Gamma-hydroxybutyric acid for treatment of opiate withdrawal syndrome. Neuropsychopharmacology 9(1):77–81. Galloway, SM; Armstrong, MJ; Reuben, C; et al. (1987) Chromosome aberrations and sister chromatid exchanges in Chinese hamster ovary cells: evaluations of 108 chemicals. Environ Mol Mutagen 10(Suppl 10):1–175. Gamer, AO; Jaeckh, R; Leibold, E; et al. (2002) Investigations on cell proliferation and enzyme induction in male rat kidney and female mouse liver caused by tetrahydrofuran. Toxicol Sci 70:140–149. Garnier, R; Rosenberg, N; Puissant, JM; et al. (1989) Tetrahydrofuran poisoning after occupational exposure. Br J Ind Med 46(9):677–678. Gibson, DP; Brauninger, R; Shaffi, HS; et al. (1997) Induction of micronuclei in Syrian hamster embryo cells: comparison to results in the SHE cell transformation assay for National Toxicology Program test chemicals. Mutat Res 392(1–2):61–70. Gibson, KM; Sweetman, L; Nyhan, WL; et al. (1983) Succinic semialdehyde dehydrogenase deficiency: an inborn error of gamma-aminobutyric acid metabolism. Clin Chim Acta 133:33–42. Ginsberg, G; Smolenski, S; Neafsey, P; et al. (2009). The influence of genetic polymorphisms on population variability in six xenobiotic-metabolizing enzymes. J Toxicol Environ Health B 12(5–6):307–333. Hageman, G; Kikken, R; Ten Hoor, F; et al. (1988) Assessment of mutagenic activity of repeatedly used deep-frying fats. Mutat Res 204(4):593–604. Hara, K; Nagata, T; Kimura, K. (1987) Forensic toxicological analysis of tetrahydrofuran in body materials. Z Rechtsmed 98:49–55. Hard, GC; Alden, CL; Stula, EF; et al. (1995) Proliferative lesions of the kidney in rats. In: Guides for Toxicologic Pathology. STP/ARP/AFIP, Washigton, DC, pp. 1–19. Hard, GC. (2002) Significance of the renal effects of ethyl benzene in rodents for assessing human carcinogenic risk. Toxicol Sci 69(1):30–41. Hard, GC. (2005) Expert report on renal histopathology induced in F344 rats in subchronic toxicity and carcinogenicity studies with tetrahydrofuran. Prepared for SOCMA Tetrahydrofuran Task Force, Washington, DC, March 14, 2005 (unpublished report available through the IRIS Submission Desk). Hard, GC; Khan, KN. (2004) A contemporary overview of chronic progressive nephropathy in the laboratory rat, and its significance for human risk assessment. Toxicol Pathol 32(2):171–180. Hard, GC; Seely, JC. (2005) Recommendations for the interpretation of renal tubule proliferative lesions occurring in rat kidneys with advanced chronic progressive nephropathy (CPN). Toxicol Pathol 33(6):641–649. Hellwig, J; Gembardt, C; Jasti, S. (2002) Tetrahydrofuran: two-generation reproduction toxicity in Wistar rats by continuous administration in the drinking water. Food Chem Toxicol 40(10):1515–1523. Henderson, VE; Smith, AHR. (1936) Anaesthetic effects of some furan derivatives. J Pharmacol Exp Ther 57:394–398. Herold, AH; Sneed, KB. (2002) Treatment of a young adult taking gamma-butyrolactone (GBL) in a primary care clinic. J Am Board Fam Med 15(2): 161-163.
R-5
Hofmann, HT; Oettel, H. (1954) Concerning the toxicity of tetrahydrofuran. Pharmakologie 222:233–235.
Horiguchi, S; Teramoto, K; Katahira, T. (1984) Acute and repeated inhalation toxicity of tetrahydrofuran in laboratory animals. Sumitomo Sangyo Eisei 20:141–157.
Horiuchi, K; Horiguchi, S; Utsunomiya, T; et al. (1967) Toxicity of an organic solvent, tetrahydrofuran, on the basis of industrial health studies at a certain factory. Sumitomo Bull Ind Health 3:49–56.
Hossaini-Hilali, J; Benlamlih, S; Dahlborn, K. (1994) Effects of dehydration, rehydration, and hyperhydration in the lactating and non-lactating black Moroccan goat. Comp Biochem Physiol A Physiol 109(4):1017–1026.
Ikeoka, H; Nakai, Y; Ohashi, Y; et al. (1988) Experimental studies on the respiratory toxicity of tetrahydrofuran in a short term exposure. Sumitomo Sangyo Eisei 19:113–119.
Juntunen, J; Kaste, M; Harkonen, H. (1984) Cerebral convulsion after enfluran anaesthesia and occupational exposure to tetrahydrofuran. J Neurol Neurosurg Psychiatry 47(11):1258.
Kageyama, M. (1988) Exposure of humans to inhalation of tetrahydrofuran: elimination through expiration and decay in alveolar air and blood. J Osaka-shi Igakkai Zasshi 37(1):19–33.
Katahira, T; Teramoto, K; Horiguchi, S. (1982) Experimental studies on the toxicity of tetrahydrofuran administered to animals by repeated inhalation. Jpn J Ind Health 24:379–387.
Kaufman, EE; Nelson, T. (1987) Evidence for the participation of a cytosolic NADP+-dependent oxidoreductase in the catabolism of γ -hydroxybutyrate in vivo. J Neurochem 48:1935–1941.
Kaufman, EE; Nelson, T; Goochee, C; et al. (1979) Purification and characterization of an NADP+-linked alcohol oxido-reductase which catalyzes the interconversion of γ-Hydroxyl-butyrate and succinic semialdehyde. J Neurochem 32:699–712.
Kavlock, RJ; Allen , BC; Faustman, EM; et al. (1995) Dose-response assessment for development toxicity IV. Benchmark dose for fetal weight changes. Fundam Appl Toxicol 26:211–222.
Kawata, F; Ito, A. (1984) Experimental studies on the effects of organic solvents in living bodies: Changes of tetrahydrofuran concentration in rats’ organs and histological observations after inhalation. Nihon Hoigaku Zasshi 8(3):367–375.
Kawata, F; Shimizu, T; Ozono, S. (1986) Determination and fluorescent-histochemical approach to catecholamines in the rat brain after inhalation of tetrahydrofuran. Nihon Hoigaku Zasshi 40(6):811–820.
Kerckaert, GA; Brauninger, R; LeBouef, RA; et al. (1996) Use of the Syrian hamster embryo cell transformation assay for carcinogenicity prediction of chemicals currently being tested by the National Toxicology Program in rodent bioassays. Environ Health Perspect 104(Suppl 5):1075–1084.
Kimura, ET; Ebert, DM; Dodge, PW. (1971) Acute toxicity and limits of solvent residue for sixteen organic solvents. Toxicol Appl Pharmacol 19(4):699–704.
Klaunig, JE; Ruch, RJ; DeAngelo, AB; et al. (1998) Inhibition of mouse hepatocyte intercellular communication by phthalate monoesters. Cancer Lett 43(1–2):65–71.
Kobayashi, K; Urashima, K; Shimada, N; et al. (2002) Substrate specificity for rat cytochrome P450 (CYP) isoforms: Screening with cDNA-expressed systems of the rat. Biochem Pharmacol 63(5):889–896.
Komsta, E; Chu, I; Secours, VE; et al. (1988) Results of a short-term toxicity study for three organic chemicals found in Niagara River drinking water. Bull Environ Contam Toxicol 41(4):515–522.
R-6
Kronevi, T; Holmberg, B; Arvidsson, S. (1988) Teratogenicity test of γ-butyrolactone in the Sprague-Dawley rat. Pharmacol Toxicol 62:57–58.
LaBelle, CW; Brieger, H. (1955) The vapor toxicity of a compound solvent and its principal components. Arch Ind Health 12:623–627.
Letteron, P; Fromenty, B; Terris, B; et al. (1996) Acute and chronic hepatic steatosis lead to in vivo lipid peroxidation in mice. J Hepatol 24(2):200–208.
Little, W; Collis, KA; Gleed, PT; et al. (1980) Effect of reduced water intake by lactating dairy cows on behavior, milk yield and blood composition. Vet Rec 106(26):547–551.
Lock, EA; Hard, GC (2004) Chemically induced renal tubule tumors in the laboratory rat and mouse: Review of the NCI/NTP database and categorization of renal carcinogens based on mechanistic information. Crit Rev Toxicol 34(3):211–299.
Lopez, V; Falco, C; Mori, G; et al. (1999) Apoptosis is regulated by polyamines in the cell cycle of Chinese hamster ovary cells. Biocell 23(3):223–228.
Luster, MI; Portier, C; Pait, DG; et al. (1992) Risk assessment in immunotoxicity: I. Sensitivity and predictability of immune tests. Fundam Appl Toxicol 18:200–210.
Luster, MI; Portier, C; Pait, DG; et al. (1993) Risk assessment in immunotoxicology: II. Relationships between immune and host resistance tests. Fundam Appl Toxicol 21:71–82.
Malley, LA; Christoph, GR; Stadler, JC; et al. (2001) Acute and subchronic neurotoxicology evaluation of tetrahydrofuran by inhalation in rats. Drug Chem Toxicol 24(3):201–219.
Marcus, RJ; Winters, WD; Hultin, E. (1976) Neuropharmacological effects induced by butanol, 4-hydroxybutyrate, 4-mercaptobutyric acid thiolactone, tetrahydrofuran, pyrrolidine, 2-deoxy-d-glucose and related substances in the rat. Neuropharmacology 15(1):29–38.
Maron, D; Katzenellenbogen, J; Ames, BN. (1981) Compatibility of organic solvents with the Salmonella/microsome test. Mutat Res 88(4):343–350.
Mast, TJ; Weigel, RJ; Westerberg, RB; et al. (1992) Evaluation of the potential for developmental toxicity in rats and mice following inhalation exposure to tetrahydrofuran. Fundam Appl Toxicol 18(2):255–265.
Matthews, EJ; Spalding, JW; Tennant, RW. (1993) Transformation of BALB/c-3T3 cells: V. Transformation responses of 168 chemicals compared with mutagenicity in Salmonella and carcinogenicity in rodent bioassays. Environ Health Perspect 101(Suppl 2):347–482.
McMahon, RE; Cline, JC; Thompson, CZ. (1979) Assay of 855 test chemicals in ten tester strains using a new modification of the Ames test for bacterial mutagens. Cancer Res 39:682–693.
Metcalf, DR; Emde, RN; Stripe, JT. (1966) An EEG-behavioral study of sodium hydroxybutyrate in humans. Electroencephalogr Clin Neurophysiol 20:506–512.
Miotto, K; Darakjian, J; Basch, J; et al. (2001) Gamma-hydroxybutyric acid: patterns of use, effects and withdrawal. Am J Addict 10:232–241.
Mirsalis, J; Tyson, K; Beck, J; et al. (1983) Induction of unscheduled DNA synthesis (UDS) in hepatocytes following in vitro and in vivo treatment. Environ Mutagen 5:482.
Morse, JM; Ewing, G; Gamble, D; et al. (1992) The effect of maternal fluid intake on breast milk supply: a pilot study. Can J Public Health 83(3):213–216.
R-7
Mortelmans, K; Haworth, S; Lawlor, T; et al. (1986) Salmonella mutagenicity tests: II. Results from the testing of 270 chemicals. Environ Mutagen 8(Suppl 7):1–119.
Nelson, T; Kaufman, E; Mine, J; et al. (1981) The extraneural distribution of γ-hydroxybutyrate. J Neurochem 37(5):1345–1348.
Nimmerrichter, AA; Walter, H; Gutierrez-Lobos, KE; et al. (2002) Double-blind controlled trial of γ-hydroxybutyrate and clomethiazole in the treatment of alcohol withdrawal. Alcohol and Alcoholism 37(1):67–73.
NIOSH (National Institute for Occupational Safety and Health). (1991) Health hazard evaluation report, Flexlab, Inc., Hastings, Michigan. Hazard Evaluations and Technical Assistance Branch, NIOSH, U.S. Department of Health and Human Services, Cincinnati, OH; Report No. HETA 89-267-2139.
NIOSH. (1997) NIOSH pocket guide to chemical hazards. Washington, DC: U.S. Government Printing Office. Available online at http://www.cdc.gov/niosh/npg/ (accessed July 29, 2009).
NRC (National Research Council). (1983) Risk assessment in the federal government: managing the process. Washington, DC: National Academy Press.
NSF (National Sanitation Foundation). (2003) Gamma-butyrolactone CASRN 96-48-0 oral risk assessment document [draft]. Available online at http://aec.ihs.com/collections/nsf/index.htm (accessed July 29, 2009).
NTP (National Toxicology Program). (1992) Toxicology and carcinogenesis studies of gamma-butyrolactone (CAS No. 96-48-0) in F344/N rats and B6C3F1 mice. Public Health Service, U.S. Department of Health and Human Services; NTP TR- 406. Available from the National Institute of Environmental Health Services, Research Triangle Park, NC and online at http://ntp.niehs.nih.gov/ntp/htdocs/LT_rpts/tr406.pdf (accessed July 28, 2009).
NTP. (1998) Toxicology and carcinogenesis studies of tetrahydrofuran (CAS No. 109-99-9) in F344/N rats and B6C3F1 mice. Public Health Service, U.S. Department of Health and Human Services; NTP TR- 475. Available from the National Institute of Environmental Health Services, Research Triangle Park, NC.
Ohashi, Y; Nakai, Y; Nakata, J; et al. (1983) Effects on the ciliary activity and morphology of rabbit’s nasal epithelium exposed to tetrahydrofuran. Osaka City Med J 29(1):1–14.
Ong, CN; Chia, SE; Phoon, WH; et al. (1991) Biological monitoring of occupational exposure to tetrahydrofuran. Br J Ind Med 48(9):616–621.
Pellizzari, ED; Hartwell, TD; Harris, BS; et al. (1982) Purgeable organic compounds in mother’s milk. Bull Environ Contam Toxicol 28(3):322–328.
Pettersson, B; Curvall, M; Enzell, CR. (1982) Effects of tobacco smoke compounds on the ciliary activity of the embryo chicken trachea in vitro. Toxicology 23(1):41–55.
Popjak, G. (1945) Lipids of the human kidney cortex and medulla in fatty change. J Pathol 57:87–100.
Pozdnyakova, AG. (1965) Experimental substantiation of the maximum permissible background concentration of THF and THF-alcohol in water reservoirs. Tr Leningr Sanit Gig Med Inst 81:91–96.
RIVM (Dutch National Institute for Public Health and the Environment). (2001) Re-evaluation of human-toxicological maximum permissible risk levels. RIVM, National Institute of Public Health and the Environment Bilthoven, The Netherlands; RIVM Report No. 711701 025; p. 276.
Root, B. (1965) Oral premedication of children with 4-hydroxybutyrate. Anesthesiology 26:259–260.
Roth, RH; Giarman, NJ. (1966) Gamma-butyrolactone and gamma-hydroxybutyric acid – I. Distribution and metabolism. Biochem Pharmacol 15:1333–1348.
R-8
Roth, RH; Giarman, NJ. (1968) Evidence that central nervous system depression by 1,4-butanediol is mediated through a metabolite, gamma-hydroxybutyrate. Biochem Pharmacol 17:735–739. Sawyer, TW; Baer-Dubowska, W; Chang, K; et al. (1988) Tumor-initiating activity of the bay-region dihydrodiols and diol-epoxides of dibenz[a,j]anthracene and cholanthrene on mouse skin. Carcinogenesis 9(12):2203–2207. Scharf, MB; Hauck, M; Stover, R; et al. (1998) Effect of gamma-hydroxybutyrate on pain, fatigue, and the alpha sleep anomaly in patients with fibromyalgia. Preliminary report. J Rheumatol 25:1986–1990. SRC (Syracuse Research Corporation). (2001) Environmental Fate Data Base. SRC, North Syracuse, New York. Available online at http://www.syrres.com/esc/efdb.htm (accessed July 29, 2009). Stasenkova, KP; Kochetkova, TA. (1963) The toxicity of tetrahydrofuran. Toksikol Novukn Prom Khim 5:21–34. Stoughton, RW; Robbins, BH. (1936) The anesthetic properties of tetrahydrofurane. J Pharmacol Exp Ther 58:171–173. Tabib, A; Bachrach, U. (1999) Role of polyamines in mediating malignant transformation and oncogene expression. Int J Biochem Cell Biol 31:1289–1295. Takizawa, N; Tanaka, M; Liu, Z; et al. (2003) A dissociation of gamma-butyrolactone-induced absence seizure and CRE- and AP-1 DNA-binding activities in the developing rat brain. Neurosci Res 45(4):483–490. Tassaneeyakul, W; Veronese, ME; Birkett, DJ; et al. (1993) Validation of 4-nitrophenol as an in vitro substrate probe for human liver CYP2E1 using cDNA expression and microsomal kinetic techniques. Biochem Pharmacol 46(11):1975–1981. Teiber, JF; Draganov, DI; La Du, BN. (2003) Lactonase and lactonizing activities of human serum paraoxonase (PON1) and rabbit serum PON3. Biochem Pharmacol 66:887–896. Teramoto, K; Wakitani, F; Tanaka, H; et al. (1989) Elimination of acetone, 2-propanol, styrene and tetrahydrofuran via exhaled air in rats. Toxicol Sci 14:325. U.S. EPA (Environmental Protection Agency). (1986a) Guidelines for the health risk assessment of chemical mixtures. Federal Register 51(185):34014-34025. Available from: <http://www.epa.gov/iris/backgrd.html>. U.S. EPA. (1986b) Guidelines for mutagenicity risk assessment. Federal Register 51(185):34006-34012. Available from: <http://www.epa.gov/iris/backgrd.html>. U.S. EPA. (1988) Recommendations for and documentation of biological values for use in risk assessment. Prepared by the Environmental Criteria and Assessment Office, Office of Health and Environmental Assessment, Cincinnati, OH for the Office of Solid Waste and Emergency Response, Washington, DC; EPA 600/6-87/008. Available from: <http://www.epa.gov/iris/backgrd.html>. U.S. EPA. (1991a) Guidelines for developmental toxicity risk assessment. Federal Register 56(234):63798-63826. Available from: <http://www.epa.gov/iris/backgrd.html>. U.S. EPA (1991b) Alpha 2u-globulin: association with chemically induced renal toxicity and neoplasia in the male rat. Risk Assessment Forum, Washington, DC; EPA/625/3-91/019F. Available from: <http://www.epa.gov/lawsregs/policy/sgd/byoffice-osa.html>. U.S. EPA. (1994a) Interim policy for particle size and limit concentration issues in inhalation toxicity studies. Federal Register 59(206):53799. Available from: <http://www.epa.gov/iris/backgrd.html>.
R-9
U.S. EPA. (1994b) Methods for derivation of inhalation reference concentrations and application of inhalation dosimetry. Office of Research and Development, Washington, DC; EPA/600/8-90/066F. Available from: <http://www.epa.gov/iris/backgrd.html>.
U.S. EPA. (1995) Use of the benchmark dose approach in health risk assessment. Risk Assessment Forum, Washington, DC; EPA/630/R-94/007. Available from: <http://cfpub.epa.gov/ncea/raf/recordisplay.cfm?deid=42601>.
U.S. EPA. (1996) Guidelines for reproductive toxicity risk assessment. Federal Register 61(212):56274-56322. Available from: <http://www.epa.gov/iris/backgrd.html>.
U.S. EPA. (1998) Guidelines for neurotoxicity risk assessment. Federal Register 63(93):26926-26954. Available from: <http://www.epa.gov/iris/backgrd.html>.
U.S. EPA. (2000a) Science policy council handbook: risk characterization. Office of Science Policy, Office of Research and Development, Washington, DC; EPA 100-B-00-002. Available from: <http://www.epa.gov/iris/backgrd.html>.
U.S. EPA. (2000b) Benchmark dose technical guidance document [external review draft]. Risk Assessment Forum, Washington, DC; EPA/630/R-00/001. Available from: <http://www.epa.gov/iris/backgrd.html>.
U.S. EPA. (2000c) Supplementary guidance for conducting for health risk assessment of chemical mixtures. Risk Assessment Forum, Washington, DC; EPA/630/R-00/002. Available from: <http://www.epa.gov/iris/backgrd.html>.
U.S. EPA. (2002) A review of the reference dose and reference concentration processes. Risk Assessment Forum, Washington, DC; EPA/630/P-02/0002F. Available from: <http://www.epa.gov/iris/backgrd.html>.
U.S. EPA. (2005a) Guidelines for carcinogen risk assessment. Risk Assessment Forum, Washington, DC; EPA/630/P-03/001B. Available from: <http://www.epa.gov/iris/backgrd.html>.
U.S. EPA. (2005b) Supplemental guidance for assessing susceptibility from early-life exposure to carcinogens. Risk Assessment Forum, Washington, DC; EPA/630/R-03/003F. Available from: <http://www.epa.gov/iris/backgrd.html>.
U.S. EPA. (2006a) Science policy council handbook: peer review. Third edition. Office of Science Policy, Office of Research and Development, Washington, DC; EPA/100/B-06/002. Available from: <http://www.epa.gov/iris/backgrd.html>.
U.S. EPA. (2006b) A Framework for Assessing Health Risk of Environmental Exposures to Children. National Center for Environmental Assessment, Washington, DC, EPA/600/R-05/093F. Available from: <http://cfpub.epa.gov/ncea/cfm/recordisplay.cfm?deid=158363>.
U.S. EPA. (2008) Benchmark dose software (BMDS) version 2.0. Available through http://www.epa.gov/ncea/bmds/.
Valencia, R; Mason, JM; Woodruff, RC; et al. (1985) Chemical mutagenesis testing in Drosophila. III. Results of 48 coded compounds tested for the National Toxicology Program. Environ Mutagen 7(3):325–348.
van Himbergen, TM; van Tits, LJH; Roest, M; et al. (2006) The story of PON1: how an organophosphate-hydrolysing enzyme is becoming a player in cardiovascular medicine. Netherlands J Med 64(2):34–38.
van Ravenzwaay, B; Gamer, AO; Leibold, E; et al. (2003) Effect of cytochrome P-450 inhibition on tetrahydrofuran-induced hepatocellular proliferation in female mice. Arch Toxicol 77(8):459–464.
Vayer, P; Mandel, P; Maitre, M. (1985) Conversion of γ-hydroxybutyrate to γ-aminobutyrate in vitro. J Neurochem 45:810–814.
R-10
Verschueren, K. (2001) Handbook of environmental data on organic chemicals. 4th edition. Vol. 2. New York, NY: Wiley-Interscience; pp. 1971–1974.
Vickers, MD. (1969) Gammahydroxybutyric acid. Int Anesthesia Clinics 7:75–89.
Wagner, HM. (1974) Retention einiger Kohlenwasserstoffe bei der Inhalation. Ver Wasser Boden Lufthyg /J Water, Soil Air Hyg:225–229. (German)
Weaver, RJ; Thompson, S; Smith, G; et al. (1994) A comparative study of constitutive and induced alkoxyresorufin O-dealkylation and individual cytochrome P450 forms in cynomolgus monkey (Macaca fascicularis), human, mouse, rat, and hamster liver microsomes. Biochem Pharmacol 47(5):763–773.
Woo, Y-T; Arcos, JC; Argus, MF; et al. (1977) Structural identification of p-dioxane-2-one as the major urinary metabolite of p-dioxane. Naunyn-Schmiedebergs Arch Pharmacol 299:283–287.
REFERENCES ADDEDD AFTER EXTERNAL PEER REVIEW
Bruner, RH; Greaves, P; Hard, GC; et al. (2010) Histopathologic changes in the kidneys of male F344 rats from a 2-year inhalation carcinogenicity study of tetrahydrofuran: A pathology working group review and re-evaluation. Regul Toxicol Pharmacol 58:100-105.
Hermida, SAS; Possari, EPM; Souza, DB; et al. (2006) 2’-Deoxyguanosine, 2’-deoxycytidine, and 2’-deoxy-adenosine adducts resulting from the reaction of tetrahydrofuran with DNA bases. Chem Res Toxicol 19:927–936.
Loureiro, APM; Di Mascio, P; Gomes, O F; et al. (2000) trans,trans-2,4-Decadienal-induced 1,N-2-etheno-2’-deoxyguanosine adduct formation. Chem Res Toxicol 13:601–609.
Loureiro, APM; Campos, IPdA; Gomes, OF; et al. (2004) Structural characterization of diastereoisomeric ethano adducts derived from the reaction of 2’-deoxyguanosine with trans,trans-2,4-decadienal. Chem Res Toxicol 17: 641–649.
Loureiro, APM; Campos, IPdA; Gomes, OF; et al. (2005) Structural characterization of an etheno-2’-deoxyguanosine adduct modified by tetrahydrofuran. Chem Res Toxicol 18:290–299.
A-1
APPENDIX A. SUMMARY OF EXTERNAL PEER REVIEW AND PUBLIC
COMMENTS AND DISPOSITION
The Toxicological Review of Tetrahydrofuran has undergone a formal external peer
review performed by scientists in accordance with EPA guidance on peer review (U.S. EPA,
2006a; 2000a). The external peer reviewers were tasked with providing written answers to
general questions on the overall assessment and on chemical-specific questions in areas of
scientific controversy or uncertainty. A summary of significant comments made by the external
reviewers and EPA’s responses to these comments arranged by charge question follow. In many
cases the comments of the individual reviewers have been synthesized and paraphrased in
development of Appendix A. EPA also received scientific comments from the public. These
comments and EPA’s responses are included in a separate section of this appendix.
EXTERNAL PEER REVIEWER COMMENTS
The reviewers made several editorial suggestions to clarify specific portions of the text.
These changes were incorporated in the document as appropriate and are not discussed further.
(A) GENERAL CHARGE QUESTIONS
QUESTION A1. Is the Toxicological Review logical, clear, and concise? Has EPA
accurately, clearly, and objectively represented and synthesized the scientific evidence for
noncancer and cancer hazard?
Comments: Generally, the reviewers regarded the Toxicological Review for Tetrahydrofuran to
be comprehensive, clear, and concise. However, one of the reviewers commented that the
presentation of mode of action information was repetitious, while a second reviewer suggested
subheadings be added to better orient presentation of the mode of action information in Section
4.4.3. One reviewer also cited some errors and recommended clarification or changes to Section
3.3 (Metabolism) and Figure 3-1. Issues specifically related to the derivation of the oral RfD
(Charge Questions B1-B6), inhalation RfC (Charge Questions C1-C6), and the cancer
assessment (Charge Questions D1-D5) that were discussed by reviewers in response to Charge
Question A1 are addressed under the relevant charge questions below.
EPA Response to Comments: Section 4.4.3 (now moved to Section 4.5 and Appendix C.2.2)
has been revised by adding subheadings to orient presentation by topic rather than study as
suggested by the reviewers. Some toxicity data unrelated to mode of action (e.g., uterine effects
A-2
in mice) have been moved to Section 4.2. Section 3.3 and Figure 3.1 have been revised for
clarification and additional information on THF metabolism has been included. In addition,
redundant text has been removed in several sections.
QUESTION A2. Please identify any additional studies that should be considered in the
assessment of the noncancer and cancer health effects of THF.
Comments: None of the reviewers provided any additional studies for consideration.
EPA Response to Comments: No response needed.
CHEMICAL-SPECIFIC CHARGE QUESTIONS
(B) ORAL REFERENCE DOSE (RfD) FOR TETRAHYDROFURAN
QUESTION B1. A chronic RfD for THF has been derived from the oral drinking water
2-generation reproductive toxicity study (BASF, 1996; Hellwig et al., 2002) in rats. Please
comment on whether the selection of this study as the principal study has been scientifically
justified and transparently and objectively described in the document. Please identify and
provide the rationale for any other studies that should be selected as the principal study.
Comments: Five of the reviewers agreed with the selection of the Hellwig et al. (2002)/BASF
(1996) study as the principal study for derivation of the chronic oral RfD. One reviewer did not
provide any response. Specific issues related to this study raised by reviewers in response to this
charge question are summarized and addressed under the relevant charge questions below.
EPA Response to Comments: No response necessary.
QUESTION B2. Decreased F2 male pup body weight was selected as the most appropriate
critical effect. Please comment on whether the selection of this critical effect has been
scientifically justified and transparently and objectively described in the document. Please
provide detailed explanation. Please identify and provide the rationale for any other
endpoints that should be considered in the selection of the critical effect.
Comments: Two of the reviewers agreed with the selection of decreased F2 male pup body
weight gain. One of the reviewers agreed with the selection as the critical effect, but commented
that decreased pup body weight gain represented a marginally adverse effect considering the
A-3
possibility of lower maternal water consumption at high doses. Another reviewer commented
that while the selection of the critical effect was transparently and objectively described in the
Toxicological Review, this reviewer questioned whether this endpoint was appropriate to serve
as a critical effect. Specifically, the reviewer stated that the effect was minimal, only observable
during a small period of time, and may have been impacted by the decreased water consumption
in the dams. This reviewer also stated that this effect did not lead to more pronounced changes
in growth or reproductive ability in the F1 generation. However, this reviewer concluded that
there did not appear to be a better endpoint from these studies that could be used to calculate the
RfD. Another reviewer commented that classifying the decreased pup body weight gain as a
developmental effect was tenuous due in part to the overall, low magnitude of the effect and the
decreased water intake in dams. This reviewer stated that while these studies may remain the
most appropriate to serve as the principal studies due to the absence of more high quality data
sets, their interpretation as direct evidence of THF-induced developmental toxicity is
questionable. Two reviewers noted that the supporting data were weak or minimal, while
another reviewer stated that delayed eye opening was difficult to measure and thus difficult to
model. One reviewer did not provide any response to this question.
EPA Response to Comments: EPA concluded that the decreases in pup body weight gain
indicated delayed or altered growth following exposure to THF, an effect which is one of four
major manifestations of developmental toxicity. In addition, a significant number of F2
pups/litter had delayed opening of eyes and increases in the number of sloped incisors at the high
dose. These endpoints in pups are considered common markers of an adverse toxicological
effect on development and are consistent with the principles and practices of the EPA’s
Guidelines for Developmental Toxicity Risk Assessment (U.S. EPA, 1991a). Section 5.1.1 was
augmented to further characterize the adversity of the critical effects.
There is some evidence offering support for delayed growth in the F2 generation and/or
altered impact on reproductive capacity in the F1 generation. Specifically, the mean number of
delivered F2 pups/litter was decreased 16% in the high-dose group compared with control and
was outside the range of historical control values. The study authors considered this finding to
be consistent with a slight developmental delay (Hellwig et al., 2002).
The decreased PND 7-14 pup body weight gain findings were consistent in males and
females across both generations (i.e., both F1 and F2 pups) within the study, with ≥ 10%
decreases in body weight gain as compared to control at the highest dose tested and positive
trends (p < 0.01) in all cases. The lowest BMDL (for F1 male pups) was selected to serve as
the point of departure for calculation of the RfD, following a slight correction to the time-
weighted dose levels that had appeared in the external peer review draft.
A-4
With regard to comments related to maternal water intake, data on the possible
relationship between decreased water intake in dams and decreased production of milk was not
provided in this study. As detailed in Section 4.3.1, the decreased gain in pup body weight is
supported by the statistically significant correlation between F2 pup body weight gain and
maternal THF intake after multivariable regression analyses were conducted to control for the
other possible confounding factors, namely average water intake and number of pups in each
litter. Thus, the observed responses in the pups appear to be related to THF exposure.
QUESTION B3. The chronic RfD has been derived utilizing benchmark dose (BMD)
modeling to define the point of departure (POD). All available models were fit to the
individual male and female and combined incidence data (F1 and F2 pup body weight
gain). Please comment on the appropriateness and scientific justification presented for
individual and combined body weights to obtain a data set for BMD modeling. Please
provide comments with regards to whether BMD modeling is the best approach for
determining the point of departure. Has the BMD modeling been appropriately conducted
and objectively and transparently described? Has the benchmark response selected for use
in deriving the POD been scientifically justified and transparently and objectively
described? Please identify and provide rationale for any alternative approaches (including
the selection of BMR, model, etc.) for the determination of the point of departure, and if
such approaches are preferred to EPA’s approach.
Comments: All reviewers agreed that BMD modeling was the most appropriate approach to
derive the RfD and that the F1 and F2 pup body weight gain data were suitable endpoints for
deriving BMD estimates. Two reviewers included the caveat that while the BMD modeling was
the most appropriate approach, the use of the pup body weight gain is a limitation (see reviewer
comments for Charge Questions B1 and B2 for specifics). Four of the reviewers recommended
using 1 SD below the control mean for pup body weight gain instead of a 5% decrease in body
weight gain as the BMR to establish the POD, on the basis that a percentage reduction in body
weight gain is an arbitrary choice compared with a measure of effect that considers the variation
among animals.
EPA Response to Comments: Based on peer reviewer recommendations, the RfD for THF was
derived using a BMR of 1SD. For the RfD, EPA considered BMRs of a 5% change and a 1 SD
change in pup body weight gain compared with the control and developed candidate PODs using
both BMRs (see Table 5-2). A 5% change in body weight gain is assumed to be relevant for
pups by analogy to adult body weight, for which a 10% change is generally recognized to
A-5
support identification of maximum tolerated doses. A 1 SD BMR considers the variation among
animals, through the inference of a normal range based on the control group. In the case of
decreasing weight gains, a 1 SD change from the control mean corresponds to 10% of an
exposed population having larger decreases in body weight gain than the lowest 1% of the
control group, when the data follow a normal distribution (U.S. EPA, 2000b). In consideration
of the peer reviewer recommendations, EPA selected a POD associated with a BMR of 1SD for
the derivation of the RfD.
The external peer review draft included results based on the SDs reported by the
investigators; these SDs characterized the variability between litter means of pup body weights.
However, it is the variability among pups which is relevant in order to use a 1SD BMR, not the
variability between litters. EPA developed the relevant SD estimates (from the Hellwig et al.,
2002/BASF, 1996 study) and incorporated these estimates in the BMD modeling analysis for the
RfD. Section 5 and Appendix B of the Toxicological Review were revised to reflect the use of a
BMR of 1SD for RfD derivation.
QUESTION B4. Please comment on the selection of the uncertainty factors applied to the
POD for the derivation of the RfD. For instance, are they scientifically justified and
transparently and objectively described in the document?
Comments: Three of the reviewers agreed with the selection of the UFs applied to the POD for
the derivation of the RfD, and two of these reviewers further noted that the selections were
scientifically justified and clearly described. One reviewer did not provide comments on the
selection of UFs. One reviewer stated that the overall UF was not warranted and indicated that
the Toxicological Review presents data suggesting that metabolism of THF does not have a role
in THF-induced toxicity (i.e., metabolism is not a rate-limiting step) and that there may not be a
10-fold variability among individuals or among species. This reviewer, therefore, was of the
opinion that each of the intra- and interspecies UFs should be no more than 3. This same
reviewer also suggested a reduction in the database UF because the RfD was based on a very
sensitive endpoint from a well-conducted study. Another reviewer stated the selection of
uncertainty factors was transparent and objectively described but questioned the composite UF,
stating that the oral toxicity was so low it was difficult to find an endpoint of concern. This
reviewer noted that the interspecies UF could be reduced based on the fact that the water
solubility of THF would make it unlikely that THF would be absorbed and distributed differently
in rodents compared to humans, and by using the inhalation toxicity database to inform the oral
toxicity database the database UF could be reduced.
A-6
EPA Response to Comments: In response to the comments from two reviewers who
questioned the selection of UFs for the RfD, EPA re-evaluated the rationale for each of the UFs
and revised text for clarification. With regard to the role of metabolism in THF-induced toxicity,
the data are unclear. There is some evidence that one of the THF metabolites, GHB is linked
with the neurotransmitter GABA and CNS effects (i.e., one of the critical effects for the RfC);
indicating metabolism may play a role in THF-induced toxicity (see Section 3.3). Additionally,
while there is no information on either the toxicokinetics of THF following exposure by the oral
route or on differential sensitivity of human populations to THF, blood kinetics data were highly
variable among volunteers exposed to THF by the inhalation route (Kageyama, 1988 covered in
Section 3.1.2). Moreover, there is potential for variation in humans and across species. The
metabolism section (Section 3.3) has been revised to include literature on THF metabolism and
on the role that lactonase (also known as PON1) may play in hydrolyzing GBL (a lactone
intermediate) to GHB. There is a wide inter-individual variation in PON1 concentration and
activity of up to 13-fold (van Himbergen et al., 2006) and possibly in some CYP450 isoenzymes,
which may be involved in the early steps of oxidative metabolism of THF to GBL. It is not clear
if, and to what extent, genetic variability in expression and activity of PON1 and CYP450 may
influence the kinetics of THF biotransformation, and how, in turn, such variability might
influence human risk to THF exposure (see Section 4.8.3). Furthermore, no information is
available on life-stage susceptibility to THF exposure. Therefore, the default value of 10 for
UFH was applied.
With respect to interspecies variability, there are some limited data by the inhalation
route of exposure suggesting qualitative toxicokinetic similarities between humans (Droz et al.,
1999; Ong et al., 1991; Kageyama, 1988) and rats (Elovaara et al., 1984; Kawata and Ito, 1984).
For instance, THF was rapidly excreted following repeated inhalation exposure in both species
with limited bioaccumulation (see Section 3). However, these data are not adequate to provide a
quantitative estimate of toxicokinetic differences. Also, the human inhalation exposure PBPK
model for estimating THF concentration in blood, breath, and urine (Droz et al., 1999) does not
account for the toxicokinetic variability in humans, and no similar PBPK model has been
identified in animals (see Section 3.6). Furthermore, there are no comparative toxicokinetic or
toxicodynamic studies following exposure to THF by the oral route in humans and animals.
Thus, the default UFA of 10 was applied to account for interspecies differences.
Regarding the comment on the composite UF in light of THF’s toxicity, it is Agency
practice to apply UFs of 1, 3 (i.e., 101/2 = 3.16 rounded to 3), or 10 (U.S. EPA, 2002) for five
areas of uncertainty to a selected POD as representative of a chemical’s toxicity. In the case of
THF, factors of 10 were applied for intraspecies and interspecies extrapolation and to account for
database deficiencies resulting in a composite UF of 1000. The Agency considered these UFs to
A-7
be warranted as there are several data gaps, described above briefly and in further detail in
Section 5.1.3, that support the application of 10-fold factors.
The comments on the database UF are addressed below in response to comments to
Charge Question B6.
QUESTION B5. A two-generation reproductive toxicity study was used for the selection of
the POD for the derivation of the RfD. Please comment on whether the rationale and
justification for not applying a subchronic to chronic uncertainty factor has been
scientifically justified and transparently described in the document.
Comments: Five of the reviewers agreed with the rationale and justification for not applying a
subchronic to chronic UF. One reviewer did not provide comments.
EPA Response to Comments: No response needed.
QUESTION B6. Please comment on whether the rationale and justification for the
selection of the database uncertainty factor has been scientifically justified and
transparently described in the document.
Comments: Three reviewers agreed with the selection of the database UF and two of these
further stated that the rationale and justification for this selection was scientifically justified and
transparently described. One reviewer agreed that the selection of the database UF was
transparent and objectively described, but commented that the selection may need better
justification. This reviewer considered the overall oral toxicity of THF to be low and that both
the oral and inhalation toxicity data were adequate for estimating chronic toxicity for THF, thus
reducing the need for the UFD. Another reviewer stated that the selection of the database UF was
not justified considering the principal study was well-documented and the RfD was based on a
very sensitive endpoint. One reviewer did not provide any response.
EPA Response to Comments: In response to the comment from the reviewer who suggested
utilizing both the oral and inhalation databases to inform the selection of the oral database UF,
the rationale for the UF was re-examined. Considering the limited oral database (only a well-
conducted two-generation reproductive study with limited tissue histopathology and a one-
generation study that did not include a histopathological examination of tissues), the Agency
attempted to utilize the inhalation database by evaluating the application of a route-to-route
extrapolation approach (see Sections 3.6, 5.1.1, and 5.1.3). However, due to inadequate PBPK
A-8
models and the absence of absorption efficiency data in humans and rats, this approach was not
scientifically supported. Another alternative approach involving the use of the oral data for
metabolites of THF for deriving the RfD was considered (described in Section 5.1.1), but
because there is uncertainty surrounding the role of metabolism in THF-induced toxicity, this
approach was not adopted. Although these alternative approaches were inadequate, the Agency
did consider the information associated with inhalation exposure. The inhalation database lacks
a two-generation reproductive toxicity study but contains developmental, chronic, and
subchronic toxicity studies in rats and mice (NTP, 1998; Mast et al., 1992; DuPont Haskell
Laboratory, 1980). The inhalation developmental toxicity studies provided evidence of effects
on the fetus. The subchronic and chronic studies reported systemic toxicity (CNS effects and
liver weight changes) at exposure concentrations lower than those inducing developmental
toxicity; suggesting that systemic toxicity may be of more concern. Thus, the lack of studies
examining endpoints other than reproductive toxicity following oral exposure is a database
deficiency, and a 10-fold UF was applied. The text in Section 5.1.3 has been augmented to
provide a more clear description of the available database and identification of the deficiencies.
(C) INHALATION REFERENCE CONCENTRATION (RfC) FOR
TETRAHYDROFURAN
QUESTION C1. A chronic RfC for THF has been derived from data from a 105 week
chronic inhalation study (NTP, 1998) in mice and rats. Please comment on whether the
selection of this study as the principal study has been scientifically justified and
transparently and objectively described in the document. Please identify and provide the
rationale for any other studies that should be selected as the principal study.
Comments: All reviewers stated that they were supportive of EPA’s selection of the 105-week
chronic inhalation study as the principal study to derive the RfC for THF.
EPA Response to Comments: Charge Question C1 inaccurately states that the RfC for THF
was derived based on data from a 105 week chronic inhalation study (NTP, 1998) in mice and
rats. The RfC derived in the external peer review draft was based on the 14-week subchronic
NTP (1998) study which identified both CNS and liver effects in mice. Both the 14-week and
105-week studies are reported as NTP (1998).
The external peer review draft stated that based on clinical signs of CNS toxicity and
liver effects, a NOAEL of 1,770 mg/m3 and a LOAEL of 5,310 mg/m3 were identified. CNS
A-9
effects were observed at 5,310 mg/m3and 14,750 mg/m3 in the subchronic study, and at 5,310
mg/m3 in the chronic study. The draft also noted that THF induced a concentration-dependent
increase in liver weight in male and female mice and rats and centrilobular cytomegaly in male
and female mice in the subchronic study. The chronic study evaluated body weight and clinical
signs of toxicity; organs were subjected to histopathological examination at necropsy. However,
no measurements were taken for organ weights, hematology, or clinical chemistry in the chronic
study. In addition, the chronic study did not identify liver cytomegaly in any of the exposure
groups, although a slight increase in necrosis was observed in the livers of the 5,310 mg/m3
female mice. Thus, the liver weights and histopathology (cytomegaly) cited in the discussion of
the selection of the principal study and critical effect in the external peer review draft were those
observed in the subchronic component of the NTP (1998) study. In light of the potential for
confusion between the subchronic and chronic studies, the document has been revised to further
clarify the effects reported by each study component (subchronic versus chronic exposure
duration) from NTP (1998) and the rationale for the selection of the principal study.
Additionally, Table 5-3 was added to more clearly characterize the two phases of the NTP study.
QUESTION C2. Liver toxicity and CNS effects were selected as the co-critical
toxicological effects. Please comment on whether the selection of this critical effect has
been scientifically justified and transparently and objectively described in the document.
Specifically, please address whether the selection of liver effects and CNS toxicity as the co-
critical effects instead of increased thymus weight has been adequately and transparently
described. Please identify and provide the rationale for any other endpoints that should be
considered in the selection of the critical effect.
Comments: Four of the reviewers agreed with the selection of liver toxicity and CNS effects as
co-critical effects. Two of these reviewers stated that the liver effects were minimally adverse,
but appropriate to select nonetheless. One of these two reviewers attributed less toxicological
significance to the liver effects than to the CNS effect, while the second reviewer expressed
preference for using cytomegaly over increased liver weight as a liver toxicity endpoint. One
reviewer supported the use of CNS effects as the critical effect, but disagreed with the
designation of liver toxicity as a co-critical effect stating that observations of hepatocytomegaly,
without well characterized events such as sustained cell proliferation or decreased apoptosis, is a
questionable critical effect. This reviewer stated that while cytomegaly is consistently reported,
this effect is readily reversible and may be regarded as a less serious toxic endpoint; and
concluded that the changes in liver weight and cytomegaly observed following THF exposure
A-10
and the lack of additional key events in the liver collectively support the decision to not select
liver changes as the critical effect and suggested that the assessment would benefit substantially
by selecting the CNS effects alone as the critical effect for the derivation of the RfC. One
reviewer did not provide comment.
Five of the reviewers agreed that thymus weight should not be used as a critical effect
since it was not accompanied by either histopathological changes or measured alterations in
immune competence. One reviewer did not provide comment. No other endpoints were
identified by the reviewers as effects that should be considered in the selection of the critical
effect.
EPA Response to Comments: EPA agrees with the reviewers who indicated that the CNS and
liver effects were appropriate for use as the co-critical effects. In addition, Section 5.2.1 has
been augmented to include additional discussion of liver and CNS findings. In the subchronic
NTP (1998) study, liver weights (both absolute and relative) were increased in the 14,750 mg/m3
female rats and this finding was accompanied by increased serum bile acid concentration in the
absence of cholestasis or hepatocellular necrosis. The study authors indicated that these changes
were consistent with decreased or altered hepatic function. In male mice, absolute and relative
liver weights were statistically significantly increased following exposure to concentrations of
≥1,770 mg/m3. The increases in absolute and relative liver weights in male mice were supported
by increased incidence of centrilobular cytomegaly, statistically significant at 14,750 mg/m3
(7/10 compared to 0/10 in the control group). Also, relative and absolute liver weights were
statistically significantly increased in female mice beginning at 5,310 mg/m3 and were
accompanied by centrilobular cytomegaly (10/10 animals compared to 0/10 in controls) at
14,750 mg/m3. The hepatocytes were additionally described as having slight karyomegaly
(enlarged nucleus), increased cytoplasmic volume, and granular cytoplasm with less vacuolation
than that of midzonal and periportal hepatocytes (NTP, 1998). No clinical chemistry
measurements were performed in mice. The study authors concluded that the histopathological
changes observed in the high exposure male and female mice groups suggested that the liver is
the target organ for toxicity. They also stated that the liver weight increase and mild
histopathological changes observed at the lower THF exposure concentration (5,310 mg/m3)
were consistent with a treatment related effect (NTP, 1998). Furthermore, in the chronic study
liver necrosis was noted in female mice of the 5,310 mg/m3 exposure group. The toxicological
significance of the observed liver weight changes was considered to be uncertain at the low
concentrations where the changes were of minimal severity and were not accompanied by other
signs of liver toxicity. However, the increases in absolute and relative liver weights at 5,310
mg/m3 were greater than 10% above controls (statistically significant) and were accompanied by
A-11
minimal increases in histopathology findings (1/10 incidence in centrilobular cytomegaly) that
progressed with increases in THF concentration. The liver effects observed at the exposure
concentrations e 5,310 mg/m3 were therefore considered biologically significant and
representative of adverse effects (U.S. EPA, 2002). Section 5.2.1 was revised to better
characterize and support the selected critical effects and their toxicological significance.
Considering the information described in Section 5.2.1 (briefly described above) as well
as the supporting data in acute and short-term studies (described in Appendix C), EPA concluded
that liver effects and CNS effects are appropriate as co-critical effects for derivation of the RfC.
Section 5.2.3 includes the candidate PODs associated with these effects as well as the potential
RfCs (which are similar) for the liver and CNS effects.
EPA agrees with the reviewers regarding thymus weight as inappropriate for use as a
critical effect for the derivation of the RfC.
QUESTION C3. The chronic RfC has been derived utilizing benchmark dose modeling to
define the point of departure (based on liver cytomegaly). BMD modeling was conducted
on liver weight and cytomegaly data in both males and females. Has the BMD modeling
been appropriately conducted and objectively and transparently described? Has the
benchmark response selected for use in deriving the POD been scientifically justified and
transparently and objectively described? Please provide comments on whether the
selection of a POD based on liver cytomegaly instead of liver weight is scientifically
justified and transparently described. Please identify and provide rationale for any
alternative approaches (including the selection of BMR, model, etc.) for the determination
of the point of departure, and if such approaches are preferred to EPA’s approach.
Comments: All of the reviewers commented that the BMD modeling was appropriate, and
generally noted that the choices were objectively described and scientifically justified. However,
one reviewer questioned the selection of liver cytomegaly rather than the liver weight modeling
results to define the POD for deriving the RfC. This reviewer stated that given the choice
between cytomegaly and increased liver weight data, the liver weight data may be a more
appropriate endpoint to model, but stated that liver weight changes not accompanied by cell
proliferation and/or apoptosis may not be representative of toxicity. This reviewer suggested that
the POD should be based on the CNS effects. In addition, one reviewer thought it was unclear
why only the male mouse data was modeled instead of the female mouse data or both sexes
A-12
combined. Two reviewers suggested expanding the explanation in Appendix B of the Akaike
Information Criterion (AIC).
EPA Response to Comments: Further consideration of the BMD modeling and
NOAEL/LOAEL approaches, described in Section 5.2.2, provides evidence of similar PODs (as
BMDLs) for both hepatocytomegaly and increased liver weight in the male mice as well as the
POD (as a NOAEL) for CNS effects. Sections 5.2.1 and 5.2.2 were revised to further discuss the
toxicological significance of the liver and CNS endpoints and to better characterize the modeling
and candidate PODs. The discussion of the selection of the POD for derivation of the RfC was
expanded in Section 5.2.2. Section 5.2.3 includes RfCs for both liver and CNS effects. The
selection of the male mouse data was based on the fact that the males were slightly more
sensitive (i.e., by about one dose-spacing unit) than females and text was added to Section 5.2.2
to clarify this selection. Additional text has been added to Section 5.1.2 and Appendix B
describing the AIC.
QUESTION C4. No incidence data were presented for CNS effects. Thus, these data could
not be evaluated by BMD modeling. However, a NOAEL-LOAEL approach (based on the
CNS data) for the derivation of the RfC has been presented for comparison purposes.
Please provide comments as to whether the NOAEL-LOAEL approach based on the POD
for CNS effects is more appropriate for the derivation of the RfC. Please provide
comments with regards to whether BMD modeling is the best approach for determining the
point of departure.
Comments: Two reviewers considered the CNS effects as having greater toxicological
significance than the hepatic effects and therefore supported the use of a NOAEL/LOAEL
approach to derive the RfC. Two of the reviewers commented that the NOAEL/LOAEL and
BMD modeling approaches yielded the same results and had a preference for the use of BMD
modeling. One reviewer agreed with the approach, analysis, and discussion and conclusions
presented in the Toxicological Review. One reviewer stated that both approaches were
appropriate and that confidence was increased by the fact that the approaches provided the same
value.
EPA Response to Comments: See responses to comments under Questions C2 and C3.
A-13
QUESTION C5. Please comment on whether the selection of the uncertainty factors
applied to the POD for the derivation of the RfCs. For instance, are they scientifically
justified and transparently and objectively described in the document.
Comments: Two reviewers agreed with the selection of the uncertainty factors applied to the
POD for the derivation of the RfCs and noted the selection was scientifically supported and
clearly described. A third reviewer agreed with the selection of the intraspecies UF (UFH) but
commented that the UF for interspecies differences (UFA = 3) should not be reduced.
Specifically, this reviewer disagreed with the use of a default value of 1 as the interspecies
dosimetric adjustment factor as a substitute for the interspecies UF; both of which he considered
as placeholders for lack of information. This reviewer recommended that the UF not be reduced
until it can be replaced with a data-driven UF based on a physiologically-based pharmacokinetic
model. Conversely, another reviewer suggested that both the inter- and intraspecies UFs could
be reduced based on the consideration that metabolism of THF does not have a role in THF-
induced toxicity (i.e., metabolism is not a rate-limiting step); thus, there may not be a 10-fold
variability among individuals or among species. This reviewer also stated that the inhalation
database was adequate and that the available data were better documented than the oral database.
Another reviewer commented that the total UF may be overly conservative and that additional
discussion should be added to the document to further explain the selection of the uncertainty
factors. One reviewer provided no response to this question.
EPA Response to Comments: With regard to the reviewer comment on the 3-fold interspecies
UF, when the Agency derives inhalation reference concentrations, the point of departure is
adjusted for continuous exposure then converted to a human equivalent concentration (HEC) in
accordance with EPA’s Methods for Derivation of Inhalation Reference Concentrations and
Application of Inhalation Dosimetry Methodology (U.S. EPA, 1994b). In cases where there are
either no data available or where the animal blood-air partition coefficient is larger than the
human coefficient, a default value of 1 is used. In this instance, due to the lack of information
regarding the ratio of human to animal blood-air partition coefficients for THF this ratio is
assumed to be 1. With regard to the UF, the interspecies UF is comprised of two areas of
uncertainty (i.e., toxicokinetic and toxicodynamic uncertainties). The determination of an HEC
as described in the RfC methodology (U.S. EPA, 1994b) mostly addresses the toxicokinetic
component and a 3-fold UF is applied to account for the remaining uncertainty regarding the
toxicodynamic differences between mice and humans. This approach is further described in
Section 5.2.2.1 and in EPA’s Inhalation Dosimetry Methodology cited above.
A-14
The comments provided by one reviewer regarding reducing the intra- and interspecies
UFs based on metabolism data were similar to those provided for the UFs for the oral RfD; see
response to these comments under Charge Question B4. In response to the reviewer that
suggested the UFs in combination may be overly conservative, EPA re-evaluated the selection of
the uncertainty factors. As noted in response to comments under Charge Question B4, it is
Agency practice to apply UFs of 1, 3 (101/2 = 3.16 rounded to 3), or 10 (U.S. EPA, 2002) for five
areas of uncertainty. In the case of inhalation database for THF, a relatively low composite
uncertainty factor of 100 (comprised of a factor of 10 for intraspecies variability in the absence
of information regarding human variability, and factors of 3 for toxicodynamics uncertainties in
extrapolating from animals to humans and for a database lacking a multigeneration reproductive
toxicity study by the inhalation route of exposure) was applied. The Agency concluded that
further reductions in these UFs were not justified. See Section 5.2.3 for description of UFs. The
comment related to the database UF is addressed in response to comments under Charge
Question C6 specific to the database UF.
QUESTION C6. Please comment on the transparency and scientific rationale and
justification for the selection of the database uncertainty factor. Please comment on
whether the application of the database uncertainty factor adequately represents the gap in
inhalation reproductive and developmental toxicity and immunotoxicity data for THF.
Please comment on whether the rationale for use of the oral data to inform this decision
scientifically justifiable and transparently described in the document.
Comments: Four of the reviewers agreed with the selection of the database UF of 3. One of
these reviewers stated that the explanation was transparent and another noted it was clear and
well explained. One reviewer did not provide any response to this question. Two reviewers
specifically commented on the immunotoxicity data. One of these reviewers stated that
immunotoxicity may not be cause for concern with respect to the database UF, as there was no
evidence to indicate that lymphocyte cell populations would be selectively sensitive to THF. In
addition, this reviewer noted that cytotoxicity was not demonstrated in the available mode of
action studies for THF. This reviewer further suggested that due to the rapid metabolism of
THF, there was less concern for immunotoxicity at chronic low exposures to THF and that
secondary effects that may result from inflammatory responses produced at high exposures
would not be relevant to low exposures. Another reviewer agreed that the lack of
immunotoxicity data should not be a concern, and noted that a 3-fold database UF may not be
needed.
A-15
EPA Response to Comments: EPA agreed with the reviewers’ comments in response to
Charge Questions C2 and C6 regarding immunotoxicity data and has revised the Toxicological
Review to indicate that thymus effects observed following exposure to THF are not likely to
represent a specific concern. Additionally, the rationale for the database UF in Section 5.2.3 was
revised to remove immunotoxicity as an uncertainty in the inhalation database for THF. An
uncertainty factor of 3 was applied to account for the lack of a two-generation reproductive
study.
QUESTION C7. THF induces a spectrum of effects consistent with both Category 1 and
Category 3 gases. Therefore, for the purposes of calculating HECs, respiratory tract effect
levels were calculated using the default equations for Category 1 gases and
extrarespiratory tract effect levels were calculated using default equations for Category 3
gases. Please comment on the explanation for the dosimetry choice in the derivation of the
RfC. Has the rationale been scientifically justified and transparently described?
Comments: Five reviewers agreed with EPA’s dosimetry choices. One reviewer did not
respond. Two reviewers that commented noted that this section could be improved by additional
discussion of the gas categories, and a third stated that he was unfamiliar with EPA’s
categorization of gases, suggesting additional discussion of these categories would be beneficial.
EPA Response to Comments: EPA agrees with the reviewers regarding the dosimetry choices
and Section 5.2.2.1 was revised to better characterize the approach used to calculate HECs for
the endpoints considered as the basis for the RfC as described under the EPA’s Methods for
Derivation of Inhalation Reference Concentrations and Application of Inhalation Dosimetry
(U.S. EPA, 1994b). Detailed classification information for Category 1, 2, and 3 gases is also
provided in the cited EPA report (U.S. EPA 1994b).
(D) CARCINOGENICITY OF TETRAHYDROFURAN
QUESTION D1. Under the EPA’s 2005 Guidelines for Carcinogen Risk Assessment (U.S.
EPA, 2005), there is suggestive evidence for the human carcinogenic potential of THF.
Please comment on the scientific justification for the cancer weight of the evidence
characterization. A quantitative cancer assessment has been derived for THF. Do the data
support estimation of a cancer slope factor for THF? Please comment on the scientific
justification for deriving a quantitative cancer assessment considering the uncertainty in
the data and the suggestive nature of the weight of the evidence of carcinogenic potential.
A-16
Has the rationale and scientific justification for quantitation been transparently and
objectively described?
Comments: Five reviewers agreed with the “suggestive evidence of carcinogenic potential”
cancer descriptor. One reviewer did not comment. Two reviewers commented that, while the
evidence for female mouse liver tumors can support quantitative estimation of cancer potency,
the dose-response of the male rat kidney tumor data was weak. Two reviewers commented that a
quantitative assessment would overestimate the risk due to their opinion that THF is a very weak
possible human carcinogen. Another reviewer noted that the quantitative cancer assessment may
provide a measure of the magnitude of the carcinogenic concern. Several reviewers commented
on the quantitative impact of the linear low-dose extrapolation approach utilized in deriving a
cancer risk estimate; these comments are address under Charge Question D4.
EPA Response to Comments: EPA agrees with the consensus view regarding the cancer
descriptor. Based on the peer reviewers’ concern for the potential overestimation of risk in
deriving an IUR for THF using a linear low-dose extrapolation approach, and the uncertainty
associated with the carcinogenic potential for THF, EPA did not derive an IUR. Please see
EPA’s response to the issues related to the quantitative estimate of risk under Charge Question
D4.
QUESTION D2. The available data suggest that a plausible mode of action for THF-
induced male rat kidney tumors may involve the accumulation of alpha-2u globulin. EPA
concluded that the available data do not provide significant biological support to establish
a mode of action for male rat kidney tumors and that these tumors are relevant to humans.
Please comment on the transparency and scientific rationale and justification for the
evaluation of these data and the conclusions regarding the possible mode(s) of action and
human relevance for the male rat kidney tumors.
Comments: Four reviewers agreed with the conclusions that the available data do not provide
significant biological support to establish a mode of action for male rat kidney tumors and that
these tumors are relevant to humans. Two reviewers did not comment.
EPA Response to Comments: No response needed.
QUESTION D3. The available data suggest that increased proliferation and promotion in
the liver may be a plausible mode of action for THF-induced female mouse liver tumors.
A-17
EPA concluded that the data do not provide significant biological support to establish a
mode of action for female mouse liver tumors and that these tumors are relevant to
humans. Please comment on the transparency and scientific rationale and justification for
the evaluation of these data and the conclusions regarding the possible mode(s) of action
and human relevance for the female mouse liver tumors.
Comments: Three of the reviewers agreed with the conclusion that the available data do not
provide significant biological support to establish a mode of action for female mouse liver
tumors and that the liver tumors are relevant to humans. One reviewer agreed that the mode of
action for THF-induced liver tumors is unknown, but suggested that chronic irritation (which this
reviewer considered as the most plausible mechanism of action for very low potency cancer-
causing chemicals) may be the mode of action of THF-induced liver tumors. The reviewer also
commented that the female mouse liver tumors were not relevant to humans because of the lack
of sufficiently high exposures and the very low incidence of liver cancer in humans compared to
B6C3F1 mice. Another reviewer’s comments on the extrapolation approach are summarized and
addressed under Charge Question D4. One reviewer provided no response to this question.
EPA Response to Comments: As described in Sections 4.7.1 and 5.3.6, though it is possible
that THF may act as a tumor promoter, there is no information on potential precursor or key
events, and the possible role of chronic inflammation or specific mediators of tumorigenesis for
THF has not been examined. Thus, EPA concluded that in the absence of mode of action
information the mouse liver tumors were relevant.
QUESTION D4. An inhalation unit risk has been derived utilizing benchmark dose
modeling to define the point of departure of 10% extra risk followed by linear low-dose
extrapolation below the point of departure (i.e., the default assumption). Please comment
on the scientific justification and rationale supporting the estimation of an inhalation unit
risk from the available data for THF. Specifically, please comment on whether the
rationale for the quantitative analysis is objectively and transparently described,
considering the uncertainty in the data and the suggestive nature of the weight of evidence.
Please comment on the selection of linear low dose extrapolation. Has the justification of
linear low dose extrapolation been objectively and transparently presented? Please
identify and provide rationale for any alternative approaches for low dose extrapolation
that the data for THF would support and if such approaches are preferred to EPA’s
approach.

A-18
Comments: One reviewer agreed with the selection of the linear extrapolation approach in the
absence of data to support other options. Two reviewers commented that the discussion of the
decisions leading to the derivation of the inhalation unit risk and the decision to select a linear
low dose extrapolation was objectively and transparently described. Four reviewers disagreed
with the selection of a linear low dose extrapolation based on the following reasons: THF is not
genotoxic/DNA-reactive, its metabolism is rapid and doesn’t form a reactive metabolite, it
doesn’t cause irreversible damage, it induced a weak tumor response at high doses, and it doesn’t
induce proliferative lesions considered to be pre-neoplastic; concluding that the application of a
linear low-dose extrapolation approach will overestimate cancer risk. One reviewer also noted
that all of the biological effects identified for THF are those which are commonly thought to
exhibit thresholds; this reviewer and another reviewer recommended using a reference value
approach to estimate a non-carcinogenic dose. Another reviewer proposed survival adjustments
to the tumor incidence rates that should be considered in the dose-response modeling and
derivation of the inhalation unit risk. This reviewer presented several choices to consider for
selecting dose-response models, and included a nonlinear approach in response to Charge
Question D3. One reviewer provided no direct response to this question (this reviewer provided
relevant comments under other Charge Questions; these comments are incorporated above). The
reviewers who recommended a nonlinear approach suggested that a nongenotoxic carcinogen
would accordingly have a nonlinear cancer response at low dose.
EPA Response to Comments: As described in Section 5.3.1, based on the peer reviewers’
concern for the potential overestimation of risk in deriving an IUR for THF using a linear low-
dose extrapolation approach, and the uncertainty associated with the carcinogenic potential for
THF, EPA did not derive an IUR. Sections 5.3, 6.1.3, and Appendix B were revised accordingly
and text was added to transparently describe the uncertainties and the opinions of the peer
reviewers.
As noted in the Cancer Guidelines, there are some circumstances (e.g., providing a sense
of the magnitude and uncertainty of potential risks, ranking potential hazards, or setting research
priorities) in which a cancer risk estimate for THF would be useful (U.S. EPA, 2005a). Thus,
EPA presented a dose-response analysis (see Appendix B) to show what the inhalation cancer
risk estimate would be if derived using a linear low-dose extrapolation approach. In considering
the reviewer comments on the dose-response analysis, EPA agrees that the differential survival
among the female mice and male rats, as noted by one reviewer, should be reflected in any
cancer risk estimates, and has revised the dose-response data accordingly (See Table B-3).
Additionally, EPA considered the model selection options proposed by one reviewer,
which included using a multistage approach as presented in the external peer review draft
A-19
Toxicological Review of Tetrahydrofuran. As noted by this reviewer, the multistage model is
supported by biological plausibility through its parallelism to the multistage carcinogenic
process, and has been widely used for cancer risk assessments. In cases such as THF, where
there is no biologically based model available and insufficient support for considering nonlinear
low-dose extrapolation, EPA uses the multistage model, which also maintains consistency across
cancer assessments, unless the multistage model does not fit the observed dose-response. In this
case, a one-stage multistage model provided a more parsimonious fit of the survival-adjusted
data than the fit (three-stage multistage) offered by the reviewer.
EPA notes that the suggestions for simple or weighted BMDL averaging both produce
PODs that are not well-defined confidence limits. That is, for component BMDLs that are 95%
confidence limits, neither type of average leads to a 95% confidence limit for the combined
result, and the level of confidence is not easily determined. More comprehensive analysis
involving model averaging is a significant area of research currently, but scientific consensus has
not yet been reached regarding how to implement model averaging, including which and how
many models to consider.
To address the reviewers’ comments regarding the inclusion of a nonlinear approach, text
was added to Section 5.3.1 and Appendix B to expand the discussion of extrapolation
approaches. For THF, there are no data to inform the shape of the dose-response curve at low
doses and there are no noncancer effects reported that could serve as a precursor endpoint upon
which to base a nonlinear analysis. Thus, the nonlinear analysis recommended by the peer
reviewers cannot be readily implemented. One of these reviewers also suggested carrying out a
nonlinear low-dose extrapolation by using a BMCL10 estimated from modeling the tumor data
and applying uncertainty factors for human variability, extrapolation from animals to humans,
and for database uncertainty. Because the mode of carcinogenic action is not known (as noted
by EPA and the peer reviewers) and the use of a key event to represent a POD for a threshold
approach could not be implemented, along with the uncertainty associated with the suggestive
nature of the carcinogenic potential, EPA did not explore this option further and chose instead to
not derive an IUR for THF.
QUESTION D5. THF induces a spectrum of effects consistent with both Category 1 and
Category 3 gases. Therefore, for the purposes of calculating human equivalent
concentrations, respiratory tract effect levels were calculated using the default equations
for Category 1 gases and extrarespiratory tract effect levels were calculated using default
equations for Category 3 gases. Please comment on the explanation for the dosimetry
choice in the derivation of the inhalation unit risk. Has the rationale been scientifically
justified and transparently described?
A-20
Comments: Three reviewers agreed with the HEC calculations. Three reviewers did not
comment in response to this question.
EPA Response to Comments: No response needed.
PUBLIC COMMENTS
Comments: A commenter stated that the critical endpoint (decreased weight in F2 pups) for
deriving the RfD is weak and equivocal because the findings may have been due to reduced
maternal milk production associated with decreased water intake and/or food consumption. The
commenter also questioned the rationale behind the gender-specific effect on weight gain in
male, but not female, pups and expressed doubts about a direct association between this reduced
weight gain in male pups and THF exposures.
EPA Response to Comments: See response to charge question B2 in Appendix A. There are
no data evaluating the possible relationship between decreased water intake in dams and
decreased production of milk (i.e., milk output was not measured). However, after multivariable
regression analyses were conducted to control for possible confounding factors, including water
intake and number of pups in each litter, it was found that the decrease in F2 pup body weight
gain was statistically significantly correlated with maternal THF intake. Therefore, decreased
pup body weight gain is considered an appropriate endpoint for deriving the RfD. The study
authors concluded that the decreased pup body weight gain could be a high concentration effect
reflecting general toxicity due to direct exposure to THF during lactation (Hellwig et al., 2002).
Specifically, the study authors suggested that, given that THF is slightly more soluble in lipid
than water, THF may have been more concentrated in the dam’s milk fat than in the maternal
water compartment. Based on the developmental effects observed (decreased pup body weight
gain, delayed eye opening, and increased incidence of sloped incisors) the study authors
designated 3,000 ppm as the NOAEL. Maternal food consumption was marginally decreased in
F0 and F1 lactating dams and the decrease was not associated with statistically significant
reduction in maternal body weight gain. While for F1 pups, the responses at each dose were
different between males and females, for F2 pups, the responses were comparable between males
and females at all doses. It is not clear if there is sex dependence for effects on F1 but not F2
pups or if there is a biological basis or this difference reflects only statistical considerations.
A-21
Finally, it was concluded that there is no apparent gender-specific effect on weight gain in both
the F1 and F2 pups.
Comments: A commenter stated that the composite UF (1,000) used to derive the RfD for THF
is excessive given the apparent toxicity of THF. Specifically, the commenter stated that an UF
of 10 to account for deficiencies in the oral database exaggerates the potential significance of
limitations in the oral data.
EPA Response to Comments: See response to Charge Question B4. As noted in Section 5.1.3,
an UFD of 10 was selected to account for deficiencies in the toxicity database for oral exposure to
THF. The oral database for THF contains a two-generation reproductive toxicity study and a
range-finding one-generation reproductive study (Hellwig et al., 2002; BASF, 1996, 1994).
There are no available human occupational or epidemiological studies or standard toxicity
studies, including developmental toxicity studies, in animals.
Comments: A commenter questioned the use of CNS depression as one of the critical endpoints
to derive the RfC because transient sedation from exposure to this volatile organic chemical is
reversible and does not by itself provide any evidence of sustained neurotoxicity.
EPA Response to Comments: EPA agreed with the peer reviewers’ comments supporting the
use of CNS effects as a co-critical effect for the derivation of the RfC. Text was added to
Section 5.2.1 to further discuss significance of these effects and the rationale for the selection.
Comments: A commenter recommended using a combined UF of 30 rather than 100 to derive
the RfC for THF. The commenter stated that the inhalation database for THF is relatively robust
obviating the need for a database UF of 3. Among the reasons that were cited in support of this
view were that adult animals were more sensitive than fetuses or weanling animals, the offspring
findings in the oral two-generation study were unremarkable, and the absence of other
immunotoxicity findings (such as histopathology) that may lend support to the effect on thymus
weight.
EPA Response to Comments: Based on comments from the external peer reviewers, EPA has
revised the text to indicate that thymus effects observed following exposure to THF may not
represent an uncertainty in the database. An uncertainty factor of 3 was selected to account for
deficiencies in the database for THF. Chronic and subchronic inhalation bioassays and
developmental toxicity studies are available in rats and mice (NTP, 1998; Mast et al., 1992;
A-22
DuPont Haskell Laboratory, 1980). No two-generation reproductive toxicity study by the
inhalation route is available.
Comments: A commenter stated that the carcinogenicity data for THF, particularly the liver
tumor response in female mice, support at most a classification of suggestive evidence of
carcinogenic potential in humans. The commenter disagreed with EPA’s determinations
regarding the mode of action for carcinogenicity. The commenter agreed with EPA’s conclusion
that the currently available data do not clearly establish α2u-globulin accumulation as mode of
action for kidney effects. The commenter suggested, however, that renal tumors may have been
related to THF-induced exacerbation of or interaction with CPN (Hard, 2005). The commenter
asserted that evidence suggests that CPN may not be relevant to humans (Hard and Khan, 2004)
and that there is a causal link between CPN, atypical tubule hyperplasia (ATH), and adenomas in
rats. The commenter stated that there is sufficient evidence to clearly establish CPN as the mode
of action for increased incidence of renal tumors in male rats based on two evaluations by the
Tetrahydrofuran Task Force (Fenner-Crisp, 2007; Hard, 2005). The commenter also cited a
recent NTP publication that evaluated α2u-globulin-associated nephropathy and renal tumors in
rats (Doi et al., 2007) as support for the conclusion that there is a causal link between CPN and
proliferative lesions in the kidney.
EPA Response to Comments: EPA agreed with the peer reviewers’ comments that the mode of
carcinogenic action for THF has not been established. Hard (2005) concluded that in the
chronically exposed control and high exposure male rat groups there were comparable incidences
of ATH (5/50 and 6/50, respectively). In addition, Hard (2005) reported that the treated male
and female group incidences and severity of CPN were almost identical to the respective male
and female control groups.
There was no difference in the incidence or severity of CPN in male rats of the NTP 2-
year carcinogenicity study on THF (both the control and high-exposure groups have 13 males
with end-stage kidneys). Although THF did not exacerbate development of CPN, it was
postulated that it may have exacerbated the development of proliferative lesions within CPN-
affected tissue. No data in the peer-reviewed literature are available that support a role of CPN
in the induction of THF-induced kidney tumors in male rats.
Doi et al. (2007) concluded that it is possible that α2u-globulin-associated nephropathy
may simply contribute to a weak background tumorigenic stimulus provided by age-related
chronic progressive nephropathy. However, the study authors stated that there is no direct
evidence for the histological alterations, including CPN and ATH, thought to be included with
A-23
α2u-globulin nephropathy. The overall conclusions of Doi et al. (2007) were that the critical
component(s) of the nephropathy most closely associated with the development of tumors cannot
clearly be identified. As noted in Section 5.3.6, the mode of action of THF for the male rat
kidney tumors has not been determined.
Comments: In an unpublished report submitted in October 19, 2007 to EPA as part of the Public
Record, histology slides of kidneys from male and female F344/N rats of the 2-year
carcinogenicity and 14-week NTP studies (NTP, 1998) on THF were re-examined (Dammann,
2005; Hard, 2005). The authors of these unpublished reports suggested that the overall incidence
of kidney tumors in the male rats was 2/50 (4%), 1/50 (2%), 3/50 (6%), and 5/50 (10%), with all
tumors being adenomas (Hard, 2005). Use of the Cochran-Armitage trend test on the data
presented in the unpublished report showed no significant concentration-response trend in tumor
incidence (Dammann, 2005). The author also concluded that THF does not appear to act via the
α2u-globulin mode of action. Instead, the author proposed that advanced CPN may play a role in
the development of ATH, and perhaps the kidney tumors from THF exposure.
Additional public comments were submitted to the IRIS Program on July 16, 2009.
Included in these comments was a report entitled: “Pathology Working Group Review of
Selected Histologic Changes in the Kidneys of Male Rats Assigned to a 2-Year Inhalation
Carcinogenicity Study of Tetrahydrofuran (NTP Study No. 05181-03).” The Pathology Working
Group (PWG) re-evaluation was conducted during March 3–4, 2009 and included five voting
members including Dr. Gordon Hard who had conducted a previous evaluation of the same data.
For this discussion, the report will be referred to as PWG (2009). The specified objectives of the
new reevaluation were to establish the most appropriate diagnoses of proliferative kidney
changes; to provide comment on likely potential pathogenic mechanisms for male rat kidney
tumors; and to provide perspective on risk from potential human exposure to THF. In addition to
evaluating kidney sections from all the control and high concentration male rat groups, the PWG
(2009) examined kidneys that had proliferative lesions in the low and mid exposure male rat
groups (5 and 10, respectively). The criteria for proliferative changes were based on Hard et al.
(1995). The report by the PWG (2009) stated that the NTP pathologists consolidated all variants
of tubular hyperplasia under the diagnostic term “Renal Tubule Hyperplasia.” In contrast, the
PWG (2009) differentiated between “simple” and “atypical” hyperplasia where, and according to
PWG (2009), the first was not recorded because it was regarded as a reactive tubular alteration
directly associated with CPN. Atypical tubular hyperplasia (ATH) was recorded by the PWG
(2009) because it was considered to represent a potential preneoplastic lesion with strong
relevance to carcinogenicity, but severity grades were not assigned.
A-24
Both NTP (1998) and the PWG (2009) concluded that renal cell adenomas were
increased in the high exposure male rats compared to controls. The PWG (2009) considered
both preneoplastic and neoplastic lesions together and reported that when these effects were
combined, the incidence values were similar between treated and control rats. In this
determination, the PWG (2009) applied different criteria that distinguished between reactive
tubular hyperplasia (associated with CPN) and atypical tubule hyperplasia (deemed as
preneoplastic). The PWG (2009) concluded that adenomas and ATH were present in kidneys
that showed advanced CPN. Furthermore, they suggested that accelerated tubular cell
degeneration and regeneration associated with CPN was likely responsible for the development
of most proliferative lesions. The PWG (2009) indicated that THF-induced exacerbation of CPN
was not considered to be contributory because severity of CPN was similar between treated and
control rats. Additionally, the PWG (2009) report stated that there was no evidence of early
tumor occurrence or of tumor progression to carcinoma.
The report indicated that the PWG (2009) did not observe histological changes associated
with α2u-globulin nephropathy in the chronic NTP (1998) cancer bioassay slides. However, the
PWG (2009) report did note that hyaline droplets were detected in the tubular epithelium of high
exposure male rats in the subchronic 14-week study, but that similar results were observed in
control males. The PWG (2009) also concurred with the results of the BASF (2001a) 4-week
inhalation study. Specifically, hyaline droplets were increased in the proximal tubules and hot
spots of accelerated cell proliferation were identified in the cortex of male rats exposed to 1,800
ppm THF for 20 days They also noted that immunohistochemistry confirmed that the hyaline
droplets contained α2u-globulin following the 4-week inhalation exposure. The PWG (2009)
concluded that these slight increases in cell proliferation associated with α2u-globulin may have
contributed to the development of adenomas in male rats exposed to the high THF concentration
in the chronic cancer bioassay.
The PWG (2009) report concluded that given the absence of data demonstrating
statistically significant differences in tumors and preneoplastic lesions, and the assertion that two
mechanisms (CPN and α2u-globulin) likely resulted in the proliferative changes observed in the
kidney, which have no known counterpart in humans, the formation of renal tubule adenomas in
the 2-year carcinogenicity THF study (NTP, 1998) have no relevance to humans.
EPA Response to Comments: EPA agreed with the peer reviewers’ comments and continues to
conclude that the mode of carcinogenic action for hepatocellular and renal tumors is largely
unknown. Additional discussion of the role of CPN and ATH in the development of kidney
tumors in male rats observed following exposure to THF has been included in Section 4.7.3.1.
A-25
EPA disagrees with the characterization in the PWG (2009) report [published as Bruner et al.
(2010)] that renal tubule hyperplasia in the NTP (1998) report is a non-specific term for all
variants of tubular hyperplasia and with the approach by Bruner et al. (2010) of combining ATH
with neoplastic kidney findings for statistical analyses. There was no difference in the incidence
or severity of CPN in male rats of the NTP 2-year carcinogenicity study on THF (both the
control and high-dose groups have 13 males with end-stage kidneys). Although THF did not
exacerbate development of CPN, it was postulated that it may have exacerbated the development
of proliferative lesions within CPN-affected tissue. Specifically, against a background of
nephropathy that was uniform across all groups, there were more renal tubular tumors in treated
rats than in the controls, and those in the higher exposure group animals were larger in size.
Consideration should be given to the robustness and the gender specificity of the renal tumor
response. Thus, EPA concluded that the male rat kidney tumors were relevant to humans and
that the mode of action for these tumors has not been established.
Comments: A commenter asked why, after concluding in Section 5.3.1 of the external peer
review draft Toxicological Review that “quantitative analyses may be useful for providing a
sense of the magnitude of potential carcinogenic risk”, EPA neglected to revisit this issue after
the quantitative cancer assessment was completed. The commenter also questioned why EPA
didn’t provide greater specificity by discussing what the quantitative results may mean in terms
of magnitude of potential carcinogenic risk and whether the results appear sensible for the data.
The commenter added that quantitative risk assessment should be reserved for substances where
the evidence provides a greater scientific basis for concern, such as human evidence or a
confirmed genotoxic mechanism, or at least a clearly defined and established carcinogenic
response in multiple test species. The commenter also noted that THF has not been shown to be
carcinogenic in humans and has not been confirmed as genotoxic. The commenter added that the
male rat renal tumors should not be considered relevant to humans and the hepatic tumors are
significantly increased only in the high dose female mice. Based on these considerations, in
addition to the absence of any indication of age-dependent susceptibility, the commenter
concluded that the application of linear dose-response extrapolation results in an unduly
conservative and implausible cancer potency estimate for THF that is comparable in value to two
known human carcinogens, namely benzene and vinyl chloride.
EPA Response to Comments: Based on the peer reviewers’ concern for the potential
overestimation of risk in deriving an IUR for THF using a default linear low-dose extrapolation
approach, and the uncertainty associated with the data for THF, EPA did not derive an IUR. See
responses to comments under Charge Questions D1 for discussion of the cancer descriptor and
A-26
quantitative assessment, D2 and D3 regarding modes of action and relevance to humans, and D4
for the discussion of the extrapolation approach.
Comments: A commenter listed three studies (shown below) that were not considered in the
draft THF Toxicological Review. Though not considered to likely materially affect the
conclusions, the commenter noted that the references should be cited and discussed in the THF
Toxicological Review.
• Lehman (2005). Determination of the percutaneous absorption of THF, in vitro, using
human cadaver skin model, PRACS Inst., Ltd. (unpublished report provided as #5
supporting document with the comments).
• Loureiro, AP; de Arruda Campos, IP; Gomes, OF; et al. (2005) Structural
characterization of an etheno-2'-deoxyguanosine adduct modified by tetrahydrofuran.
Chem Res Toxicol 18(2):290–299.
• Hermida, SA; Possari, EP; Souza, DB; et al. (2006) 2'-Deoxyguanosine,
2'-deoxycytidine, and 2'-deoxyadenosine adducts resulting from the reaction of
tetrahydrofuran with DNA bases. Chem Res Toxicol 19(7):927–936.
EPA Response to Comments: Conclusions of the studies by Luoriero et al. (2005) and
Hermida et al. (2006) have been included with other studies in Section 4.5 (Genotoxicity
Studies) and summaries of these studies were included in Appendix C.2. The Lehman (2005)
report on a percutaneous absorption model for THF is considered not relevant for this
assessment.
B-1
APPENDIX B. DOSE-RESPONSE MODELING
The THF data sets considered for dose-response modeling include both quantal and
continuous endpoints. EPA’s BMDS version 2.0 (U.S. EPA, 2008) was used for model fitting
and estimating the benchmark dose (BMD) and its 95% lower bound (i.e., BMDL).
B.1. NONCANCER ENDPOINTS
B.1.1. Methods
Data Sets
For the RfD, the body weight gains for male and female pups of the F1 and F2
generations were considered for dose-response modeling. In order to account for the effect of
intralitter correlation on interindividual variability, the individual animal data for the pup body
weight gains were analyzed for variance components using SAS PROC NESTED. The standard
deviation (SD) for each dose/sex/generation group was estimated using the following equation:
SD = 𝑠𝑠𝑠𝑠𝑠𝑠𝑠𝑠( 𝑆𝑆2[1 + (𝑚𝑚− 1)𝜌𝜌] )
where S = SD across all pups in a dose/sex/generation group,
m= weighted average number of pups in a litter in each dose/sex/generation group,
ρ = intralitter correlation.
(see, e.g., Cochran 1977 §9.3; Snedecor and Cochran 1980; Steel and Torrie 1980 §25.7; Winer
1971). The resulting summary statistics, provided in Table 5-1, were used as inputs for BMDS
continuous models.
For the RfC data sets, see Table 5-4.
Definition of the BMR and corresponding BMD and BMDL.
Rationales for BMRs are provided in Section 5 (Section 5.1.2 for the RfD, Section 5.2.2
for the RfC). For the quantal endpoints, i.e., incidence of cytomegaly, the BMD and BMDL
were estimated using a BMR of 10% extra risk. For the continuous endpoints, i.e., pup body
weight gain and liver weight, BMD and BMDL were estimated using a BMR of 1SD of the
control mean for pup body weight gain, and 10% of the control mean for liver weight. For the
selected best-fit models, BMDs and BMDLs were estimated using a BMR of 5% of the control
mean for pup body weight gain and 1 SD change in the control mean for liver weight for
comparison purposes.
B-2
Model selection
For all endpoints, model selection was consistent with EPA’s draft Benchmark Dose
Technical Guidance (U.S. EPA, 2000b). For quantal endpoints, all available dichotomous
models in BMDS 2.0 were fit to the incidence data for each dataset. Adequate model fit was
judged by the chi-square goodness-of-fit p-value (p ≥ 0.1). In addition, visual inspection of the
fit of the dose-response curve to the data points, especially in the region of the BMR, and
examination of the scaled residuals were also used to evaluate model fit. Among all of the
models providing adequate fit to the data, the lowest BMDL was selected as the potential POD
when the difference between the BMDLs estimated from these models was more than threefold;
otherwise, the BMDL from the model with the lowest Akaike’s Information Criterion (AIC) was
chosen as the candidate POD. The AIC is a measure of the expected deviance of the fit of the
specified model from the “true” model that allows for comparison across models allowing for
selection of a “best-fit” model for a particular endpoint.
For continuous endpoints, continuous models available in BMDS 2.0 were fit to the data;
the Hill model was not considered because it is more useful with more dose groups than were
available here. For each model, first the homogeneity of the variances was tested using a
likelihood ratio test (BMDS Test 2). If Test 2 was not rejected (χ2 p-value ≥ 0.10), the model
was fitted to the data assuming constant variance. If Test 2 was rejected (χ2 p-value < 0.10), the
variance was modeled as a power function of the mean, and the variance model was tested using
a likelihood ratio test (BMDS Test 3). If Test 3 was not rejected (χ2 p-value ≥ 0.10), the model
was fitted to the data using the modeled variance. For fitting models using either constant
variance or modeled variance, models were tested for adequacy of fit to the means using a
likelihood ratio test (BMDS Test 4, with χ2 p-value < 0.10 indicating inadequate fit). Otherwise
the fit of all continuous models were evaluated as described above for the dichotomous models.
B-3
References for this Section
Cochran WG. 1977. Sampling Techniques, 3rd edition. Wiley and Sons.
Snedecor GW and Cochran WG. 1980. Statistical Methods, 8th edition. Iowa State University Press.
Steel RGD and Torrie JH. 1980. Principles and Procedures of statistics: a biometrical approach. McGraw-Hill.
Winer 1971. Statistical Principles in Experimental Design. McGraw-Hill.
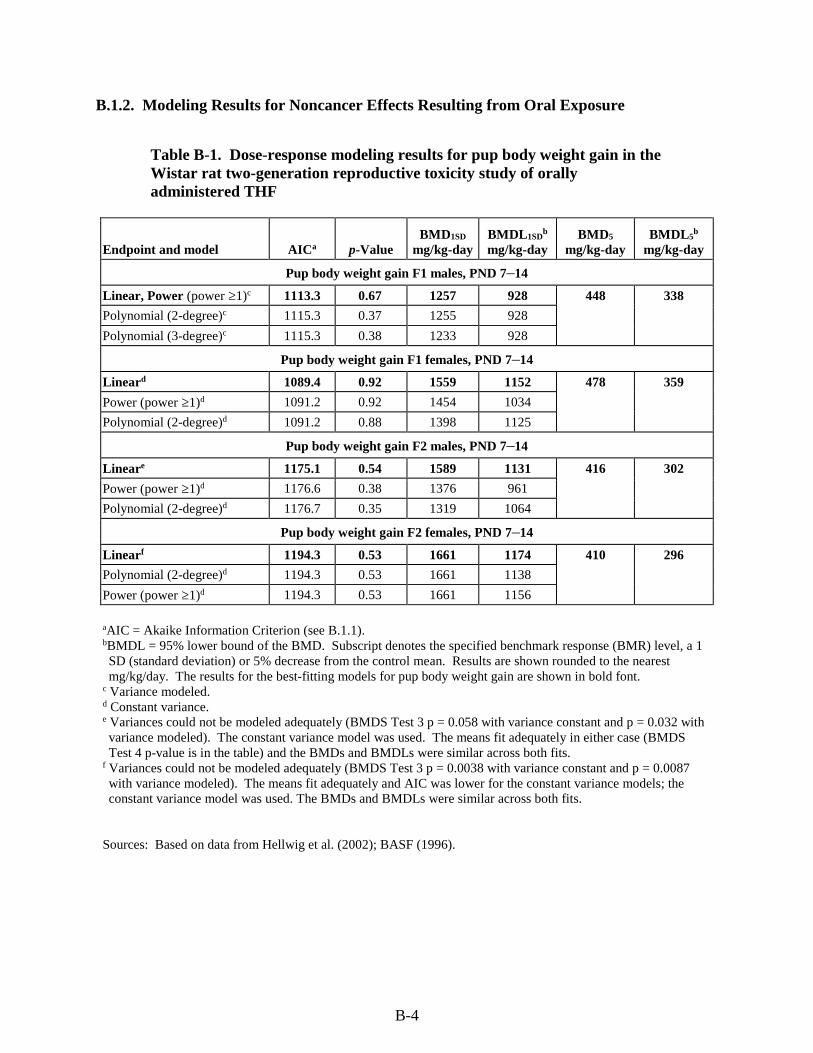
B-4
B.1.2. Modeling Results for Noncancer Effects Resulting from Oral Exposure
Table B-1. Dose-response modeling results for pup body weight gain in the Wistar rat two-generation reproductive toxicity study of orally administered THF
Endpoint and model AICa p-Value BMD1SD
mg/kg-day BMDL1SD
b mg/kg-day
BMD5
mg/kg-day BMDL5
b mg/kg-day
Pup body weight gain F1 males, PND 7–14
Linear, Power (power ≥1)c 1113.3 0.67 1257 928 448 338
Polynomial (2-degree)c 1115.3 0.37 1255 928
Polynomial (3-degree)c 1115.3 0.38 1233 928
Pup body weight gain F1 females, PND 7–14
Lineard 1089.4 0.92 1559 1152 478 359
Power (power ≥1)d 1091.2 0.92 1454 1034
Polynomial (2-degree)d 1091.2 0.88 1398 1125
Pup body weight gain F2 males, PND 7–14
Lineare 1175.1 0.54 1589 1131 416 302
Power (power ≥1)d 1176.6 0.38 1376 961
Polynomial (2-degree)d 1176.7 0.35 1319 1064
Pup body weight gain F2 females, PND 7–14
Linearf 1194.3 0.53 1661 1174 410 296
Polynomial (2-degree)d 1194.3 0.53 1661 1138
Power (power ≥1)d 1194.3 0.53 1661 1156
aAIC = Akaike Information Criterion (see B.1.1). bBMDL = 95% lower bound of the BMD. Subscript denotes the specified benchmark response (BMR) level, a 1 SD (standard deviation) or 5% decrease from the control mean. Results are shown rounded to the nearest mg/kg/day. The results for the best-fitting models for pup body weight gain are shown in bold font.
c Variance modeled. d Constant variance. e Variances could not be modeled adequately (BMDS Test 3 p = 0.058 with variance constant and p = 0.032 with variance modeled). The constant variance model was used. The means fit adequately in either case (BMDS Test 4 p-value is in the table) and the BMDs and BMDLs were similar across both fits.
f Variances could not be modeled adequately (BMDS Test 3 p = 0.0038 with variance constant and p = 0.0087 with variance modeled). The means fit adequately and AIC was lower for the constant variance models; the constant variance model was used. The BMDs and BMDLs were similar across both fits.
Sources: Based on data from Hellwig et al. (2002); BASF (1996).
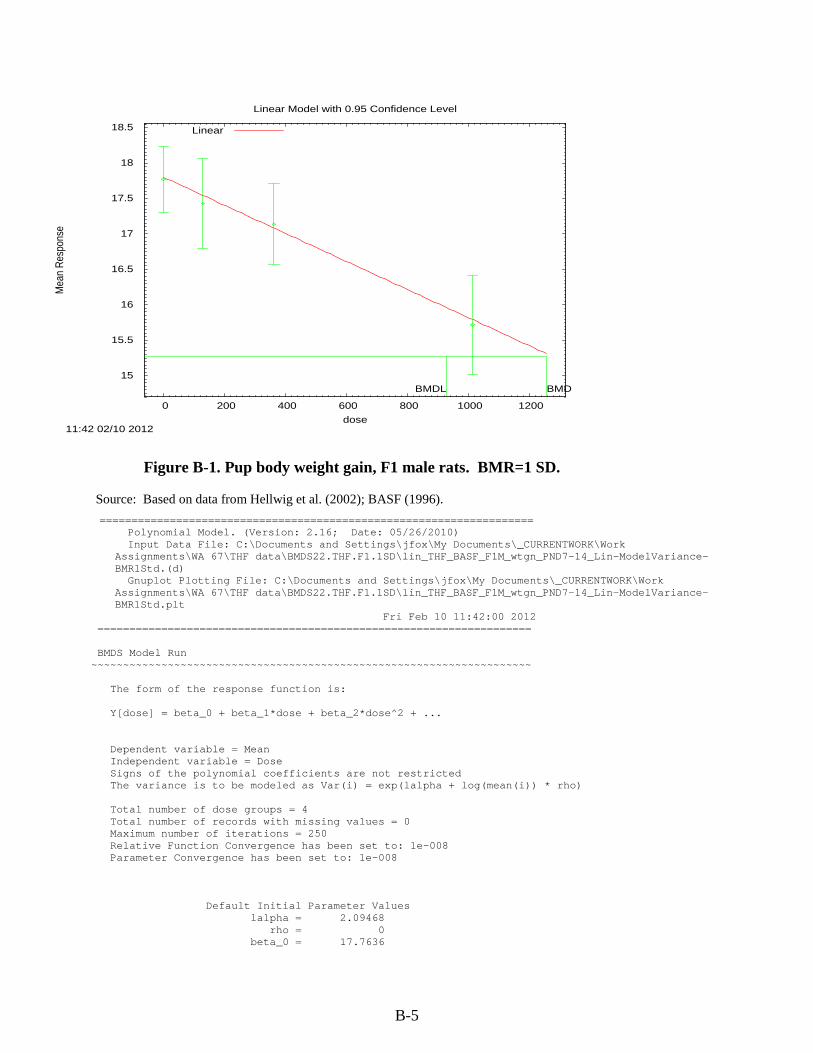
B-5
Figure B-1. Pup body weight gain, F1 male rats. BMR=1 SD.
15
15.5
16
16.5
17
17.5
18
18.5
0 200 400 600 800 1000 1200
Mea
n R
espo
nse
dose
Linear Model with 0.95 Confidence Level
11:42 02/10 2012
BMDBMDL
Linear
Source: Based on data from Hellwig et al. (2002); BASF (1996).
==================================================================== Polynomial Model. (Version: 2.16; Date: 05/26/2010) Input Data File: C:\Documents and Settings\jfox\My Documents\_CURRENTWORK\Work
Assignments\WA 67\THF data\BMDS22.THF.F1.1SD\lin_THF_BASF_F1M_wtgn_PND7-14_Lin-ModelVariance-BMR1Std.(d)
Gnuplot Plotting File: C:\Documents and Settings\jfox\My Documents\_CURRENTWORK\Work Assignments\WA 67\THF data\BMDS22.THF.F1.1SD\lin_THF_BASF_F1M_wtgn_PND7-14_Lin-ModelVariance-BMR1Std.plt
Fri Feb 10 11:42:00 2012 ==================================================================== BMDS Model Run ~~~~~~~~~~~~~~~~~~~~~~~~~~~~~~~~~~~~~~~~~~~~~~~~~~~~~~~~~~~~~~~~~~~~~ The form of the response function is: Y[dose] = beta_0 + beta_1*dose + beta_2*dose^2 + ... Dependent variable = Mean Independent variable = Dose Signs of the polynomial coefficients are not restricted The variance is to be modeled as Var(i) = exp(lalpha + log(mean(i)) * rho) Total number of dose groups = 4 Total number of records with missing values = 0 Maximum number of iterations = 250 Relative Function Convergence has been set to: 1e-008 Parameter Convergence has been set to: 1e-008
Default Initial Parameter Values lalpha = 2.09468 rho = 0 beta_0 = 17.7636
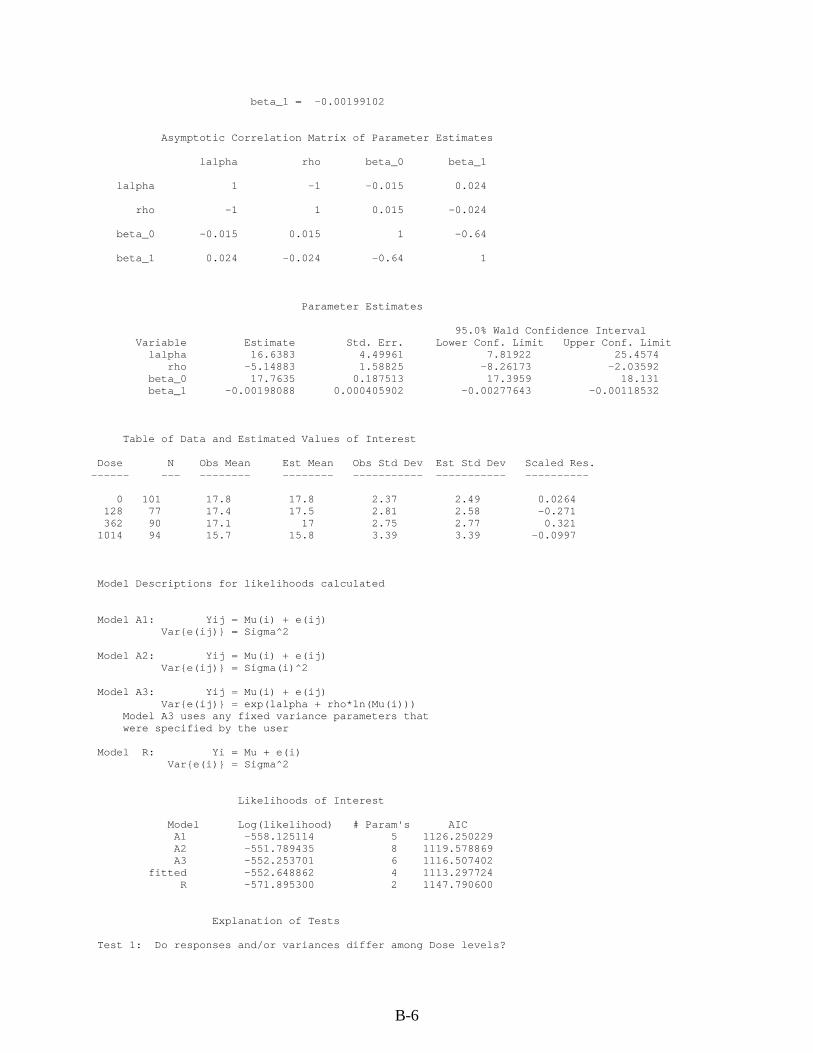
B-6
beta_1 = -0.00199102 Asymptotic Correlation Matrix of Parameter Estimates lalpha rho beta_0 beta_1 lalpha 1 -1 -0.015 0.024 rho -1 1 0.015 -0.024 beta_0 -0.015 0.015 1 -0.64 beta_1 0.024 -0.024 -0.64 1 Parameter Estimates 95.0% Wald Confidence Interval Variable Estimate Std. Err. Lower Conf. Limit Upper Conf. Limit lalpha 16.6383 4.49961 7.81922 25.4574 rho -5.14883 1.58825 -8.26173 -2.03592 beta_0 17.7635 0.187513 17.3959 18.131 beta_1 -0.00198088 0.000405902 -0.00277643 -0.00118532 Table of Data and Estimated Values of Interest Dose N Obs Mean Est Mean Obs Std Dev Est Std Dev Scaled Res. ------ --- -------- -------- ----------- ----------- ---------- 0 101 17.8 17.8 2.37 2.49 0.0264 128 77 17.4 17.5 2.81 2.58 -0.271 362 90 17.1 17 2.75 2.77 0.321 1014 94 15.7 15.8 3.39 3.39 -0.0997 Model Descriptions for likelihoods calculated Model A1: Yij = Mu(i) + e(ij) Var{e(ij)} = Sigma^2 Model A2: Yij = Mu(i) + e(ij) Var{e(ij)} = Sigma(i)^2 Model A3: Yij = Mu(i) + e(ij) Var{e(ij)} = exp(lalpha + rho*ln(Mu(i))) Model A3 uses any fixed variance parameters that were specified by the user Model R: Yi = Mu + e(i) Var{e(i)} = Sigma^2 Likelihoods of Interest Model Log(likelihood) # Param's AIC A1 -558.125114 5 1126.250229 A2 -551.789435 8 1119.578869 A3 -552.253701 6 1116.507402 fitted -552.648862 4 1113.297724 R -571.895300 2 1147.790600 Explanation of Tests Test 1: Do responses and/or variances differ among Dose levels?
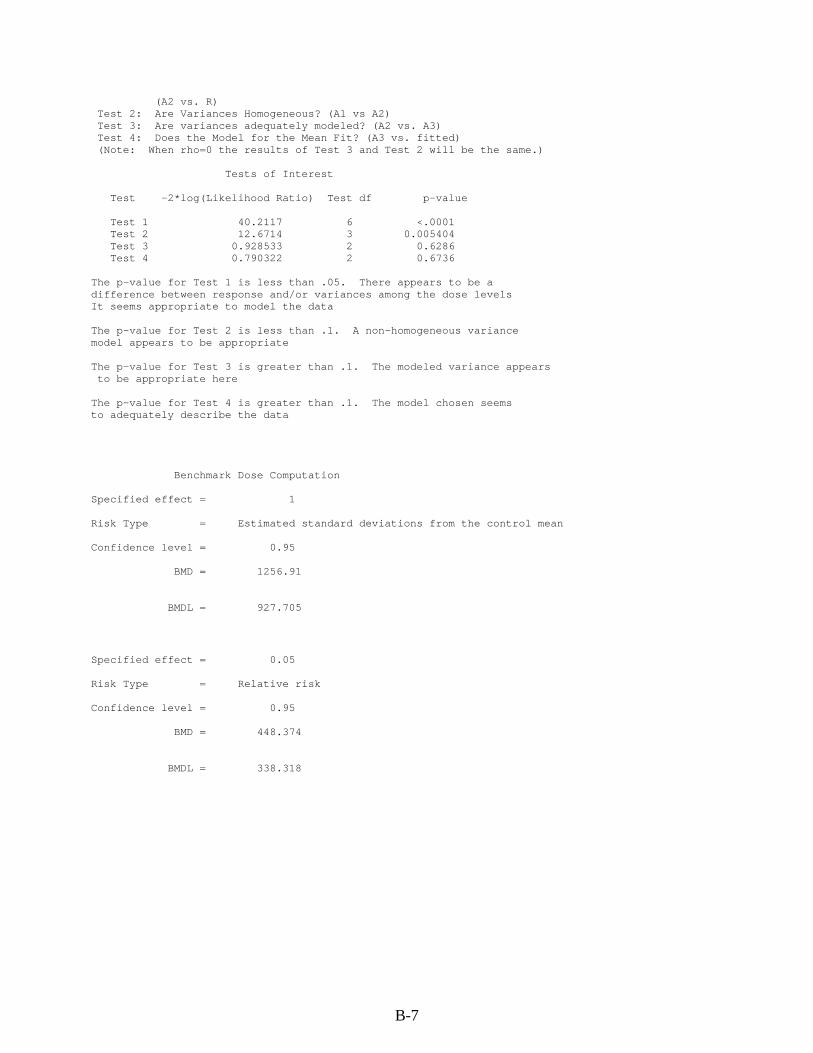
B-7
(A2 vs. R) Test 2: Are Variances Homogeneous? (A1 vs A2) Test 3: Are variances adequately modeled? (A2 vs. A3) Test 4: Does the Model for the Mean Fit? (A3 vs. fitted) (Note: When rho=0 the results of Test 3 and Test 2 will be the same.) Tests of Interest Test -2*log(Likelihood Ratio) Test df p-value Test 1 40.2117 6 <.0001 Test 2 12.6714 3 0.005404 Test 3 0.928533 2 0.6286 Test 4 0.790322 2 0.6736 The p-value for Test 1 is less than .05. There appears to be a difference between response and/or variances among the dose levels It seems appropriate to model the data The p-value for Test 2 is less than .1. A non-homogeneous variance model appears to be appropriate The p-value for Test 3 is greater than .1. The modeled variance appears to be appropriate here The p-value for Test 4 is greater than .1. The model chosen seems to adequately describe the data Benchmark Dose Computation Specified effect = 1 Risk Type = Estimated standard deviations from the control mean Confidence level = 0.95 BMD = 1256.91 BMDL = 927.705 Specified effect = 0.05 Risk Type = Relative risk Confidence level = 0.95 BMD = 448.374
BMDL = 338.318
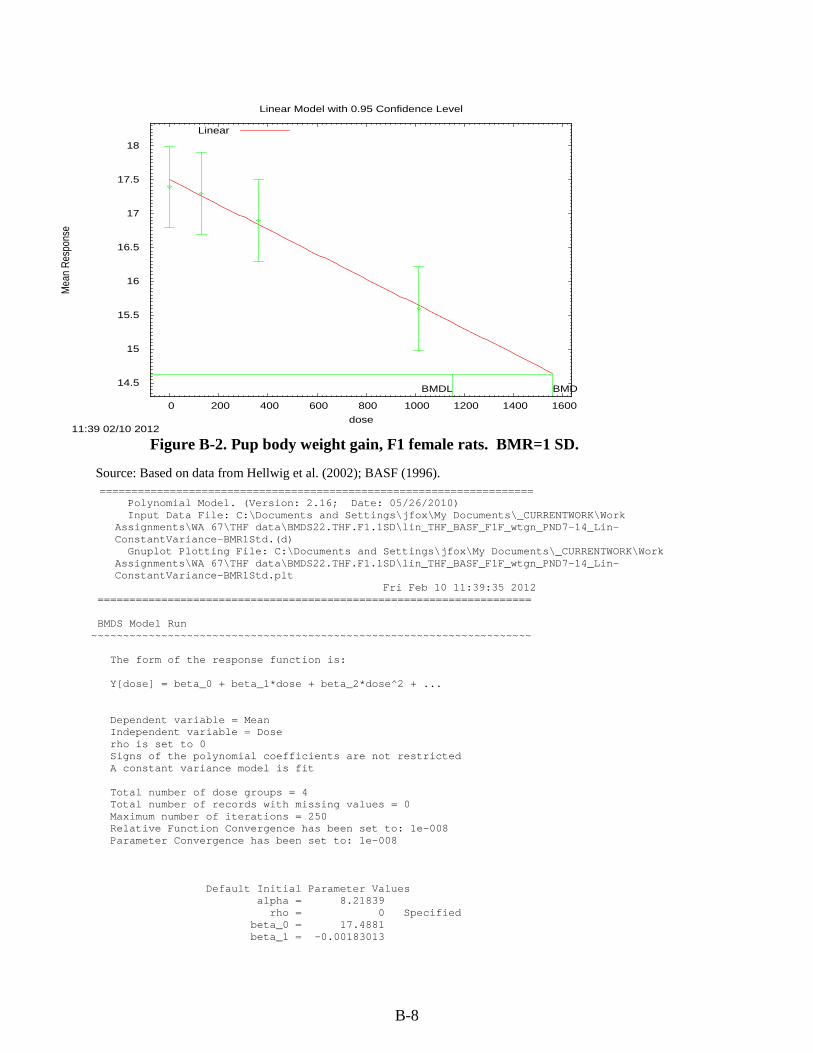
B-8
Figure B-2. Pup body weight gain, F1 female rats. BMR=1 SD.
14.5
15
15.5
16
16.5
17
17.5
18
0 200 400 600 800 1000 1200 1400 1600
Mea
n R
espo
nse
dose
Linear Model with 0.95 Confidence Level
11:39 02/10 2012
BMDBMDL
Linear
Source: Based on data from Hellwig et al. (2002); BASF (1996). ==================================================================== Polynomial Model. (Version: 2.16; Date: 05/26/2010) Input Data File: C:\Documents and Settings\jfox\My Documents\_CURRENTWORK\Work
Assignments\WA 67\THF data\BMDS22.THF.F1.1SD\lin_THF_BASF_F1F_wtgn_PND7-14_Lin-ConstantVariance-BMR1Std.(d)
Gnuplot Plotting File: C:\Documents and Settings\jfox\My Documents\_CURRENTWORK\Work Assignments\WA 67\THF data\BMDS22.THF.F1.1SD\lin_THF_BASF_F1F_wtgn_PND7-14_Lin-ConstantVariance-BMR1Std.plt
Fri Feb 10 11:39:35 2012 ==================================================================== BMDS Model Run ~~~~~~~~~~~~~~~~~~~~~~~~~~~~~~~~~~~~~~~~~~~~~~~~~~~~~~~~~~~~~~~~~~~~~ The form of the response function is: Y[dose] = beta_0 + beta_1*dose + beta_2*dose^2 + ... Dependent variable = Mean Independent variable = Dose rho is set to 0 Signs of the polynomial coefficients are not restricted A constant variance model is fit Total number of dose groups = 4 Total number of records with missing values = 0 Maximum number of iterations = 250 Relative Function Convergence has been set to: 1e-008 Parameter Convergence has been set to: 1e-008
Default Initial Parameter Values alpha = 8.21839 rho = 0 Specified beta_0 = 17.4881 beta_1 = -0.00183013
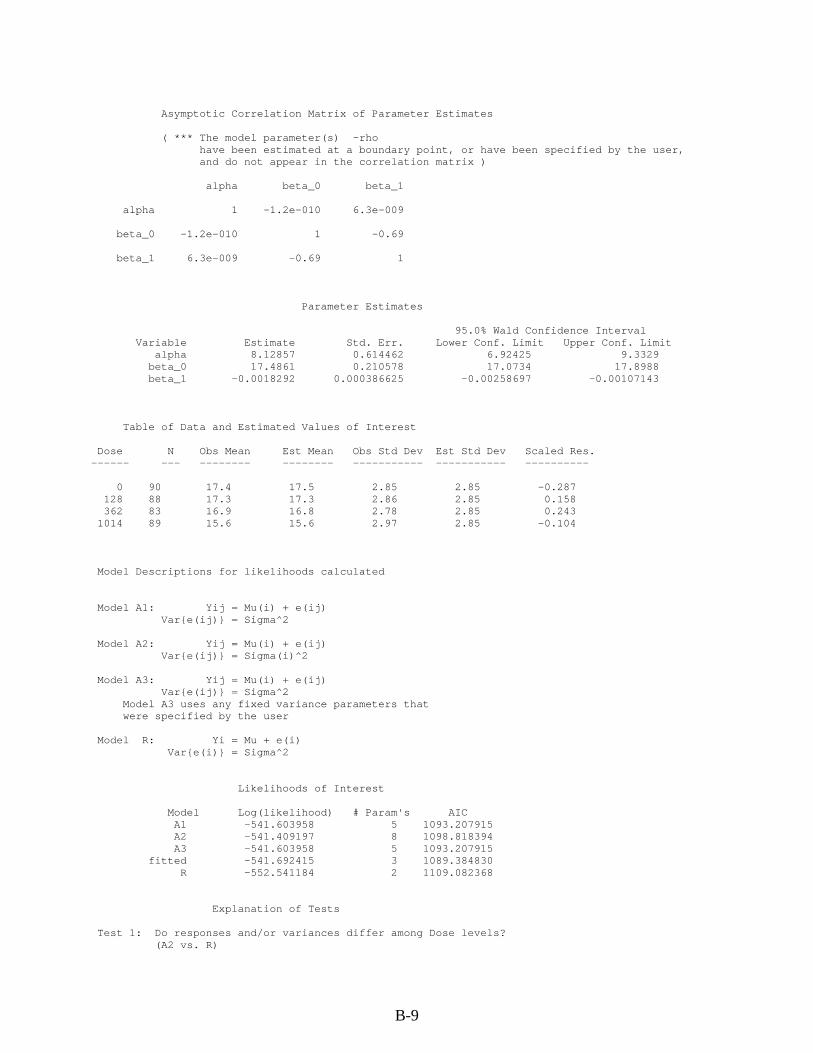
B-9
Asymptotic Correlation Matrix of Parameter Estimates ( *** The model parameter(s) -rho have been estimated at a boundary point, or have been specified by the user, and do not appear in the correlation matrix ) alpha beta_0 beta_1 alpha 1 -1.2e-010 6.3e-009 beta_0 -1.2e-010 1 -0.69 beta_1 6.3e-009 -0.69 1 Parameter Estimates 95.0% Wald Confidence Interval Variable Estimate Std. Err. Lower Conf. Limit Upper Conf. Limit alpha 8.12857 0.614462 6.92425 9.3329 beta_0 17.4861 0.210578 17.0734 17.8988 beta_1 -0.0018292 0.000386625 -0.00258697 -0.00107143 Table of Data and Estimated Values of Interest Dose N Obs Mean Est Mean Obs Std Dev Est Std Dev Scaled Res. ------ --- -------- -------- ----------- ----------- ---------- 0 90 17.4 17.5 2.85 2.85 -0.287 128 88 17.3 17.3 2.86 2.85 0.158 362 83 16.9 16.8 2.78 2.85 0.243 1014 89 15.6 15.6 2.97 2.85 -0.104 Model Descriptions for likelihoods calculated Model A1: Yij = Mu(i) + e(ij) Var{e(ij)} = Sigma^2 Model A2: Yij = Mu(i) + e(ij) Var{e(ij)} = Sigma(i)^2 Model A3: Yij = Mu(i) + e(ij) Var{e(ij)} = Sigma^2 Model A3 uses any fixed variance parameters that were specified by the user Model R: Yi = Mu + e(i) Var{e(i)} = Sigma^2 Likelihoods of Interest Model Log(likelihood) # Param's AIC A1 -541.603958 5 1093.207915 A2 -541.409197 8 1098.818394 A3 -541.603958 5 1093.207915 fitted -541.692415 3 1089.384830 R -552.541184 2 1109.082368 Explanation of Tests Test 1: Do responses and/or variances differ among Dose levels? (A2 vs. R)
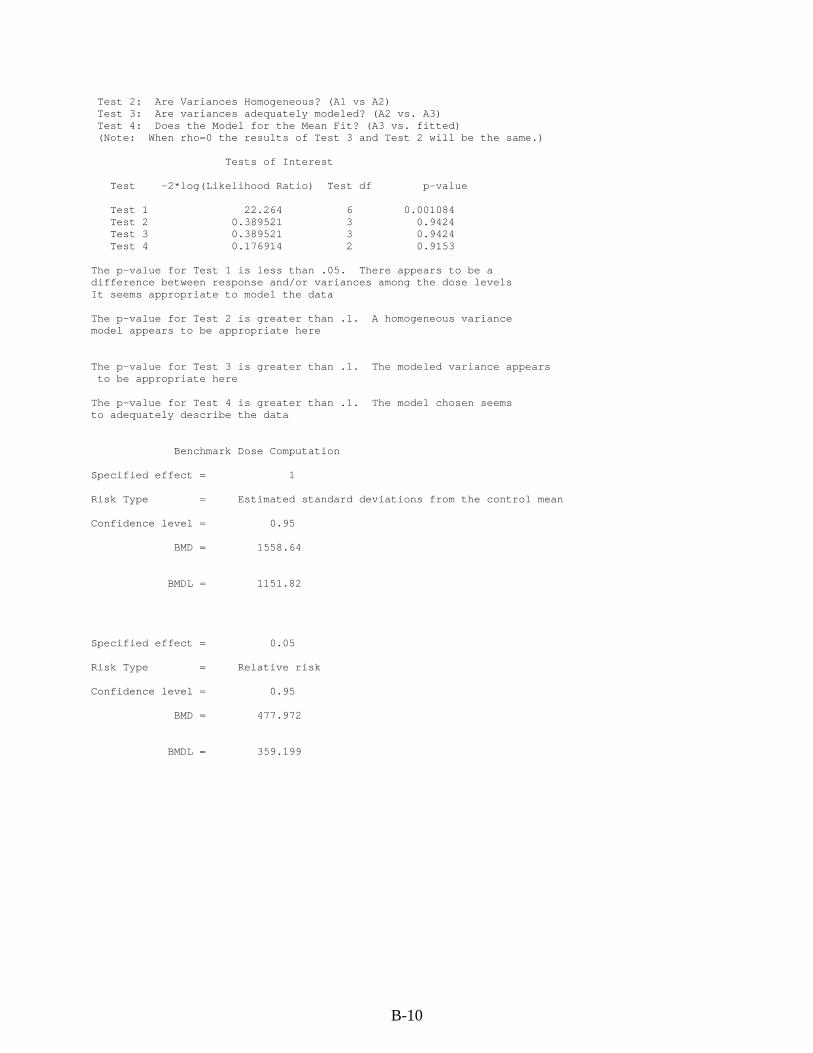
B-10
Test 2: Are Variances Homogeneous? (A1 vs A2) Test 3: Are variances adequately modeled? (A2 vs. A3) Test 4: Does the Model for the Mean Fit? (A3 vs. fitted) (Note: When rho=0 the results of Test 3 and Test 2 will be the same.) Tests of Interest Test -2*log(Likelihood Ratio) Test df p-value Test 1 22.264 6 0.001084 Test 2 0.389521 3 0.9424 Test 3 0.389521 3 0.9424 Test 4 0.176914 2 0.9153 The p-value for Test 1 is less than .05. There appears to be a difference between response and/or variances among the dose levels It seems appropriate to model the data The p-value for Test 2 is greater than .1. A homogeneous variance model appears to be appropriate here The p-value for Test 3 is greater than .1. The modeled variance appears to be appropriate here The p-value for Test 4 is greater than .1. The model chosen seems to adequately describe the data Benchmark Dose Computation Specified effect = 1 Risk Type = Estimated standard deviations from the control mean Confidence level = 0.95 BMD = 1558.64 BMDL = 1151.82 Specified effect = 0.05 Risk Type = Relative risk Confidence level = 0.95 BMD = 477.972 BMDL = 359.199
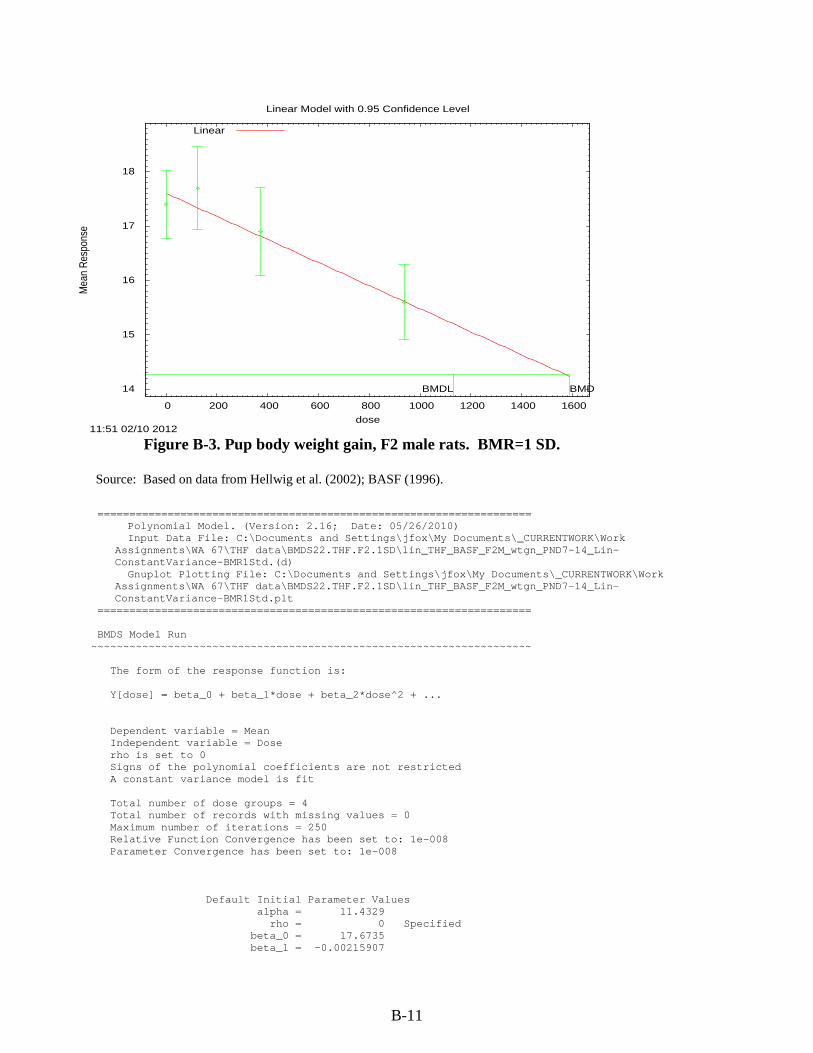
B-11
Figure B-3. Pup body weight gain, F2 male rats. BMR=1 SD.
14
15
16
17
18
0 200 400 600 800 1000 1200 1400 1600
Mea
n R
espo
nse
dose
Linear Model with 0.95 Confidence Level
11:51 02/10 2012
BMDBMDL
Linear
Source: Based on data from Hellwig et al. (2002); BASF (1996).
==================================================================== Polynomial Model. (Version: 2.16; Date: 05/26/2010) Input Data File: C:\Documents and Settings\jfox\My Documents\_CURRENTWORK\Work
Assignments\WA 67\THF data\BMDS22.THF.F2.1SD\lin_THF_BASF_F2M_wtgn_PND7-14_Lin-ConstantVariance-BMR1Std.(d)
Gnuplot Plotting File: C:\Documents and Settings\jfox\My Documents\_CURRENTWORK\Work Assignments\WA 67\THF data\BMDS22.THF.F2.1SD\lin_THF_BASF_F2M_wtgn_PND7-14_Lin-ConstantVariance-BMR1Std.plt
==================================================================== BMDS Model Run ~~~~~~~~~~~~~~~~~~~~~~~~~~~~~~~~~~~~~~~~~~~~~~~~~~~~~~~~~~~~~~~~~~~~~ The form of the response function is: Y[dose] = beta_0 + beta_1*dose + beta_2*dose^2 + ... Dependent variable = Mean Independent variable = Dose rho is set to 0 Signs of the polynomial coefficients are not restricted A constant variance model is fit Total number of dose groups = 4 Total number of records with missing values = 0 Maximum number of iterations = 250 Relative Function Convergence has been set to: 1e-008 Parameter Convergence has been set to: 1e-008
Default Initial Parameter Values alpha = 11.4329 rho = 0 Specified beta_0 = 17.6735 beta_1 = -0.00215907

B-12
Asymptotic Correlation Matrix of Parameter Estimates ( *** The model parameter(s) -rho have been estimated at a boundary point, or have been specified by the user, and do not appear in the correlation matrix ) alpha beta_0 beta_1 alpha 1 -3.8e-010 1.6e-011 beta_0 -3.8e-010 1 -0.7 beta_1 1.6e-011 -0.7 1 Parameter Estimates 95.0% Wald Confidence Interval Variable Estimate Std. Err. Lower Conf. Limit Upper Conf. Limit alpha 11.3396 0.86843 9.63749 13.0417 beta_0 17.6453 0.254252 17.1469 18.1436 beta_1 -0.00211908 0.000515127 -0.00312871 -0.00110945 Table of Data and Estimated Values of Interest Dose N Obs Mean Est Mean Obs Std Dev Est Std Dev Scaled Res. ------ --- -------- -------- ----------- ----------- ---------- 0 95 17.4 17.6 3.08 3.37 -0.71 125 76 17.7 17.4 3.37 3.37 0.827 371 91 16.9 16.9 3.92 3.37 0.116 937 79 15.6 15.7 3.05 3.37 -0.158 Model Descriptions for likelihoods calculated Model A1: Yij = Mu(i) + e(ij) Var{e(ij)} = Sigma^2 Model A2: Yij = Mu(i) + e(ij) Var{e(ij)} = Sigma(i)^2 Model A3: Yij = Mu(i) + e(ij) Var{e(ij)} = Sigma^2 Model A3 uses any fixed variance parameters that were specified by the user Model R: Yi = Mu + e(i) Var{e(i)} = Sigma^2 Likelihoods of Interest Model Log(likelihood) # Param's AIC A1 -583.910529 5 1177.821058 A2 -580.159687 8 1176.319374 A3 -583.910529 5 1177.821058 fitted -584.525080 3 1175.050160 R -592.783141 2 1189.566283 Explanation of Tests Test 1: Do responses and/or variances differ among Dose levels?
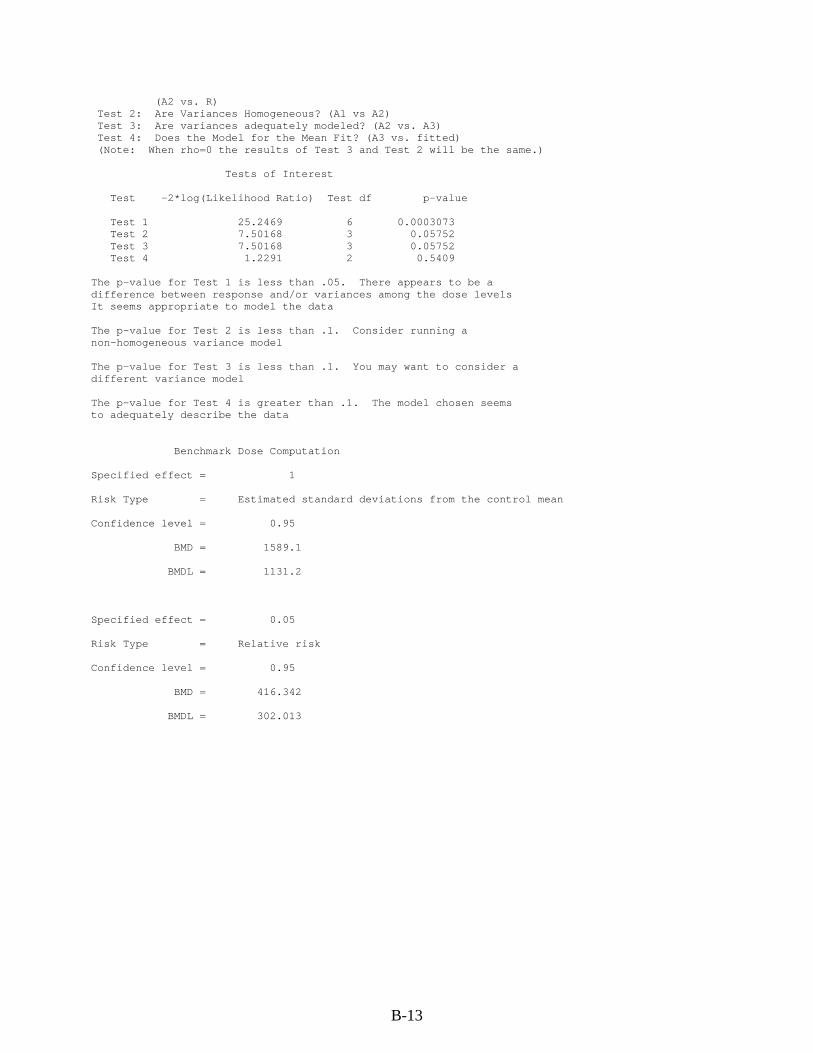
B-13
(A2 vs. R) Test 2: Are Variances Homogeneous? (A1 vs A2) Test 3: Are variances adequately modeled? (A2 vs. A3) Test 4: Does the Model for the Mean Fit? (A3 vs. fitted) (Note: When rho=0 the results of Test 3 and Test 2 will be the same.) Tests of Interest Test -2*log(Likelihood Ratio) Test df p-value Test 1 25.2469 6 0.0003073 Test 2 7.50168 3 0.05752 Test 3 7.50168 3 0.05752 Test 4 1.2291 2 0.5409 The p-value for Test 1 is less than .05. There appears to be a difference between response and/or variances among the dose levels It seems appropriate to model the data The p-value for Test 2 is less than .1. Consider running a non-homogeneous variance model The p-value for Test 3 is less than .1. You may want to consider a different variance model The p-value for Test 4 is greater than .1. The model chosen seems to adequately describe the data Benchmark Dose Computation Specified effect = 1 Risk Type = Estimated standard deviations from the control mean Confidence level = 0.95 BMD = 1589.1 BMDL = 1131.2 Specified effect = 0.05 Risk Type = Relative risk Confidence level = 0.95
BMD = 416.342
BMDL = 302.013
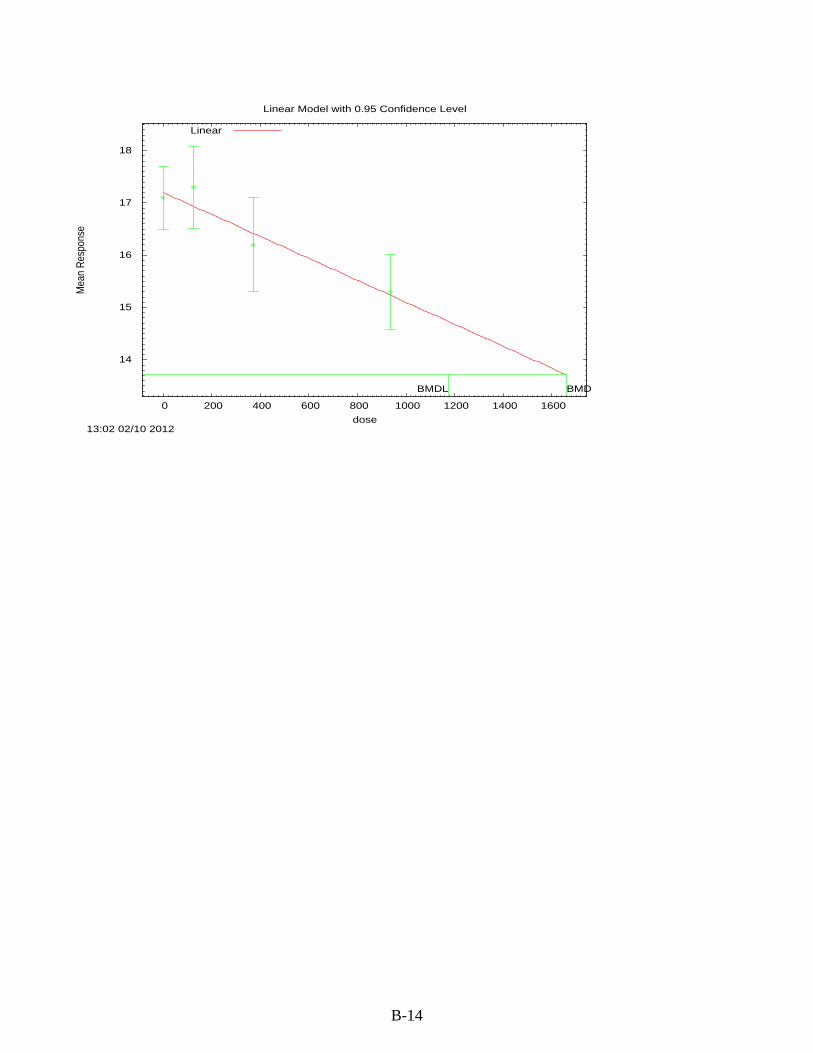
B-14
14
15
16
17
18
0 200 400 600 800 1000 1200 1400 1600
Mea
n R
espo
nse
dose
Linear Model with 0.95 Confidence Level
13:02 02/10 2012
BMDBMDL
Linear
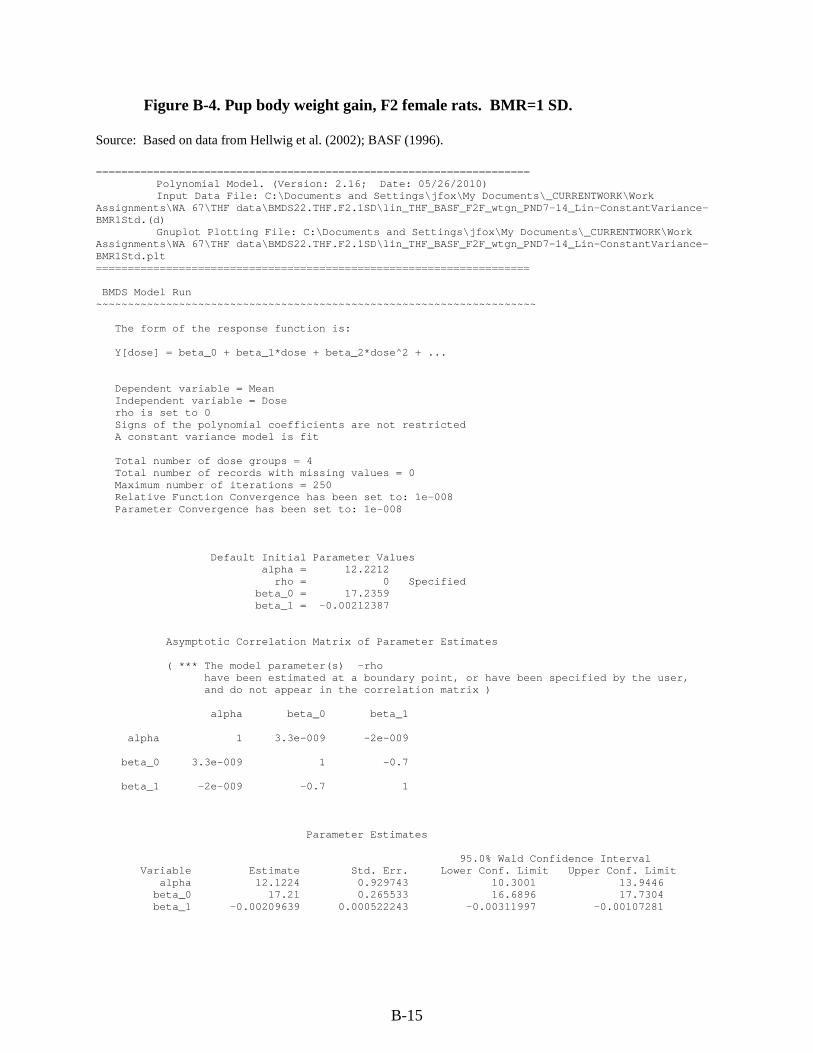
B-15
Figure B-4. Pup body weight gain, F2 female rats. BMR=1 SD.
Source: Based on data from Hellwig et al. (2002); BASF (1996). ==================================================================== Polynomial Model. (Version: 2.16; Date: 05/26/2010) Input Data File: C:\Documents and Settings\jfox\My Documents\_CURRENTWORK\Work Assignments\WA 67\THF data\BMDS22.THF.F2.1SD\lin_THF_BASF_F2F_wtgn_PND7-14_Lin-ConstantVariance-BMR1Std.(d) Gnuplot Plotting File: C:\Documents and Settings\jfox\My Documents\_CURRENTWORK\Work Assignments\WA 67\THF data\BMDS22.THF.F2.1SD\lin_THF_BASF_F2F_wtgn_PND7-14_Lin-ConstantVariance-BMR1Std.plt ==================================================================== BMDS Model Run ~~~~~~~~~~~~~~~~~~~~~~~~~~~~~~~~~~~~~~~~~~~~~~~~~~~~~~~~~~~~~~~~~~~~~ The form of the response function is: Y[dose] = beta_0 + beta_1*dose + beta_2*dose^2 + ... Dependent variable = Mean Independent variable = Dose rho is set to 0 Signs of the polynomial coefficients are not restricted A constant variance model is fit Total number of dose groups = 4 Total number of records with missing values = 0 Maximum number of iterations = 250 Relative Function Convergence has been set to: 1e-008 Parameter Convergence has been set to: 1e-008 Default Initial Parameter Values alpha = 12.2212 rho = 0 Specified beta_0 = 17.2359 beta_1 = -0.00212387 Asymptotic Correlation Matrix of Parameter Estimates ( *** The model parameter(s) -rho have been estimated at a boundary point, or have been specified by the user, and do not appear in the correlation matrix ) alpha beta_0 beta_1 alpha 1 3.3e-009 -2e-009 beta_0 3.3e-009 1 -0.7 beta_1 -2e-009 -0.7 1 Parameter Estimates 95.0% Wald Confidence Interval Variable Estimate Std. Err. Lower Conf. Limit Upper Conf. Limit alpha 12.1224 0.929743 10.3001 13.9446
beta_0 17.21 0.265533 16.6896 17.7304 beta_1 -0.00209639 0.000522243 -0.00311997 -0.00107281
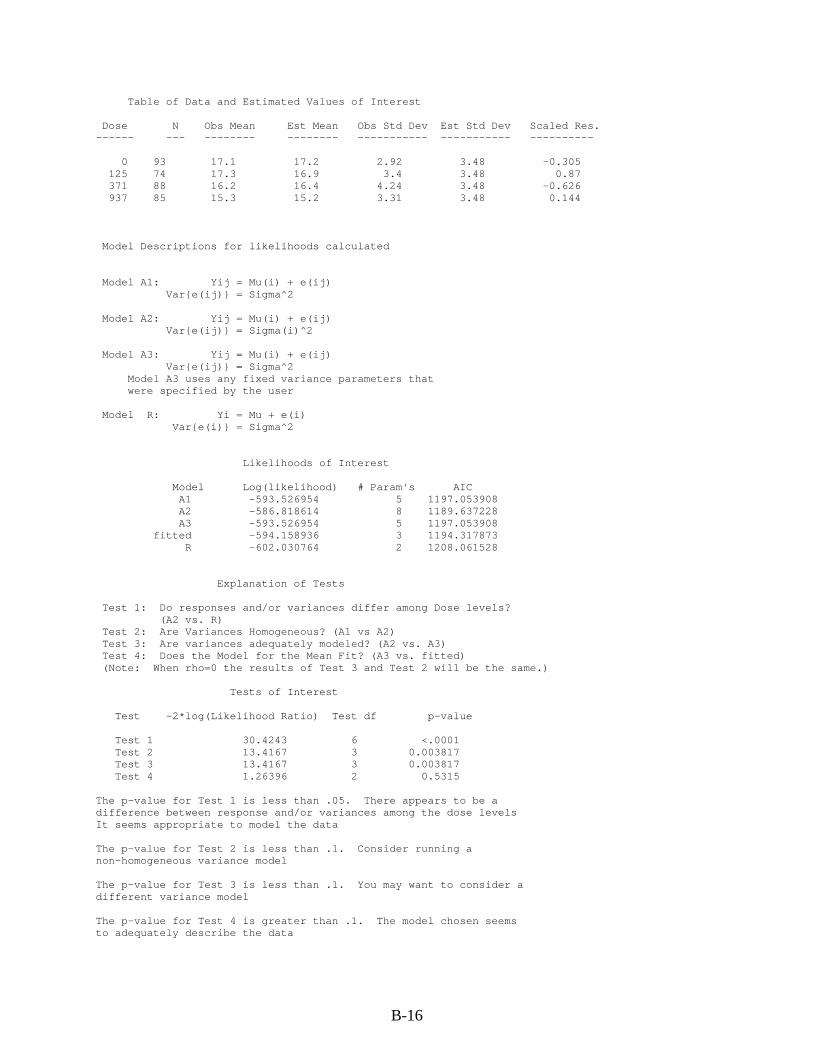
B-16
Table of Data and Estimated Values of Interest Dose N Obs Mean Est Mean Obs Std Dev Est Std Dev Scaled Res. ------ --- -------- -------- ----------- ----------- ---------- 0 93 17.1 17.2 2.92 3.48 -0.305 125 74 17.3 16.9 3.4 3.48 0.87 371 88 16.2 16.4 4.24 3.48 -0.626 937 85 15.3 15.2 3.31 3.48 0.144 Model Descriptions for likelihoods calculated Model A1: Yij = Mu(i) + e(ij) Var{e(ij)} = Sigma^2 Model A2: Yij = Mu(i) + e(ij) Var{e(ij)} = Sigma(i)^2 Model A3: Yij = Mu(i) + e(ij) Var{e(ij)} = Sigma^2 Model A3 uses any fixed variance parameters that were specified by the user Model R: Yi = Mu + e(i) Var{e(i)} = Sigma^2 Likelihoods of Interest Model Log(likelihood) # Param's AIC A1 -593.526954 5 1197.053908 A2 -586.818614 8 1189.637228 A3 -593.526954 5 1197.053908 fitted -594.158936 3 1194.317873 R -602.030764 2 1208.061528 Explanation of Tests Test 1: Do responses and/or variances differ among Dose levels? (A2 vs. R) Test 2: Are Variances Homogeneous? (A1 vs A2) Test 3: Are variances adequately modeled? (A2 vs. A3) Test 4: Does the Model for the Mean Fit? (A3 vs. fitted) (Note: When rho=0 the results of Test 3 and Test 2 will be the same.) Tests of Interest Test -2*log(Likelihood Ratio) Test df p-value Test 1 30.4243 6 <.0001 Test 2 13.4167 3 0.003817 Test 3 13.4167 3 0.003817 Test 4 1.26396 2 0.5315 The p-value for Test 1 is less than .05. There appears to be a difference between response and/or variances among the dose levels It seems appropriate to model the data The p-value for Test 2 is less than .1. Consider running a non-homogeneous variance model The p-value for Test 3 is less than .1. You may want to consider a different variance model The p-value for Test 4 is greater than .1. The model chosen seems to adequately describe the data
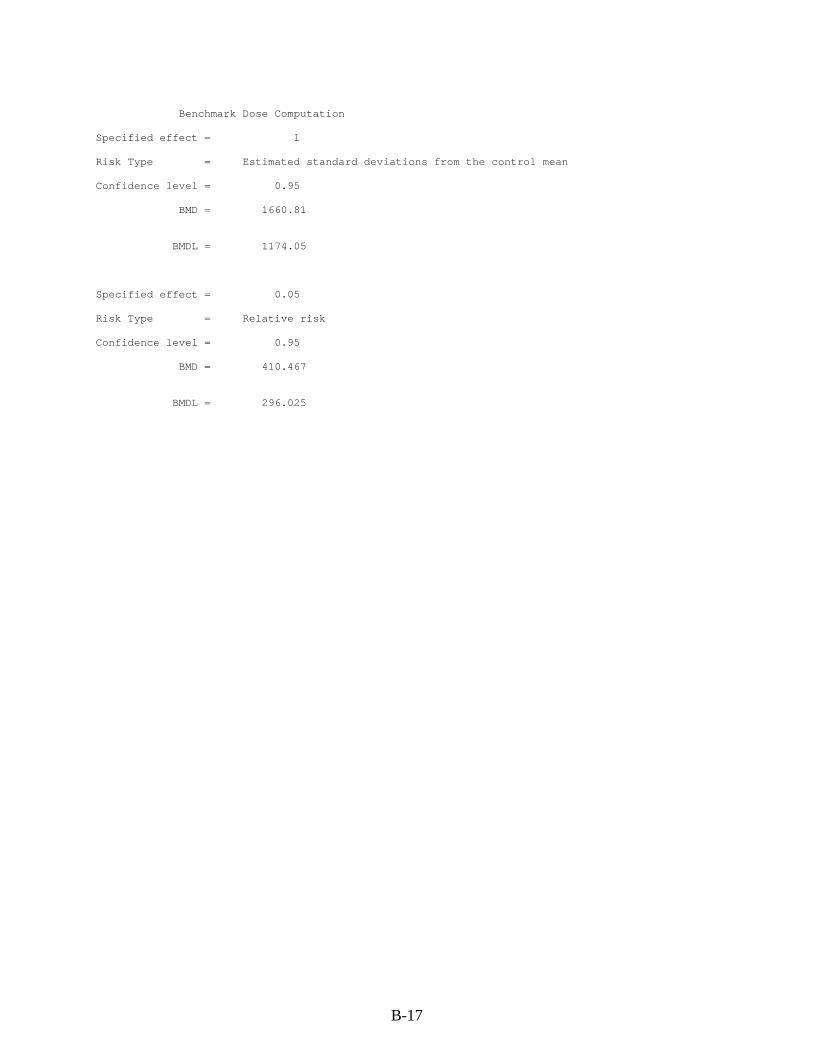
B-17
Benchmark Dose Computation Specified effect = 1 Risk Type = Estimated standard deviations from the control mean Confidence level = 0.95 BMD = 1660.81 BMDL = 1174.05 Specified effect = 0.05 Risk Type = Relative risk Confidence level = 0.95 BMD = 410.467 BMDL = 296.025
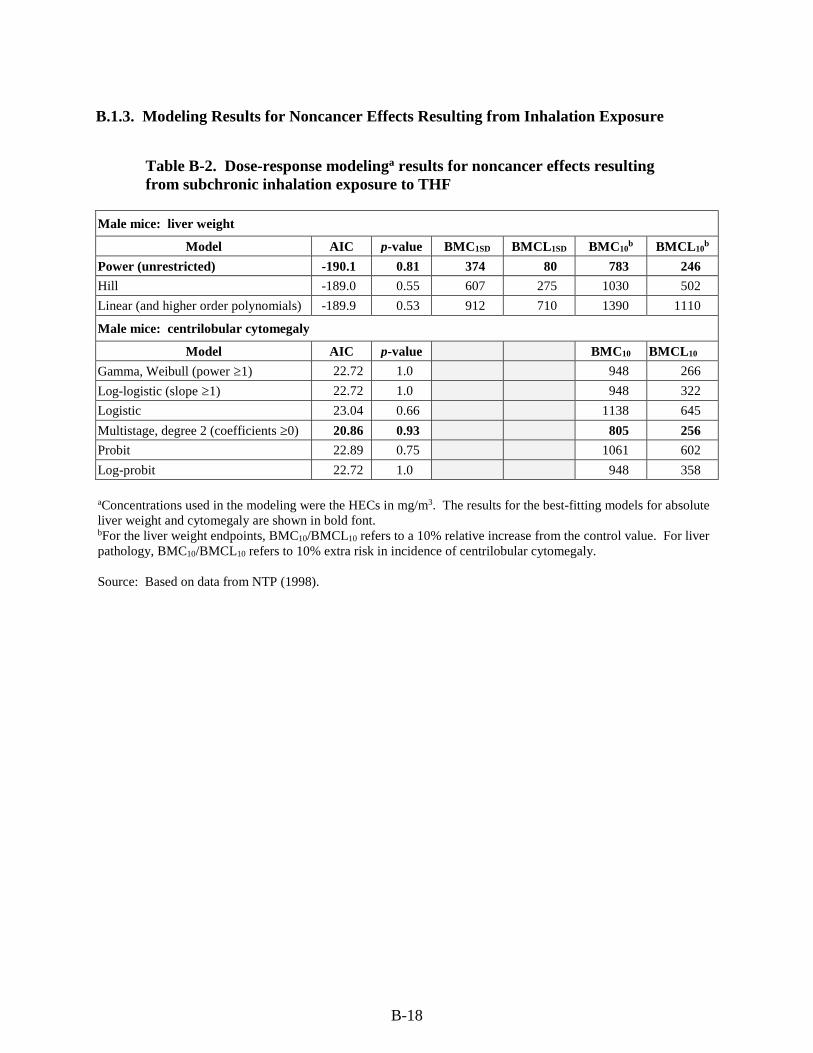
B-18
B.1.3. Modeling Results for Noncancer Effects Resulting from Inhalation Exposure
Table B-2. Dose-response modelinga results for noncancer effects resulting from subchronic inhalation exposure to THF
Male mice: liver weight
Model AIC p-value BMC1SD BMCL1SD BMC10b BMCL10
b
Power (unrestricted) -190.1 0.81 374 80 783 246
Hill -189.0 0.55 607 275 1030 502
Linear (and higher order polynomials) -189.9 0.53 912 710 1390 1110
Male mice: centrilobular cytomegaly
Model AIC p-value BMC10 BMCL10
Gamma, Weibull (power ≥1) 22.72 1.0 948 266
Log-logistic (slope ≥1) 22.72 1.0 948 322
Logistic 23.04 0.66 1138 645
Multistage, degree 2 (coefficients ≥0) 20.86 0.93 805 256
Probit 22.89 0.75 1061 602
Log-probit 22.72 1.0 948 358
aConcentrations used in the modeling were the HECs in mg/m3. The results for the best-fitting models for absolute liver weight and cytomegaly are shown in bold font. bFor the liver weight endpoints, BMC10/BMCL10 refers to a 10% relative increase from the control value. For liver pathology, BMC10/BMCL10 refers to 10% extra risk in incidence of centrilobular cytomegaly.
Source: Based on data from NTP (1998).
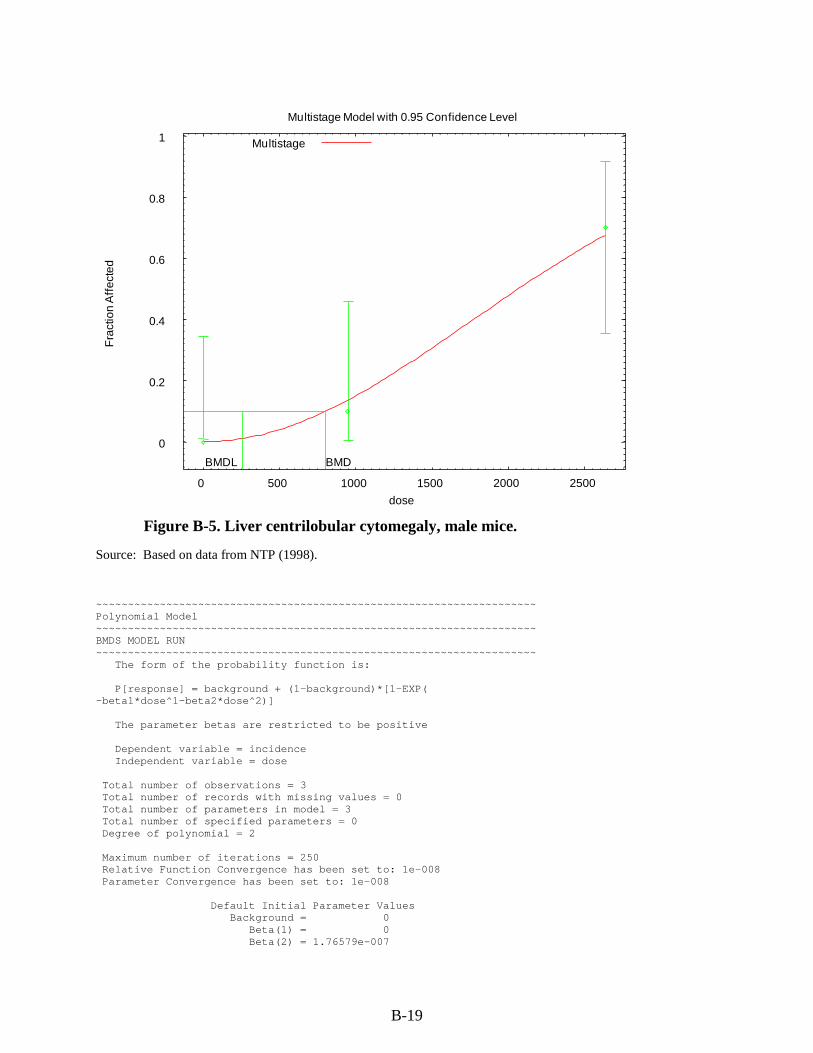
B-19
Figure B-5. Liver centrilobular cytomegaly, male mice.
0
0.2
0.4
0.6
0.8
1
0 500 1000 1500 2000 2500
Fra
ctio
n A
ffec
ted
dose
Multistage Model with 0.95 Confidence Level
BMDBMDL
Multistage
Source: Based on data from NTP (1998). ~~~~~~~~~~~~~~~~~~~~~~~~~~~~~~~~~~~~~~~~~~~~~~~~~~~~~~~~~~~~~~~~~~~~~ Polynomial Model ~~~~~~~~~~~~~~~~~~~~~~~~~~~~~~~~~~~~~~~~~~~~~~~~~~~~~~~~~~~~~~~~~~~~~ BMDS MODEL RUN ~~~~~~~~~~~~~~~~~~~~~~~~~~~~~~~~~~~~~~~~~~~~~~~~~~~~~~~~~~~~~~~~~~~~~ The form of the probability function is: P[response] = background + (1-background)*[1-EXP( -beta1*dose^1-beta2*dose^2)] The parameter betas are restricted to be positive Dependent variable = incidence Independent variable = dose Total number of observations = 3 Total number of records with missing values = 0 Total number of parameters in model = 3 Total number of specified parameters = 0 Degree of polynomial = 2 Maximum number of iterations = 250 Relative Function Convergence has been set to: 1e-008 Parameter Convergence has been set to: 1e-008 Default Initial Parameter Values Background = 0 Beta(1) = 0 Beta(2) = 1.76579e-007
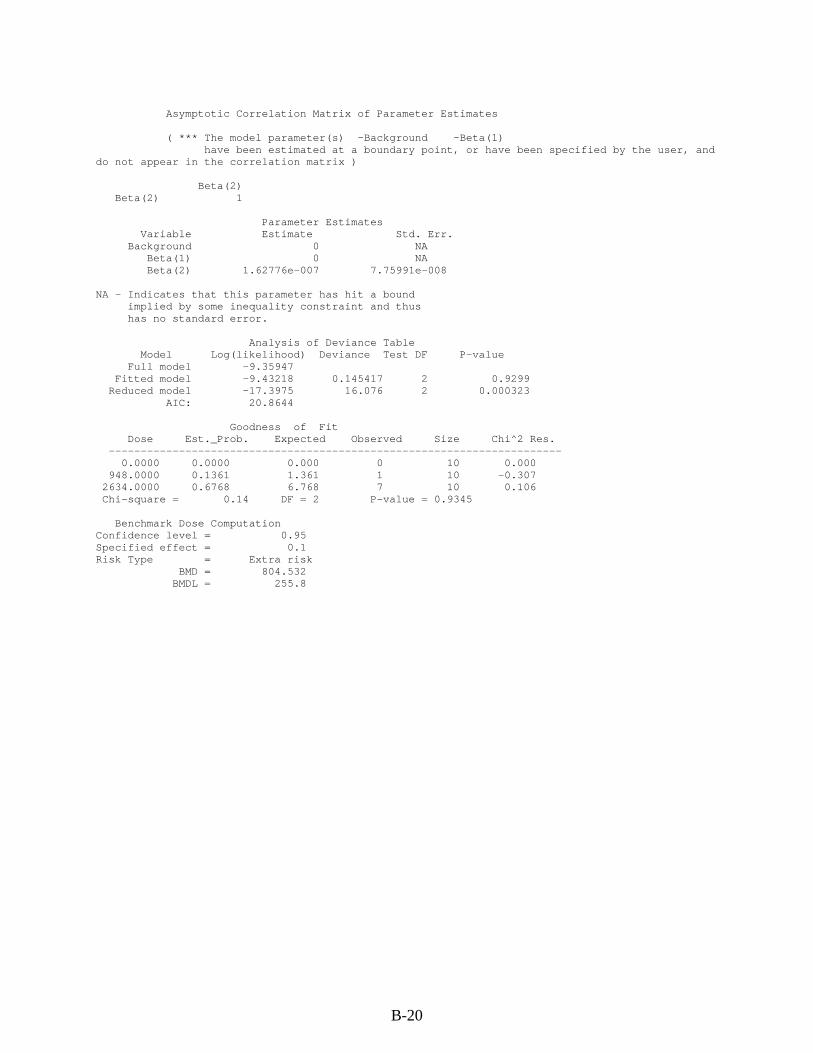
B-20
Asymptotic Correlation Matrix of Parameter Estimates
( *** The model parameter(s) -Background -Beta(1) have been estimated at a boundary point, or have been specified by the user, and
do not appear in the correlation matrix )
Beta(2) Beta(2) 1
Parameter Estimates Variable Estimate Std. Err. Background 0 NA Beta(1) 0 NA Beta(2) 1.62776e-007 7.75991e-008
NA - Indicates that this parameter has hit a bound implied by some inequality constraint and thus has no standard error.
Analysis of Deviance Table Model Log(likelihood) Deviance Test DF P-value Full model -9.35947 Fitted model -9.43218 0.145417 2 0.9299 Reduced model -17.3975 16.076 2 0.000323
AIC: 20.8644
Goodness of Fit Dose Est._Prob. Expected Observed Size Chi^2 Res. ----------------------------------------------------------------------- 0.0000 0.0000 0.000 0 10 0.000 948.0000 0.1361 1.361 1 10 -0.307 2634.0000 0.6768 6.768 7 10 0.106 Chi-square = 0.14 DF = 2 P-value = 0.9345
Benchmark Dose Computation Confidence level = 0.95 Specified effect = 0.1 Risk Type = Extra risk
BMD = 804.532 BMDL = 255.8
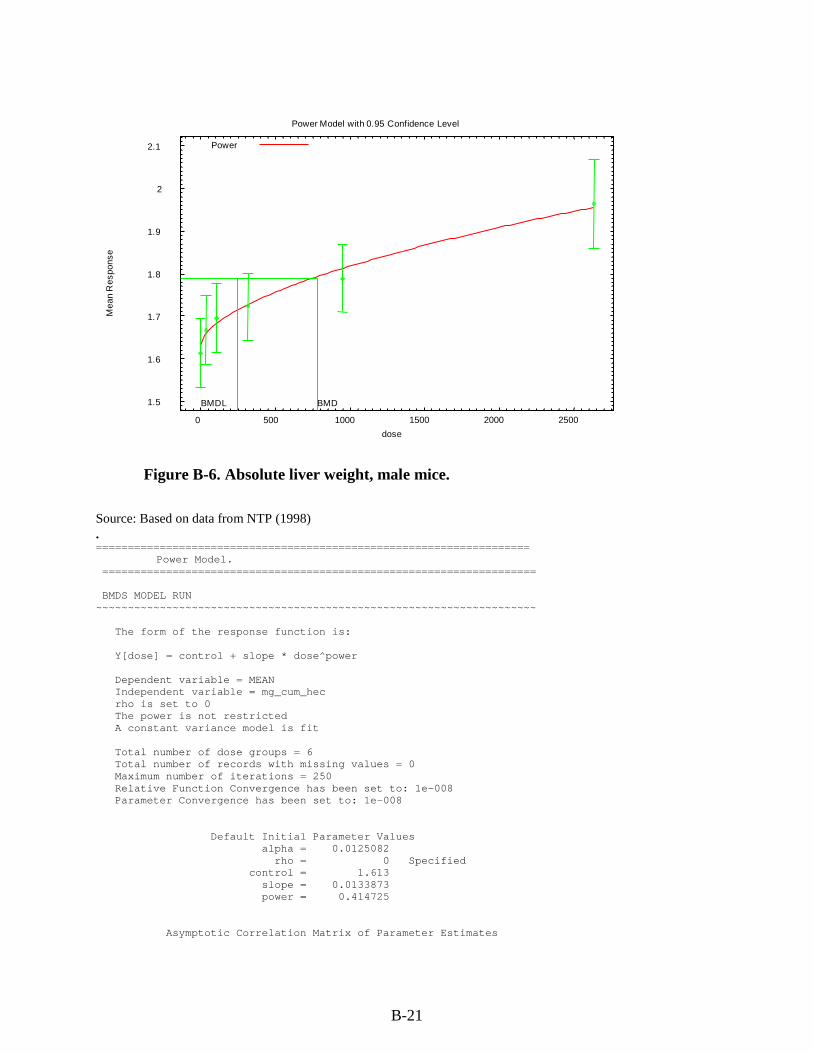
B-21
Figure B-6. Absolute liver weight, male mice.
1.5
1.6
1.7
1.8
1.9
2
2.1
0 500 1000 1500 2000 2500
Mea
n R
espo
nse
dose
Power Model with 0.95 Confidence Level
BMDBMDL
Power
Source: Based on data from NTP (1998) . ==================================================================== Power Model. ==================================================================== BMDS MODEL RUN ~~~~~~~~~~~~~~~~~~~~~~~~~~~~~~~~~~~~~~~~~~~~~~~~~~~~~~~~~~~~~~~~~~~~~ The form of the response function is: Y[dose] = control + slope * dose^power Dependent variable = MEAN Independent variable = mg_cum_hec rho is set to 0 The power is not restricted A constant variance model is fit Total number of dose groups = 6 Total number of records with missing values = 0 Maximum number of iterations = 250 Relative Function Convergence has been set to: 1e-008 Parameter Convergence has been set to: 1e-008 Default Initial Parameter Values alpha = 0.0125082 rho = 0 Specified control = 1.613 slope = 0.0133873 power = 0.414725 Asymptotic Correlation Matrix of Parameter Estimates
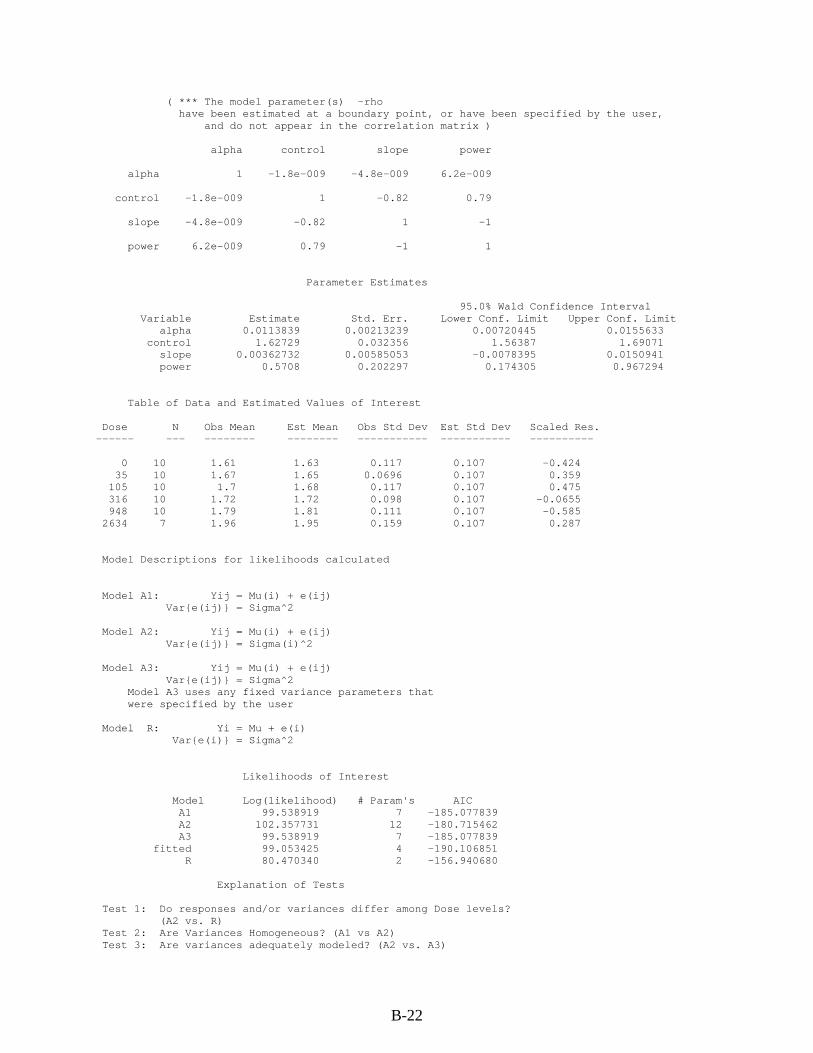
B-22
( *** The model parameter(s) -rho have been estimated at a boundary point, or have been specified by the user,
and do not appear in the correlation matrix )
alpha control slope power
alpha 1 -1.8e-009 -4.8e-009 6.2e-009
control -1.8e-009 1 -0.82 0.79
slope -4.8e-009 -0.82 1 -1
power 6.2e-009 0.79 -1 1
Parameter Estimates
95.0% Wald Confidence Interval Variable Estimate Std. Err. Lower Conf. Limit Upper Conf. Limit
alpha 0.0113839 0.00213239 0.00720445 0.0155633 control 1.62729 0.032356 1.56387 1.69071
slope 0.00362732 0.00585053 -0.0078395 0.0150941 power 0.5708 0.202297 0.174305 0.967294
Table of Data and Estimated Values of Interest
Dose N Obs Mean Est Mean Obs Std Dev Est Std Dev Scaled Res. ------ --- -------- -------- ----------- ----------- ----------
0 10 1.61 1.63 0.117 0.107 -0.424 35 10 1.67 1.65 0.0696 0.107 0.359 105 10 1.7 1.68 0.117 0.107 0.475 316 10 1.72 1.72 0.098 0.107 -0.0655 948 10 1.79 1.81 0.111 0.107 -0.585 2634 7 1.96 1.95 0.159 0.107 0.287
Model Descriptions for likelihoods calculated
Model A1: Yij = Mu(i) + e(ij) Var{e(ij)} = Sigma^2
Model A2: Yij = Mu(i) + e(ij) Var{e(ij)} = Sigma(i)^2
Model A3: Yij = Mu(i) + e(ij) Var{e(ij)} = Sigma^2
Model A3 uses any fixed variance parameters that were specified by the user
Model R: Yi = Mu + e(i) Var{e(i)} = Sigma^2
Likelihoods of Interest
Model Log(likelihood) # Param's AIC A1 99.538919 7 -185.077839 A2 102.357731 12 -180.715462 A3 99.538919 7 -185.077839
fitted 99.053425 4 -190.106851 R 80.470340 2 -156.940680
Explanation of Tests
Test 1: Do responses and/or variances differ among Dose levels? (A2 vs. R)
Test 2: Are Variances Homogeneous? (A1 vs A2) Test 3: Are variances adequately modeled? (A2 vs. A3)
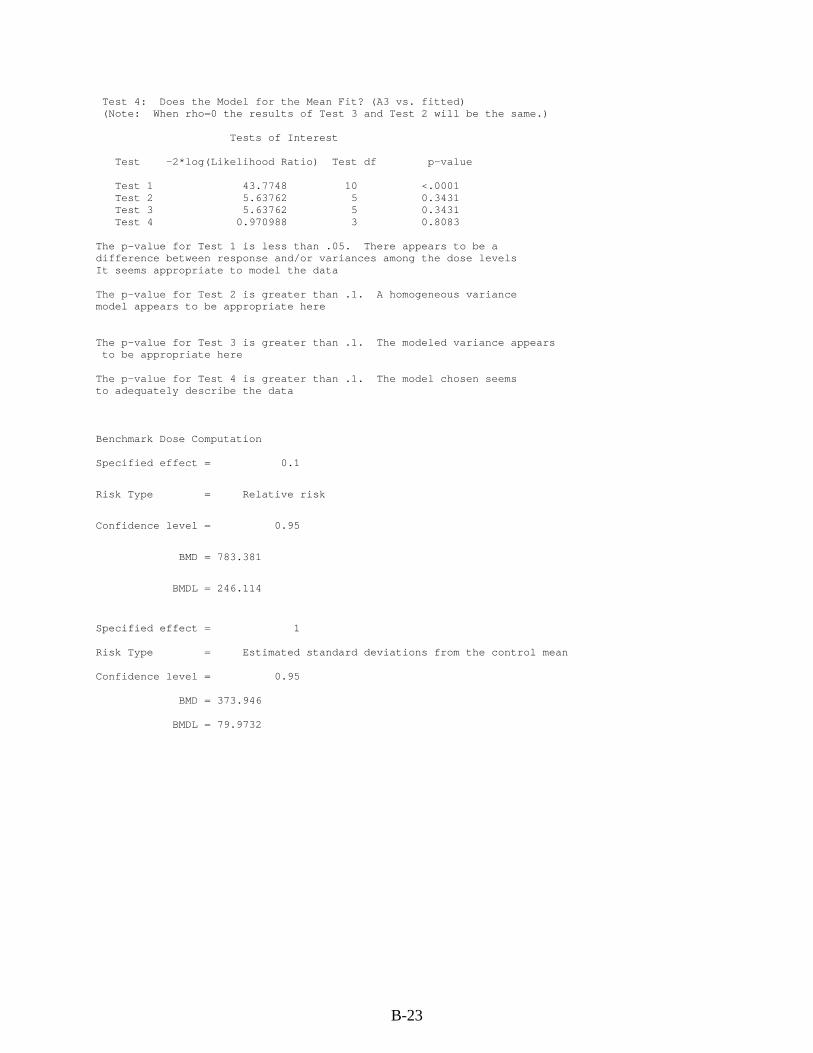
B-23
Test 4: Does the Model for the Mean Fit? (A3 vs. fitted) (Note: When rho=0 the results of Test 3 and Test 2 will be the same.) Tests of Interest Test -2*log(Likelihood Ratio) Test df p-value Test 1 43.7748 10 <.0001 Test 2 5.63762 5 0.3431 Test 3 5.63762 5 0.3431 Test 4 0.970988 3 0.8083 The p-value for Test 1 is less than .05. There appears to be a difference between response and/or variances among the dose levels It seems appropriate to model the data The p-value for Test 2 is greater than .1. A homogeneous variance model appears to be appropriate here The p-value for Test 3 is greater than .1. The modeled variance appears to be appropriate here The p-value for Test 4 is greater than .1. The model chosen seems to adequately describe the data Benchmark Dose Computation Specified effect = 0.1
Risk Type = Relative risk
Confidence level = 0.95
BMD = 783.381
BMDL = 246.114
Specified effect = 1 Risk Type = Estimated standard deviations from the control mean Confidence level = 0.95 BMD = 373.946 BMDL = 79.9732
B-24
B.2. DERIVATION OF AN INHALATION CANCER RISK ESTIMATE USING A
LINEAR LOW-DOSE EXTRAPOLATION APPROACH FOR THF
B.2.1. Rationale and Methods for Deriving a Cancer Risk Estimate
As indicated in Section 5.3.1., the U.S. EPA Guidelines for Carcinogen Risk Assessment
(U.S. EPA, 2005a) state: "When there is suggestive evidence, the Agency generally would not
attempt a dose-response assessment, as the nature of the data generally would not support one;
however, when the evidence includes a well-conducted study, quantitative analyses may be
useful for some purposes, for example, providing a sense of the magnitude and uncertainty of
potential risks, ranking potential hazards, or setting research priorities. In each case, the
rationale for the quantitative analysis is explained, considering the uncertainty in the data and the
suggestive nature of the weight of evidence. These analyses generally would not be considered
Agency consensus estimates."
In this case, the NTP (1998) cancer bioassay for THF is a well-conducted study showing
hepatocellular adenoma or carcinomas in female mice that were increased in a dose-related
manner, starting at an approximate 15% increase over controls at the lowest exposure. The
adjusted rate of renal adenoma or carcinoma in male rats was also increased in a dose-related
manner, starting at an approximate 9% increase over controls at the lowest exposure. The data
from this study are amenable to modeling; EPA would generally derive a cancer risk estimate
from such data.
However, a majority of the external peer review panel members (see Appendix A:
Summary of External Peer Review and Public Comments and Disposition) stated that derivation
of an inhalation unit risk (IUR) for THF would result in an overestimation of cancer risk if a
linear low-dose extrapolation approach was utilized. Although the reviewers agreed with EPA’s
conclusion that based on the available data the modes of action for both liver and kidney tumors
induced by THF are not well understood, they suggested that THF is a weak, nongenotoxic
carcinogen that would have a threshold. The U.S. EPA Guidelines for Carcinogen Risk
Assessment (U.S. EPA, 2005a) recommend that the method used to characterize and quantify
cancer risk for a chemical is determined by what is known about the mode of action of the
carcinogen and the shape of the cancer dose-response curve. The linear approach is
recommended if the mode of action of carcinogenicity is not understood (U.S. EPA, 2005a). In
the case of THF, very little data are available to inform the mode of action and no data are
available to indicate the shape of the dose-response curve at low doses. If data were available to
better inform the mode of action, and the data were indicative of a threshold response, then a
reference value could be derived based on a precursor endpoint (i.e., key event in the mode of
action) and considered for the RfC for THF. For THF, there were no reported noncancer effects
B-25
that could serve as a precursor endpoint upon which to base a nonlinear analysis. Thus, the
nonlinear analysis recommended by the peer reviewers cannot be readily implemented.
Based on the peer reviewers’ concern for the potential overestimation of risk in deriving
an IUR for THF using a linear low-dose extrapolation approach combined with the uncertainty
associated with the carcinogenic potential for THF, EPA did not derive an IUR. However,
because there may be some circumstances, as indicated in the cancer guidelines, for which a
cancer risk estimate for THF would be useful, EPA has presented what the inhalation cancer risk
estimate would be if it were derived using a linear low-dose approach.
Table B-3 summarizes both the overall and survival-adjusted incidences of mouse
hepatocellular and rat renal neoplasms from the NTP (1998) study. Adenoma and carcinoma
incidences within each site were combined by counting animals with either of these responses.
This practice was performed under the assumption that adenomas and carcinomas originating
from the same cell type represent stages along a continuum of carcinogenic effects resulting from
the same mechanism, as recommended in EPA’s Guidelines for Carcinogen Risk Assessment
(U.S. EPA, 2005a).
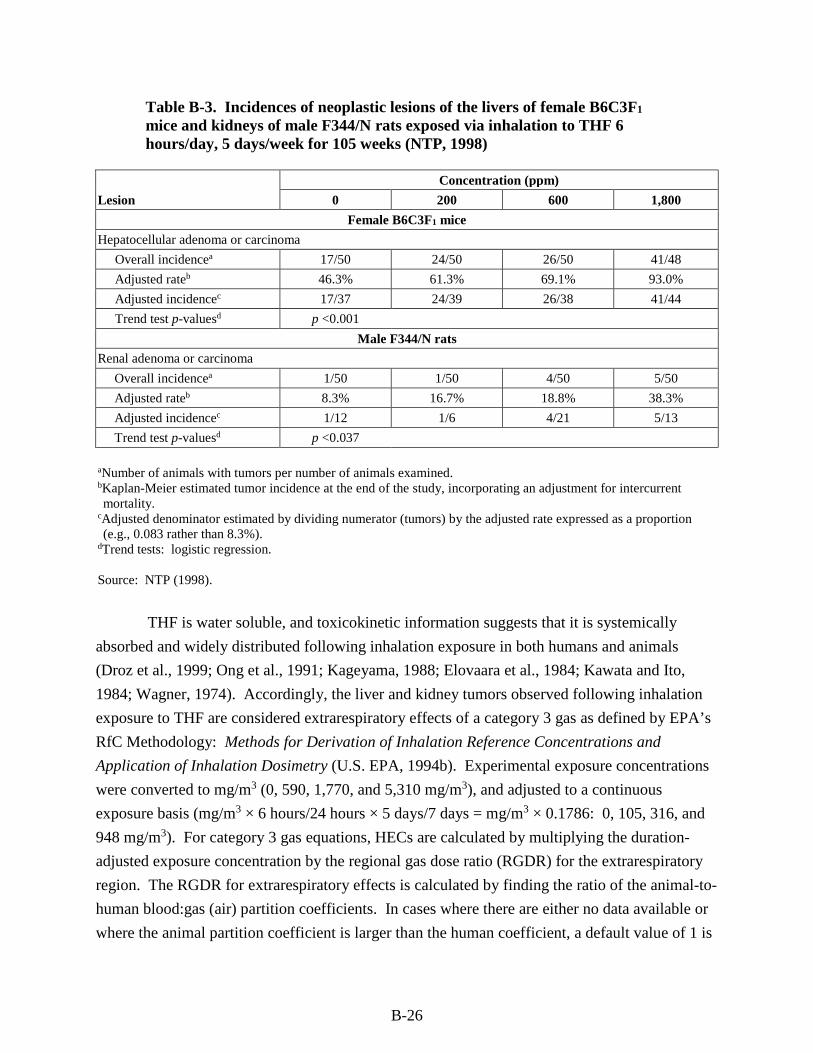
B-26
Table B-3. Incidences of neoplastic lesions of the livers of female B6C3F1 mice and kidneys of male F344/N rats exposed via inhalation to THF 6 hours/day, 5 days/week for 105 weeks (NTP, 1998)
Lesion
Concentration (ppm)
0 200 600 1,800
Female B6C3F1 mice
Hepatocellular adenoma or carcinoma
Overall incidencea 17/50 24/50 26/50 41/48
Adjusted rateb 46.3% 61.3% 69.1% 93.0%
Adjusted incidencec 17/37 24/39 26/38 41/44
Trend test p-valuesd p <0.001
Male F344/N rats
Renal adenoma or carcinoma
Overall incidencea 1/50 1/50 4/50 5/50
Adjusted rateb 8.3% 16.7% 18.8% 38.3%
Adjusted incidencec 1/12 1/6 4/21 5/13
Trend test p-valuesd p <0.037
aNumber of animals with tumors per number of animals examined. bKaplan-Meier estimated tumor incidence at the end of the study, incorporating an adjustment for intercurrent mortality.
cAdjusted denominator estimated by dividing numerator (tumors) by the adjusted rate expressed as a proportion (e.g., 0.083 rather than 8.3%).
dTrend tests: logistic regression.
Source: NTP (1998).
THF is water soluble, and toxicokinetic information suggests that it is systemically
absorbed and widely distributed following inhalation exposure in both humans and animals
(Droz et al., 1999; Ong et al., 1991; Kageyama, 1988; Elovaara et al., 1984; Kawata and Ito,
1984; Wagner, 1974). Accordingly, the liver and kidney tumors observed following inhalation
exposure to THF are considered extrarespiratory effects of a category 3 gas as defined by EPA’s
RfC Methodology: Methods for Derivation of Inhalation Reference Concentrations and
Application of Inhalation Dosimetry (U.S. EPA, 1994b). Experimental exposure concentrations
were converted to mg/m3 (0, 590, 1,770, and 5,310 mg/m3), and adjusted to a continuous
exposure basis (mg/m3 × 6 hours/24 hours × 5 days/7 days = mg/m3 × 0.1786: 0, 105, 316, and
948 mg/m3). For category 3 gas equations, HECs are calculated by multiplying the duration-
adjusted exposure concentration by the regional gas dose ratio (RGDR) for the extrarespiratory
region. The RGDR for extrarespiratory effects is calculated by finding the ratio of the animal-to-
human blood:gas (air) partition coefficients. In cases where there are either no data available or
where the animal partition coefficient is larger than the human coefficient, a default value of 1 is
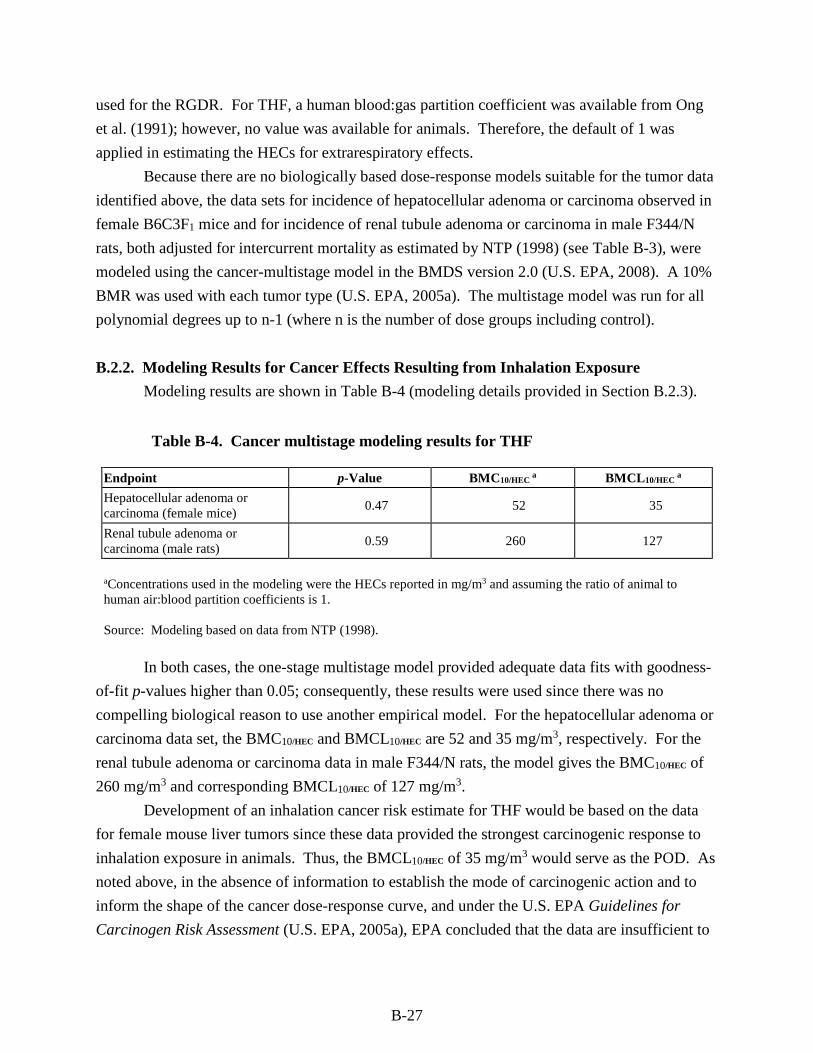
B-27
used for the RGDR. For THF, a human blood:gas partition coefficient was available from Ong
et al. (1991); however, no value was available for animals. Therefore, the default of 1 was
applied in estimating the HECs for extrarespiratory effects.
Because there are no biologically based dose-response models suitable for the tumor data
identified above, the data sets for incidence of hepatocellular adenoma or carcinoma observed in
female B6C3F1 mice and for incidence of renal tubule adenoma or carcinoma in male F344/N
rats, both adjusted for intercurrent mortality as estimated by NTP (1998) (see Table B-3), were
modeled using the cancer-multistage model in the BMDS version 2.0 (U.S. EPA, 2008). A 10%
BMR was used with each tumor type (U.S. EPA, 2005a). The multistage model was run for all
polynomial degrees up to n-1 (where n is the number of dose groups including control).
B.2.2. Modeling Results for Cancer Effects Resulting from Inhalation Exposure
Modeling results are shown in Table B-4 (modeling details provided in Section B.2.3).
Table B-4. Cancer multistage modeling results for THF
Endpoint p-Value BMC10/HEC a BMCL10/HEC
a
Hepatocellular adenoma or carcinoma (female mice)
0.47 52 35
Renal tubule adenoma or carcinoma (male rats)
0.59 260 127
aConcentrations used in the modeling were the HECs reported in mg/m3 and assuming the ratio of animal to human air:blood partition coefficients is 1.
Source: Modeling based on data from NTP (1998).
In both cases, the one-stage multistage model provided adequate data fits with goodness-
of-fit p-values higher than 0.05; consequently, these results were used since there was no
compelling biological reason to use another empirical model. For the hepatocellular adenoma or
carcinoma data set, the BMC10/HEC and BMCL10/HEC are 52 and 35 mg/m3, respectively. For the
renal tubule adenoma or carcinoma data in male F344/N rats, the model gives the BMC10/HEC of
260 mg/m3 and corresponding BMCL10/HEC of 127 mg/m3.
Development of an inhalation cancer risk estimate for THF would be based on the data
for female mouse liver tumors since these data provided the strongest carcinogenic response to
inhalation exposure in animals. Thus, the BMCL10/HEC of 35 mg/m3 would serve as the POD. As
noted above, in the absence of information to establish the mode of carcinogenic action and to
inform the shape of the cancer dose-response curve, and under the U.S. EPA Guidelines for
Carcinogen Risk Assessment (U.S. EPA, 2005a), EPA concluded that the data are insufficient to
B-28
provide significant biological support for either a linear or a nonlinear extrapolation approach;
thus, a default linear approach would be applied.
An inhalation cancer risk estimate is derived from the BMCL10/HEC (the lower bound on
the exposure associated with a 10% extra cancer risk) by dividing the risk (as a fraction) by the
BMCL10/HEC and represents an upper bound estimate on human extra cancer risk from continuous
lifetime inhalation exposure to THF. The BMCL10/HEC for extra risk of hepatocellular adenomas
or carcinomas in female B6C3F1 mice exposed to THF results in a risk estimate of
0.1/(35 mg/m3) = 0.0029 (mg/m3)–1 or 3 × 10⁻⁶ per µg/m3 (rounded to one significant figure).
This value was derived by linear extrapolation to the origin from the POD of 35 mg/m3 and
represents an upper bound estimate. This inhalation cancer risk value should not be used with
exposures >35 mg/m3, because above this level, the modeled dose-response relationship better
characterizes what is known about the carcinogenicity of THF rather than the risk estimate. The
slope of the linear extrapolation from the BMC10, associated with 10% extra cancer risk, is
calculated as 0.1/(52 mg/m3) = 0.0019 (mg/m3)–1 or 2 × 10⁻⁶ per µg/m3. Risk assessors should
use caution when considering the use of the inhalation cancer risk estimate, due to the
uncertainty associated with the potential overestimation of risk related to the linear low-dose
extrapolation approach employed in its derivation and the suggestive nature of the tumorigenic
response.
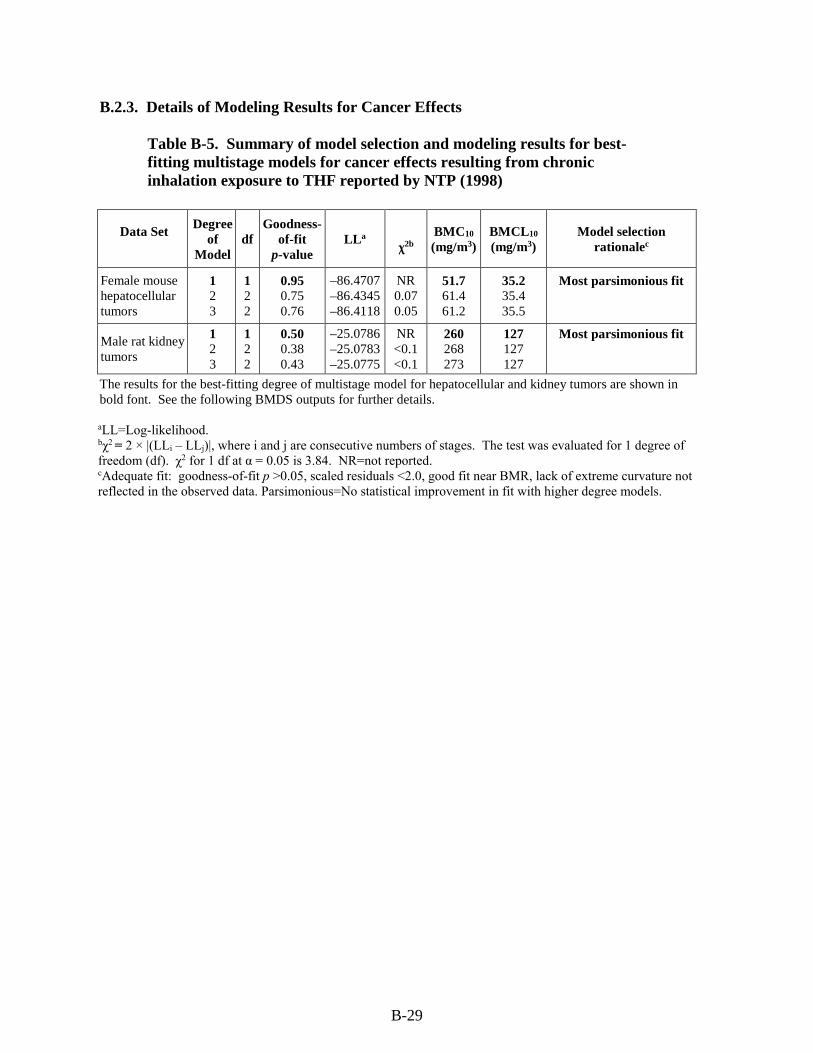
B-29
B.2.3. Details of Modeling Results for Cancer Effects
Table B-5. Summary of model selection and modeling results for best-fitting multistage models for cancer effects resulting from chronic inhalation exposure to THF reported by NTP (1998)
Data Set Degree
of Model
df Goodness-
of-fit p-value
LLa
χ2b BMC10 (mg/m3)
BMCL10 (mg/m3)
Model selection rationalec
Female mouse hepatocellular tumors
1 2 3
1 2 2
0.95 0.75 0.76
–86.4707–86.4345–86.4118
NR 0.07 0.05
51.7 61.4 61.2
35.2 35.4 35.5
Most parsimonious fit
Male rat kidney tumors
1 2 3
1 2 2
0.50 0.38 0.43
–25.0786–25.0783–25.0775
NR <0.1 <0.1
260 268 273
127 127 127
Most parsimonious fit
The results for the best-fitting degree of multistage model for hepatocellular and kidney tumors are shown in bold font. See the following BMDS outputs for further details.
aLL=Log-likelihood. bχ2 = 2 × |(LLi – LLj)|, where i and j are consecutive numbers of stages. The test was evaluated for 1 degree of freedom (df). χ2 for 1 df at α = 0.05 is 3.84. NR=not reported. cAdequate fit: goodness-of-fit p >0.05, scaled residuals <2.0, good fit near BMR, lack of extreme curvature not reflected in the observed data. Parsimonious=No statistical improvement in fit with higher degree models.
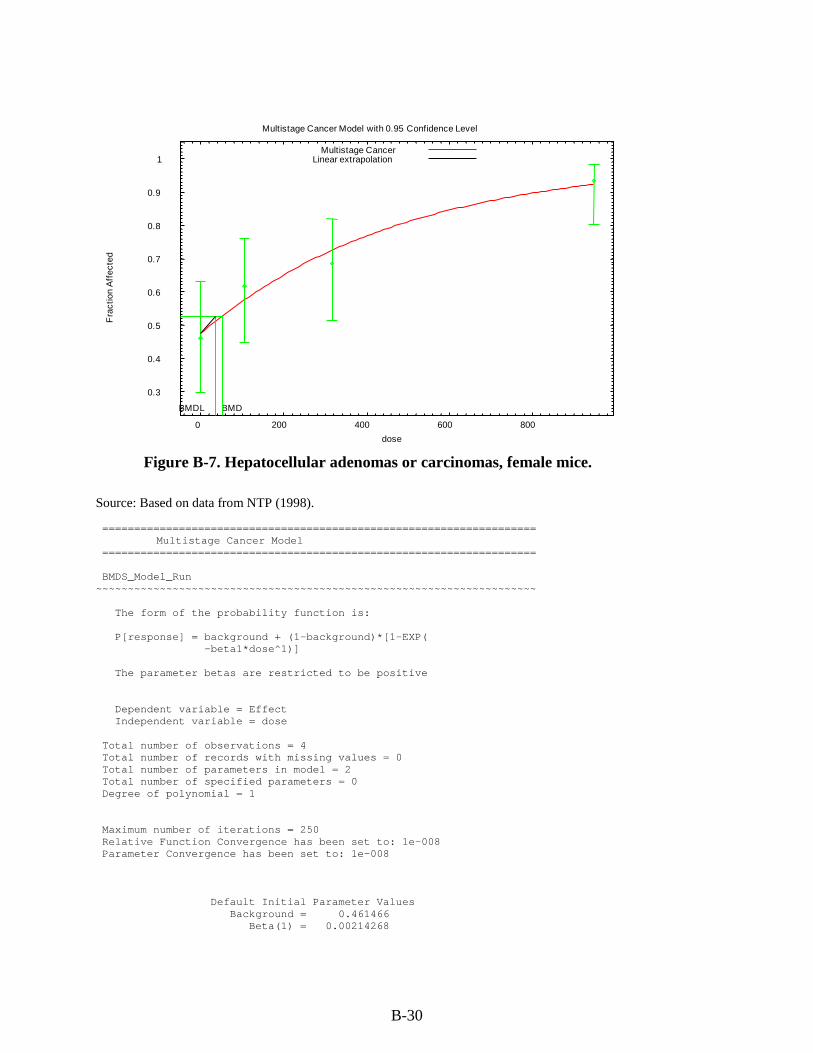
B-30
Figure B-7. Hepatocellular adenomas or carcinomas, female mice.
0.3
0.4
0.5
0.6
0.7
0.8
0.9
1
0 200 400 600 800
Fra
ctio
n A
ffec
ted
dose
Multistage Cancer Model with 0.95 Confidence Level
BMDBMDL
Multistage CancerLinear extrapolation
Source: Based on data from NTP (1998). ==================================================================== Multistage Cancer Model ==================================================================== BMDS_Model_Run ~~~~~~~~~~~~~~~~~~~~~~~~~~~~~~~~~~~~~~~~~~~~~~~~~~~~~~~~~~~~~~~~~~~~~ The form of the probability function is: P[response] = background + (1-background)*[1-EXP( -beta1*dose^1)] The parameter betas are restricted to be positive Dependent variable = Effect Independent variable = dose Total number of observations = 4 Total number of records with missing values = 0 Total number of parameters in model = 2 Total number of specified parameters = 0 Degree of polynomial = 1 Maximum number of iterations = 250 Relative Function Convergence has been set to: 1e-008 Parameter Convergence has been set to: 1e-008 Default Initial Parameter Values Background = 0.461466 Beta(1) = 0.00214268
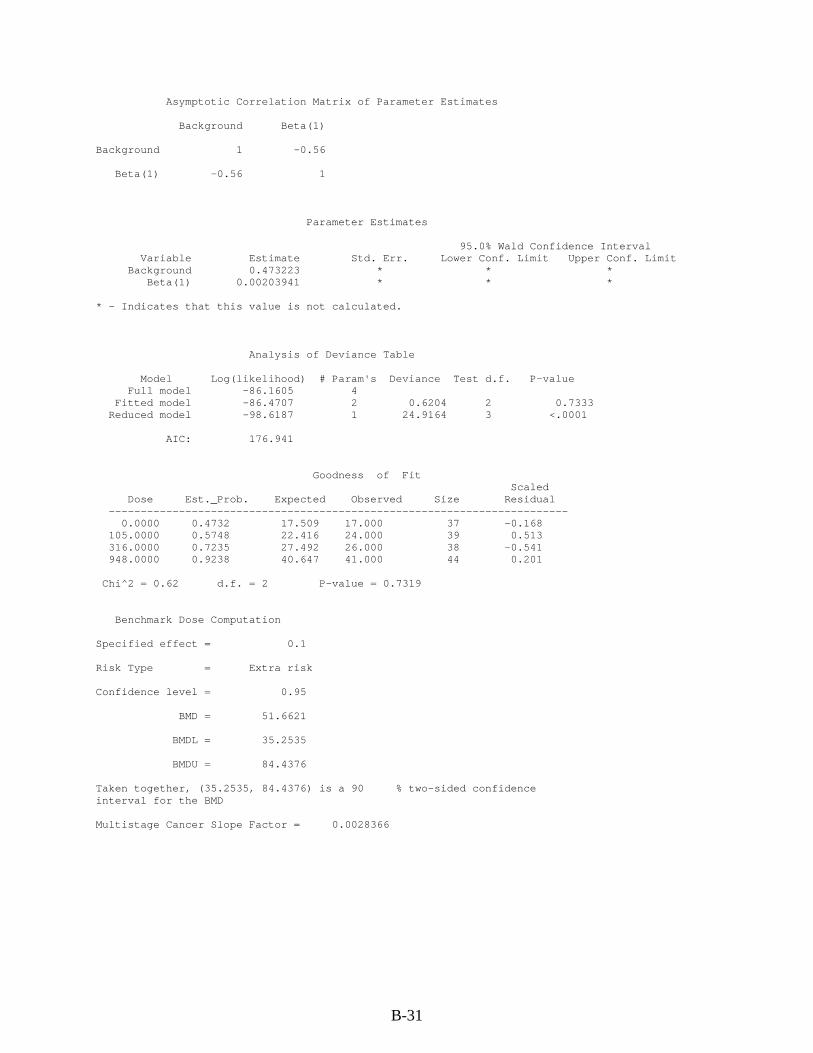
B-31
Asymptotic Correlation Matrix of Parameter Estimates
Background Beta(1)
Background 1 -0.56
Beta(1) -0.56 1
Parameter Estimates
95.0% Wald Confidence Interval Variable Estimate Std. Err. Lower Conf. Limit Upper Conf. Limit Background 0.473223 * * * Beta(1) 0.00203941 * * *
* - Indicates that this value is not calculated.
Analysis of Deviance Table
Model Log(likelihood) # Param's Deviance Test d.f. P-value Full model -86.1605 4 Fitted model -86.4707 2 0.6204 2 0.7333 Reduced model -98.6187 1 24.9164 3 <.0001
AIC: 176.941
Goodness of Fit Scaled
Dose Est._Prob. Expected Observed Size Residual ------------------------------------------------------------------------ 0.0000 0.4732 17.509 17.000 37 -0.168 105.0000 0.5748 22.416 24.000 39 0.513 316.0000 0.7235 27.492 26.000 38 -0.541 948.0000 0.9238 40.647 41.000 44 0.201
Chi^2 = 0.62 d.f. = 2 P-value = 0.7319
Benchmark Dose Computation
Specified effect = 0.1
Risk Type = Extra risk
Confidence level = 0.95
BMD = 51.6621
BMDL = 35.2535
BMDU = 84.4376
Taken together, (35.2535, 84.4376) is a 90 % two-sided confidence interval for the BMD
Multistage Cancer Slope Factor = 0.0028366
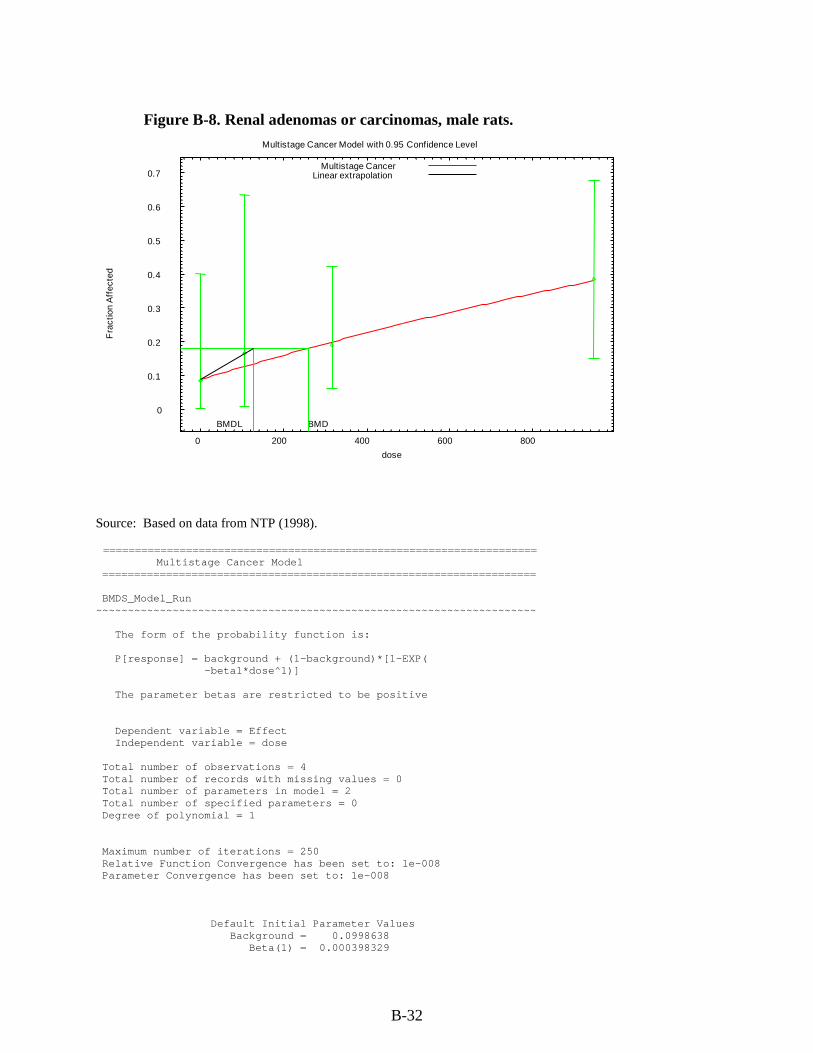
B-32
Figure B-8. Renal adenomas or carcinomas, male rats.
0
0.1
0.2
0.3
0.4
0.5
0.6
0.7
0 200 400 600 800
Fra
ctio
n A
ffec
ted
dose
Multistage Cancer Model with 0.95 Confidence Level
BMDBMDL
Multistage CancerLinear extrapolation
Source: Based on data from NTP (1998). ==================================================================== Multistage Cancer Model ==================================================================== BMDS_Model_Run ~~~~~~~~~~~~~~~~~~~~~~~~~~~~~~~~~~~~~~~~~~~~~~~~~~~~~~~~~~~~~~~~~~~~~ The form of the probability function is: P[response] = background + (1-background)*[1-EXP( -beta1*dose^1)] The parameter betas are restricted to be positive Dependent variable = Effect Independent variable = dose Total number of observations = 4 Total number of records with missing values = 0 Total number of parameters in model = 2 Total number of specified parameters = 0 Degree of polynomial = 1 Maximum number of iterations = 250 Relative Function Convergence has been set to: 1e-008 Parameter Convergence has been set to: 1e-008 Default Initial Parameter Values Background = 0.0998638 Beta(1) = 0.000398329
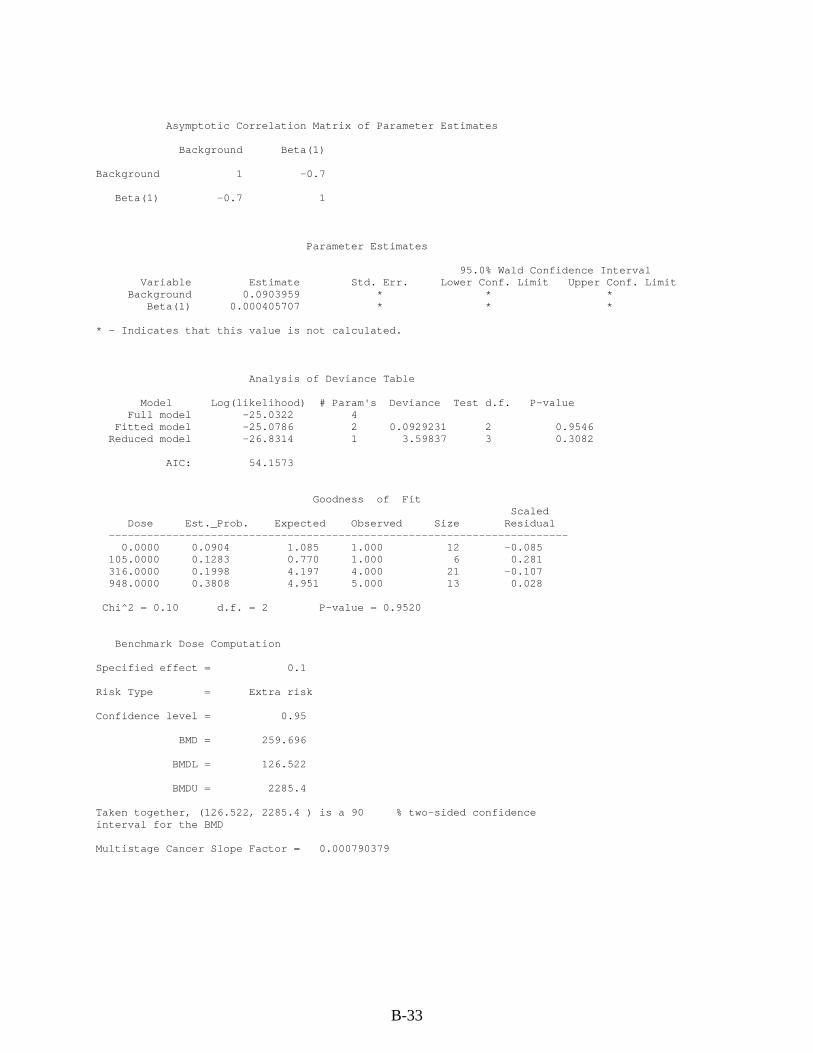
B-33
Asymptotic Correlation Matrix of Parameter Estimates Background Beta(1) Background 1 -0.7 Beta(1) -0.7 1 Parameter Estimates 95.0% Wald Confidence Interval Variable Estimate Std. Err. Lower Conf. Limit Upper Conf. Limit Background 0.0903959 * * * Beta(1) 0.000405707 * * * * - Indicates that this value is not calculated. Analysis of Deviance Table Model Log(likelihood) # Param's Deviance Test d.f. P-value Full model -25.0322 4 Fitted model -25.0786 2 0.0929231 2 0.9546 Reduced model -26.8314 1 3.59837 3 0.3082 AIC: 54.1573 Goodness of Fit Scaled Dose Est._Prob. Expected Observed Size Residual ------------------------------------------------------------------------ 0.0000 0.0904 1.085 1.000 12 -0.085 105.0000 0.1283 0.770 1.000 6 0.281 316.0000 0.1998 4.197 4.000 21 -0.107 948.0000 0.3808 4.951 5.000 13 0.028 Chi^2 = 0.10 d.f. = 2 P-value = 0.9520 Benchmark Dose Computation Specified effect = 0.1 Risk Type = Extra risk Confidence level = 0.95 BMD = 259.696 BMDL = 126.522 BMDU = 2285.4 Taken together, (126.522, 2285.4 ) is a 90 % two-sided confidence interval for the BMD Multistage Cancer Slope Factor = 0.000790379
C-1
APPENDIX C. SUPPLEMENTAL INFORMATION
C.1. OTHER DURATION- OR ENDPOINT-SPECIFIC STUDIES
C.1.1. Acute Toxicity Studies
Oral.
Hofmann and Oettel (1954) examined the effects of THF following oral exposure. Cats
(13), rabbits (12), and rats (62, strain and sex not specified) received oral doses (route not
specified) ranging from a single administration of 3 cm3/kg (2,670 mg/kg) to 25 administrations
of 1 cm3/kg (890 mg/kg). The authors reported that no functional or histopathological damage to
the liver was observed. Also, no changes were observed in urine analysis, serum urea content, or
histopathology of the kidney.
Stasenkova and Kochetkova (1963) evaluated the acute toxicity of THF administered by
gavage. White rats (10/group, sex and strain not specified) received THF doses of 1, 1.5, 2, 3, 4,
or 5 g/kg by gavage as a solution in 2 mL of distilled water. The rats received a total of six
doses, and were observed for clinical signs and mortality. Necropsy and histopathology of major
organs was conducted in animals that died during the study exposure period. It does not appear
that histopathology was performed on the animals that survived exposure. No mortality was
observed at a dose of 2 g/kg. However, a dose of 3 g/kg resulted in 20% mortality, and doses of
4–5 g/kg resulted in 90–100% mortality, respectively. Clinical signs of sedation, including
immobility, drowsiness, reduced response to external stimuli, and reduced respiratory rate, were
observed after 3–9 minutes of exposure. Mucous membranes appeared to have a cyanotic
discoloration. Histopathological lesions were observed in the stomach, brain, liver, heart, spleen,
and kidneys and included necrosis, edema, hemorrhage, and excess of blood or fluid in the blood
vessels or tissues.
Kimura et al. (1971) investigated the acute oral toxicity of THF in male Sprague Dawley
rats (6–12/group). The median lethal dose (LD50) values were estimated for four ages of rats:
newborns (24–48 hours old), 14 days old, young adult (80–160 g), and older adult (300–470 g).
Single doses of THF (doses unspecified) were administered by gavage; a microsyringe was used
for the newborn animals. The oral LD50 values for THF were estimated at 2.3 mL/kg for 14-day-
old rats, 3.6 mL/kg for young adult rats, and 3.2 mL/kg for older adult rats. The LD50 values for
the young animals were not statistically different from the values for the older adult rats.
Inhalation.
Stoughton and Robbins (1936) tested the effects of acute inhalation exposure to THF in
both mice and dogs. Mice (10/group, strain and sex not specified) were exposed to THF
concentrations of 0, 0.5, 1.0, 1.5, 2.2, or 3.0 mmol/L (0, 36,050, 72,100, 108,150, 158,620, or
C-2
216,300 mg/m3) for a single 2-hour exposure. The parameters evaluated included the time
required for onset of anesthesia and the time to respiratory failure or death. At the end of the
2-hour exposure, the animals still alive were observed until recovery or death. THF
concentrations of 2.2 mmol/L were 100% fatal; at these concentrations, time to onset of
anesthesia was 5–8 minutes and time to death was 30–51 minutes. The 1.0 mmol/L dose of THF
resulted in 50% mortality, with time to anesthesia of 50 minutes and time to death of
109 minutes. No mortality was observed at a THF concentration of 0.5 mmol/L. Animals
surviving at the end of the exposure period regained the ability to walk in 6–8 hours following
exposure to THF. One dog (strain and sex not specified) was anesthetized with THF and
maintained for 1.5 hours at a THF atmospheric concentration of 5–6%. During this exposure,
electroencephalogram (EEG), respiration, and blood pressure were measured. Two days
following exposure, the dog was sacrificed and autopsied. Symptoms observed in the dog
included increased saliva and mucus flow, decrease in blood pressure, stimulation of respiration,
and prolonged sleep up to 6–8 hours after exposure stopped. No gross abnormalities were
observed on autopsy.
Henderson and Smith (1936) exposed six rats (strain and sex not specified) to increasing
concentrations of THF vapor for 1 hour. The exact concentrations of THF vapor used were not
reported, but the authors noted that anesthesia occurred at 6.47% THF. Two animals exposed to
just the anesthetic concentration for 30 minutes recovered within 2 minutes after exposure. Two
rats that died within 24 hours of exposure had congested, mottled lungs. One rat that initially
recovered but appeared ill 4 days later showed fatty changes in the liver.
Hofmann and Oettel (1954) examined the effects of acute inhalation exposure to THF in
18 cats, 20 rabbits, 52 rats, and 150 mice. The sex and strain of the animals were not specified.
Animals were exposed to THF vapors at concentrations ranging from 3,400–60,000 cm3/m3
(equivalent concentrations reported by the authors were 10,000–193,000 mg/m3). Exposure
regimens ranged from one 2-hour exposure to 30 6-hour exposures. No additional information
was provided on exposure durations and concentrations. Therefore, it is not possible to estimate
adjusted exposure concentrations. Liver function was assessed by using a bromosulfalein test
(decreased clearance of bromosulfalein from the blood is indicative of liver dysfunction).
Kidney function was also assessed by urinalysis and serum urea content. Blood cell count was
evaluated. Both the liver and kidney were evaluated histopathologically. The authors reported a
slight, transient retention of bromosulfalein immediately following exposure to narcotic
concentrations of THF.
LaBelle and Brieger (1955) evaluated the effects of acute THF inhalation exposure in rats
and mice. Groups of eight male albino rats were exposed to a fixed concentration of THF for a
single 4-hour exposure period. Those animals surviving were observed for 14 days. The range
C-3
of concentrations tested was not specified. This procedure was repeated until the median lethal
concentration (LC50) could be determined. In addition, groups of white mice (6/group, sex not
specified) were exposed continuously to saturated THF vapor (approximately 47,000 ppm or
138,650 mg/m3), and survival time was recorded. For mice, the mean survival time following
exposure to saturated vapor was 41 minutes. In rats, the LC50 reported by the authors was
18,000 ppm (53,100 mg/m3). Narcosis was reported in rats prior to death.
Stasenkova and Kochetkova (1963) evaluated the effects of a single 2-hour inhalation
exposure to THF in white mice and rats (10/group, sex and strain not specified). THF vapor was
generated by allowing it to evaporate from a filter paper, so constant air concentrations were not
maintained for the duration of the exposure period. For example, at the highest target
concentration of 180 mg/L, air concentrations in the test chamber were reported as 140 mg/L
after 15 minutes and 65 mg/L after 2 hours. Based on the average of the measurements at
15 minutes and 2 hours, actual mean exposure concentrations were 0, 7, 13, 19, 27, 42, 73, 80,
and 103 mg/L (0, 7,000, 13,000, 19,000, 27,000, 42,000, 73,000, 80,000, and 103,000 mg/m3).
Animals were evaluated for clinical signs and mortality. Histopathological examination was
conducted on animals that died. The authors did not indicate whether histopathological
examinations were conducted on the animals that survived exposure. In mice, the average
concentration of 19 mg/L resulted in 80% mortality, and 27 mg/L resulted in 100% mortality.
Rats were less sensitive to THF. The average concentration of 42 mg/L resulted in 20%
mortality, and 80 mg/L resulted in 100% mortality. The animals displayed symptoms of sedation
and narcosis, including depressed activity, interrupted breathing, and reduced coordination of
movement. In addition, mucus membranes were pale and bluish in color. Lesions observed in
lungs and bronchi included excess blood or fluid, edema, perivascular hemorrhage, and catarrhal
condition of the mucus membrane. Histopathological lesions were also observed in brain, liver,
kidney, and spleen, including excess blood or fluid, edema, and dystrophic changes.
DuPont Haskell Laboratory (1979) conducted an acute inhalation study of THF in order
to determine the highest concentration of THF that would not produce narcosis in rats. ChR-CD
rats (6/sex/group) were exposed to THF concentrations, ranging from 3,010–20,500 ppm (8,880–
60,475 mg/m3) for a single 6-hour exposure period. Following exposure, all rats were weighed
daily and clinical signs were observed for 14 days. The authors determined that the non-narcotic
concentration in male rats was 5,380 ppm (15,871 mg/m3) and in female rats was 5,700 ppm
(16,815 mg/m3). During the exposure period, both male and female rats demonstrated clinical
signs of pawing and scratching and decreased or no response to sound at all concentrations.
Male rats also exhibited signs of rapid respiration, and females showed signs of paralysis. Based
on clinical signs of CNS toxicity, the lowest exposure concentration of 8,880 mg/m3 was the
study LOAEL.
C-4
Ohashi et al. (1983) evaluated the effects of acute inhalation exposure to THF on the
upper respiratory tract (nasal mucosa) of rabbits. Adult rabbits (sex and number not specified)
were exposed to THF concentrations of 100, 250, 1,000, 2,000, 6,000, or 12,000 ppm (295, 738,
2,950, 5,900, 17,770, or 35,400 mg/m3) for a single 4-hour exposure period. The rabbits were
sacrificed by air embolization, and their nasal mucus membranes were obtained at 0, 20, 40, 60,
120, or 180 minutes following exposure. The membranes were evaluated for ciliary beating
frequency and examined by scanning electron microscopy. No other organs or systems were
evaluated. THF caused a dose-related decrease in ciliary beating frequency. Concentrations of
250 ppm caused about a 50% decrease in beat frequency that returned to normal within 3 hours
following exposure. Concentrations of 1,000 ppm almost completely eliminated ciliary beating,
and at these concentrations beat activity did not return to normal. THF concentrations of
250 ppm resulted in the appearance of sporadic compound cilia, but no other morphological
changes. Concentrations of 1,000, 2,000, and 6,000 ppm resulted in the increased incidence of
compound cilia and the vacuolation of epithelial cells, indicating moderate degeneration. At
12,000 ppm THF, observations included many large compound cilia, vacuolation, cytoplasmic
protuberances, and sloughing of the epithelial cells, indicating severe degeneration. Based on
significant morphological changes to nasal epithelial cells, 1,000 ppm (2,950 mg/m3) was the
study LOAEL and 250 ppm (738 mg/m3) was the study NOAEL.
Horiguchi et al. (1984) evaluated the acute toxicity of THF following inhalation exposure
in rats. Sprague-Dawley rats (6 males/group) received a single 3-hour exposure to THF at
concentrations of 200, 1,000, 5,000, 10,000, 15,000, 25,000, or 30,000 ppm (590, 2,950, 14,750,
29,500, 44,250, 73,750, or 88,500 mg/m3). The animals were observed for clinical signs of
toxicity, abnormal behavior, and mortality for 72 hours following exposure. The LC50 value was
estimated to be 21,000 ppm (61,950 mg/m3) by using a probit method. Animals in the 200 ppm
group displayed signs of head shaking and face washing, as well as patches of mild irritation on
nose, ears, and eyelids, and tended to sleep. Symptoms of irritation increased with the exposure
concentration. At 5,000 ppm, animals displayed intense salivation, tearing, and bleeding from
the nose. In addition, animals developed clonic muscle spasms, had altered respiratory patterns,
and became comatose about 1 hour following the start of exposure. All animals in the
25,000 ppm group died within 72 hours following exposure. No information was provided
regarding the observations in other dose groups. Based on clinical signs of irritation and
neurotoxicity, the concentration of 5,000 ppm (14,750 mg/m3) was the LOAEL in this study.
Ikeoka et al. (1988) investigated the effects of acute inhalation exposure to THF on the
lower respiratory tract (tracheal mucosa) of rabbits as a follow-up to the earlier study by Ohashi
et al. (1983). Adult rabbits (sex and number not specified) were exposed to THF at
concentrations of 100, 250, 1,000, 2,000, 6,000, or 12,000 ppm (295, 738, 2,950, 5,900, 17,770,
C-5
or 35,400 mg/m3) for a single 4-hour exposure period. The authors did not state if a control
group was also included. The rabbits were sacrificed by air embolization, and their tracheal
mucosa membranes were obtained at 0, 20, 40, 60, 120, or 180 minutes following exposure. The
membranes were evaluated for ciliary beating frequency and examined by scanning electron
microscopy. No other organs or systems were evaluated. THF caused a dose-related decrease in
ciliary beating frequency. Concentrations of 250 ppm caused about a 50% decrease in beat
frequency that returned to normal within 3 hours following exposure. Concentrations of
1,000 ppm almost completely eliminated ciliary beating, and at these concentrations beat activity
did not return to normal within 3 hours. Compound cilia, ballooning, and vacuolation of tracheal
epithelial cells were observed in the high-concentration group. However, the areas of severe
degeneration observed in the nasal epithelium following the same exposure protocol were not
observed in the trachea in the current study. The effects on the tracheal morphology were mild
compared with those observed in nasal epithelium by Ohashi et al. (1983). Based on tracheal
histopathology, 12,000 ppm (35,400 mg/m3) was the study LOAEL and 6,000 ppm
(17,770 mg/m3) was the study NOAEL.
Dermal.
Stasenkova and Kochetkova (1963) evaluated the effects of THF application to the skin
of white mice (20, strain and sex not specified) and rabbits (number, sex, and strain not
specified). Pure THF (1 mL) was applied to the skin of rabbits. THF caused reddening of the
skin, which subsequently thickened and sloughed off. Pure THF applied to the eyes of rabbits
caused edema of the eyelid, vasodilation, and corneal opacity. The tails of mice were immersed
in pure THF for 2 hours. This treatment resulted in mortality, symptoms typical of THF
poisoning, as well as excess blood or fluid and hemorrhage of internal organs.
C.1.2. Short-term Studies
Oral.
Komsta et al. (1988) reported the results of a short-term oral toxicity study of THF in
rats. Sprague-Dawley rats (10/sex/group) were administered THF in drinking water at
concentrations of 0, 1, 10, 100, or 1,000 mg/L for 4 weeks. The equivalent doses estimated by
the study authors based on measured water consumption and body weights were 0, 0.1, 0.8, 10.2,
and 95.5 mg/kg-day. Clinical signs, body weight gain, and food and water consumption were
evaluated weekly. Following the exposure period, the animals were sacrificed and examined at
gross necropsy. Organ weights were obtained for brain, heart, liver, spleen, and kidney. Blood
was collected for hematology and serum chemistry evaluation. A selection of tissues from the
control and high-dose group was evaluated histopathologically.
C-6
There was no increase in mortality in any of the dose groups, and no clinical signs were
observed in any of the treated animals. In addition, body weight gain and food and water
consumption were not significantly different between treated and control animals. No changes in
hematology or serum chemistry were observed in treated animals. Some sporadic observations
of histopathological changes were observed in the thyroid, liver, and kidney; however, the
incidence for these findings was comparable in treated and control animals. Male rats in the
high-dose group demonstrated a higher incidence of increased cytoplasmic homogeneity in liver
compared with controls (3/10 and 7/10 for control and high-dose animals, respectively). No
changes in any of the biochemical parameters evaluated were observed. Female rats showed an
increased incidence of anisokaryosis (unequal size of cell nuclei) in the liver (0/10 and 7/10 for
control and high-dose animals, respectively) and tubular cytoplasmic inclusions in the kidney
(0/10 and 3/10 for control and high-dose animals, respectively). The authors did not conduct a
statistical analysis of the incidence data. In addition, histopathology was not performed on the
lower dose groups, so it is not possible to evaluate the dose-response relationship for these
endpoints. The study authors concluded that THF in drinking water at doses up to 1,000 mg/L
did not produce overt toxicity. Komsta et al. (1988) also indicated that the effects observed at
the high dose of THF were considered mild and adaptive and could not be related to any
functional changes (i.e., altered biochemical parameters).
Pozdnyakova (1965) evaluated the effects of short-term exposure to THF in drinking
water. White mice (number, sex, and strain not specified) received THF in the drinking water at
concentrations of 40 and 100 mg/L for 45 days. Mice in the high-dose group exhibited
decreased body weight, paralysis of hind legs, leukocytosis, and decreased hemoglobin. No
significant changes were observed in the low-dose group. No additional information was
provided about the study.
In the same study report, Pozdnyakova (1965) exposed 20 rabbits (sex and strain not
specified) and 50 white rats (sex and strain not specified) to THF in drinking water at doses of
10 and 20 mg/kg. The study was classified as being chronic in duration by the study authors;
however, the actual duration of exposure was not specified. Rabbits in the high-dose group
exhibited a change in cholinesterase activity, an increase in prothrombin time, and a low serum
antibody titer compared with controls. Rats in the high-dose group showed a reduction in body
weight and a change in serum albumin content. No additional information was provided in the
study.
Inhalation.
Horiguchi et al. (1984) evaluated the ability of THF to irritate the respiratory tract
following short-term inhalation exposure to THF. Male Sprague-Dawley rats (3–6/group) were
C-7
exposed to 0, 100, or 5,000 ppm (0, 295, or 14,750 mg/m3) THF vapor for up to 3 weeks. No
information was provided on the duration of each exposure period or the number of days/week
the animals were exposed, and therefore duration-adjusted exposure concentrations could not be
calculated. A single animal was randomly selected from each exposure group 1 day, 1 week, and
3 weeks following the start of exposure. The animals were sacrificed the next day (24 hours
later) and the respiratory tract mucous membrane was extracted and prepared for histological
examination. No differences were observed between the tracheal mucosa of the treated groups
and the controls following 1 day or 1 week of exposure. By 3 weeks of exposure, the tracheal
mucosa of animals in the high-concentration group exhibited disordered cilia and epithelial cells
and darkening of cell bodies compared with control animals. Also, by 3 weeks of exposure, the
nasal mucosa of animals in the low-concentration group (100 ppm) exhibited the same type of
changes described above for the tracheal mucosa (e.g., disordered cilia and epithelial cells and
darkening of cell bodies) without significant histopathological effects. The nasal mucosa of
animals exposed to 5,000 ppm for either 1 week or 3 weeks, however, demonstrated disruption
of the epithelial architecture, congestion, and sloughing of ciliary and goblet cells, in addition to
vacuolation and darkening of cell bodies. Based on these effects at the nasal mucosa, the study
LOAEL was determined to be 5,000 ppm and the study NOAEL was 100 ppm.
Stasenkova and Kochetkova (1963) evaluated the short-term effects of THF inhalation in
male rats and mice (20/group; strain not specified). The animals were exposed for 2-hour
periods, twice a day, every day for 2 months to air concentrations of THF ranging from 6 to
8 mg/L (6,000–8,000 mg/m3). However, THF vapor was generated by allowing it to evaporate
from a filter paper, so constant air concentrations were not maintained for the duration of each
exposure period. Animals were evaluated for clinical signs, mortality, and body weight.
Endpoints evaluated included the threshold of neuromuscular irritability (method of
measurement was not specified), arterial blood pressure, blood cell counts, liver function
(measured by synthetic capacity), and kidney function (measured by albumin in urine). After
2 months, the animals were sacrificed and histopathological examination of major organs was
conducted.
All animals developed symptoms of narcosis during the exposure; however, this effect
was not observed during the periods between exposures. By day 40 of exposure, treated rats had
reduced body weight compared with controls. At the end of the 2-month study period, mean
body weights of treated rats was 30% less than controls. In addition, treated rats had a lower
threshold of neuromuscular irritability than controls. No effects in rats were observed on blood
pressure, blood cell count, or liver or kidney function. Histopathological lesions in the
respiratory tract included catarrhal rhinitis, bronchitis, proliferative reaction in lungs,
emphysema, and hypertrophy of muscle fibers in the walls of the bronchi. Histopathological
C-8
lesions, including hypertrophy of muscle fibers and perivascular sclerosis, were observed in the
heart, liver, and kidneys. Incidence data were not provided for any of these histopathological
findings.
Treated mice initially developed symptoms of eye and respiratory tract irritation and had
an increase in the threshold of neuromuscular irritability compared with controls. After 1 month
of treatment, mortality in mice increased. The authors indicated that mice died of bronchial
pneumonia. It was not clear if mortality in controls was increased and if the bronchial
pneumonia was a cause of THF treatment or a bacterial infection in the mice. The mice still
living at the end of the 2-month treatment period had a 15–20% decrease in body weight
compared with controls. No information was provided on the results of other endpoints
evaluated in mice. Because of poor reporting of this study, no NOAEL−LOAEL was
determined.
C.1.3. Neurotoxicity Studies
DuPont Haskell Laboratory (1996a), published in the peer-reviewed literature as Malley
et al. (2001), investigated the neurotoxicity of acute inhalation exposure to THF in rats. Crl:CD
BR rats (12/sex/group) were exposed to THF vapor at concentrations of 0, 500, 2,500, or
5,000 ppm (0, 1,475, 7,375, or 14,750 mg/m3) for a single 6-hour exposure (designated as test
day 1). The animals were then observed for 2 weeks following exposure. Clinical signs, body
weight, and food consumption were evaluated weekly. The response to an alerting stimulus was
determined as a group for each exposure concentration, prior to the start of exposure and
approximately 2 and 4 hours after initiation of exposure. All rats were evaluated for
neurobehavioral effects. Motor activity assessments and functional observational battery (FOB)
assessments were conducted before exposure and on test days 2, 8, and 15. For the motor
activity assessments, animals were individually tested in an automated activity monitor that
measured both duration of continuous movements and number of movements. The FOB
assessment consisted of a series of quantified behavioral evaluations conducted in a sequence
that proceeded from the least interactive to the most interactive. During the FOB assessment,
each rat was evaluated in three environments: inside the home cage, on removal from the home
cage while being handled, and in a standard open field arena.
Exposure to 2,500 ppm THF appeared to have an effect on response to alerting stimulus
in rats. Six of 24 rats in the 2,500 ppm group had a diminished response after 2 hours of
exposure, and all 24 rats in this group had diminished response after 4 hours of exposure. Half
the rats in the 5,000 ppm group had diminished response after 2 hours of exposure, and all of the
rats had either no response or diminished response to stimulus after 4 hours of exposure. Other
signs of sedation in the high concentration group included a significant increase in the incidence
C-9
of lethargy and abnormal gait in both male and female rats at 5,000 ppm. Male rats in the
5,000 ppm group had significantly decreased body weight gain and food consumption in the
interval between test day 1 and 2, although these values were comparable to controls for the
remainder of the observation period. Several parameters in the FOB were affected in the 5,000
ppm groups immediately following the exposure period only, including the righting reflex in
males and females, palpebral closure in females, and ease of handling in females. The effects on
FOB parameters were not observed during test days 2, 8, or 15, suggesting that the sedative
effects of THF were short-lived. The LOAEL for this study is 2,500 ppm (7,375 mg/m3), based
on observations of sedative effects, and the NOAEL for this study was 500 ppm (1,475 mg/m3).
DuPont Haskell Laboratory (1996b; Malley et al., 2001) investigated neurotoxicity
following subchronic inhalation exposure to THF in rats. Crl:CD BR rats (12–18/sex/group)
were exposed to THF vapor at concentrations of 0, 500, 1,500, or 3,000 ppm (0, 1,475, 4,425, or
8,850 mg/m3) 6 hours/day, 5 days/week over a 13- to 14-week exposure period. Clinical signs,
body weight, and food consumption were evaluated weekly. Prior to the start of exposure and
approximately 2, 4, and 6 hours after initiation of exposure, the response to an alerting stimulus
was determined for the rats as a group for each exposure concentration. All rats were evaluated
for neurobehavioral effects. Motor activity assessments and FOB assessments were conducted
before the first exposure and at 4, 8, and 13 weeks. For the motor activity assessments, animals
were individually tested in an automated activity monitor that measured both duration of
continuous movements and number of movements. The FOB assessment consisted of a series of
quantified behavioral evaluations conducted in a sequence that proceeded from the least
interactive to the most interactive. During the FOB assessment, each rat was evaluated in three
environments: inside the home cage, after removal from the home cage while being handled,
and in a standard open field arena. Rats (6/sex/group) were sacrificed after 13 weeks of
exposure, and tissue from the nervous system and muscle was assessed histopathologically.
The only effects observed in this study appeared to be related to the acute sedative effects
of THF characterized by the study authors as acute behavioral sedation, which dissipates rapidly
upon termination of exposure (Malley et al., 2001). A diminished response to alerting stimulus
during exposure was observed in male and female rats in the 1,500 and 3,000 ppm exposure
groups. In the 3,000 ppm group, diminished response was observed consistently, beginning on
the second day of exposure. In the 1,500 ppm group, diminished response was observed
sporadically from days 16 to 49 of exposure and observed consistently on the remaining
exposure days. Diminished response was observed sporadically from days 16 to 49 of exposure
and observed consistently on the remaining exposure days. Compound-related clinical signs,
including stained nose and stained/wet perineum, were also observed in male and female rats in
the 1,500 and 3,000 ppm groups. These signs were not observed on Mondays prior to the start of
C-10
exposure for the week or on the days of the motor activity and FOB assessment. Therefore,
these signs were considered to be transient. No effects were observed on body weight, body
weight gain, food consumption, motor activity, any of the parameters in the FOB, or
neuropathology in either male or female rats at any concentration. Based on clinical signs of
sedation during exposure to THF, 1,500 ppm (4,425 mg/m3) was the study LOAEL, and the
NOAEL for this study was 500 ppm (1,475 mg/m3). However, the authors suggested that these
effects were transient.
Marcus et al. (1976) evaluated the neuropharmacological effects of THF administered by
i.p. injection. Male Sprague-Dawley rats (number/group not specified) were implanted with
electrodes to facilitate continuous EEG recordings. THF was administered by i.p. injection at
doses of 15 and 21 mmol/kg (1,156 and 1,619 mg/kg). After a 2-minute latency period,
21 mmol/kg THF induced high amplitude slow wave activity in the EEG, which lasted
2 minutes. The EEG pattern then changed to spiking and electrical silence, which lasted for
20 minutes. The altered EEG pattern was accompanied by loss of the righting reflex. A dose of
15 mmol/kg induced a desynchronization of the EEG activity without loss of the righting reflex.
In an in vitro study, THF caused a decrease in adenosine triphosphatase (ATPase) activity
and membrane fluidity in a dose-dependent manner in an assay using rat brain synaptosomes
(Edelfors and Ravn-Jonsen, 1992).
C.2. METABOLITE AND MECHANISTIC DATA AND OTHER STUDIES
C.2.1. Metabolite Studies
The nervous system is one of the primary targets of THF toxicity. As discussed under
Metabolism (Section 3.3), the effects of THF on the nervous system may be due to its
metabolites, GBL and GHB. Major study findings of these compounds are briefly summarized
(Table C-1) to facilitate an evaluation of THF toxicity data, but a more detailed review is
available (NSF, 2003).
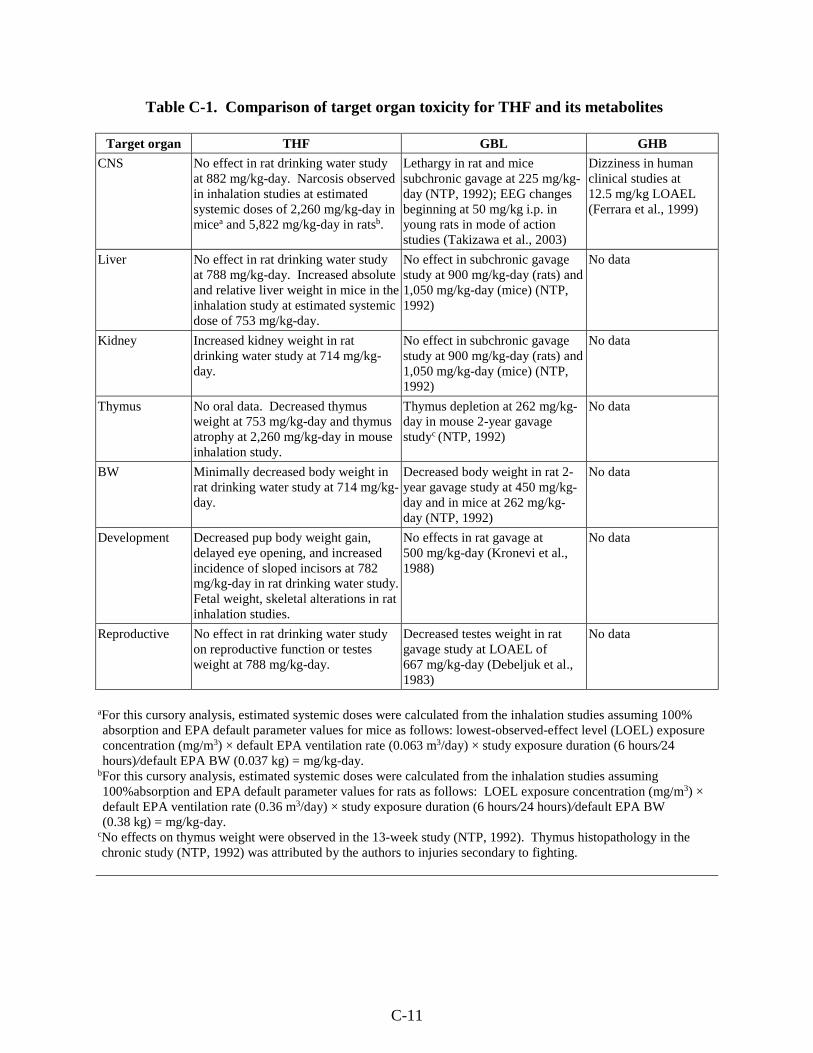
C-11
Table C-1. Comparison of target organ toxicity for THF and its metabolites
Target organ THF GBL GHB
CNS No effect in rat drinking water study at 882 mg/kg-day. Narcosis observed in inhalation studies at estimated systemic doses of 2,260 mg/kg-day in micea and 5,822 mg/kg-day in ratsb.
Lethargy in rat and mice subchronic gavage at 225 mg/kg-day (NTP, 1992); EEG changes beginning at 50 mg/kg i.p. in young rats in mode of action studies (Takizawa et al., 2003)
Dizziness in human clinical studies at 12.5 mg/kg LOAEL (Ferrara et al., 1999)
Liver No effect in rat drinking water study at 788 mg/kg-day. Increased absolute and relative liver weight in mice in the inhalation study at estimated systemic dose of 753 mg/kg-day.
No effect in subchronic gavage study at 900 mg/kg-day (rats) and 1,050 mg/kg-day (mice) (NTP, 1992)
No data
Kidney Increased kidney weight in rat drinking water study at 714 mg/kg-day.
No effect in subchronic gavage study at 900 mg/kg-day (rats) and 1,050 mg/kg-day (mice) (NTP, 1992)
No data
Thymus No oral data. Decreased thymus weight at 753 mg/kg-day and thymus atrophy at 2,260 mg/kg-day in mouse inhalation study.
Thymus depletion at 262 mg/kg-day in mouse 2-year gavage studyc (NTP, 1992)
No data
BW Minimally decreased body weight in rat drinking water study at 714 mg/kg-day.
Decreased body weight in rat 2-year gavage study at 450 mg/kg-day and in mice at 262 mg/kg-day (NTP, 1992)
No data
Development Decreased pup body weight gain, delayed eye opening, and increased incidence of sloped incisors at 782 mg/kg-day in rat drinking water study. Fetal weight, skeletal alterations in rat inhalation studies.
No effects in rat gavage at 500 mg/kg-day (Kronevi et al., 1988)
No data
Reproductive No effect in rat drinking water study on reproductive function or testes weight at 788 mg/kg-day.
Decreased testes weight in rat gavage study at LOAEL of 667 mg/kg-day (Debeljuk et al., 1983)
No data
aFor this cursory analysis, estimated systemic doses were calculated from the inhalation studies assuming 100% absorption and EPA default parameter values for mice as follows: lowest-observed-effect level (LOEL) exposure concentration (mg/m3) × default EPA ventilation rate (0.063 m3/day) × study exposure duration (6 hours/24 hours)/default EPA BW (0.037 kg) = mg/kg-day.
bFor this cursory analysis, estimated systemic doses were calculated from the inhalation studies assuming 100%absorption and EPA default parameter values for rats as follows: LOEL exposure concentration (mg/m3) × default EPA ventilation rate (0.36 m3/day) × study exposure duration (6 hours/24 hours)/default EPA BW (0.38 kg) = mg/kg-day.
cNo effects on thymus weight were observed in the 13-week study (NTP, 1992). Thymus histopathology in the chronic study (NTP, 1992) was attributed by the authors to injuries secondary to fighting.
C-12
There is no specific organ toxicity information following repeated human exposure to
GBL; however, chronic use of GBL as a drug of abuse can lead to neurotoxicity, including
addiction, anxiety, depression, insomnia, and tremors (Herold and Sneed, 2002). The systemic
toxicity of GBL has been investigated in a full 2-year bioassay in rats and mice that employed
gavage dosing (NTP, 1992). The most sensitive effect observed in these studies was clinical
signs of CNS toxicity (lethargy) with a NOAEL of 112 mg/kg-day in rats. The only other
treatment-related effect observed in rats and mice was for decreased body weight. NTP (1992)
also reported a statistically significant increase in the incidences of thymic depletion and
epithelial hyperplasia of the thymus in the mid- and high-dose male mice (0/42, 5/39, and 6/38
and 0/42, 4/39, and 4/38, respectively). The study authors concluded that the observed dose-
related increase in these non-neoplastic lesions was related to fighting in the male mice.
Specifically, the depletion of lymphocytes in the thymus (often seen with debilitation and stress
in animals) was most often observed in mice dying early as a result of wounds received from
fighting. The relevance of the observed effects on the thymus remains uncertain.
In other studies on GBL, no prenatal developmental effects were observed in rats at doses
up to 500 mg/kg-day (Kronevi et al., 1988), while decreased testicular weight was reported in a
short-term reproductive study (Debeljuk et al., 1983) with a LOAEL of 667 mg/kg-day.
The oral toxicity data for GHB are primarily from clinical studies in human subjects or
from case reports of oral poisonings. Transient dizziness and a sense of dullness in 50% of
human subjects following a single oral dose of 12.5 mg/kg were observed by Ferrara et al.
(1999). Standardized measure of psychomotor performance was not affected at this dose
(Ferrara et al., 1999). Metcalf et al. (1966) reported the effects of single oral doses of 35–
63 mg/kg GHB in volunteers. All participants reported drowsiness during the experiment and
some participants receiving doses >50 mg/kg were rendered unconscious. Medical anesthetic
doses of GHB are typically in the range of 60 mg/kg (Miotto et al., 2001; Vickers, 1969; Root,
1965).
In the case of GHB, the dosing regimen seems to play an important role on the induction
of CNS effects. The human clinical studies make it clear that for the CNS effects of GHB, bolus
dosing regimens have an important effect. For example, as shown in Table C-2, large
differences in total daily dose did not show a significant change in overall response rate and
severity when the individual doses were similar (Gallimberti et al., 1993, 1992). Furthermore,
the incidence of effects and their severity generally corresponds to the individual doses rather
than the total daily dose (Nimmerrichter et al., 2002; Gallimberti et al., 1993).
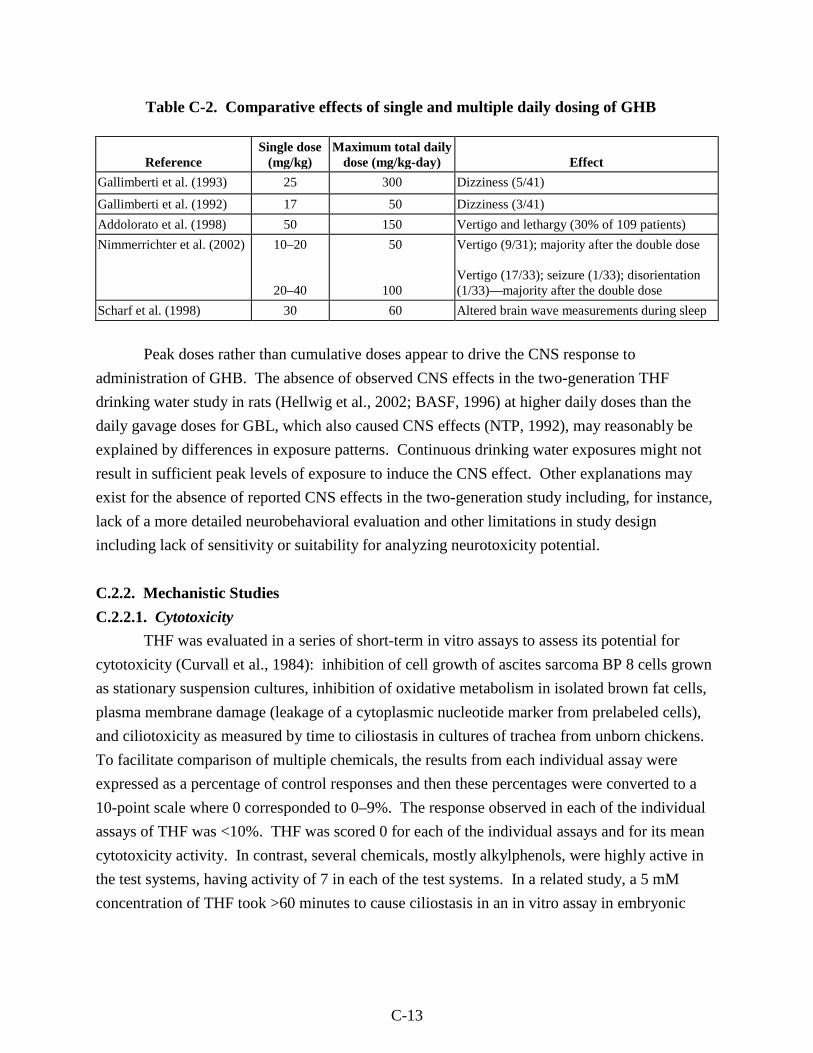
C-13
Table C-2. Comparative effects of single and multiple daily dosing of GHB
Reference Single dose
(mg/kg) Maximum total daily
dose (mg/kg-day) Effect
Gallimberti et al. (1993) 25 300 Dizziness (5/41)
Gallimberti et al. (1992) 17 50 Dizziness (3/41)
Addolorato et al. (1998) 50 150 Vertigo and lethargy (30% of 109 patients)
Nimmerrichter et al. (2002) 10–20
20–40
50
100
Vertigo (9/31); majority after the double dose Vertigo (17/33); seizure (1/33); disorientation (1/33)—majority after the double dose
Scharf et al. (1998) 30 60 Altered brain wave measurements during sleep
Peak doses rather than cumulative doses appear to drive the CNS response to
administration of GHB. The absence of observed CNS effects in the two-generation THF
drinking water study in rats (Hellwig et al., 2002; BASF, 1996) at higher daily doses than the
daily gavage doses for GBL, which also caused CNS effects (NTP, 1992), may reasonably be
explained by differences in exposure patterns. Continuous drinking water exposures might not
result in sufficient peak levels of exposure to induce the CNS effect. Other explanations may
exist for the absence of reported CNS effects in the two-generation study including, for instance,
lack of a more detailed neurobehavioral evaluation and other limitations in study design
including lack of sensitivity or suitability for analyzing neurotoxicity potential.
C.2.2. Mechanistic Studies
C.2.2.1. Cytotoxicity
THF was evaluated in a series of short-term in vitro assays to assess its potential for
cytotoxicity (Curvall et al., 1984): inhibition of cell growth of ascites sarcoma BP 8 cells grown
as stationary suspension cultures, inhibition of oxidative metabolism in isolated brown fat cells,
plasma membrane damage (leakage of a cytoplasmic nucleotide marker from prelabeled cells),
and ciliotoxicity as measured by time to ciliostasis in cultures of trachea from unborn chickens.
To facilitate comparison of multiple chemicals, the results from each individual assay were
expressed as a percentage of control responses and then these percentages were converted to a
10-point scale where 0 corresponded to 0–9%. The response observed in each of the individual
assays of THF was <10%. THF was scored 0 for each of the individual assays and for its mean
cytotoxicity activity. In contrast, several chemicals, mostly alkylphenols, were highly active in
the test systems, having activity of 7 in each of the test systems. In a related study, a 5 mM
concentration of THF took >60 minutes to cause ciliostasis in an in vitro assay in embryonic
C-14
chicken trachea, whereas highly cytotoxic compounds caused ciliostasis in <5 minutes
(Pettersson et al., 1982). Therefore, the results of these studies suggest that THF is not cytotoxic.
The cytotoxicity of THF was evaluated in an in vitro assay of protein content in cell
cultures (Dierickx, 1989). Human hepatoma, HepG2 cells were maintained in culture in 24 well
tissue culture test plates. THF and other test compounds were dissolved directly in culture
medium at five different concentrations (not specified) and incubated with test cells for 24 hours.
The cells were lysed and protein content measured. The relative toxicity of THF and the other
test compounds was determined by estimating the concentration (in mM) required to induce a
50% reduction of cell protein content (PI50). Very toxic compounds, such as heavy metals and
surfactants, consistently had PI50 values of less than 1 mM. In contrast, the PI50 for THF was
372. The results of this study suggest that THF is not cytotoxic.
The cytotoxicity of 168 chemicals, including THF, was characterized as part of a
validation of the BALB/c-3T3 cell transformation assay (Matthews et al., 1993). The LC50 for
THF was 90.3 mM. The authors noted that in the analysis of the entire data set of 168 chemicals,
in vitro cytotoxicity did not correlate to in vivo carcinogenic activity. THF was considered by
the authors as noncytotoxic (defined as having an LC50 ranging from 5 to 100 mM).
C.2.2.2. CYP450 Activity, Cell Proliferation, and Apoptosis
BASF (1998) re-evaluated kidney tissues from male rats and liver tissues from female
mice from the NTP (1998) study to examine the relationship between cell proliferation responses
and increase in tumors observed in these tissues following THF administration.
Histopathological examination and evaluation of cell proliferation as measured by proliferating
cell nuclear antigen (PCNA) staining were conducted using tissue samples from the 0, 200, 600,
and 1,800 ppm (0, 590, 1,770, and 5,310 mg/m3) exposure groups (10/group) from the NTP
(1998) subchronic (13 weeks) study. For the male rat kidneys, tissues from the cortex, outer
stripe of the outer medulla, inner stripe of the outer medulla, and inner medulla were evaluated
separately. For the female mouse liver, no zonal subdivision was made.
The histopathology examination revealed increased incidence of moderate grade hyaline
droplet accumulation in the male rat kidney tissues of the high-concentration group as compared
to controls, but these changes were not accompanied by evidence of cell degeneration. No other
differences between controls and exposure groups were noted. No increase in cell proliferation
was found in any of the kidney compartments or in evaluation of all compartments combined.
Cell proliferation index was statistically significantly decreased in individual kidney
compartments, although these changes did not show a concentration-dependent pattern. For the
female mouse liver tissues, no treatment-related histopathology was observed. The cell
proliferation index was increased by approximately 39% in tissues from the high-concentration
C-15
mice compared with controls. However, this result was not statistically significant and was
noted as being predominantly based on the results from 2/10 animals. Furthermore, a significant
decrease in proliferation index was observed in the mid-concentration group, but no clear
concentration-response pattern was observed. Based on these results, the study authors
concluded that the examination of the tissues from the 13-week NTP (1998) study revealed no
clear increase in cell proliferation that can be correlated to a tumorigenic mechanism.
BASF (Gamer et al., 2002; BASF, 2001a) evaluated a series of endpoints in male F344
rats (6/group plus 5/group at the control and high concentrations for enzyme assays) and female
B6C3F1 mice (10/group plus 5 in the control and high concentrations for enzyme assays) in
tissues for which THF-treated animals developed tumors. Animals were placed in one of three
groups that were exposed 6 hours/day for either 5 consecutive days, 5 consecutive days followed
by a 21-day observation period, or 20 consecutive days over a period of approximately 28 days.
Test animals were exposed nose only to 0, 199, 604, or 1,794 ppm THF (average THF
concentrations of 0, 598, 1,811, or 5,382 mg/m3), corresponding to the concentrations used in the
NTP (1998) cancer bioassay. Concentrations adjusted for continuous exposure were 0, 107, 323,
or 961 mg/m3. For the animals in each of the four concentration groups, a full necropsy was
done, including histopathological evaluation of the kidney (rat) and liver (mouse). Additional
evaluations in these same organs included measurements of cell proliferation (S-phase response
by 5-bromo-2-deoxyuridine [BrdU] staining) and terminal deoxynucleotidyl transferase
deoxyuridine triphosphate (dUTP) nick-end-labeling staining (TUNEL) apoptosis assay. For the
male rat kidneys, immunohistochemical detection of α2u-globulin was also performed. Five
animals from the control and high-concentration groups that were exposed for 5 consecutive
days were also harvested for measurement of CYP450 content and for CYP450 isozyme activity
as measured by ethoxyresorufin-O-deethylase (EROD) and pentoxyresorufin-O-depentylase
(PROD) activity.
The results of the BASF (2001a) study, evaluating cell proliferation, apoptosis, and
α2u-globulin accumulation in the kidneys of male F344 rats, are shown in Table C-3. Although
no significant increase in labeling index in the renal cortex was determined by standard
assessment methods, focal areas of increased BrdU labeling were noted. Quantitation of these
areas revealed increased cell proliferation in subcapsular proximal tubules (cortex 1) in animals
exposed to THF at the mid and high concentration for 20 days and at the high concentration for 5
consecutive days. No increase in labeling was observed in the groups given a 21-day recovery
period. An increase in cell proliferation was also noted in the proximal tubules between the
outer stripe of the outer medulla and the subcapsular layer (cortex 2) at the highest concentration
following 20 exposures.
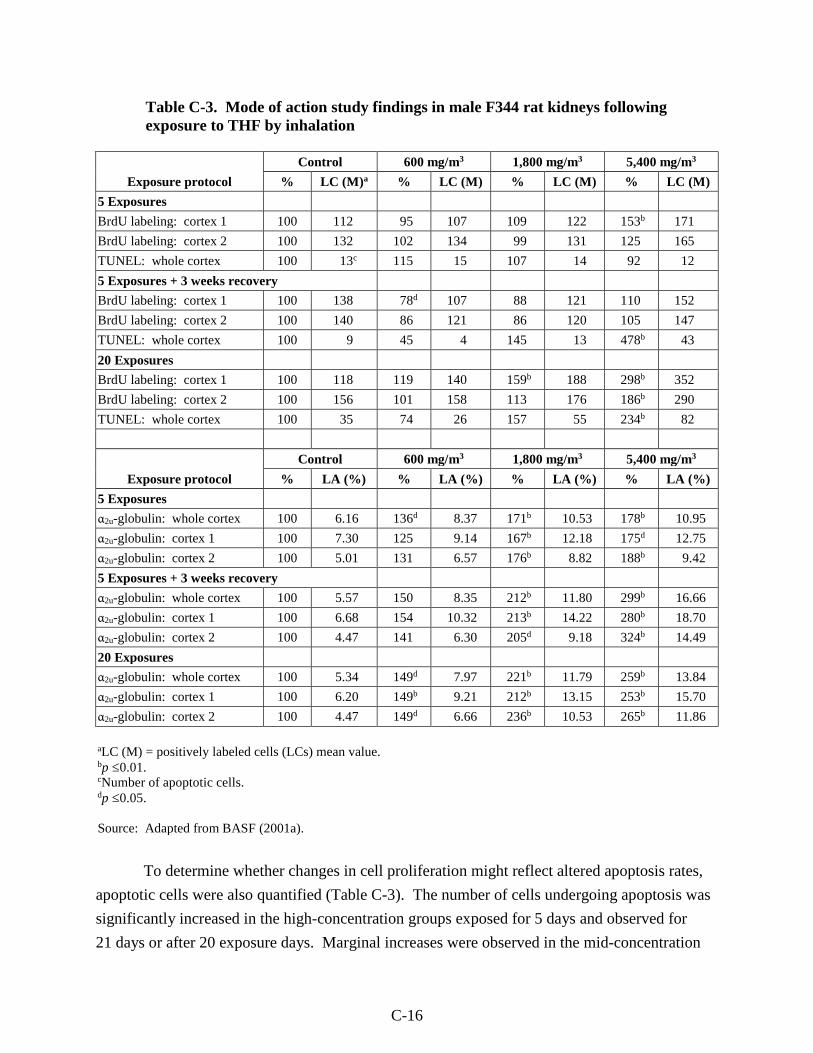
C-16
Table C-3. Mode of action study findings in male F344 rat kidneys following exposure to THF by inhalation
Exposure protocol
Control 600 mg/m3 1,800 mg/m3 5,400 mg/m3
% LC (M)a % LC (M) % LC (M) % LC (M)
5 Exposures
BrdU labeling: cortex 1 100 112 95 107 109 122 153b 171
BrdU labeling: cortex 2 100 132 102 134 99 131 125 165
TUNEL: whole cortex 100 13c 115 15 107 14 92 12
5 Exposures + 3 weeks recovery
BrdU labeling: cortex 1 100 138 78d 107 88 121 110 152
BrdU labeling: cortex 2 100 140 86 121 86 120 105 147
TUNEL: whole cortex 100 9 45 4 145 13 478b 43
20 Exposures
BrdU labeling: cortex 1 100 118 119 140 159b 188 298b 352
BrdU labeling: cortex 2 100 156 101 158 113 176 186b 290
TUNEL: whole cortex 100 35 74 26 157 55 234b 82
Exposure protocol
Control 600 mg/m3 1,800 mg/m3 5,400 mg/m3
% LA (%) % LA (%) % LA (%) % LA (%)
5 Exposures
α2u-globulin: whole cortex 100 6.16 136d 8.37 171b 10.53 178b 10.95
α2u-globulin: cortex 1 100 7.30 125 9.14 167b 12.18 175d 12.75
α2u-globulin: cortex 2 100 5.01 131 6.57 176b 8.82 188b 9.42
5 Exposures + 3 weeks recovery
α2u-globulin: whole cortex 100 5.57 150 8.35 212b 11.80 299b 16.66
α2u-globulin: cortex 1 100 6.68 154 10.32 213b 14.22 280b 18.70
α2u-globulin: cortex 2 100 4.47 141 6.30 205d 9.18 324b 14.49
20 Exposures
α2u-globulin: whole cortex 100 5.34 149d 7.97 221b 11.79 259b 13.84
α2u-globulin: cortex 1 100 6.20 149b 9.21 212b 13.15 253b 15.70
α2u-globulin: cortex 2 100 4.47 149d 6.66 236b 10.53 265b 11.86
aLC (M) = positively labeled cells (LCs) mean value. bp ≤0.01.cNumber of apoptotic cells. dp ≤0.05.
Source: Adapted from BASF (2001a).
To determine whether changes in cell proliferation might reflect altered apoptosis rates,
apoptotic cells were also quantified (Table C-3). The number of cells undergoing apoptosis was
significantly increased in the high-concentration groups exposed for 5 days and observed for
21 days or after 20 exposure days. Marginal increases were observed in the mid-concentration
C-17
groups for these two exposure regimens, but the results were not statistically significant. The
authors suggested the increase in apoptosis observed in the group with a recovery period might
be greater than in the 20-day exposure group, because in the latter group competing cell
proliferation and apoptosis events might have reduced the degree of apoptosis.
THF exposure also induced α2u-globulin accumulation in male rats treated under all three
of the separate exposure regimens (Table C-3). Increases were generally concentration related,
with increases at the high concentration ranging from 175 to 280% of control levels for cortex 1
and from 188 to 324% of control levels for cortex 2, among the three exposure regimens. When
the whole cortex was used as the labeled area (LA) for the analysis, accumulation was
significantly elevated beginning at the low concentration following 5 consecutive days or
20 days of exposure. Maximum effects observed at the high concentration ranged from 178 to
299% of controls among the three exposure regimens. The accumulation of α2u-globulin as
measured by the immunohistochemical staining technique was supported by histopathological
evaluation of control and high-concentration animals exposed to THF for 20 days. The
incidence of proximal tubule cells with grade 2 (slightly increased) staining for hyaline droplets
was 1/6 and 5/6 for controls and high-concentration animals, respectively. THF exposure had no
effect on CYP450 content or CYP450 enzyme activities in the male rat kidneys.
BASF (2001a) and Gamer et al., (2002) also evaluated cell proliferation in female
B6C3F1 mice liver following inhalation exposure to THF (Table C-4). Since chemical exposures
can have varying effects in different regions of the liver lobule, cell proliferation was evaluated
separately for zone 1 (the region adjacent to the portal triad), zone 3 (the region adjacent to the
central vein), and zone 2 (the area of the lobule intermediate between zones 1 and 3). Increased
cell proliferation was observed in zones 2 and 3 of the liver following THF exposure for 5 days
and in zone 3 following 20 exposures. No concentration-dependent increase in BrdU labeling
was observed in the animals given a 21-day recovery period, suggesting that the increases in cell
proliferation may be reversible. Coincident with the increase in BrdU labeling, the mitotic index
(MI) was increased in zone 3 after 5 or 20 exposures in the high-concentration groups. No
treatment-related change in the number of liver cells undergoing apoptosis was observed. The
number of stained cells was small, suggesting that THF did not induce an apoptotic response
under the exposure conditions. Five consecutive days of exposure to THF at the high
concentration generated a statistically significant increase in CYP450 content in the liver (125%
of controls; p ≤0.05), EROD activity (192% of controls; p ≤0.01), and PROD activity (321% of
controls; p ≤0.05). The authors concluded that THF-induced liver tumors in female mice may be
related to increased cell proliferation, based on the increased liver weight, BrdU labeling, and MI
observed in the liver. Some histological changes were noted, including fatty infiltration and cell
proliferation including altered texture of the cytoplasm in zones 3 and 2 (more homogeneous and
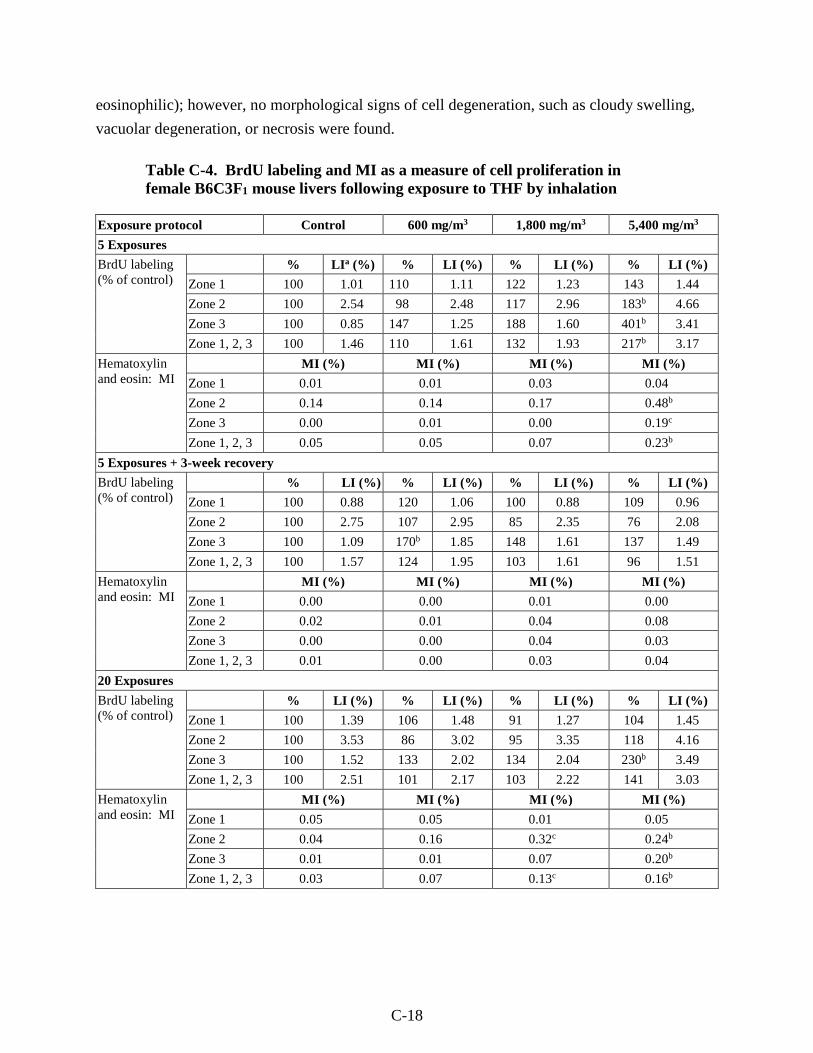
C-18
eosinophilic); however, no morphological signs of cell degeneration, such as cloudy swelling,
vacuolar degeneration, or necrosis were found.
Table C-4. BrdU labeling and MI as a measure of cell proliferation in female B6C3F1 mouse livers following exposure to THF by inhalation
Exposure protocol Control 600 mg/m3 1,800 mg/m3 5,400 mg/m3
5 Exposures
BrdU labeling (% of control)
% LIa (%) % LI (%) % LI (%) % LI (%)
Zone 1 100 1.01 110 1.11 122 1.23 143 1.44
Zone 2 100 2.54 98 2.48 117 2.96 183b 4.66
Zone 3 100 0.85 147 1.25 188 1.60 401b 3.41
Zone 1, 2, 3 100 1.46 110 1.61 132 1.93 217b 3.17
Hematoxylin and eosin: MI
MI (%) MI (%) MI (%) MI (%)
Zone 1 0.01 0.01 0.03 0.04
Zone 2 0.14 0.14 0.17 0.48b
Zone 3 0.00 0.01 0.00 0.19c
Zone 1, 2, 3 0.05 0.05 0.07 0.23b
5 Exposures + 3-week recovery
BrdU labeling (% of control)
% LI (%) % LI (%) % LI (%) % LI (%)
Zone 1 100 0.88 120 1.06 100 0.88 109 0.96
Zone 2 100 2.75 107 2.95 85 2.35 76 2.08
Zone 3 100 1.09 170b 1.85 148 1.61 137 1.49
Zone 1, 2, 3 100 1.57 124 1.95 103 1.61 96 1.51
Hematoxylin and eosin: MI
MI (%) MI (%) MI (%) MI (%)
Zone 1 0.00 0.00 0.01 0.00
Zone 2 0.02 0.01 0.04 0.08
Zone 3 0.00 0.00 0.04 0.03
Zone 1, 2, 3 0.01 0.00 0.03 0.04
20 Exposures
BrdU labeling (% of control)
% LI (%) % LI (%) % LI (%) % LI (%)
Zone 1 100 1.39 106 1.48 91 1.27 104 1.45
Zone 2 100 3.53 86 3.02 95 3.35 118 4.16
Zone 3 100 1.52 133 2.02 134 2.04 230b 3.49
Zone 1, 2, 3 100 2.51 101 2.17 103 2.22 141 3.03
Hematoxylin and eosin: MI
MI (%) MI (%) MI (%) MI (%)
Zone 1 0.05 0.05 0.01 0.05
Zone 2 0.04 0.16 0.32c 0.24b
Zone 3 0.01 0.01 0.07 0.20b
Zone 1, 2, 3 0.03 0.07 0.13c 0.16b
C-19
aLI = labeling index. bp ≤ 0.01.cp ≤ 0.05.
Source: Adapted from BASF (2001a)
In addition, BASF (2001a) also evaluated BrdU labeling in the uterine epithelium of
female B6C3F1 mice. The study authors reported no statistically significant changes in this
measure were detected for any of the treatment groups. However, the BrdU labeling index in the
controls was high. In addition, the mitotic index in the uterine epithelium was not significantly
affected by THF exposure, while the percent increase in mitotic index was increased for mice
exposed to the highest concentration for 5 days followed by a 21-day recovery. The authors
(BASF, 2001a) suggested that an unusually low number of mitotic cells identified in the control
animals contributed to the apparent increase in mitosis. The number of apoptotic cells was
increased (168% of controls) in the high-concentration group given a 21-day recovery period.
However, the overall data do not suggest that apoptosis plays a major role in cell regulation by
THF, since the corresponding concentration in groups exposed 5 or 20 days had no increase in
apoptosis (TUNEL staining). In addition, the total number of stained cells was small, suggesting
that THF does not induce a robust apoptotic response in the uterus.
CYP450 activity was also evaluated as part of this study to examine the potential role of
metabolism in the mode of action for THF-induced liver tumors (Gamer et al., 2002; BASF,
2001a). Female B6C3F1 mice were exposed nose only to average THF concentrations of 0, 598,
1,811, or 5,382 mg/m3 (0, 199, 604, or 1,794 ppm), corresponding to the concentrations used in
the NTP (1998) cancer bioassay. Five consecutive days of exposure to THF at the high
concentration generated a statistically significant increase in CYP450 content in the liver (125%
of controls; p ≤0.05), EROD activity (192% of controls; p ≤0.01), and PROD activity (321% of
controls; p ≤0.05). EROD activity is often used as a measure of CYP1A family activity, while
PROD is often used as a measure of CYP2B family activity, although there is some overlap in
the specificity of these assays for various CYP450 isoforms among species (Weaver et al., 1994).
This result would suggest that THF might be metabolized by CYP1A/2B isoforms, although
these data do not provide direct evidence of their involvement.
In a second study by BASF (van Ravenzwaay et al., 2003; BASF, 2001b) female B6C3F1
mice were exposed to THF concentrations of 0, 5,512, or 14,739 mg/m3 6 hours/day for
5 consecutive days. The target concentrations of 5,400 and 15,000 mg/m3 were chosen to match
the high-concentration groups in the subchronic NTP (1998) study. Two groups of mice were
used for each THF concentration. One group of mice was pretreated (about 1 hour prior to each
exposure) with an i.p. dose of 100 mg/kg 1-aminobenzotriazole (ABT), a potent inhibitor of
C-20
CYP450 enzyme activity that has broad activity for many CYP450 isoforms. The parallel
exposure group did not receive this pretreatment with ABT and was used to test the effects of
THF without CYP450 inhibition. The livers of the mice were evaluated for total CYP450
content and some of the CYP450 activities including EROD, PROD, and nitrophenol
hydroxylase (NPH), as well as cell proliferation (as measured by PCNA staining), and
examination by electron microscopy.
Exposure of animals at the high concentration induced a narcotic effect. Three of
18 mice died in the high-concentration group without CYP450 inhibition, and 1 of 18 mice died
in the high-concentration group pretreated with ABT. The high-concentration mice also had
reduced body weight compared with controls. No clinical effects of THF were observed at the
low concentration. No THF-related histopathology changes were observed in any of the
treatment groups, although, in the livers of ABT-pretreated mice, centrilobular fatty changes
were noted. Measurements of CYP450 content and activity revealed that CYP450s were induced
in the high-concentration mice. Liver CYP450 content was increased by 98% in the high-
concentration group, and this increase was blocked by ABT pretreatment. THF treatment
induced PROD activity by about sixfold in the high-concentration group. In the mice pretreated
with ABT, PROD activity was induced by approximately twofold by THF. EROD activity was
increased by 160% in the high-concentration mice as compared to controls in the absence of
ABT, and no induction of EROD activity was observed in the mice pretreated with ABT. These
results show that THF induces both EROD and PROD activity and that the ABT pretreatment
was an effective inhibitor of CYP450 isoform activity. In contrast to the results for PROD and
EROD, NPH activity, known to be predominantly catalyzed by human and rat CYP2E1
(Kobayashi et al., 2002; Tassaneeyakul et al., 1993) was decreased in a concentration-dependent
manner by THF and was not affected by ABT pretreatment. CYP450 content or associated
enzyme activities were not induced above basal levels in the low-concentration group.
THF exposure induced cell proliferation at the high concentration, regardless of
pretreatment with ABT. In mice exposed to 14,739 mg/m3 THF without ABT pretreatment,
PCNA staining was increased 814% relative to controls in zone 3, although a decrease to 59% of
control levels that was not statistically significant was observed in zone 2, and no difference was
observed for zone 1. The overall increase in PCNA staining for the three zones (pooled data)
was 133% of controls (not statistically significant). In the high-concentration group pretreated
with ABT, cell proliferation was even greater than the parallel THF group without pretreatment.
PCNA staining was 150, 280, and 1,050% of control levels in liver zones 1, 2, and 3,
respectively. In ABT-pretreated mice, the overall PCNA labeling for the three zones (data
pooled) was 329% of controls. No change in PCNA staining was observed in the low-
concentration groups regardless of pretreatment with inhibitor.
C-21
The data indicated that THF is an inducer of CYP450s and that THF induces cell
proliferation in the livers of female mice, particularly in zone 3 hepatocytes. Pretreatment with
the CYP450 inhibitor ABT enhanced the degree of PCNA staining, suggesting that THF itself,
rather than a downstream oxidative metabolite, is responsible for the cell proliferative response.
In mice with enzyme inhibition, the cell proliferation response was enhanced only moderately. It
is possible that this effect would have been even more dramatic if the basal as well as inducible
CYP450 activity had been blocked by the ABT pretreatments. ABT did not provide a complete
inhibition of response, producing some uncertainty about the role that CYP450s play in THF-
induced cell proliferation. A second area of uncertainty is that there were qualitative differences
in the histopathology in the ABT-pretreated mice (i.e., centrilobular fatty changes) compared to
mice without ABT pretreatment. It is not clear whether these histopathological changes that
were unique to ABT-pretreated mice could have caused hepatocytes to be more susceptible to
THF-induced liver toxicity. Even though these areas of uncertainty remain, the most possible
interpretation of the data is that the cell proliferative response of the liver in female mice is not
dependent on CYP450 activity, since treatment with the CYP450 inhibitor did not decrease the
proliferative response. This interpretation suggests that THF itself, not a metabolite, is the active
moiety in inducing cell proliferation. However, in the absence of further in vitro (or in vivo)
metabolism data with and without ABT, it is not possible to determine if THF metabolism is
actually inhibited and to what extent.
C.2.2.3. Initiation
Other than the NTP (1998) study, no direct animal cancer bioassays have been
conducted. The use of THF as a solvent control in cancer studies for other compounds provides
some limited data on the potential cancer mode of action for THF. Sawyer et al. (1988)
evaluated the tumor-initiating properties of dibenz[a,j]anthracene, cholanthrene, and their diol
and epoxide metabolites on the skin of SENCAR mice. The test compounds were dissolved in
either acetone (30 mice/group) or THF (24 mice/group). The number of papillomas/mouse and
percent of mice with papillomas was lower for THF-treated controls (5%) than for acetone-
treated controls (16%) and was much lower than for the animals treated with the test compounds
(39–97% for various treatment groups), suggesting that THF is not a potent tumor initiator.
However, interpretation of this study is limited for a number of reasons. The study authors did
not provide data on the historical incidence of papillomas. A tumor-screening protocol was used,
which did not include a control group, an adequate number of dose levels, or adequate numbers
of animals/dose group. Another complication in evaluating this study is that the tumor
incidences for the test compounds dissolved in acetone or THF could reflect cocarcinogenic
interactions.
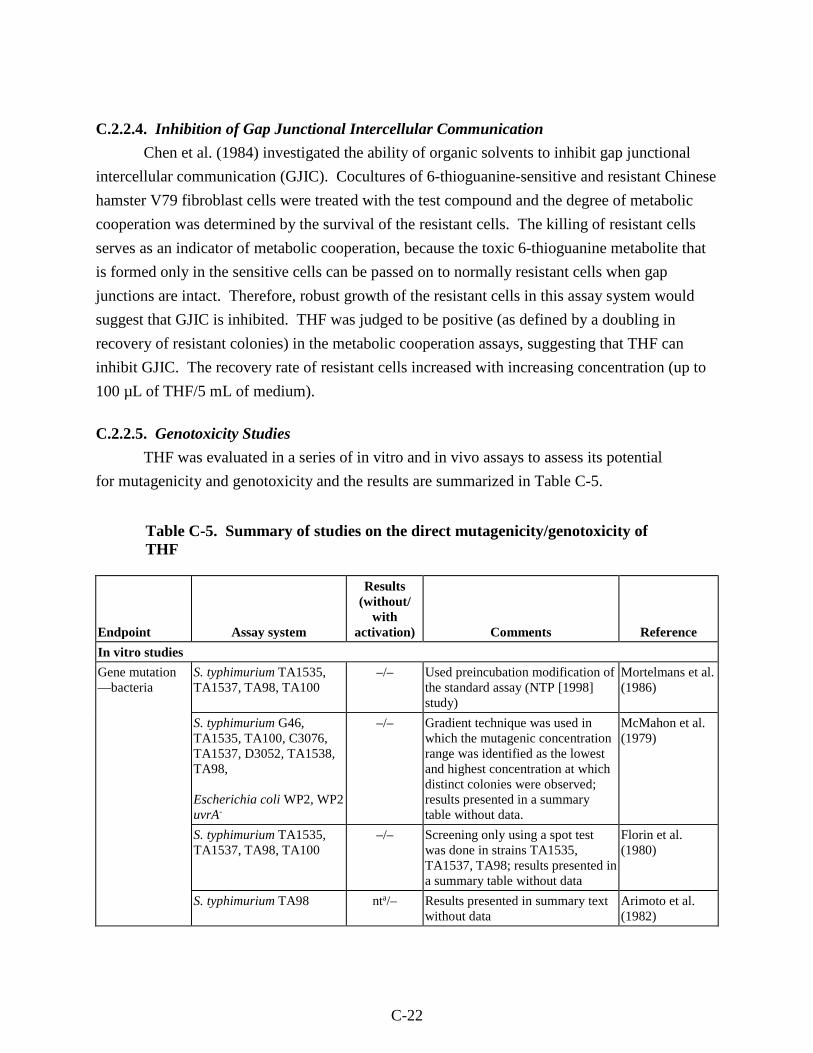
C-22
C.2.2.4. Inhibition of Gap Junctional Intercellular Communication
Chen et al. (1984) investigated the ability of organic solvents to inhibit gap junctional
intercellular communication (GJIC). Cocultures of 6-thioguanine-sensitive and resistant Chinese
hamster V79 fibroblast cells were treated with the test compound and the degree of metabolic
cooperation was determined by the survival of the resistant cells. The killing of resistant cells
serves as an indicator of metabolic cooperation, because the toxic 6-thioguanine metabolite that
is formed only in the sensitive cells can be passed on to normally resistant cells when gap
junctions are intact. Therefore, robust growth of the resistant cells in this assay system would
suggest that GJIC is inhibited. THF was judged to be positive (as defined by a doubling in
recovery of resistant colonies) in the metabolic cooperation assays, suggesting that THF can
inhibit GJIC. The recovery rate of resistant cells increased with increasing concentration (up to
100 µL of THF/5 mL of medium).
C.2.2.5. Genotoxicity Studies
THF was evaluated in a series of in vitro and in vivo assays to assess its potential
for mutagenicity and genotoxicity and the results are summarized in Table C-5.
Table C-5. Summary of studies on the direct mutagenicity/genotoxicity of THF
Endpoint Assay system
Results (without/
with activation) Comments Reference
In vitro studies
Gene mutation —bacteria
S. typhimurium TA1535, TA1537, TA98, TA100
–/– Used preincubation modification of the standard assay (NTP [1998] study)
Mortelmans et al. (1986)
S. typhimurium G46, TA1535, TA100, C3076, TA1537, D3052, TA1538, TA98, Escherichia coli WP2, WP2 uvrA-
–/– Gradient technique was used in which the mutagenic concentration range was identified as the lowest and highest concentration at which distinct colonies were observed; results presented in a summary table without data.
McMahon et al. (1979)
S. typhimurium TA1535, TA1537, TA98, TA100
–/– Screening only using a spot test was done in strains TA1535, TA1537, TA98; results presented in a summary table without data
Florin et al. (1980)
S. typhimurium TA98 nta/– Results presented in summary text without data
Arimoto et al. (1982)
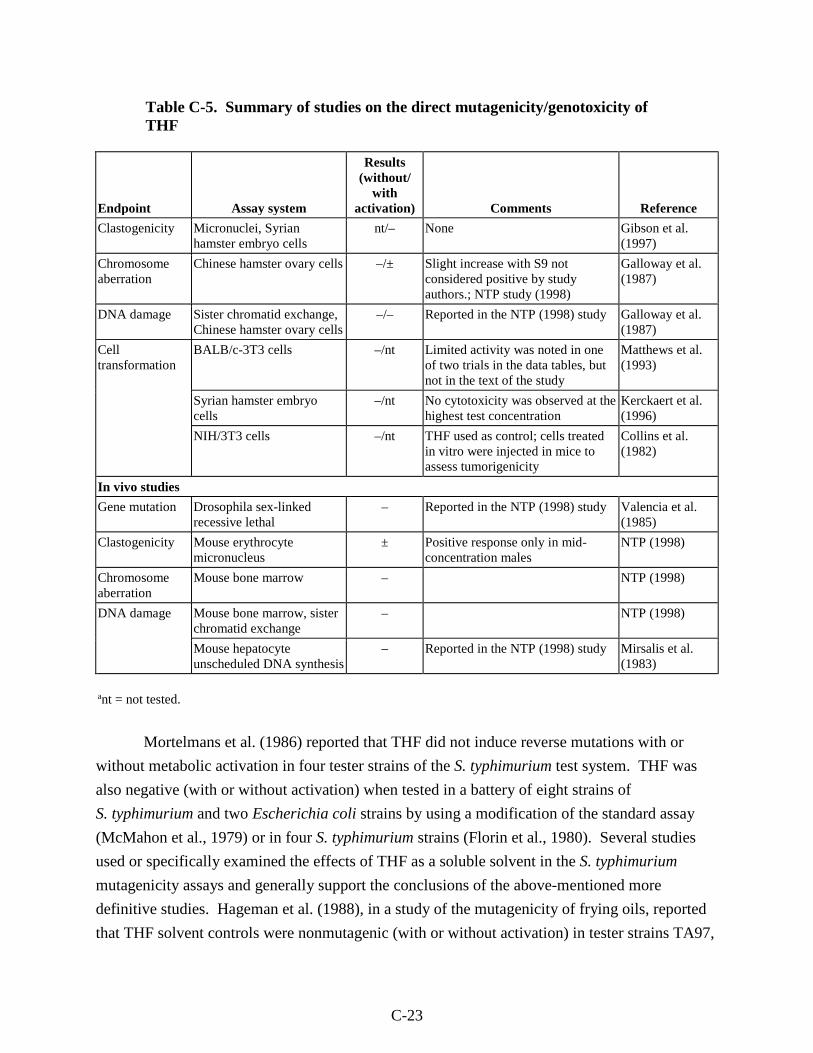
C-23
Table C-5. Summary of studies on the direct mutagenicity/genotoxicity of THF
Endpoint Assay system
Results (without/
with activation) Comments Reference
Clastogenicity Micronuclei, Syrian hamster embryo cells
nt/– None Gibson et al. (1997)
Chromosome aberration
Chinese hamster ovary cells –/± Slight increase with S9 not considered positive by study authors.; NTP study (1998)
Galloway et al. (1987)
DNA damage Sister chromatid exchange, Chinese hamster ovary cells
–/– Reported in the NTP (1998) study Galloway et al. (1987)
Cell transformation
BALB/c-3T3 cells –/nt Limited activity was noted in one of two trials in the data tables, but not in the text of the study
Matthews et al. (1993)
Syrian hamster embryo cells
–/nt No cytotoxicity was observed at the highest test concentration
Kerckaert et al. (1996)
NIH/3T3 cells –/nt THF used as control; cells treated in vitro were injected in mice to assess tumorigenicity
Collins et al. (1982)
In vivo studies
Gene mutation Drosophila sex-linked recessive lethal
– Reported in the NTP (1998) study Valencia et al. (1985)
Clastogenicity Mouse erythrocyte micronucleus
± Positive response only in mid-concentration males
NTP (1998)
Chromosome aberration
Mouse bone marrow – NTP (1998)
DNA damage Mouse bone marrow, sister chromatid exchange
– NTP (1998)
Mouse hepatocyte unscheduled DNA synthesis
– Reported in the NTP (1998) study Mirsalis et al. (1983)
ant = not tested.
Mortelmans et al. (1986) reported that THF did not induce reverse mutations with or
without metabolic activation in four tester strains of the S. typhimurium test system. THF was
also negative (with or without activation) when tested in a battery of eight strains of
S. typhimurium and two Escherichia coli strains by using a modification of the standard assay
(McMahon et al., 1979) or in four S. typhimurium strains (Florin et al., 1980). Several studies
used or specifically examined the effects of THF as a soluble solvent in the S. typhimurium
mutagenicity assays and generally support the conclusions of the above-mentioned more
definitive studies. Hageman et al. (1988), in a study of the mutagenicity of frying oils, reported
that THF solvent controls were nonmutagenic (with or without activation) in tester strains TA97,
C-24
TA100, and TA104 relative to mutagen-containing oil samples. Maron et al. (1981) screened a
series of solvents for compatibility with the S. typhimurium test system and reported that, while
high-dose THF was toxic to the four tester strains used, it did not affect the mutagenicity of
benzo(a)pyrene at lower levels (50 µL/plate) in strain TA100 in the plate incorporation protocol.
THF was judged to be an unsatisfactory solvent for the preincubation assay due to higher
cytotoxicity observed in this protocol modification. Finally, THF was reported to enhance the
mutagenicity of tryptophan pyrolysate mutagens in S. typhimurium preincubation assay when
used as a solvent (Arimoto et al., 1982). No potential mode of action for this effect was given,
but the authors reported (no quantitative data provided) that the solvent was not itself mutagenic
in tester strain TA98 with activation. The studies by Hageman et al. (1988), Arimoto et al.
(1982), and Maron et al. (1981) are of limited value for assessing the mutagenic potential of THF
because THF served as the control solvent in these studies and it is not clear if the results for
THF were compared to untreated samples.
THF was also negative in a variety of in vitro assays evaluating chromosome and DNA
damage up to cytotoxic concentrations. Gibson et al. (1997) reported that THF did not increase
micronuclei formation when assayed in Syrian hamster embryo cells at concentrations that
significantly reduced cell number. Galloway et al. (1987) reported some increase in total
chromosome aberrations in the presence of S9 activation in Chinese hamster ovary cells. A
majority of the aberrations were classified as simple, including breaks and terminal deletions.
The study authors suggested that these increases were insufficient to be scored as a positive
result. As part of this same study, Galloway et al. (1987) reported that THF did not induce sister
chromatid exchanges in this cell system at cytotoxic doses.
THF was judged to be inactive when tested in the standard BALB/c-3T3 mouse cell
transformation assay (Matthews et al., 1993). A Syrian hamster embryo cell assay was also
negative for cell transformation when THF was tested at concentrations up to 5 mg/mL
(Kerckaert et al., 1996). Collins et al. (1982) evaluated the in vivo tumorigenicity of NIH/3T3
cells transformed in vitro by benzo[a]pyrene-trans-7,8-dihydrodiol-9,10-epoxide (BPE)
dissolved in THF. The ability of BPE-treated cells to induce tumors in normal mice (strain not
specified) and AT×FL mice having a compromised immune response (thymectomized, lethally
irradiated, and restored with syngeneic liver cells) was greater than the tumorigenicity of cells
treated with THF only. Cells from 46/57 BPE-treated plates were tumorigenic in vivo, whereas
cells from only 2/20 of the THF-treated plates were tumorigenic when injected in mice. The
background tumor rate for untreated mice was not reported, but the low incidence of tumors
induced by THF-treated cells as compared with positive controls suggested that THF did not
significantly increase the rate of cell transformation.
C-25
THF has also generated negative findings in in vivo genotoxicity assays. THF did not
induce sex-linked recessive lethal mutation in Drosophila melanogaster in a screening test for
48 chemicals for NTP (Valencia et al., 1985). NTP (1998) evaluated the formation of
micronuclei in peripheral blood erythrocytes in male and female mice at the end of their 13-week
inhalation study. There was only a statistically significant increased incidence of micronucleated
normochromatic erythrocytes at the mid concentration in males. The effect was not
concentration dependent, and no corresponding increase was seen for females. The results were
considered by NTP to be equivocal. In a bioassay for chromosomal aberrations, male B6C3F1
mice received THF by i.p. injection at doses of up to 2,000 mg/kg. No significant increase in the
number of aberrations/cell or percent of bone marrow cells with aberrations was observed (NTP,
1998).
In vivo assays for DNA damage have also been conducted for THF. Male B6C3F1 mice
received THF doses of up to 2,000 mg/kg by i.p. injection. Bone marrow cells were harvested
after 23 or 42 hours of exposure. In the 23-hour treatment protocol, a significant increase in the
mean number of sister chromatid exchanges/cell was reported for the high-dose animals.
However, this effect was observed in only one of the two replicate trials. No increase in sister
chromatid exchanges was reported for the animals exposed for 42 hours. NTP (1998)
characterized these results as negative. In another assay for DNA damage, Mirsalis et al. (1983
[published abstract]) reported that in vivo treatment of male rats with THF did not induce
unscheduled DNA synthesis in hepatocytes.
Loureiro et al. (2004, 2000) reported formation of three DNA adducts from reaction of
2'-deoxyguanosine with trans, trans-2,4-decadienal occurring in the presence of oxidized THF.
Later on, the same investigators structurally characterized these novel stable adducts produced by
the reaction of THF oxidation products with 1,N2-etheno-2'-deoxy-guanosine (Hermida et al.,
2006; Loureiro et al., 2005). They also claim that an interaction leading to DNA-THF adducts
may be a contributing factor to the observed toxicological effects associated with THF exposure.
However, the limited information available from in vitro and in vivo genotoxicity studies point
to THF as non-mutagenic (NTP, 1998). Further investigations are necessary to evaluate the
possible interaction of THF oxidation products with DNA and their role in mutagenic mode(s) of
action or THF-induced carcinogenic activity in rodents.
In summary, the genotoxic potential of THF has been evaluated in a variety of in vitro
and in vivo assays. Nearly all the results are conclusively negative, with equivocal findings
reported in a small number of assays that have been conducted. Taken together, these data
support the conclusion that THF is not likely genotoxic.
C-26
C.2.3. Noncancer Mode of Action Information
THF was evaluated in a series of short-term in vitro tests to assess its potential for
cytotoxicity (Matthews et al., 1993; Dierickx, 1989; Curvall et al., 1984; Pettersson et al., 1982).
The results of these studies suggest that THF is not cytotoxic.
The available data suggest that THF metabolism is extensive and that oxidative
metabolism may be due to CYP450 isozymes. However, the identity of the isozymes responsible
for THF metabolism has not been elucidated. In addition, whether THF or one of its metabolites
is responsible for the observed toxicological effects is unknown. Some mode of action data
(BASF, 2001b) suggest that the parent compound might be the active form for liver toxicity and
that metabolites might be responsible for neurological effects.
In the two-generation reproduction study (Hellwig et al., 2002; BASF, 1996) of THF in
rats by the oral route, increased kidney weights in F0/F1 adults were observed in the high-dose
groups. The mode of action for THF-induced kidney toxicity is unknown. Two possible modes
of action were considered. First, THF exposure by the inhalation route induces CYP450 activity
in the mouse liver (Gamer et al., 2002; BASF, 2001a, b), and therefore it is possible that a
similar response could occur in the rat kidney. However, data available showed that acute
inhalation exposures had no effect on kidney CYP450 activity in male F344 rats (Gamer et al.,
2002; BASF, 2001a). These results are not directly comparable to the oral two-generation study
since the exposure duration and rat strains differed between the two studies. Nevertheless, the
only directly available data do not support the idea that CYP450 induction is responsible for the
observed increase in kidney weight. Furthermore, since it is not known whether THF itself or a
metabolite is the active moiety with respect to the kidney effects, it is not clear whether an
induction of CYP450 activity is likely to increase or decrease THF toxicity in the affected
organ. Some data suggest that an α2u-globulin-associated mode of action could contribute to
THF-induced nephrotoxicity. However, there is insufficient evidence to conclude that the
kidney effects observed following THF exposure are related to the accumulation of α2u-globulin
for the following reasons (See Section 4.7.3.1 for analysis of the available data).
Decreased body weight gain in F1/F2 pups and delayed developmental stages (delayed
eye opening) in F2 pups were also observed in the high-concentration groups of the two-
generation reproduction study of THF in rats by the oral route (Hellwig et al., 2002; BASF,
1996). Two hypotheses for the observed decrease in pup body weight gain were considered.
First, decreased maternal water intake during the lactation period could limit maternal milk
production, resulting in decreased nutrition for pups and corresponding decreases in their growth,
assuming that the composition of the milk did not change to maintain its nutritional value at
times when water intake is low. Published studies have showed an association between water
restriction and decreased volume of milk production in both humans and livestock (Hossaini-
C-27
Hilali et al., 1994; Morse et al., 1992; Dusdiecker et al., 1985; Little et al., 1980), and, therefore,
the proposed explanation of decreased pup body weight gain due to decreased milk production is
biologically possible. The temporal pattern of decreased pup body weight gain (significant
decrements only during PNDs 4–14) correlates well to the postnatal lactation period where milk
intake is greatest, and thus demand on a limited maternal milk supply would be expected to be
most dramatic. The absence of an effect on pup body weight gain for PNDs 14–21 corresponds
to the period where pups begin direct food and water intake and therefore depend less on milk
production as a source of nutrition. Whether the observed decrease in water intake was due to a
toxic effect of THF or was secondary to poor palatability is not clear from the available data. No
study was conducted to test specifically whether THF, at the concentrations tested, reduced water
intake solely because of taste aversion. Also, the two-generation study (Hellwig et al., 2002;
BASF, 1996) did not include a water-restricted control group to separate the effects of decreased
water intake from those that are induced directly by THF. In some cases the temporal pattern of
water intake can provide evidence for decreased palatability, where decreased water
consumption at initial introduction of the treated water is greater than the decrease observed at
later exposure periods. However, for the two-generation study (Hellwig et al., 2002; BASF,
1996), the decrease in water intake was not greater for week 1 versus other weeks during the
premating period. This result by itself is not sufficient to determine whether decreased water
intake was secondary to palatability, since water intake data for initial days of exposure were not
reported (weekly summaries were provided in the report), and this is only an indirect measure of
potential taste aversion.
The second hypothesis is that THF itself induces a direct effect on pup development.
Several considerations provide indirect support for a role of THF in the observed decreased pup
body weight gain. In the two-generation study (Hellwig et al., 2002; BASF, 1996), THF induced
developmental effects in the F2 pups (delayed eye opening and increased incidence of sloped
incisors) in addition to decreased pup body weight gain. While this observation that other
developmental indices are affected by THF treatment supports a role of THF exposure, it could
simply reflect additional developmental delays resulting from decreased milk availability. The
developmental effects of THF have also been tested in inhalation exposures in rodents, which
would not be subject to issues of water palatability. However, the available studies did not
assess postnatal development (sacrifice was at the end of gestation) and therefore do not provide
directly comparable responses to the oral two-generation study. In the inhalation studies,
maternally toxic concentrations of THF reduced fetal survival and weight and increased the
incidence of fetal skeletal alterations in rats and mice (Mast et al., 1992; DuPont Haskell
Laboratory, 1980). These inhalation data are consistent with the hypothesis that THF can induce
developmental effects. On the other hand, even though the two-generation study did not fully
C-28
evaluate fetal toxicity outcomes, the absence of a THF effect on litter size or pup body weight
during the early postnatal period (days 1–4) suggests that fetal effects were not occurring in the
oral dosing study. One explanation for the absence of an indication of fetal effects in the two-
generation study, other than dose route, is that the degree of maternal toxicity in the inhalation
studies was more severe than in the drinking water study. However, a subtle effect on male rat
fertility/fecundity may exist following exposure to a high concentration of THF in drinking water
based on a slight decrease (not statistically significant) in the mean number of delivered F2 pups
and a finding of one infertile F1 parental male rat in the high dose group (Section 4.3.1).