Towards the Development of a Medium Throughput Assay to ...
138
Towards the Development of a Medium- Throughput Assay to Investigate the Kinetics of β-Haematin Formation in the Presence of Diverse Inhibitors by Sharné-Maré Fitzroy December 2015 Thesis presented in partial fulfilment of the requirements for the degree of Master of Science in the Faculty of Chemistry and Polymer Science at Stellenbosch University Supervisor: Dr Katherine A. de Villiers
Transcript of Towards the Development of a Medium Throughput Assay to ...
Towards the Development of a Medium-
Throughput Assay to Investigate the
Kinetics of β-Haematin Formation in the
Presence of Diverse Inhibitors
by
Sharné-Maré Fitzroy
December 2015
Thesis presented in partial fulfilment of the requirements for
the degree of Master of Science in the Faculty of Chemistry
and Polymer Science at Stellenbosch University
Supervisor: Dr Katherine A. de Villiers
i
Declaration
By submitting this thesis electronically, I, Sharné-Maré Fitzroy, declare that the entirety of the work contained
therein is my own, original work, that I am the sole author thereof (save to the extent explicitly otherwise
stated), that reproduction and publication thereof by Stellenbosch University will not infringe any third party
rights and that I have not previously in its entirety or in part submitted it for obtaining any qualification.
December 2015
Copyright © 2015 Stellenbosch University
All rights reserved
Stellenbosch University https://scholar.sun.ac.za
ii
Abstract
A new, improved-throughput lipid-water interface assay was developed in which the inhibition of β-haematin
formation by diverse inhibitors was investigated. Monopalmitoyl-rac-glycerol was used as a model lipid, and
following the introduction of the inhibitors into the aqueous buffer layer, β-haematin inhibitory activity was
investigated under biologically-relevant conditions. Clinically-relevant antimalarial drugs, namely
chloroquine, amodiaquine, quinidine, quinine and mefloquine were used in order to validate the newly-
optimized assay as a means of assaying drug activity. Having developed this more efficient assay, a larger set
of compounds, including short-chain chloroquine analogues and a series of benzamide non-quinoline
inhibitors, were successfully introduced into the system. The IC50 values determined for the inhibition of
β-haematin formation through this newly-optimized assay show good correlations with previously-determined
IC50 values, also determined in the lipid-mediated system, as well as biological activities determined against
chloroquine-sensitive strains of Plasmodium falciparum.
Furthermore, the effect of each antimalarial drug, short-chain chloroquine analogue and benzamide non-
quinoline compound on the kinetics of β-haematin formation was investigated in the lipid-mediated system. A
theoretical kinetic model, which is based on the Avrami equation and the Langmuir isotherm, was used to
analyse the experimental data. Importantly, it has been possible to extract equilibrium adsorption constants
(Kads) for each compound, which provides a quantitative measure of the strength of interaction between an
inhibitor and the surface of growing β-haematin. Thus, the experimental data support a mechanism of inhibitor
action via adsorption for both quinoline- and non-quinoline inhibitors. An important observation made during
this study suggests that both Kads and the rate of the proposed precipitation of an inhibitor-Fe(III)PPIX complex
(k2) have an effect on the IC50 value of an inhibitor. While the latter process was not investigated in the current
work, the interplay between the two parameters appears to be of uttermost importance in determining the
overall activity of a family of β-haematin inhibitors.
Finally, the direct adsorption of an inhibitor to preformed β-haematin crystals was investigated in independent
studies in order to support the conclusions drawn from the kinetics studies. A decrease in the absorbance of a
solution was observed in all cases when preformed β-haematin was added, which was attributed to the physical
adsorption of the inhibitor to the crystals. From these studies an adsorption constant was extracted which
indicated a good correlation with the inhibitory activity and Kads values determined in the kinetics experiments.
The work in this research project provides important insight into the possible mode of β-haematin inhibition
by diverse inhibitors. If the interactions that aid the adsorption of compounds to surface binding sites are
identified, the insight will be invaluable in the rational design of novel haemozoin inhibitors.
Stellenbosch University https://scholar.sun.ac.za
iii
Uittreksel
‘n Nuwe, verbeterde-deurset lipied-water tussenfase toets is ontwikkel waarin die inhibisie van β-haematien
vorming deur verskillende inhibeerders ondersoek was. Monopalmitiengliserol was gebruik as ‘n model-lipied,
en deur die inhibeerders in die waterige buffer laag in te sluit, was dit moontlik om die β-haematien inhiberende
aktiwiteit onder biologies-relevante kondisies the ondersoek. Klinies-relevante antimalaria-middels, naamlik
chlorokien, amodiakien, kinidien, kinien en meflokien was gebruik om die nuwe geoptimaliserende toets te
evalueer as ‘n middel van toetsing van inhiberende aktiwiteit. Deur die ontwikkeling van hierdie meer
doeltreffende toets, was dit moontlik om ‘n groter hoeveelheid verbindings, insluitend kort-ketting chlorokien
analoë en ‘n reeks bensamied nie-kinolien inhibeerders, in die sisteem te inkorporeer. Die IC50 waardes bepaal
vir die inhibisie van β-haematien vorming deur hierdie nuwe geoptimaliserende toets, dui op goeie korrelasies
met voorheen bepaalde IC50 waardes, óók bepaal in die lipied-beheerde sisteem, asook die biologiese
aktiwiteite bepaal teen chlorokien-sensitiewe stamme van Plasmodium falciparum.
Verder is die effek van elke antimalarial-middel, kort-ketting chlorokien analoog en bensamied nie-kinoline
inhibeerder op die kinetika van β-haematien vorming ondersoek in die lipied-beheerde sisteem. ‘n Teoretiese
kinetiese model wat gebaseer is op die Avrami-vergelyking en die Langmuir-isoterm was gebruik om die
eksperimentele data te analiseer. Dit was moontlik om ‘n ewewigs-adsorpsiekonstante (Kads) vir elke
inhibeerder te bepaal. Die Kads waarde is ‘n kwantitatiewe meting van die sterkte van die interaksie tussen ‘n
inhibeerder en die oppervlakte van groeiende β-haematien. Dus ondersteun die eksperimentele data ‘n
meganisme van inhibeerder aksie deur adsorpsie deur beide die kinolien en nie-kinolien inhibeerders. ‘n
Belangrike waarneming tydens die studie dui daarop dat beide Kads en die koers van die voorgestelde
neerslagreaksie van ‘n inhibeerder-Fe(III)PPIX kompleks (k2) ‘n effek op die IC50 waarde van ‘n inhibeerder
het. Terwyl die laasgenoemde proses nie ondersoek was in die huidige studie nie, blyk dit dat die wisselwerking
tussen hierdie twee parameters die algehele aktiwiteit van ‘n familie van inhibeerders bepaal.
Die direkte adsorpsie van ‘n inhibeerder aan reeds-gevormde β-haematien kristalle was ondersoek in
onafhanklike studies om die gevolgtrekkings van die kinetika studies te ondersteun. ‘n Daling in die
absorbansie van ‘n oplossing was waargeneem in alle gevalle wanneer reeds-gevormde β-haematien daarby
gevoeg was. Hierdie waarneming is toegeskryf aan die fisiese adsorpsie van die inhibeerder aan die kristalle.
Vanuit hierdie studies was ‘n adsorpsiekonstante bepaal wat goeie korrelasies met die inhiberende aktiwiteit
en Kads waardes, verkry in die kinetika eksperimente, aandui.
Die werk in hierdie navorsings projek verleen belangrike insig in die moontlike manier van β-haematien
inhibisie deur verskillende inhibeerders. As die interaksies wat bydra tot die adsorpie van verbindings aan die
oppervlak-bindings punte geïdentifiseer word, sal die insig van hierdie werk belangrik wees in die
ontwikkeling van nuwe haemasoïen inhibeerders.
Stellenbosch University https://scholar.sun.ac.za

iv
Dedication
To my Parents,
Eddie and Riana Fitzroy
Stellenbosch University https://scholar.sun.ac.za
v
Acknowledgements
This thesis would not be possible without the grace and love from the King of all kings and the saviour of my
soul. Thank You Lord for giving me this great opportunity to do my masters and to complete this thesis. Thank
you for carrying me when I needed you the most. All praise goes to You.
Thank you Dr Katherine de Villiers for being the best supervisor ever. You are a great mentor, leader, teacher,
friend, “go-to-person” and woman of God. Your kindness, support, positive heart and willingness to help will
always be remembered. You are inspiring to work with and I am greatly privileged to have worked with you
over these few years.
None of this would even be remotely possible without my parents, Eddie and Riana Fitzroy. Thank you for
your love, understanding, emotional and financial support and for always being there for me. I appreciate your
patience with me throughout this whole process and for giving me the opportunity to study for such a long
period of time. I love you.
Thank you to everyone in my research group. Ronel Müller, Dr David Kuter and Chandré Sammy. Your
help, ideas and input over these two years are greatly appreciated. My days in the office and laboratory would
not have been so much fun if it was not for all your laughs and great hearts.
Professor Timothy Egan, you are such an inspiration in this field of work and I am so privileged to have
worked with you. Thank you for sharing all of your knowledge and having an input on several aspects of this
work. It was great working with you and the UCT haem group.
Thank you Francois Louw for your support and love throughout my season of writing up my thesis. I would
not have enjoyed it half as much if it was not for your positive encouragement, Godly advice and special treats
throughout. Thank you for believing in me in times when I struggled to believe in myself and for being proud
of me.
My life as a student at Stellenbosch University is incomplete without the amazing friends I made throughout
this season of my life. Carla, Jani, Elaine, Tanica, Lisa, Alet, Megan, Gerstin, Ilze, Leané, Dalene,
Natasha, Candice and Anja – your friendship means the world to me. Also, I special thank you to Andrea
and Tanya.
Thank you to the National Research Foundation (NRF) and National Institute of Health (NIH) for
financially supporting me throughout my post-graduate studies.
Stellenbosch University https://scholar.sun.ac.za
vi
Additional Acknowledgements:
Mr Jonathan B. Hay, from the Stellenbosch University, for synthesizing some of the compounds used in this
study.
Dr Kathryn J. Wicht, from the University of Cape Town, for synthesizing and testing some of the compounds
used in this study.
Mrs Jill M. Combrinck from the University of Cape Town, for testing some of the compounds against parasite
strains.
The De Beers’ technical staff and cleaning assistance for cleaning and maintaining the laboratory.
Prof Marina Rautenbach and the Biochemistry Faculty for providing the oven.
Prof Ben V. Burger for kindly letting me use his laboratory’s sensitive analytical balance.
Dr Gareth E. Arnott and Mr Dominic C. Castell for kindly letting me use their laboratory’s ultrasonic water
bath.
Dr Paul F. M. Verhoeven for kindly letting me use his laboratory’s infrared spectrometer.
Dr Vincent Smith for the use of his laboratory’s analytical powder X-ray diffractometer.
Dr Madelaine Frazenburg for the use of her laboratory’s scanning electron microscope.
Thank you so much. Your assistance is greatly appreciated.
Stellenbosch University https://scholar.sun.ac.za
vii
Conference Proceedings
1. SACI Young Chemists’ Symposium, 2014, University of Cape Town, Cape Town, RSA
Oral Presentation: Sharné Fitzroy and Dr Katherine A. de Villiers, Development towards a High-
Throughput Screen for Kinetic Inhibition of β-Haematin Formation via Adsorption.
2. SACI Inorganic Chemistry Conference 2015, Rhodes University, Grahamstown, RSA
Poster Presentation: Sharné Fitzroy and Dr Katherine A. de Villiers, Development towards a High-
Throughput Screen for Kinetic Inhibition of β-Haematin Formation via Adsorption.
Stellenbosch University https://scholar.sun.ac.za
viii
List of Abbreviations
ACN acetonitrile
ATR-IR attenuated total reflection infrared
AQ amodiaquine
AtQ atovaquone
BHIA50 β-haematin inhibitory activities
CQ chloroquine
CQfb free base chloroquine
CQR chloroquine-resistant strain
CQS chloroquine-sensitive strain
Cl-Fe(III)PPIX haemin
DMSO dimethyl sulfoxide
DV digestive vacuole
EQD 9-epiquinidine
EQN 9-epiquinine
EXAFS extended X-ray adsorption fine structure
Fe(II)PPIX iron (II) protoporphyrin IX, haem
Fe(III)PPIX iron (III) protoporphyrin IX, haematin
FT-IR Fourier-transform infrared
Hb haemoglobin
HDP haem detoxification protein
HEPES N-2-[hydroxyethyl]piperizine-N’-[2-ethanesulfonic acid]
Hf halofantrine
HRP histidine-rich protein
IC50 concentration required of to inhibit 50% of β-haematin formation
Kads adsorption equilibrium constant
k2 rate constant of the proposed precipitation of an inhibitor-haematin complex
MMG monomyristoylglycerol
MOG monooleoylglycerol
MPG monopalmitoylglycerol
Stellenbosch University https://scholar.sun.ac.za
ix
MSG monostearoylglycerol
MQ mefloquine
n Avrami constant
NaOH sodium hydroxide
NLBs neutral lipid bodies
NP40 Nonidet P-40
Pf Plasmodium falciparum
PfCRT P. falciparum CQ-resistance transporter
Pgh1 P-glycoprotein homologue 1
Phiβ pyridine hemichrome inhibition of β-haematin
PXRD powder X-ray diffraction
RBCs red blood cells
SEM scanning electron microscopy
SCD single crystal X-ray diffraction
TEM transmission electron microscopy
QD quinidine
QN quinine
z rate constant in the absence of an inhibitor
zobs observed rate constant
Stellenbosch University https://scholar.sun.ac.za
x
Table of Contents
Declaration i
Abstract ii
Uittreksel iii
Dedication iv
Acknowledgements v
Conference Proceedings vii
List of Abbreviations viii
Chapter 1. Literature Review
1.1 Introduction 1
1.2 Malaria Overview 1
1.2.1 History and Discovery of Malaria 1
1.2.2 Distribution and Statistics of Malaria 2
1.3 The Malaria Parasite 3
1.3.1 The Life Cycle of the Malaria Parasite 3
1.3.2 The Blood Stage of the Parasite’s Life Cycle 4
1.4 Haemozoin 6
1.4.1 Haemozoin Structure and Crystal Morphology 6
1.4.2 Haemozoin Formation In Vivo 9
1.4.2.1 Protein-Facilitated Haemozoin Formation 9
1.4.2.2 Lipid-Facilitated Haemozoin Formation 9
1.4.3 β-Haematin Formation In Vitro 11
1.4.3.1 β-Haematin Formation under Abiotic Conditions 11
1.4.3.2 β-Haematin Formation under Biologically-Relevant Conditions 14
1.4.4 Proposed Mechanisms of Haemozoin Formation 17
1.5 Quinoline Antimalarial Drugs 19
1.5.1 Site of Drug Action 19
Stellenbosch University https://scholar.sun.ac.za
xi
1.5.2 History and Discovery of Quinoline Antimalarial Drugs 20
1.5.3 Quinoline Antimalarial Drug Resistance 21
1.5.4 The possible Mechanisms of Antimalarial Drug Action 22
1.5.4.1 Drug-Fe(III)PPIX Complexation 22
1.5.4.1.1 Quinoline Methanol Complexes with Fe(III)PPIX 22
1.5.4.1.2 4-Aminoquinoline Complexes with Fe(III)PPIX 24
1.5.4.2 Quinoline Interactions with Haemozoin 26
1.5.4.3 The Inhibition of β-Haematin Formation 28
1.5.4.3.1 Pyridine Hemichrome Inhibition of β-Haematin (Phiβ) Assay 28
1.5.4.3.2 The Effect of Quinoline Antimalarial Drugs on the Kinetics of β-Haematin Formation 30
1.6 Aims and Objectives 38
1.6.1 Aims 38
1.6.2 Objectives 38
1.6.3 Proposed Compounds to be Investigated 38
Chapter 2. Materials, Instrumentation and General Methods
2.1 Materials 40
2.2 Instrumentation 41
2.2.1 Analytical Balance 41
2.2.2 Centrifuge 41
2.2.3 High Vacuum Pump 41
2.2.4 Infrared Spectroscopy 41
2.2.5 Magnetic Stirrer Hot Plate 41
2.2.6 Micro Glass Syringes 41
2.2.7 Oven 42
2.2.8 pH Meter 42
2.2.9 Powder X-ray Diffraction 42
2.2.10 Scanning Electron Microscopy 42
2.2.11 Single- and Multi-Channel Micro Pipettes 42
2.2.12 Ultrasonic Water Bath 42
2.2.13 UV Visible Spectroscopy 42
2.2.14 Vortex 43
2.2.15 Water Bath 43
Stellenbosch University https://scholar.sun.ac.za
xii
2.3 Computer Software 43
2.4 General Precautions in Sample Preparations and Handling Washing of Glassware
and Plasticware 44
2.5 General Preparations 44
2.5.1 50.0 mM Stock Solution of Citrate Buffer, pH 4.8 44
2.5.2 1:9 (v/v) Acetone: Methanol Solution 44
2.5.3 0.10 M NaOH Solution 44
2.5.4 2.0 M Stock Solution of HEPES Buffer, pH 7.5 45
2.5.5 3.03 mM Lipid Solution 45
2.5.6 3.16 mM Haematin Solution 45
2.5.7 30:30:40 (v/v) Pyridine: Aqueous Buffer: Acetone Solution 45
2.5.8 0.20 M Stock Solution of HEPES Buffer, pH 7.5 45
2.5.9 5:45:50 (v/v) Pyridine: Aqueous Buffer: Acetone Solution 45
Chapter 3. The Effect of Quinoline Inhibitors on the Formation of β-Haematin at the Lipid-
Water Interface
3.1 Introduction 46
3.2 Optimization of the Phiβ Assay using known Antimalarial Drugs 47
3.2.1 Experimental Methods 47
3.2.1.1 Introducing Antimalarial Drugs into the Aqueous Citrate Buffer 47
3.2.1.2 Antimalarial Drug Activity Studies 47
3.2.1.3 Non-Aqueous Soluble Antimalarial Drugs 49
3.2.1.4 The effect of Incubation Time on Drug IC50 Values 50
3.2.1.5 Antimalarial Drug Kinetics Studies 50
3.2.1.6 Analysis of Kinetics Data 51
3.2.2 Results 52
3.2.2.1 Optimization of Assay 52
3.2.2.2 Antimalarial Drug Activity Studies 55
3.2.2.3 The Effect of Time on Drug IC50 Values 59
3.2.2.4 Antimalarial Drug Kinetics Studies 59
3.2.3 Relationships between Drug Activity and Strength of Adsorption 63
3.3 Extending the System to Other Quinoline-based β-Haematin Inhibitors 64
3.3.1 Experimental Methods 64
Stellenbosch University https://scholar.sun.ac.za
xiii
3.3.1.1 Introducing the Chloroquine Derivatives into the Aqueous Citrate Buffer 64
3.3.1.2 Short-chain CQ Analogue Activity Studies 65
3.3.1.3 Short-chain CQ Analogue Kinetics Studies 65
3.3.2 Results 65
3.3.2.1 Short-chain CQ Analogue Activity Studies 65
3.3.2.2 Short-chain CQ Analogue Kinetics Studies 68
3.4 Combining Quinoline-based β-haematin Inhibitors 71
3.5 Discussion 72
3.6 Conclusion 77
Chapter 4. The Effect of Non-quinoline Inhibitors on the Formation of β-Haematin at the Lipid-
Water Interface
4.1 Introduction 78
4.2 Extending the System to Non-quinoline β-Haematin Inhibitors 79
4.2.1 Experimental Methods 79
4.2.1.1 Introducing Non-quinoline Inhibitors into the Aqueous Citrate Buffer 79
4.2.1.2 Non-quinoline Activity Studies 80
4.2.1.3 Non-quinoline Kinetics Studies 80
4.2.2 Results 80
4.2.2.1 Solubilising Non-quinoline β-Haematin Inhibitors 80
4.2.2.2 Non-quinoline Activity Studies 82
4.2.2.3 Non-quinoline Kinetics Studies 84
4.2.3 Relationships between Drug Activity and Strength of Adsorption 87
4.3 Combining Quinoline- and Non-quinoline-based β-Haematin Inhibitors 88
4.4 Discussion 90
4.5 Conclusion 96
Chapter 5. Independent Adsorption Studies
5.1 Introduction 97
5.2 Experimental Methods 98
5.2.1 β-Haematin Synthesis 98
5.2.1.1 Preparation of β-Haematin at the Lipid-Water Interface 98
Stellenbosch University https://scholar.sun.ac.za
xiv
5.2.1.2 Preparation of β-Haematin at the Pentanol-Water Interface 98
5.2.2 Direct Adsorption studies 99
5.3 Results 100
5.3.1 Characterization of β-Haematin Crystals 100
5.3.2 Direct Adsorption Studies 101
5.3.2.1 Method of Optimization 102
5.3.2.2 Recording Initial UV-visible Spectra 102
5.3.2.3 Beer’s Law Plots 103
5.3.2.4 Explaining the Observed Direct Adsorption Behaviour using the Langmuir Isotherm 105
5.3.2.5 Introducing Atovaquone as a Negative Control in Direct Adsorption Studies 107
5.4 Combining the Kinetic Adsorption Studies to the Direct Adsorption Studies 109
5.5 Discussion 110
5.6 Conclusion 112
Chapter 6. Overall Conclusions and Future Work
6.1 Overall Conclusion 113
6.2 Future Work 114
Chapter 7. References 116
Stellenbosch University https://scholar.sun.ac.za
1
Chapter 1. Literature Review
1.1 Introduction
Malaria is one of the most deadly parasitic human diseases known worldwide and is responsible for over
hundreds of thousands of deaths per year, especially among young children in Africa.1 It is, however, endemic
in several nations, affecting millions of people annually, and is notably a contributor to economic
underdevelopment in some of these countries. Malaria is one of few diseases which can be viewed as both a
cause and a consequence of poverty, owing to its highest distribution in underprivileged regions and billions
of US dollars spent annually on malaria control and elimination.1 The malaria parasite, Plasmodium
falciparum, which is the primary causative agent of human malaria, has over the years started to demonstrate
increasing resistance towards antimalarial drugs.1 Consequently, the development of novel chemotherapeutic
agents has become of high importance, since malaria remains a great global health problem. Unfortunately,
the mechanism of action of the majority of clinically-relevant antimalarial drugs is still not fully understood
and this has motivated research in this area.
1.2 Malaria Overview
1.2.1 History and Discovery of Malaria
Malaria is an ancient disease which dates as far back as early 2700 BC.2 In about 400 BC, Hippocrates was
aware of the poor health, enlarged spleens and fevers amongst local populations living in marshy places, and
was the first to make a connection between these symptoms.3 Owing to the relationship between these observed
symptoms and marshy environments, the word malaria was derived from the Italian word “mal’aria”, meaning
“bad air”.4
This idea that malaria fevers were caused by miasmas rising from swamps continued for over 2500 years and
the search for the cause of malaria intensified over the years after the discovery of bacteria in 1676, and the
incrimination of microorganisms as causes of infectious diseases.3 In 1717, Giovanni Maria Lancisi discovered
a brown-black pigment in the blood of patients affected by malaria.5 The search for the cause of the disease
was an ongoing process and increased over the years until the first scientific study by Charles Louis Alphonse
Laveran in the 1880s. Lavern discovered the etiological agent of malaria, the malaria parasite, and identified
pigments in the body of living parasites in 26 patients.6,7 The idea that mosquitoes might be associated with
malaria was first suggested by the American physician, Albert King,8 and was studied further by the British
scientist, Patrick Manson, who was convinced that mosquitoes were involved in malaria transmission (he based
Stellenbosch University https://scholar.sun.ac.za
2
this on his early findings that mosquitoes could transmit filarial worms responsible for lymphatic filariasis).9
In 1897, Sir Ronald Ross discovered that the avian malaria parasite, Plasmodium relictum, was transmitted by
culicine mosquitoes, and suggested that mosquitoes also transmit human malaria parasites.10 It was, however,
during the period 1898-1900, that various Italian scientists, namely Giovanni Battista Grassi, Amico Bignami
and Giuseppe Bastianelli, were able to conclusively demonstrate that human malaria parasites were indeed
transmitted by female Anopheles mosquitoes.11
1.2.2 Distribution and Statistics of Malaria
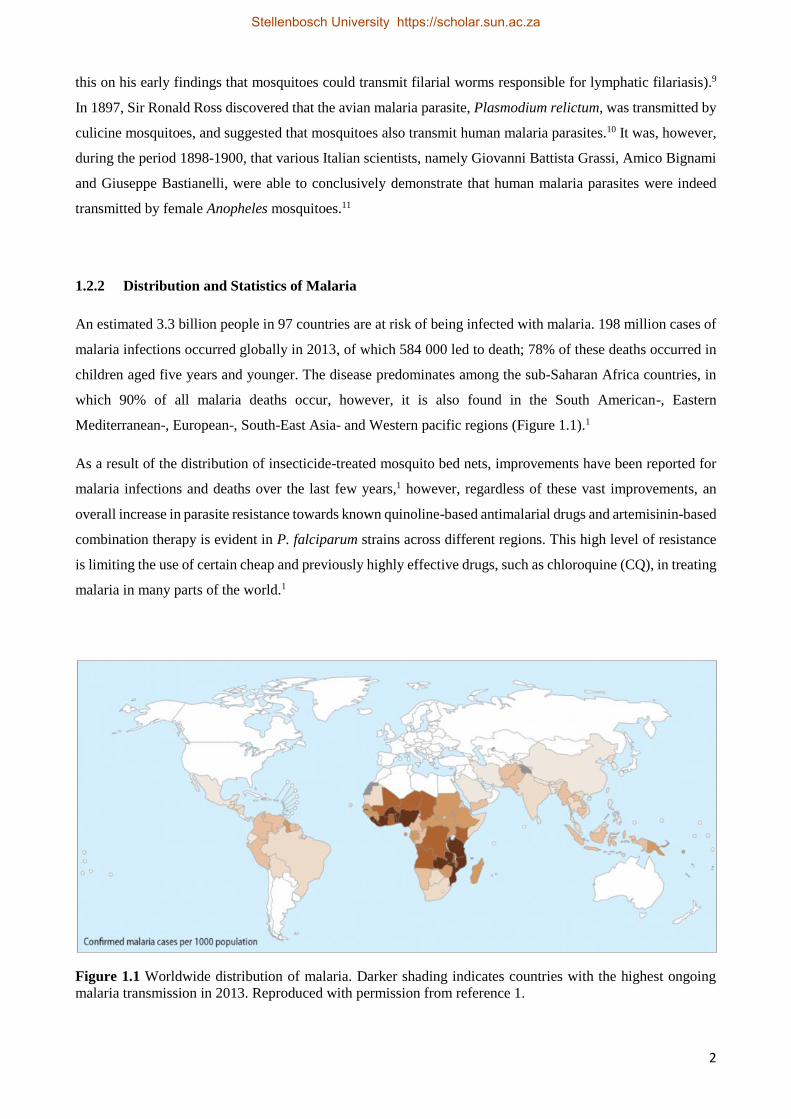
An estimated 3.3 billion people in 97 countries are at risk of being infected with malaria. 198 million cases of
malaria infections occurred globally in 2013, of which 584 000 led to death; 78% of these deaths occurred in
children aged five years and younger. The disease predominates among the sub-Saharan Africa countries, in
which 90% of all malaria deaths occur, however, it is also found in the South American-, Eastern
Mediterranean-, European-, South-East Asia- and Western pacific regions (Figure 1.1).1
As a result of the distribution of insecticide-treated mosquito bed nets, improvements have been reported for
malaria infections and deaths over the last few years,1 however, regardless of these vast improvements, an
overall increase in parasite resistance towards known quinoline-based antimalarial drugs and artemisinin-based
combination therapy is evident in P. falciparum strains across different regions. This high level of resistance
is limiting the use of certain cheap and previously highly effective drugs, such as chloroquine (CQ), in treating
malaria in many parts of the world.1
Figure 1.1 Worldwide distribution of malaria. Darker shading indicates countries with the highest ongoing
malaria transmission in 2013. Reproduced with permission from reference 1.
Stellenbosch University https://scholar.sun.ac.za
3
1.3 The Malaria Parasite
1.3.1 The Life Cycle of the Malaria Parasite
Malaria is caused by five species of protozoan parasites belonging to the genus Plasmodium, of which four of
these species are infectious to humans: P. falciparum, P. ovale, P. vivax and P. malariae,12 while the fifth
parasite species, P. knowlesi, causes malaria mainly among monkeys in certain areas of South-East Asia.1 Of
these species, P. falciparum and P. vivax are the most virulent, with the former being responsible for the
majority of deaths from malaria.1,13 P. falciparum predominates in the African regions, while P. vivax has a
geographically wider distribution, owing to its ability to survive at lower temperatures and in regions with
higher altitudes and cooler climates.1
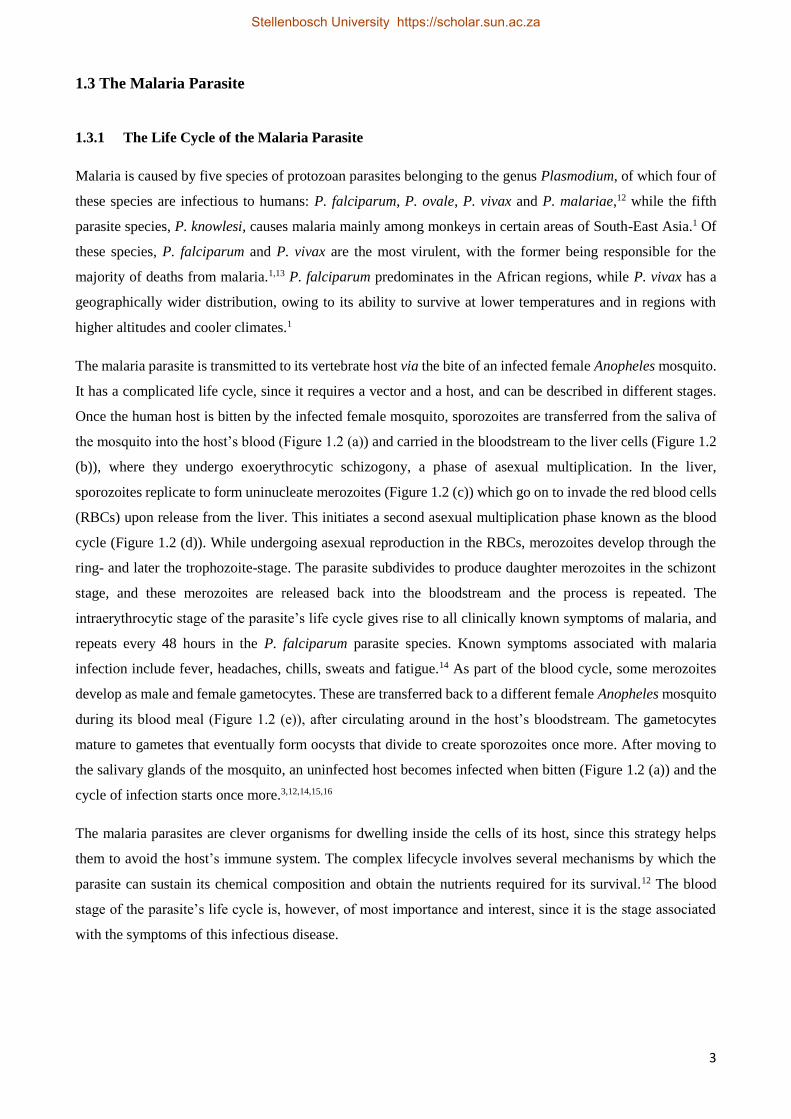
The malaria parasite is transmitted to its vertebrate host via the bite of an infected female Anopheles mosquito.
It has a complicated life cycle, since it requires a vector and a host, and can be described in different stages.
Once the human host is bitten by the infected female mosquito, sporozoites are transferred from the saliva of
the mosquito into the host’s blood (Figure 1.2 (a)) and carried in the bloodstream to the liver cells (Figure 1.2
(b)), where they undergo exoerythrocytic schizogony, a phase of asexual multiplication. In the liver,
sporozoites replicate to form uninucleate merozoites (Figure 1.2 (c)) which go on to invade the red blood cells
(RBCs) upon release from the liver. This initiates a second asexual multiplication phase known as the blood
cycle (Figure 1.2 (d)). While undergoing asexual reproduction in the RBCs, merozoites develop through the
ring- and later the trophozoite-stage. The parasite subdivides to produce daughter merozoites in the schizont
stage, and these merozoites are released back into the bloodstream and the process is repeated. The
intraerythrocytic stage of the parasite’s life cycle gives rise to all clinically known symptoms of malaria, and
repeats every 48 hours in the P. falciparum parasite species. Known symptoms associated with malaria
infection include fever, headaches, chills, sweats and fatigue.14 As part of the blood cycle, some merozoites
develop as male and female gametocytes. These are transferred back to a different female Anopheles mosquito
during its blood meal (Figure 1.2 (e)), after circulating around in the host’s bloodstream. The gametocytes
mature to gametes that eventually form oocysts that divide to create sporozoites once more. After moving to
the salivary glands of the mosquito, an uninfected host becomes infected when bitten (Figure 1.2 (a)) and the
cycle of infection starts once more.3,12,14,15,16
The malaria parasites are clever organisms for dwelling inside the cells of its host, since this strategy helps
them to avoid the host’s immune system. The complex lifecycle involves several mechanisms by which the
parasite can sustain its chemical composition and obtain the nutrients required for its survival.12 The blood
stage of the parasite’s life cycle is, however, of most importance and interest, since it is the stage associated
with the symptoms of this infectious disease.
Stellenbosch University https://scholar.sun.ac.za
4
Figure 1.2 The complex life cycle of a malaria parasite, Plasmodium falciparum. Reproduced with permission
from reference 16.
1.3.2 The Blood Stage of the Parasite’s Life Cycle
After entering the RBCs of the host in the blood stage of the parasite’s life cycle, the parasite grows and
matures while surrounded by cytosol, mainly consisting of haemoglobin (Hb).17 Hb is a convenient source of
amino acids. At least 65% of Hb present in the RBC cytoplasm is degraded to peptide fragments by multiple
proteases18 within an acidic compartment known as the digestive vacuole (DV) within the parasite (pH 4.8).19
Some of these parasite proteases, important for Hb proteolysis, include different acidic proteases, aspartic
proteases, a cysteine protease and a zinc metallo-protease.17,20,21,22,23 Only a fraction of amino acids derived
from Hb proteolysis are needed for the biosynthesis of parasite proteins, which provide a source of nutrition
for normal parasite growth and development.17,18 The rest of the Hb is subsequently degraded to make space
for parasite growth.
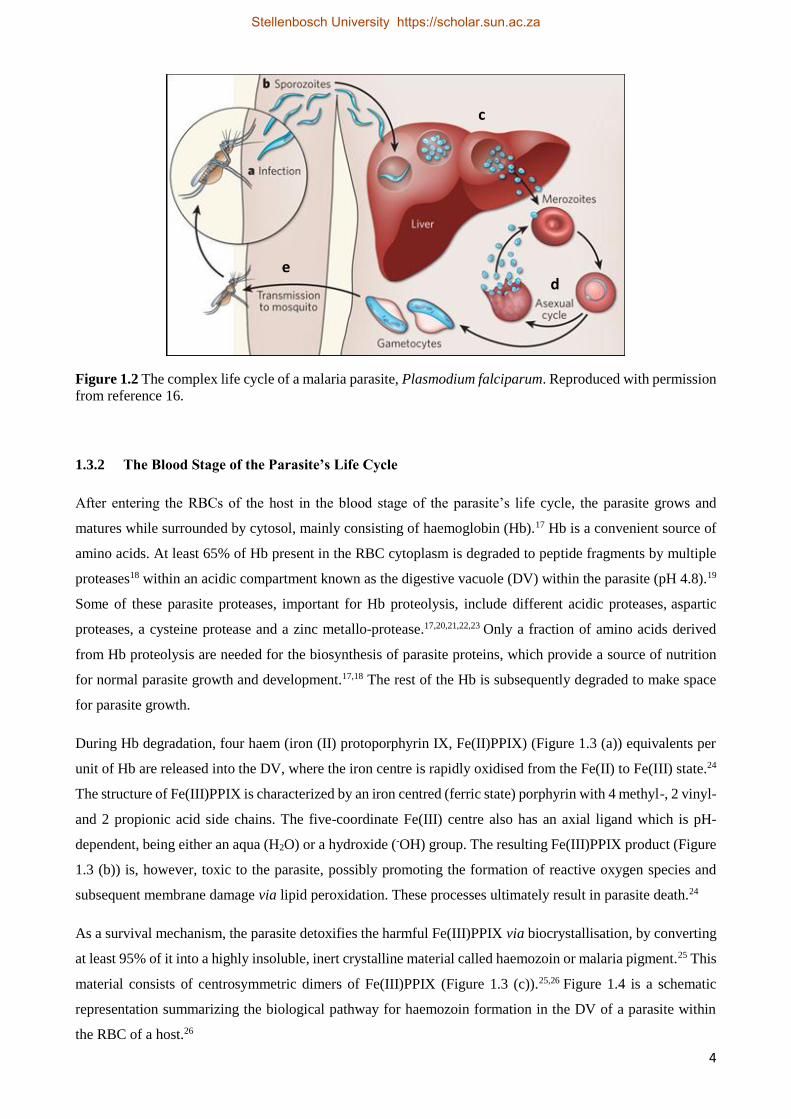
During Hb degradation, four haem (iron (II) protoporphyrin IX, Fe(II)PPIX) (Figure 1.3 (a)) equivalents per
unit of Hb are released into the DV, where the iron centre is rapidly oxidised from the Fe(II) to Fe(III) state.24
The structure of Fe(III)PPIX is characterized by an iron centred (ferric state) porphyrin with 4 methyl-, 2 vinyl-
and 2 propionic acid side chains. The five-coordinate Fe(III) centre also has an axial ligand which is pH-
dependent, being either an aqua (H2O) or a hydroxide (-OH) group. The resulting Fe(III)PPIX product (Figure
1.3 (b)) is, however, toxic to the parasite, possibly promoting the formation of reactive oxygen species and
subsequent membrane damage via lipid peroxidation. These processes ultimately result in parasite death.24
As a survival mechanism, the parasite detoxifies the harmful Fe(III)PPIX via biocrystallisation, by converting
at least 95% of it into a highly insoluble, inert crystalline material called haemozoin or malaria pigment.25 This
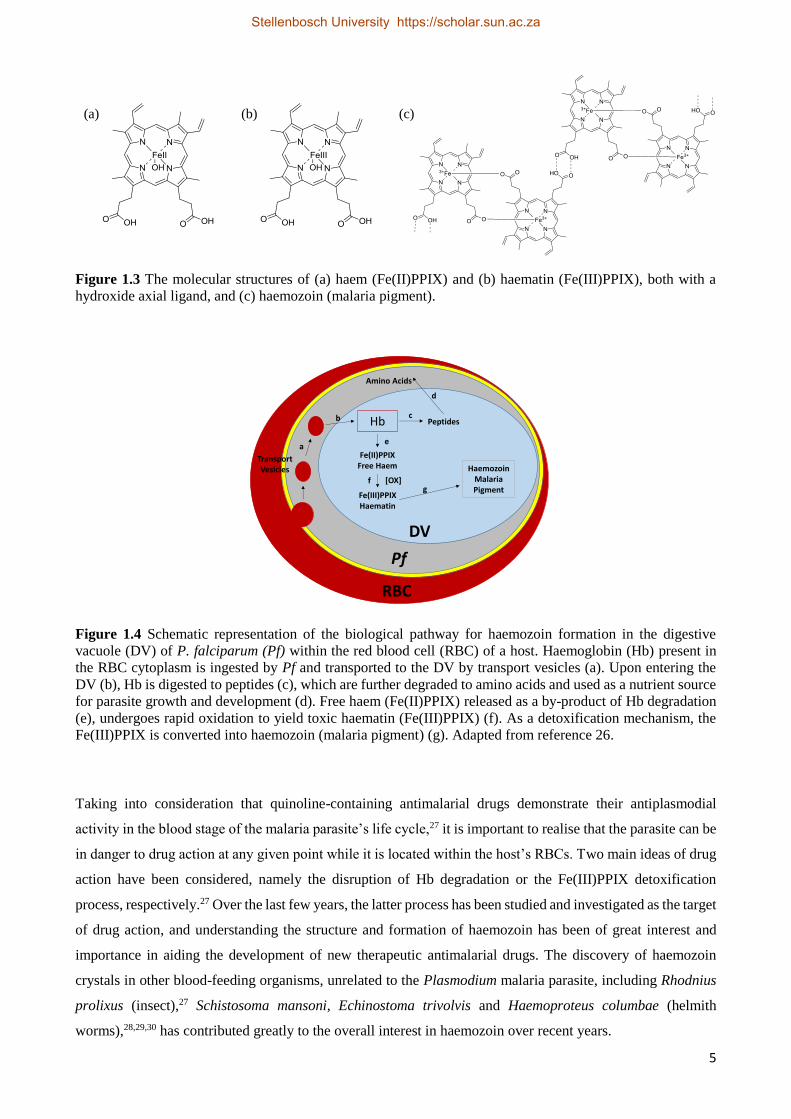
material consists of centrosymmetric dimers of Fe(III)PPIX (Figure 1.3 (c)).25,26 Figure 1.4 is a schematic
representation summarizing the biological pathway for haemozoin formation in the DV of a parasite within
the RBC of a host.26
c
de
Stellenbosch University https://scholar.sun.ac.za
5
Figure 1.3 The molecular structures of (a) haem (Fe(II)PPIX) and (b) haematin (Fe(III)PPIX), both with a
hydroxide axial ligand, and (c) haemozoin (malaria pigment).
Figure 1.4 Schematic representation of the biological pathway for haemozoin formation in the digestive
vacuole (DV) of P. falciparum (Pf) within the red blood cell (RBC) of a host. Haemoglobin (Hb) present in
the RBC cytoplasm is ingested by Pf and transported to the DV by transport vesicles (a). Upon entering the
DV (b), Hb is digested to peptides (c), which are further degraded to amino acids and used as a nutrient source
for parasite growth and development (d). Free haem (Fe(II)PPIX) released as a by-product of Hb degradation
(e), undergoes rapid oxidation to yield toxic haematin (Fe(III)PPIX) (f). As a detoxification mechanism, the
Fe(III)PPIX is converted into haemozoin (malaria pigment) (g). Adapted from reference 26.
Taking into consideration that quinoline-containing antimalarial drugs demonstrate their antiplasmodial
activity in the blood stage of the malaria parasite’s life cycle,27 it is important to realise that the parasite can be
in danger to drug action at any given point while it is located within the host’s RBCs. Two main ideas of drug
action have been considered, namely the disruption of Hb degradation or the Fe(III)PPIX detoxification
process, respectively.27 Over the last few years, the latter process has been studied and investigated as the target
of drug action, and understanding the structure and formation of haemozoin has been of great interest and
importance in aiding the development of new therapeutic antimalarial drugs. The discovery of haemozoin
crystals in other blood-feeding organisms, unrelated to the Plasmodium malaria parasite, including Rhodnius
prolixus (insect),27 Schistosoma mansoni, Echinostoma trivolvis and Haemoproteus columbae (helmith
worms),28,29,30 has contributed greatly to the overall interest in haemozoin over recent years.
(a) (b) (c)
RBC
Pf
DV
Hb
Fe(II)PPIXFree Haem
Fe(III)PPIXHaematin
[OX]
Peptides
Amino Acids
HaemozoinMalaria Pigment
TransportVesicles
a
b c
d
e
fg
Stellenbosch University https://scholar.sun.ac.za
6
1.4 Haemozoin
The first discovery of haemozoin dates back close to 150 years before the discovery of the malaria parasite. In
the 18th century, Giovanni Maria Lancisi observed a black discolouration in the brains of cadavers of malaria
victims.5 Later, Johann Heinrich Meckel, a German physician, rediscovered the malaria pigment in 1847,31
while Rudolf Virchow was the first to relate the presence of the pigment to malaria in 1849.32 Initially the
malaria pigment was believed to be melanin, however, W. H. Brown demonstrated that the chromophore
responsible for the pigment’s brown-black colour, is in fact haem.33 For almost 80 years, no significant
discoveries were made regarding haemozoin, until 1987, when Fitch and Kanjananggulpan demonstrated that
haemozoin is comprised entirely of ferriprotoporphyrin IX (Fe(III)PPIX).34 In 1991, it was Slater and co-
workers who published a ground-breaking paper in which they confirmed Fitch and Kanjananggulpan’s
findings, and explained the chemical composition of haemozoin by elemental analysis.35 This paper forms the
basis of our understanding of haemozoin, however, numerous controversies have existed regarding its
proposed structure.
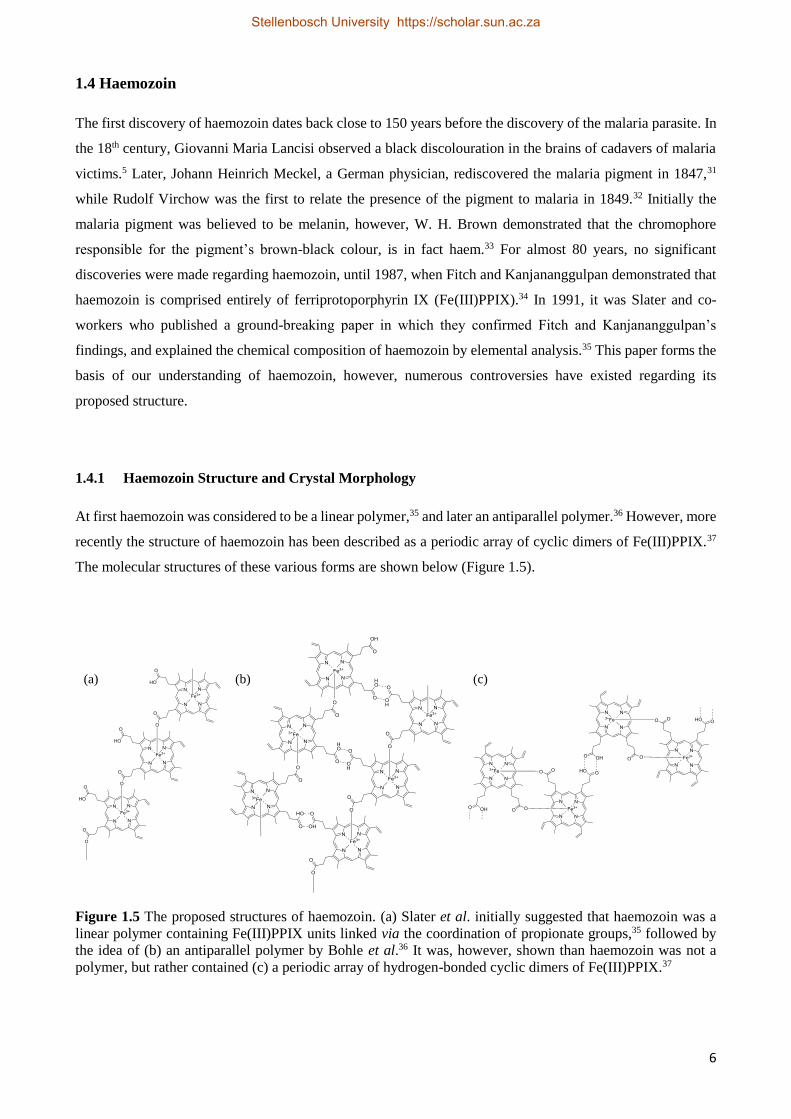
1.4.1 Haemozoin Structure and Crystal Morphology
At first haemozoin was considered to be a linear polymer,35 and later an antiparallel polymer.36 However, more
recently the structure of haemozoin has been described as a periodic array of cyclic dimers of Fe(III)PPIX.37
The molecular structures of these various forms are shown below (Figure 1.5).
Figure 1.5 The proposed structures of haemozoin. (a) Slater et al. initially suggested that haemozoin was a
linear polymer containing Fe(III)PPIX units linked via the coordination of propionate groups,35 followed by
the idea of (b) an antiparallel polymer by Bohle et al.36 It was, however, shown than haemozoin was not a
polymer, but rather contained (c) a periodic array of hydrogen-bonded cyclic dimers of Fe(III)PPIX.37
(a) (b) (c)
Stellenbosch University https://scholar.sun.ac.za
7
A synthetic product of Fe(III)PPIX, called β-haematin, precipitated from an aqueous solution with acetic acid,
was first discovered and described in the 1930s by Hamsik, enabling the earliest study of the formation of
haemozoin in vitro.38 The haemozoin isolated by Fitch and Kanjananggulpan was suggested to be identical to
this insoluble aggregate,34 and solubilisation, infrared spectroscopy and powder X-ray diffraction (PXRD)
studies by Slater et al. indeed confirmed this observation.35 The authors initially proposed that haemozoin (and
β-haematin) was a linear polymer, containing Fe(III)PPIX units linked via the coordination of a propionate
group of one molecule to the iron centre of an adjacent monomer (Figure 1.5 (a)), which they concluded using
extended X-ray adsorption fine structure (EXAFS) spectroscopy.35 EXAFS was used to investigate the local
environment of iron in haemozoin by identifying both the type and the distance of each shell of atoms around
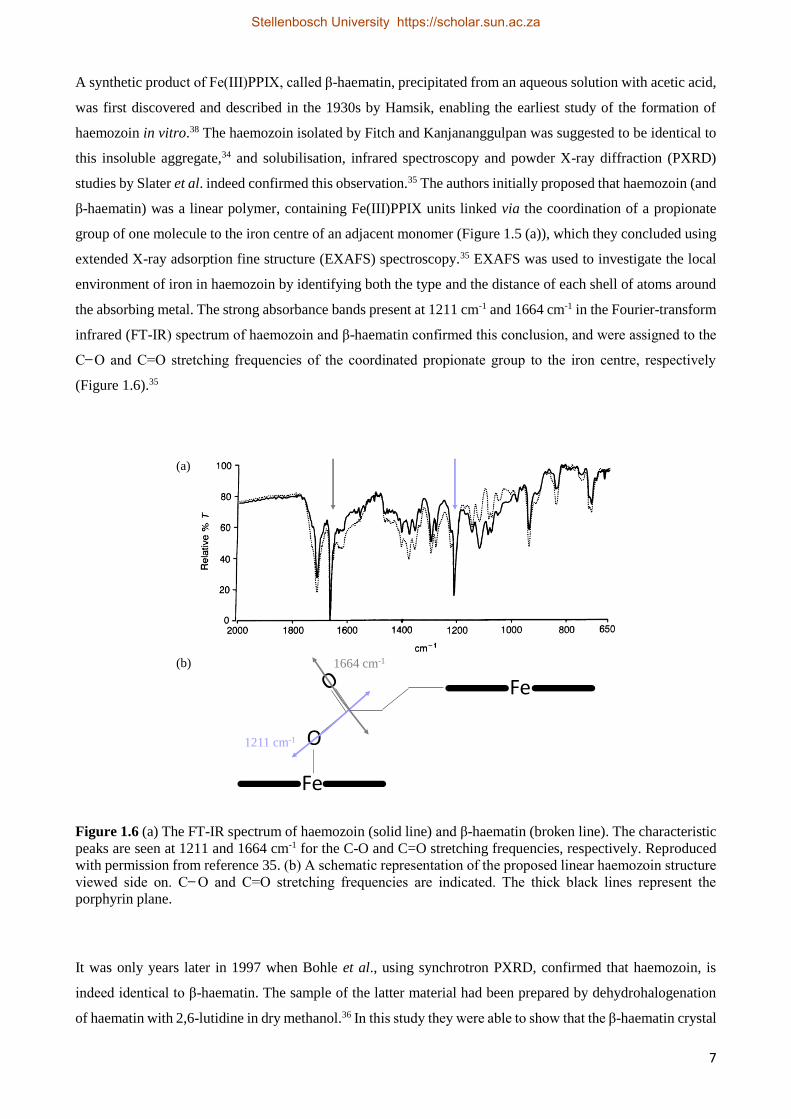
the absorbing metal. The strong absorbance bands present at 1211 cm-1 and 1664 cm-1 in the Fourier-transform
infrared (FT-IR) spectrum of haemozoin and β-haematin confirmed this conclusion, and were assigned to the
C ̶ O and C=O stretching frequencies of the coordinated propionate group to the iron centre, respectively
(Figure 1.6).35
Figure 1.6 (a) The FT-IR spectrum of haemozoin (solid line) and β-haematin (broken line). The characteristic
peaks are seen at 1211 and 1664 cm-1 for the C-O and C=O stretching frequencies, respectively. Reproduced
with permission from reference 35. (b) A schematic representation of the proposed linear haemozoin structure
viewed side on. C ̶ O and C=O stretching frequencies are indicated. The thick black lines represent the
porphyrin plane.
It was only years later in 1997 when Bohle et al., using synchrotron PXRD, confirmed that haemozoin, is
indeed identical to β-haematin. The sample of the latter material had been prepared by dehydrohalogenation
of haematin with 2,6-lutidine in dry methanol.36 In this study they were able to show that the β-haematin crystal
Fe
O
Fe1664 cm-1
1211 cm-1
(a)
(b)
Stellenbosch University https://scholar.sun.ac.za
8
belongs to the centrosymmetric space group P1, and hence proposed that the structure of haemozoin (and β-
haematin) was comprised of two antiparallel polymer chains linked to each other via hydrogen bonds (Figure
1.5 (b)).36 Knowledge of the haemozoin crystal structure has progressed over time, and in 2000, Pagola et al.
finally solved the structure of β-haematin from high resolution synchrotron PXRD patterns using Rietveld
refinement.37 The outcome, however, indicated that β-haematin was a crystal formed of discrete cyclic dimers
of Fe(III)PPIX, rather than a polymer. It was shown that the propionate group of each Fe(III)PPIX molecule
is coordinated to the iron centre of another molecule, while neighbouring dimers are connected by hydrogen
bonds between the uncoordinated propionic acids groups (Figure 1.5 (c)).37
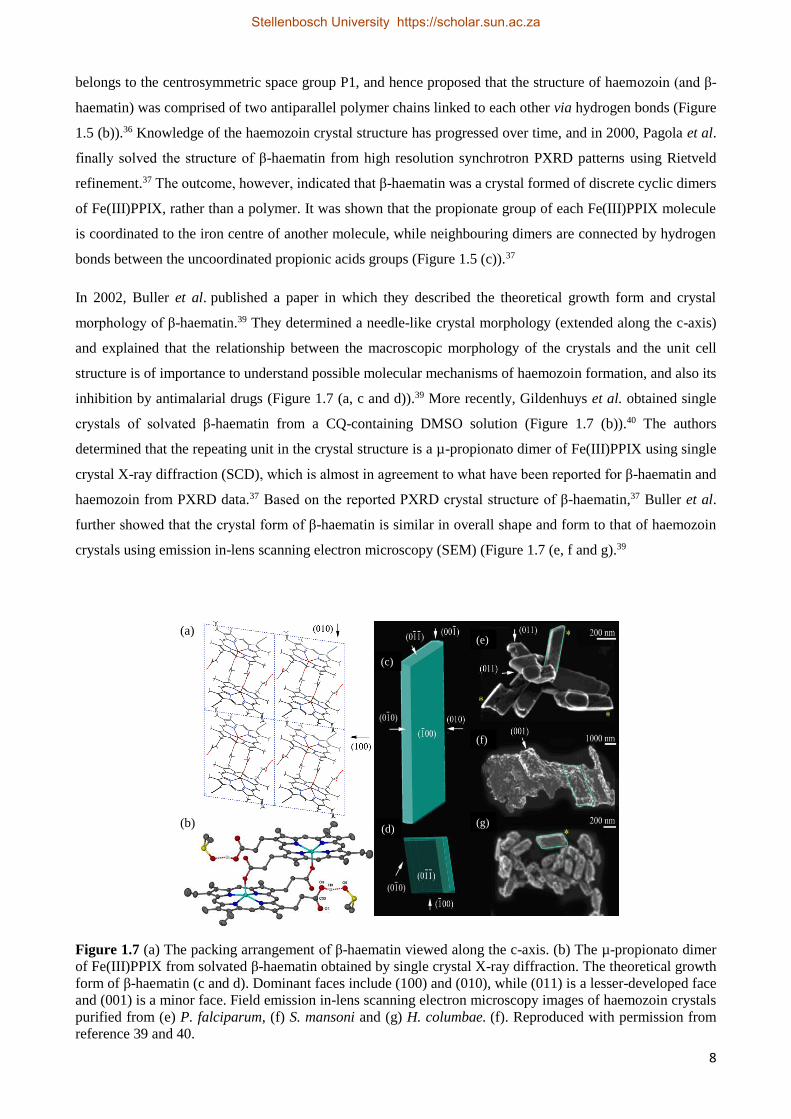
In 2002, Buller et al. published a paper in which they described the theoretical growth form and crystal
morphology of β-haematin.39 They determined a needle-like crystal morphology (extended along the c-axis)
and explained that the relationship between the macroscopic morphology of the crystals and the unit cell
structure is of importance to understand possible molecular mechanisms of haemozoin formation, and also its
inhibition by antimalarial drugs (Figure 1.7 (a, c and d)).39 More recently, Gildenhuys et al. obtained single
crystals of solvated β-haematin from a CQ-containing DMSO solution (Figure 1.7 (b)).40 The authors
determined that the repeating unit in the crystal structure is a µ-propionato dimer of Fe(III)PPIX using single
crystal X-ray diffraction (SCD), which is almost in agreement to what have been reported for β-haematin and
haemozoin from PXRD data.37 Based on the reported PXRD crystal structure of β-haematin,37 Buller et al.
further showed that the crystal form of β-haematin is similar in overall shape and form to that of haemozoin
crystals using emission in-lens scanning electron microscopy (SEM) (Figure 1.7 (e, f and g).39
Figure 1.7 (a) The packing arrangement of β-haematin viewed along the c-axis. (b) The µ-propionato dimer
of Fe(III)PPIX from solvated β-haematin obtained by single crystal X-ray diffraction. The theoretical growth
form of β-haematin (c and d). Dominant faces include (100) and (010), while (011) is a lesser-developed face
and (001) is a minor face. Field emission in-lens scanning electron microscopy images of haemozoin crystals
purified from (e) P. falciparum, (f) S. mansoni and (g) H. columbae. (f). Reproduced with permission from
reference 39 and 40.
(c)
(d)
(e)
(f)
(g)
(a)
(b)
Stellenbosch University https://scholar.sun.ac.za
9
1.4.2 Haemozoin Formation In Vivo
Haemozoin formation is a very effective method of Fe(III)PPIX detoxification, however, there is still much
uncertainty regarding the mechanism of its formation. While it is believed that haemozoin formation occurs
via a biocrystallisation process,41 there is controversy surrounding whether proteins or lipids facilitate its
formation.
1.4.2.1 Protein-Facilitated Haemozoin Formation
The proposal that proteins contribute to the formation of haemozoin dates back to when it was still considered
to be a polymer. Sullivan et al. showed that histidine-rich protein (HRP) II, which is plentiful in P. falciparum,
promoted haemozoin formation, and they proposed that HRP II may be responsible for initiating or catalysing
haemozoin formation in the malaria parasite.42 HRP II has further been shown to bind to Fe(III)PPIX43,44 and
later in 1999, Ziegler et al. indicated that a dendrimer, comprised of the long peptide repeat unit of HRP II
(His-His-Ala-His-His-Ala-Ala-Asp) also promoted β-haematin and suggested that this specific peptide
sequence may represent a biomineralising template.45 In 2001, Papalexis et al. continued to study the role of
HRPs and discovered using confocal immunofluorescence labelling of HRP II, that this protein is indeed
present in the DV of the parasite, however, it is mainly localised in the RBC cytoplasm.46 This observation
was confirmed when only 3% of HRPII was located in the DV,47 suggesting that the concentration of HRPII
is too low to support haemozoin formation alone. The role of HRP in the formation of haemozoin was
ultimately ruled out when it was later demonstrated that haemozoin formation occurred normally in a P.
falciparum clone that lacked both genes for HRP II and HRP III.48 Furthermore, no HRP homologues have
been recognized in P. vivax or P. berghei, both malaria parasites being able to produce haemozoin.49 More
recently, Chugh et al. reported the presence of a protein complex containing several parasite proteins such as
plasmepsin II and IV, histo-aspartic protease, falcipain 2 and most importantly, haem-detoxification protein
(HDP), within the DV.50 The authors developed an in vitro assay in which they showed that falcipain 2 and
HDP coexist with one another to convert haem to haemozoin. Earlier in 1995, however, Dorn et al. reported
that the parasite factor responsible for promoting β-haematin formation was not deactivated by boiling or
protease activity and that both haemozoin and preformed β-haematin support β-haematin formation in the
absence of proteins.51
1.4.2.2 Lipid-Facilitated Haemozoin Formation
Compared to the fading evidence for the contribution of HRP in haemozoin formation, the role that lipids play
in the detoxification process has been expanding substantially since early studies on their possible
involvement.52,53 Fitch et al. performed a study where they investigated purified lipids, and showed that 70%
of the initial β-haematin activity present in parasite-infected erythrocytes could be recovered from chloroform
extraction, with no activity remaining in the residue.54 They found that several unsaturated fatty acids, mono-
Stellenbosch University https://scholar.sun.ac.za
10
and dioleoylglycerol and a few detergents promoted β-haematin formation, while lipids incapable of β-
haematin formation included trioleoylglycerol, cholesterol, dioleoylphosphatidylethanolamin, and both
palmitic and stearic saturated fatty acids. The authors further proposed that the lipids play a role in haemozoin
formation by co-precipitation with monomeric Fe(III)PPIX in the acidic DV, converting dissolved Fe(III)PPIX
in the lipid into haemozoin.54
More recent studies in the last decade have suggested the role of neutral lipid bodies (NLBs) within the DV,
after Jackson et al. investigated NLBs in P. falciparum by means of fluorescence microscopy (using Nile Red
labelling) and transmission electron microscopy (TEM).55 These NLBs were shown to contain mainly mono-
and diacylglycerols, while a series of these, including triacylglycerols, were found to promote β-haematin
formation. Shortly after this discovery, Coppens and Vielemeyer studied NLBs in apicomplexa and published
for the first time a TEM image of a malaria parasite stained with malachite green (a substance which is used
to fix neutral lipids), which indicated that haemozoin located in the DV is entirely encapsulated within a NLB
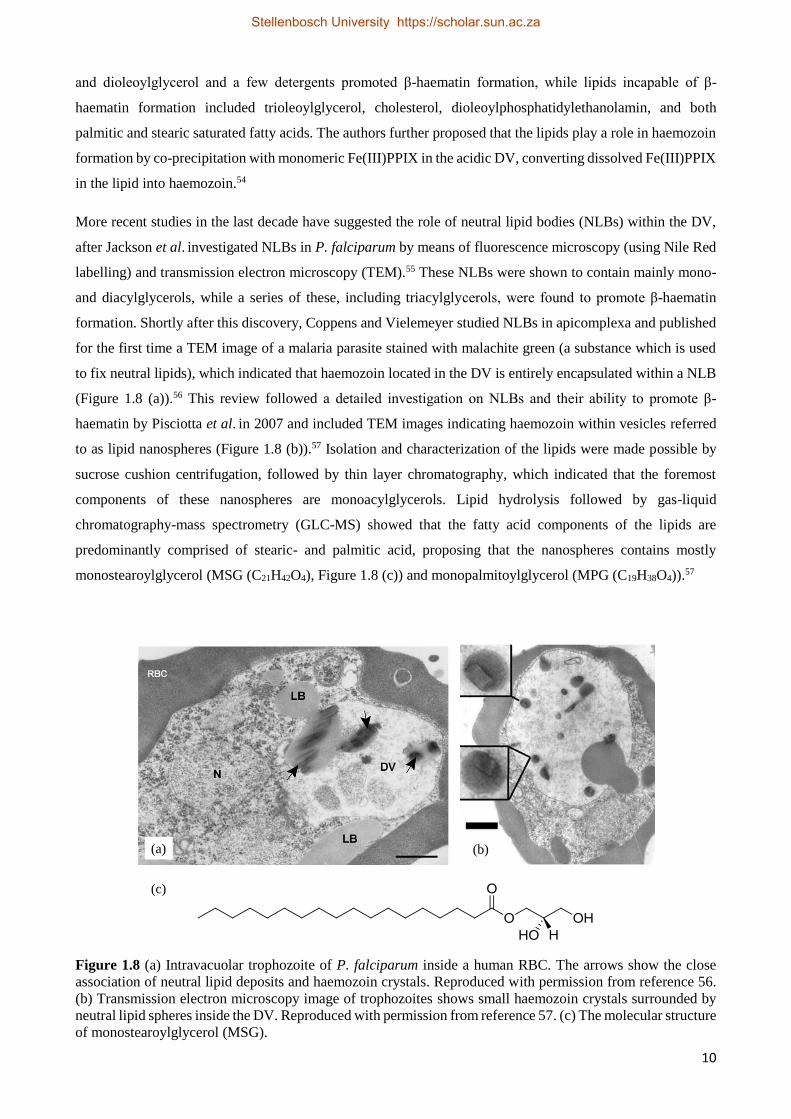
(Figure 1.8 (a)).56 This review followed a detailed investigation on NLBs and their ability to promote β-
haematin by Pisciotta et al. in 2007 and included TEM images indicating haemozoin within vesicles referred
to as lipid nanospheres (Figure 1.8 (b)).57 Isolation and characterization of the lipids were made possible by
sucrose cushion centrifugation, followed by thin layer chromatography, which indicated that the foremost
components of these nanospheres are monoacylglycerols. Lipid hydrolysis followed by gas-liquid
chromatography-mass spectrometry (GLC-MS) showed that the fatty acid components of the lipids are
predominantly comprised of stearic- and palmitic acid, proposing that the nanospheres contains mostly
monostearoylglycerol (MSG (C21H42O4), Figure 1.8 (c)) and monopalmitoylglycerol (MPG (C19H38O4)).57
Figure 1.8 (a) Intravacuolar trophozoite of P. falciparum inside a human RBC. The arrows show the close
association of neutral lipid deposits and haemozoin crystals. Reproduced with permission from reference 56.
(b) Transmission electron microscopy image of trophozoites shows small haemozoin crystals surrounded by
neutral lipid spheres inside the DV. Reproduced with permission from reference 57. (c) The molecular structure
of monostearoylglycerol (MSG).
(a) (b)
(c)
Stellenbosch University https://scholar.sun.ac.za
11
The association between haemozoin formation and lipids has further been established in other haemozoin
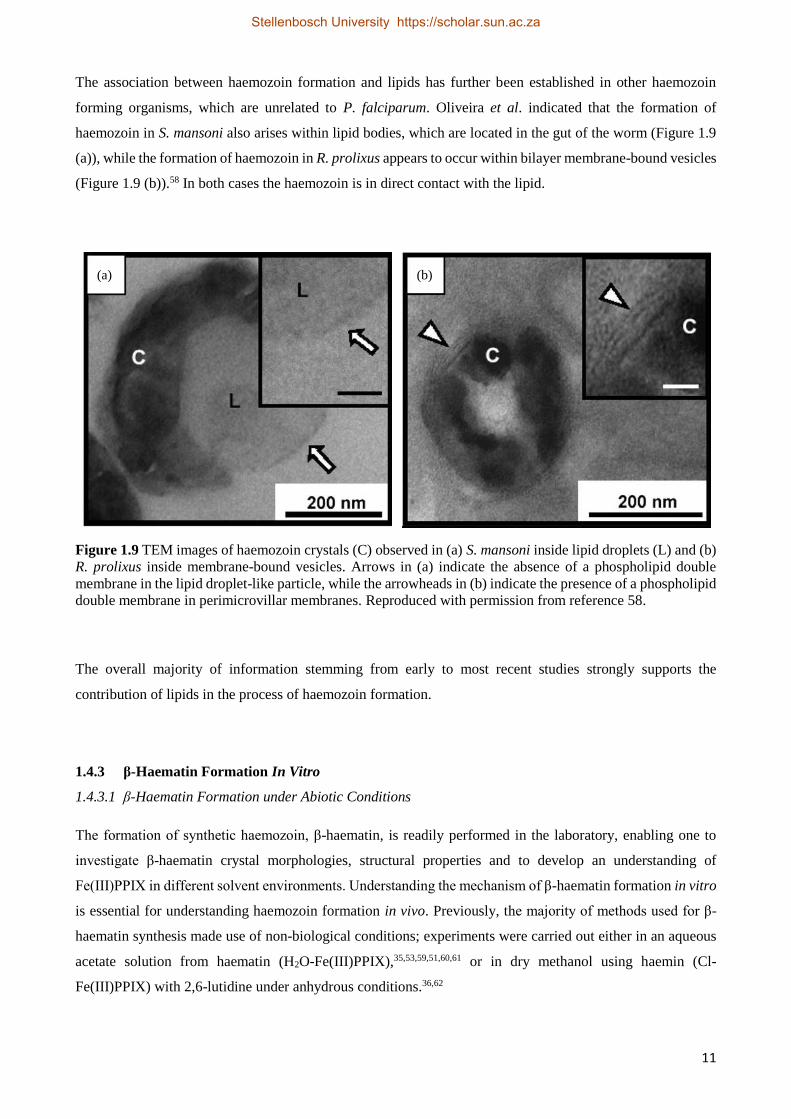
forming organisms, which are unrelated to P. falciparum. Oliveira et al. indicated that the formation of
haemozoin in S. mansoni also arises within lipid bodies, which are located in the gut of the worm (Figure 1.9
(a)), while the formation of haemozoin in R. prolixus appears to occur within bilayer membrane-bound vesicles
(Figure 1.9 (b)).58 In both cases the haemozoin is in direct contact with the lipid.
Figure 1.9 TEM images of haemozoin crystals (C) observed in (a) S. mansoni inside lipid droplets (L) and (b)
R. prolixus inside membrane-bound vesicles. Arrows in (a) indicate the absence of a phospholipid double
membrane in the lipid droplet-like particle, while the arrowheads in (b) indicate the presence of a phospholipid
double membrane in perimicrovillar membranes. Reproduced with permission from reference 58.
The overall majority of information stemming from early to most recent studies strongly supports the
contribution of lipids in the process of haemozoin formation.
1.4.3 β-Haematin Formation In Vitro
1.4.3.1 β-Haematin Formation under Abiotic Conditions
The formation of synthetic haemozoin, β-haematin, is readily performed in the laboratory, enabling one to
investigate β-haematin crystal morphologies, structural properties and to develop an understanding of
Fe(III)PPIX in different solvent environments. Understanding the mechanism of β-haematin formation in vitro
is essential for understanding haemozoin formation in vivo. Previously, the majority of methods used for β-
haematin synthesis made use of non-biological conditions; experiments were carried out either in an aqueous
acetate solution from haematin (H2O-Fe(III)PPIX),35,53,59,51,60,61 or in dry methanol using haemin (Cl-
Fe(III)PPIX) with 2,6-lutidine under anhydrous conditions.36,62
(a) (b)
Stellenbosch University https://scholar.sun.ac.za
12
In 1991, Slater et al. synthesized β-haematin by dissolving haematin in 0.1 M sodium hydroxide (NaOH) and
precipitating the porphyrin by the addition of acetic acid.35 The reaction was run overnight at 70 °C, after
which the precipitate was washed multiple times with distilled water. The β-haematin crystals were
characterised by FT-IR and EXAFS spectroscopy, as well as PXRD. The first study in which the time course
of β-haematin formation was reported was carried out by Adams et al. in 1996.63 The authors monitored the
progress of β-haematin formation at 60 °C in 4.5 M sodium acetate, pH 4.5, using Mössbauer spectroscopy.
The results appeared to show that β-haematin formation is a zero-order process, continuing at a constant rate
until completion.
In 2001, Egan et al. investigated the formation of β-haematin in a detailed study, using quantitative infrared
spectroscopy, X-ray diffraction, SEM and TEM, to probe the parallel between haemozoin formation and
biomineralisation processes.64 The authors reported a method in which β-haematin was formed in less than an
hour at 60 °C in 4.5 M acetate buffer, pH 4.5. The authors further investigated the kinetics of β-haematin
formation and reported that the sigmoidal time dependence of formation could be accounted for by fitting the
experimental data to the Avrami equation (Equation 1.1). The Avrami equation describes crystallization
kinetics, and explains the transformation of solid materials from one phase into another at constant temperature
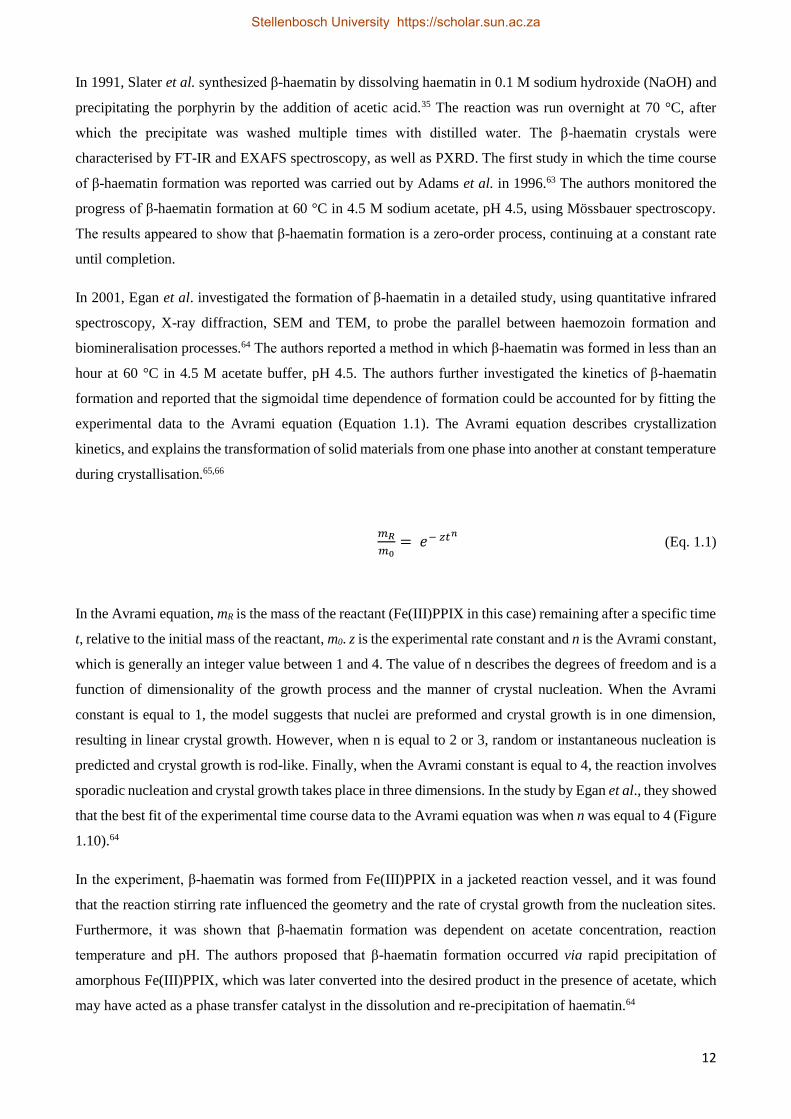
during crystallisation.65,66
𝑚𝑅
𝑚0= 𝑒− 𝑧𝑡𝑛
(Eq. 1.1)
In the Avrami equation, mR is the mass of the reactant (Fe(III)PPIX in this case) remaining after a specific time
t, relative to the initial mass of the reactant, m0. z is the experimental rate constant and n is the Avrami constant,
which is generally an integer value between 1 and 4. The value of n describes the degrees of freedom and is a
function of dimensionality of the growth process and the manner of crystal nucleation. When the Avrami
constant is equal to 1, the model suggests that nuclei are preformed and crystal growth is in one dimension,
resulting in linear crystal growth. However, when n is equal to 2 or 3, random or instantaneous nucleation is
predicted and crystal growth is rod-like. Finally, when the Avrami constant is equal to 4, the reaction involves
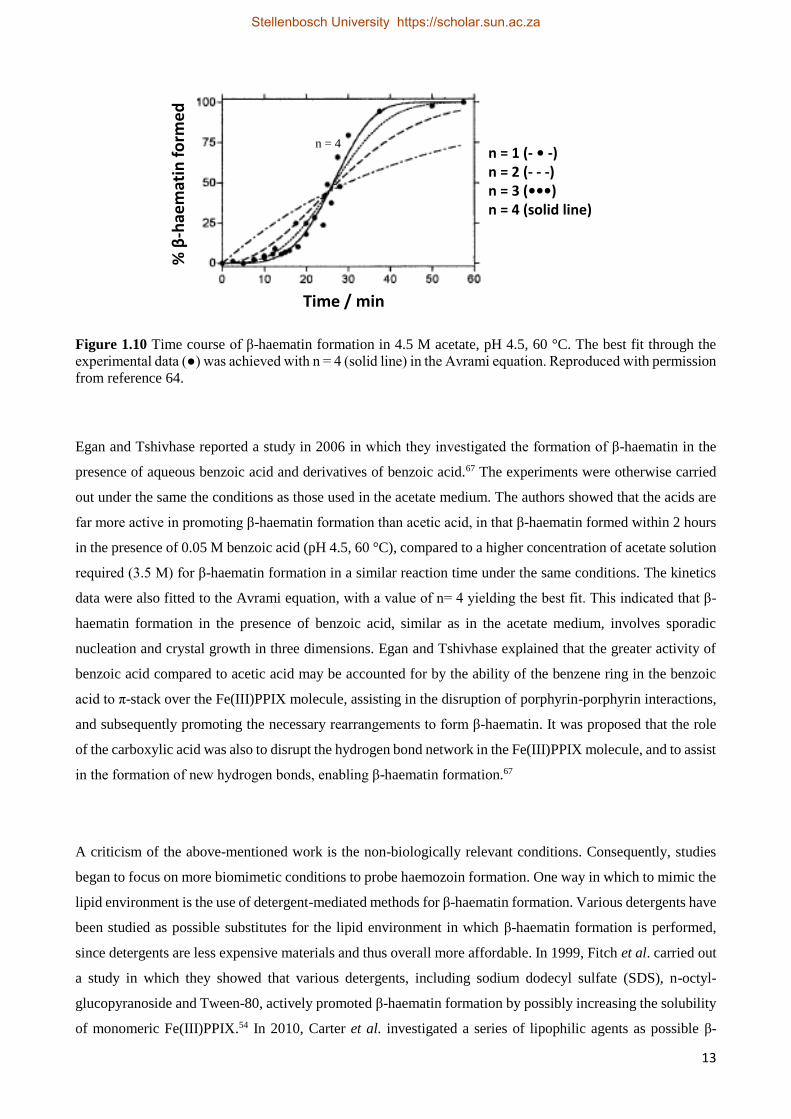
sporadic nucleation and crystal growth takes place in three dimensions. In the study by Egan et al., they showed
that the best fit of the experimental time course data to the Avrami equation was when n was equal to 4 (Figure
1.10).64
In the experiment, β-haematin was formed from Fe(III)PPIX in a jacketed reaction vessel, and it was found
that the reaction stirring rate influenced the geometry and the rate of crystal growth from the nucleation sites.
Furthermore, it was shown that β-haematin formation was dependent on acetate concentration, reaction
temperature and pH. The authors proposed that β-haematin formation occurred via rapid precipitation of
amorphous Fe(III)PPIX, which was later converted into the desired product in the presence of acetate, which
may have acted as a phase transfer catalyst in the dissolution and re-precipitation of haematin.64
Stellenbosch University https://scholar.sun.ac.za
13
Figure 1.10 Time course of β-haematin formation in 4.5 M acetate, pH 4.5, 60 °C. The best fit through the
experimental data (●) was achieved with n = 4 (solid line) in the Avrami equation. Reproduced with permission
from reference 64.
Egan and Tshivhase reported a study in 2006 in which they investigated the formation of β-haematin in the
presence of aqueous benzoic acid and derivatives of benzoic acid.67 The experiments were otherwise carried
out under the same the conditions as those used in the acetate medium. The authors showed that the acids are
far more active in promoting β-haematin formation than acetic acid, in that β-haematin formed within 2 hours
in the presence of 0.05 M benzoic acid (pH 4.5, 60 °C), compared to a higher concentration of acetate solution
required (3.5 M) for β-haematin formation in a similar reaction time under the same conditions. The kinetics
data were also fitted to the Avrami equation, with a value of n= 4 yielding the best fit. This indicated that β-
haematin formation in the presence of benzoic acid, similar as in the acetate medium, involves sporadic
nucleation and crystal growth in three dimensions. Egan and Tshivhase explained that the greater activity of
benzoic acid compared to acetic acid may be accounted for by the ability of the benzene ring in the benzoic
acid to π-stack over the Fe(III)PPIX molecule, assisting in the disruption of porphyrin-porphyrin interactions,
and subsequently promoting the necessary rearrangements to form β-haematin. It was proposed that the role
of the carboxylic acid was also to disrupt the hydrogen bond network in the Fe(III)PPIX molecule, and to assist
in the formation of new hydrogen bonds, enabling β-haematin formation.67
A criticism of the above-mentioned work is the non-biologically relevant conditions. Consequently, studies
began to focus on more biomimetic conditions to probe haemozoin formation. One way in which to mimic the
lipid environment is the use of detergent-mediated methods for β-haematin formation. Various detergents have
been studied as possible substitutes for the lipid environment in which β-haematin formation is performed,
since detergents are less expensive materials and thus overall more affordable. In 1999, Fitch et al. carried out
a study in which they showed that various detergents, including sodium dodecyl sulfate (SDS), n-octyl-
glucopyranoside and Tween-80, actively promoted β-haematin formation by possibly increasing the solubility
of monomeric Fe(III)PPIX.54 In 2010, Carter et al. investigated a series of lipophilic agents as possible β-
n = 4
Time / min
% β
-hae
mat
in f
orm
ed
n = 1 (- • -)n = 2 (- - -)n = 3 (•••)n = 4 (solid line)
Stellenbosch University https://scholar.sun.ac.za
14
haematin crystallisation promotors, from which they optimized and validated a Nonidet P-40 (NP40)
detergent-mediated assay, which now serves as a screening mechanism for β-haematin inhibitors.68 More
recently, Sandlin et al. carried out studies in which they utilized the NP40 detergent-mediated assay in order
to promote β-haematin formation as part of a high-throughput screen to identify β-haematin inhibitors, and to
probe their β-haematin inhibitory activities.69,70 In addition to the selection of detergents used for β-haematin
formation, different solvent systems have been investigated as well. Huy et al. studied β-haematin formation
induced by a series of short-chain alcohols, namely methanol, ethanol, n-propanol, and n-butanol. The authors
showed that the induction of β-haematin formation by these alcohols is related with their respective degree of
hydrophobicity and ability to solubilize heam.71 In 2009 Stiebler et al. investigated the effect of water content
on spontaneous β-haematin formation in dimethyl sulfoxide (DMSO) and a series of polyethyleneglycols. The
authors demonstrated that reduced medium polarity increases haem solubility under acidic conditions, which
in turn assisted in the nucleation of β-haematin crystals in vitro in the absence of any biological sample.72
While detergents such as NP40 are successful mediators of β-haematin formation, it is still ideal to carry out
investigations using synthetic lipid particles in a biologically-relevant temperature and pH environment in
order to facilitate β-haematin formation in vitro.
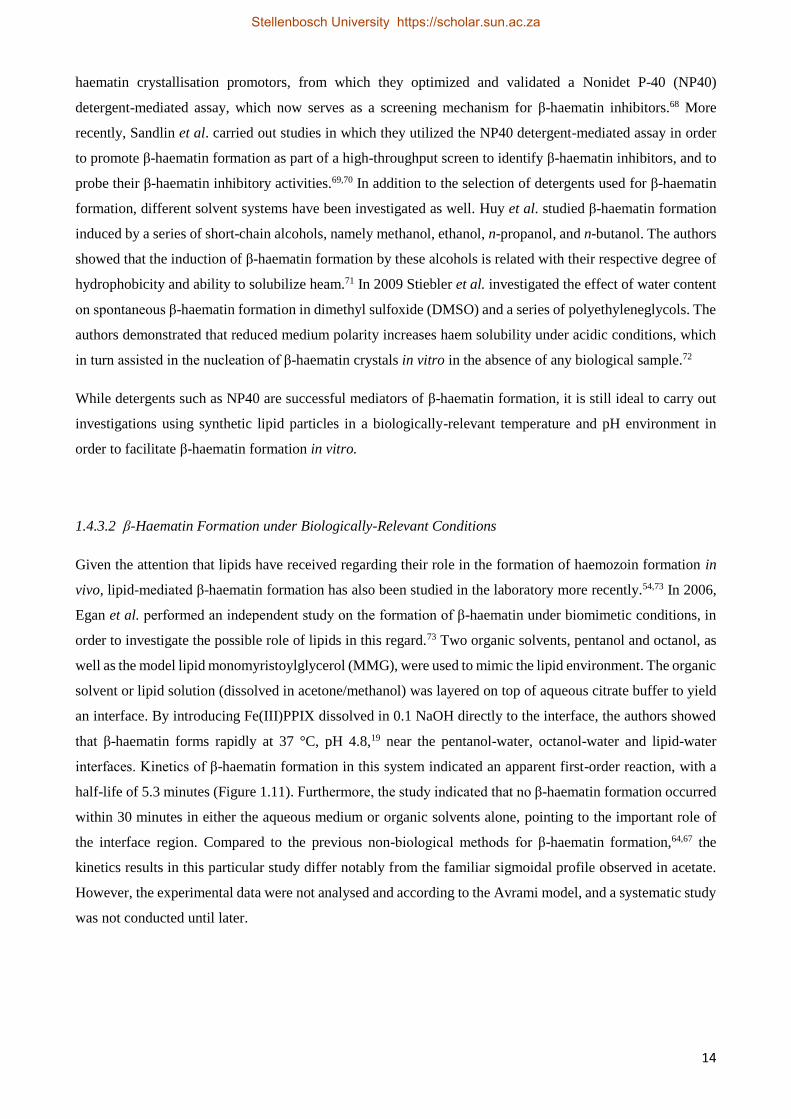
1.4.3.2 β-Haematin Formation under Biologically-Relevant Conditions
Given the attention that lipids have received regarding their role in the formation of haemozoin formation in
vivo, lipid-mediated β-haematin formation has also been studied in the laboratory more recently.54,73 In 2006,
Egan et al. performed an independent study on the formation of β-haematin under biomimetic conditions, in
order to investigate the possible role of lipids in this regard.73 Two organic solvents, pentanol and octanol, as
well as the model lipid monomyristoylglycerol (MMG), were used to mimic the lipid environment. The organic
solvent or lipid solution (dissolved in acetone/methanol) was layered on top of aqueous citrate buffer to yield
an interface. By introducing Fe(III)PPIX dissolved in 0.1 NaOH directly to the interface, the authors showed
that β-haematin forms rapidly at 37 °C, pH 4.8,19 near the pentanol-water, octanol-water and lipid-water
interfaces. Kinetics of β-haematin formation in this system indicated an apparent first-order reaction, with a
half-life of 5.3 minutes (Figure 1.11). Furthermore, the study indicated that no β-haematin formation occurred
within 30 minutes in either the aqueous medium or organic solvents alone, pointing to the important role of
the interface region. Compared to the previous non-biological methods for β-haematin formation,64,67 the
kinetics results in this particular study differ notably from the familiar sigmoidal profile observed in acetate.
However, the experimental data were not analysed and according to the Avrami model, and a systematic study
was not conducted until later.
Stellenbosch University https://scholar.sun.ac.za
15
Figure 1.11 Kinetics of β-haematin formation brought about near the interface of MMG and water. The
experimental data are fitted to a hyperbolic equation for a first-order reaction, corresponding to a half-life of
5.3 minutes. Reproduced with permission from reference 73.
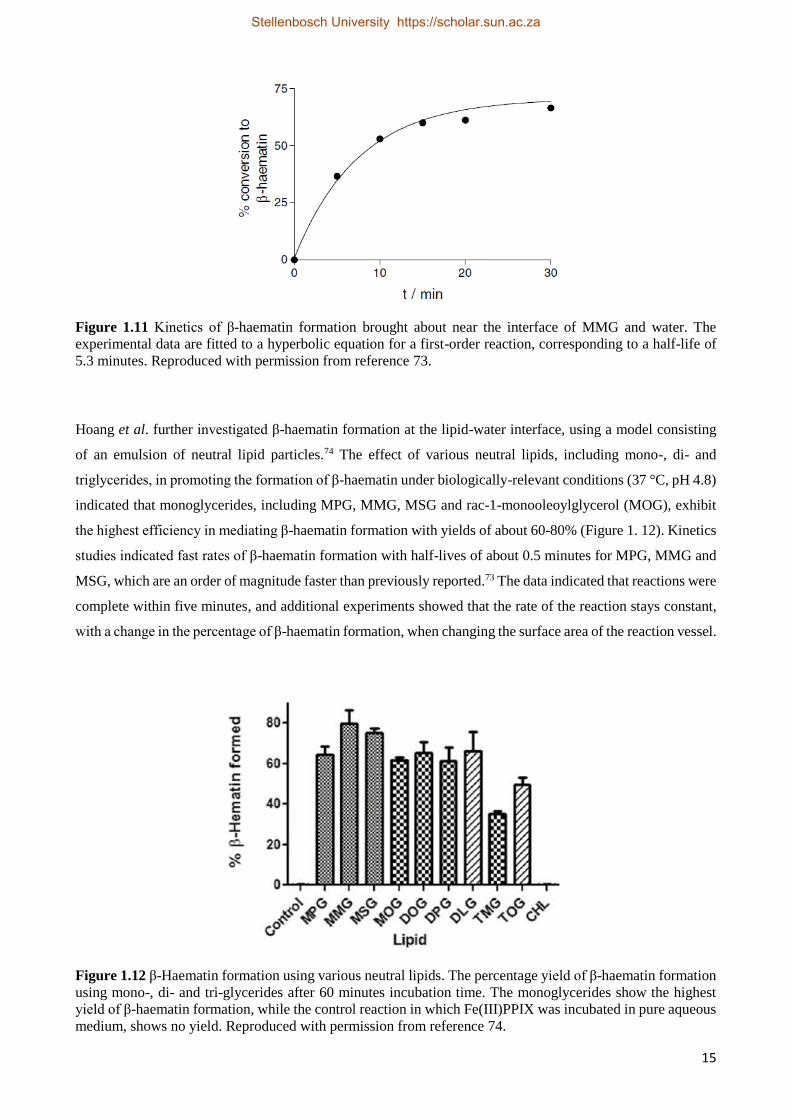
Hoang et al. further investigated β-haematin formation at the lipid-water interface, using a model consisting
of an emulsion of neutral lipid particles.74 The effect of various neutral lipids, including mono-, di- and
triglycerides, in promoting the formation of β-haematin under biologically-relevant conditions (37 °C, pH 4.8)
indicated that monoglycerides, including MPG, MMG, MSG and rac-1-monooleoylglycerol (MOG), exhibit
the highest efficiency in mediating β-haematin formation with yields of about 60-80% (Figure 1. 12). Kinetics
studies indicated fast rates of β-haematin formation with half-lives of about 0.5 minutes for MPG, MMG and
MSG, which are an order of magnitude faster than previously reported.73 The data indicated that reactions were
complete within five minutes, and additional experiments showed that the rate of the reaction stays constant,
with a change in the percentage of β-haematin formation, when changing the surface area of the reaction vessel.
Figure 1.12 β-Haematin formation using various neutral lipids. The percentage yield of β-haematin formation
using mono-, di- and tri-glycerides after 60 minutes incubation time. The monoglycerides show the highest
yield of β-haematin formation, while the control reaction in which Fe(III)PPIX was incubated in pure aqueous
medium, shows no yield. Reproduced with permission from reference 74.
Stellenbosch University https://scholar.sun.ac.za
16
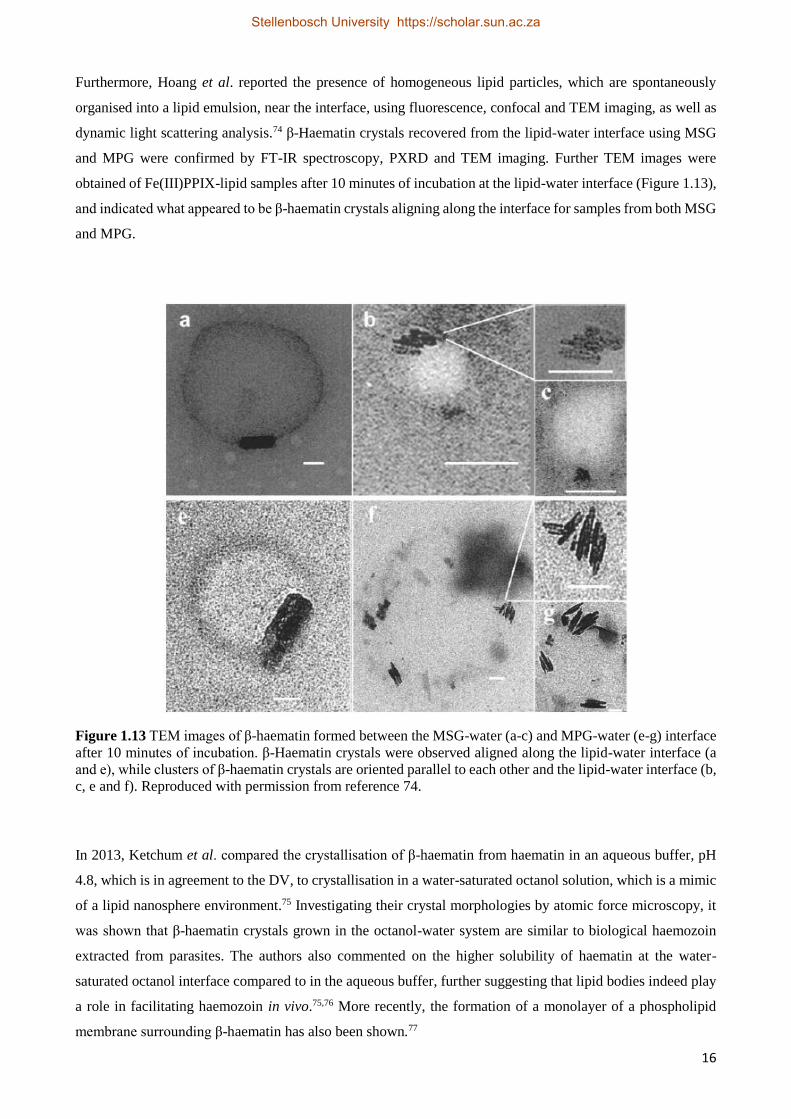
Furthermore, Hoang et al. reported the presence of homogeneous lipid particles, which are spontaneously
organised into a lipid emulsion, near the interface, using fluorescence, confocal and TEM imaging, as well as
dynamic light scattering analysis.74 β-Haematin crystals recovered from the lipid-water interface using MSG
and MPG were confirmed by FT-IR spectroscopy, PXRD and TEM imaging. Further TEM images were
obtained of Fe(III)PPIX-lipid samples after 10 minutes of incubation at the lipid-water interface (Figure 1.13),
and indicated what appeared to be β-haematin crystals aligning along the interface for samples from both MSG
and MPG.
Figure 1.13 TEM images of β-haematin formed between the MSG-water (a-c) and MPG-water (e-g) interface
after 10 minutes of incubation. β-Haematin crystals were observed aligned along the lipid-water interface (a
and e), while clusters of β-haematin crystals are oriented parallel to each other and the lipid-water interface (b,
c, e and f). Reproduced with permission from reference 74.
In 2013, Ketchum et al. compared the crystallisation of β-haematin from haematin in an aqueous buffer, pH
4.8, which is in agreement to the DV, to crystallisation in a water-saturated octanol solution, which is a mimic
of a lipid nanosphere environment.75 Investigating their crystal morphologies by atomic force microscopy, it
was shown that β-haematin crystals grown in the octanol-water system are similar to biological haemozoin
extracted from parasites. The authors also commented on the higher solubility of haematin at the water-
saturated octanol interface compared to in the aqueous buffer, further suggesting that lipid bodies indeed play
a role in facilitating haemozoin in vivo.75,76 More recently, the formation of a monolayer of a phospholipid
membrane surrounding β-haematin has also been shown.77
Stellenbosch University https://scholar.sun.ac.za
17
1.4.4 Proposed Mechanisms of Haemozoin Formation
To truly explain the molecular mechanism of haemozoin formation and the structure of Fe(III)PPIX complexes
with antimalarial inhibitors, it is import to understand the behaviour and structure of Fe(III)PPIX in different
solutions. Owing to its varied speciation in solution, it is important to comprehend under which conditions
Fe(III)PPIX is most favourable for β-haematin formation.
Early studies on aqueous Fe(III)PPIX have recognised that the porphyrin self-associates in aqueous
solution,78,79 and it was widely accepted that Fe(III)PPIX spontaneously forms a µ-oxo dimer, whereby the
iron centres of neighbouring porphyrins are connected by an oxo (Fe-O-Fe) bridge. This hypothesis, believed
for almost 40 years, was based on infrared spectroscopic data obtained for the solid precipitated from an
alkaline solution by the addition of solid NaOH or 1 M NaOH, or from an alkaline DMSO solution.80 Brown
et al. continued their research and further reported equilibrium constants for Fe(III)PPIX dimerization.81 In an
attempt to verify these dimerization constants, de Villiers et al. showed that spontaneous dimerization of H2O-
Fe(III)PPIX and HO-Fe(III)PPIX leads to π-π complexes in aqueous solution, rather than a µ-oxo dimer.82 The
π-π dimer is believed to form via a noncovalent interaction of the unligated face of the each porphyrin
molecule, with the axial ligands pointing outwards (Figure 1. 14 (A, i)). The authors based their conclusion on
both UV-visible and 1H nuclear magnetic resonance (NMR) spectra of aqueous Fe(III)PPIX, which are
markedly different from those of the µ-oxo dimer.83,84 There is support in the literature for the formation of
such π-π dimers given the reported X-ray crystal structures of Cl-Fe(III)PPIX85 and aqua-
iron(III)octaethylporphyrin,86 which themselves pack in the solid state as π-π dimers. Furthermore, it has been
shown that solvent concentration, temperature, pH and the presence of salts have an effect on Fe(III)PPIX
speciation in different solvent systems,87 however, from the study carried out by de Villiers et al., it is clear
that the formation of the π-π dimer species predominates in aqueous solution and understanding this structure
is of importance in unravelling the mechanism of haemozoin formation.82
Molecular dynamics simulations have provided further insight into the possible molecular mechanism by
which haemozoin may form at the lipid-water interface.73 Egan et al. carried out simulations of the interactions
of a π-stacked dimer of H2O-Fe(III)PPIX in vacuum, and showed that the porphyrins rapidly reorganise to
form a haemozoin precursor dimer (Figure 1.14 (B)), in which the positively charged iron centre of one
Fe(III)PPIX molecule interacts with the negatively charged propionate group of the other.73 Following
displacement of the axial water molecules from the iron centres, and simultaneous bond formation between
the iron centre and the propionate groups, the formation of haemozoin (β-haematin) takes place. It is further
speculated that in the absence of competing hydrogen bonding from water solvent molecules, hydrogen
bonding between the haemozoin dimers will be induced, facilitating in the formation of the haemozoin crystal.
However, in the presence of water molecules, and hence competing hydrogen bonding, the simulation showed
that the haemozoin precursor dimer is unstable, with the propionate groups preferentially interacting with the
solvent water molecules, rather than the neighbouring iron centre. The molecular dynamics simulations
therefore further suggest that a lipid environment (specifically a low dielectric medium) will better promote
haemozoin crystal formation, owing to the lower water concentration.
Stellenbosch University https://scholar.sun.ac.za
18
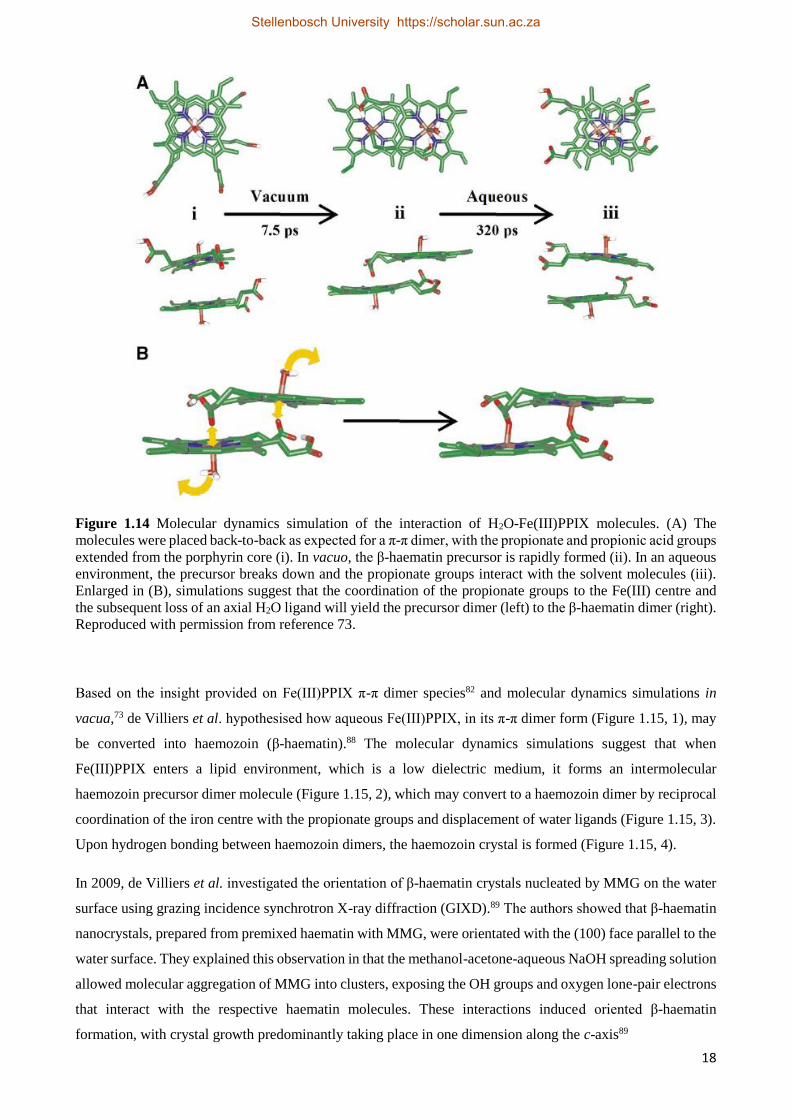
Figure 1.14 Molecular dynamics simulation of the interaction of H2O-Fe(III)PPIX molecules. (A) The
molecules were placed back-to-back as expected for a π-π dimer, with the propionate and propionic acid groups
extended from the porphyrin core (i). In vacuo, the β-haematin precursor is rapidly formed (ii). In an aqueous
environment, the precursor breaks down and the propionate groups interact with the solvent molecules (iii).
Enlarged in (B), simulations suggest that the coordination of the propionate groups to the Fe(III) centre and
the subsequent loss of an axial H2O ligand will yield the precursor dimer (left) to the β-haematin dimer (right).
Reproduced with permission from reference 73.
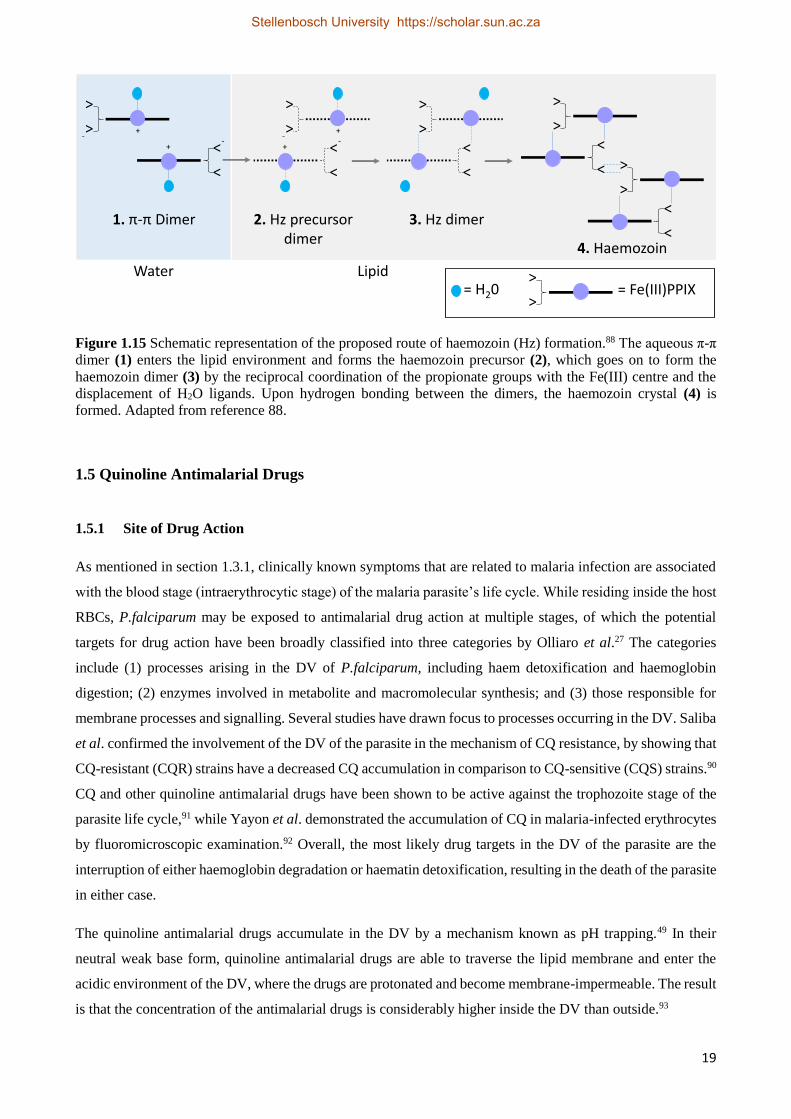
Based on the insight provided on Fe(III)PPIX π-π dimer species82 and molecular dynamics simulations in
vacua,73 de Villiers et al. hypothesised how aqueous Fe(III)PPIX, in its π-π dimer form (Figure 1.15, 1), may
be converted into haemozoin (β-haematin).88 The molecular dynamics simulations suggest that when
Fe(III)PPIX enters a lipid environment, which is a low dielectric medium, it forms an intermolecular
haemozoin precursor dimer molecule (Figure 1.15, 2), which may convert to a haemozoin dimer by reciprocal
coordination of the iron centre with the propionate groups and displacement of water ligands (Figure 1.15, 3).
Upon hydrogen bonding between haemozoin dimers, the haemozoin crystal is formed (Figure 1.15, 4).
In 2009, de Villiers et al. investigated the orientation of β-haematin crystals nucleated by MMG on the water
surface using grazing incidence synchrotron X-ray diffraction (GIXD).89 The authors showed that β-haematin
nanocrystals, prepared from premixed haematin with MMG, were orientated with the (100) face parallel to the
water surface. They explained this observation in that the methanol-acetone-aqueous NaOH spreading solution
allowed molecular aggregation of MMG into clusters, exposing the OH groups and oxygen lone-pair electrons
that interact with the respective haematin molecules. These interactions induced oriented β-haematin
formation, with crystal growth predominantly taking place in one dimension along the c-axis89
Stellenbosch University https://scholar.sun.ac.za
19
Figure 1.15 Schematic representation of the proposed route of haemozoin (Hz) formation.88 The aqueous π-π
dimer (1) enters the lipid environment and forms the haemozoin precursor (2), which goes on to form the
haemozoin dimer (3) by the reciprocal coordination of the propionate groups with the Fe(III) centre and the
displacement of H2O ligands. Upon hydrogen bonding between the dimers, the haemozoin crystal (4) is
formed. Adapted from reference 88.
1.5 Quinoline Antimalarial Drugs
1.5.1 Site of Drug Action
As mentioned in section 1.3.1, clinically known symptoms that are related to malaria infection are associated
with the blood stage (intraerythrocytic stage) of the malaria parasite’s life cycle. While residing inside the host
RBCs, P.falciparum may be exposed to antimalarial drug action at multiple stages, of which the potential
targets for drug action have been broadly classified into three categories by Olliaro et al.27 The categories
include (1) processes arising in the DV of P.falciparum, including haem detoxification and haemoglobin
digestion; (2) enzymes involved in metabolite and macromolecular synthesis; and (3) those responsible for
membrane processes and signalling. Several studies have drawn focus to processes occurring in the DV. Saliba
et al. confirmed the involvement of the DV of the parasite in the mechanism of CQ resistance, by showing that
CQ-resistant (CQR) strains have a decreased CQ accumulation in comparison to CQ-sensitive (CQS) strains.90
CQ and other quinoline antimalarial drugs have been shown to be active against the trophozoite stage of the
parasite life cycle,91 while Yayon et al. demonstrated the accumulation of CQ in malaria-infected erythrocytes
by fluoromicroscopic examination.92 Overall, the most likely drug targets in the DV of the parasite are the
interruption of either haemoglobin degradation or haematin detoxification, resulting in the death of the parasite
in either case.
The quinoline antimalarial drugs accumulate in the DV by a mechanism known as pH trapping.49 In their
neutral weak base form, quinoline antimalarial drugs are able to traverse the lipid membrane and enter the
acidic environment of the DV, where the drugs are protonated and become membrane-impermeable. The result
is that the concentration of the antimalarial drugs is considerably higher inside the DV than outside.93
+>
>
-
+ >
>
-
+>
>
-
+ >
>
-
>
>
>
>
>
>
>
>
>
>
>
>
= H20>
>= Fe(III)PPIX
LipidWater
1. π-π Dimer 2. Hz precursor dimer
3. Hz dimer
4. Haemozoin
Stellenbosch University https://scholar.sun.ac.za
20
1.5.2 History and Discovery of Quinoline Antimalarial Drugs
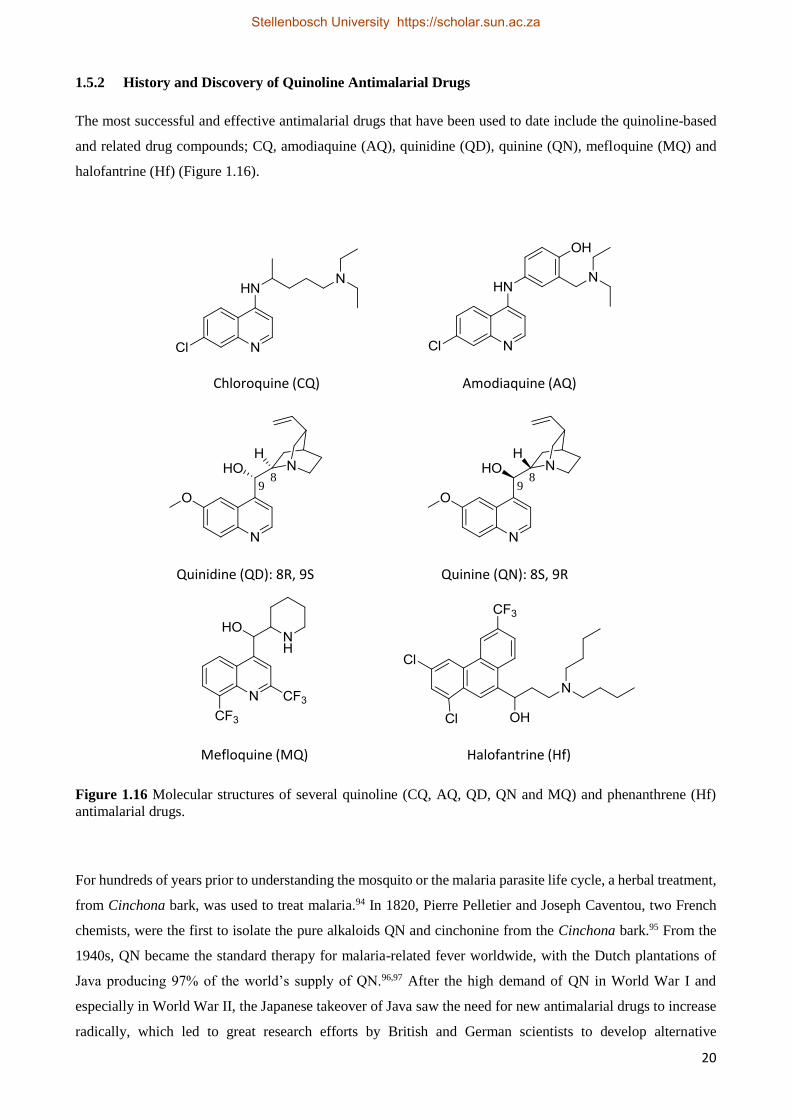
The most successful and effective antimalarial drugs that have been used to date include the quinoline-based
and related drug compounds; CQ, amodiaquine (AQ), quinidine (QD), quinine (QN), mefloquine (MQ) and
halofantrine (Hf) (Figure 1.16).
Figure 1.16 Molecular structures of several quinoline (CQ, AQ, QD, QN and MQ) and phenanthrene (Hf)
antimalarial drugs.
For hundreds of years prior to understanding the mosquito or the malaria parasite life cycle, a herbal treatment,
from Cinchona bark, was used to treat malaria.94 In 1820, Pierre Pelletier and Joseph Caventou, two French
chemists, were the first to isolate the pure alkaloids QN and cinchonine from the Cinchona bark.95 From the
1940s, QN became the standard therapy for malaria-related fever worldwide, with the Dutch plantations of
Java producing 97% of the world’s supply of QN.96,97 After the high demand of QN in World War I and
especially in World War II, the Japanese takeover of Java saw the need for new antimalarial drugs to increase
radically, which led to great research efforts by British and German scientists to develop alternative
Chloroquine (CQ) Amodiaquine (AQ)
Quinidine (QD): 8R, 9S Quinine (QN): 8S, 9R
Mefloquine (MQ) Halofantrine (Hf)
89
89
Stellenbosch University https://scholar.sun.ac.za
21
treatments.98 The first attempts in preparing synthetic antimalarials included the design of 8-aminoquinolines;
plasmaquine (pamaquine) and primaquine, followed by the design of several 4-aminoquinolines, of which CQ
was to be the most important.98,99 CQ is recognized historically as the most effective antimalarial drug, owing
to its efficacy, affordability and low toxicity.94 AQ was, however, soon introduced as an alternative to CQ,
owing to the widespread resistance against CQ since the 1960s, and is still used in some cases today for the
treatment of uncomplicated malaria.98,99 In the mid-1970s, another synthetic derivative of QN, MQ (Larium),
a quinoline methanol compound, was introduced with potent antimalarial activity,100,101 and has proven to be
an effective antimalarial, especially against CQS strains of malaria.102,103
1.5.3 Quinoline Antimalarial Drug Resistance
A great deal of research has focussed on the development of new and effective antimalarial drugs, owing to
the great increase in the appearance of drug resistance to clinically-relevant antimalarial drugs.
As mentioned above, a diprotic weak base such as CQ can be driven across the DV membranes of the parasite
in its unprotonated form, by a pH gradient, to accumulate within the DV. It is believed that the resistance to
CQ in P. falciparum is associated with an increased ability for the parasite to eject CQ out of the DV at a rate
that does not allow CQ to reach the required levels needed for the inhibition of haemozoin formation.104
Krongstad et al. investigated the reduced uptake of CQ and showed that this CQ efflux occurs at a rate of 40
to 50 times faster in CQR parasites than in CQS parasites.105 The rapid efflux of CQ out of the DV of CQR
parasites, compared to CQS parasites, may be accounted for by a possible enhanced permeation pathway for
CQ across the DV membrane,93 possibly through a channel, or via active transportation across the membrane,
since the pH gradient across the DV membranes of both the CQR and CQS parasite shows no significant
difference.19
Furthermore, at a molecular level, it has been shown that CQ resistance is related to mutations in two genes
that encode transmembrane proteins. The 424 amino acid transmembrane protein, P. falciparum CQ-resistance
transporter (PfCRT), which is located on the surface of the DV, is coded for by the gene pfcrt on chromosome
7.106 A mutation at position 76 in the amino acid sequence of the protein (K76T), is associated with the CQR
strain.107 In this mutation, the lysine α-amino acid (K) is replaced by the threonine α-amino acid (T). P.
falciparum multidrug resistance gene 1 (Pfmdr1), located on chromosome 5, is another DV transporter protein
which is associated with drug resistance, and encodes P-glycoprotein homologue 1 (Pgh1).108 Cowman et al.
demonstrated that resistance to QN, MQ and HF is caused by an over-expression of Pgh1.109 Ferdig et al.
showed that even though the mechanism for QN resistance is poorly understood, it is also associated to P.
falciparum sodium proton exchanger (pfnhe-1).110 At first the exact mechanism of CQ resistance by mutated
PfCRT proteins was not definitively understood, however, Sanchez et al. later proposed that PfCRT acts either
as a channel, allowing CQ to passively move out of the DV via an electrochemical gradient, or as a transporter,
in which CQ is actively transported out of the DV.93
Stellenbosch University https://scholar.sun.ac.za
22
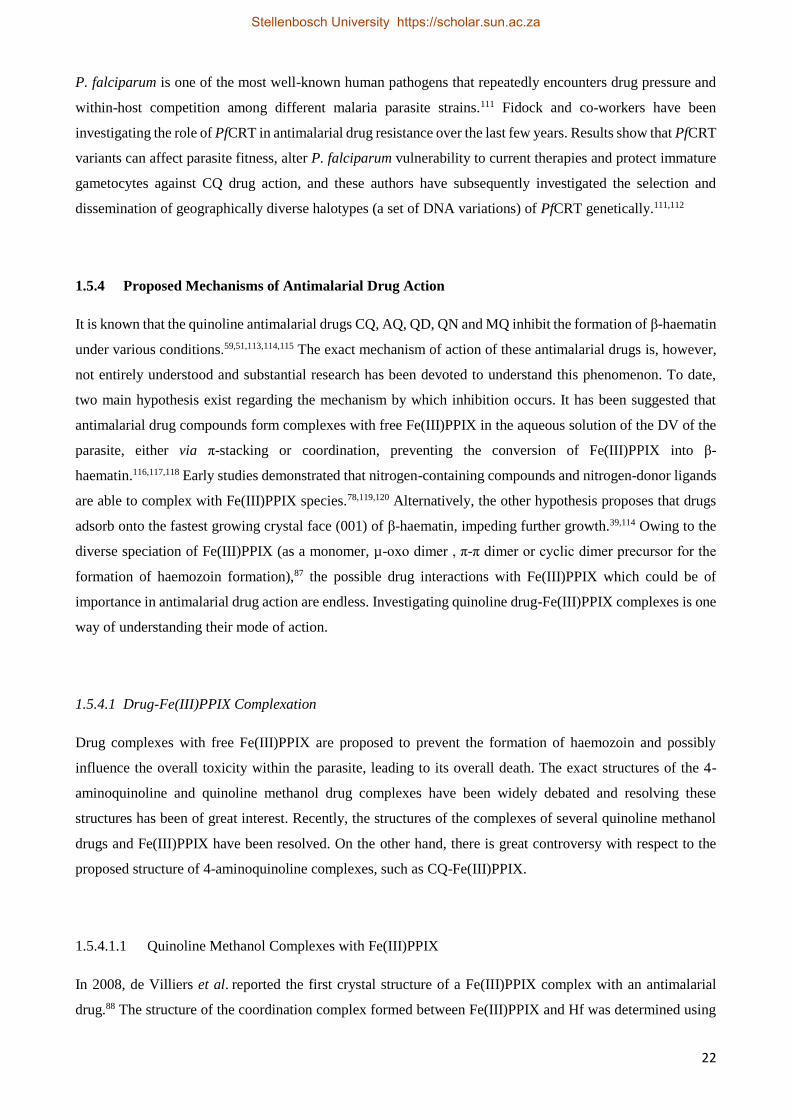
P. falciparum is one of the most well-known human pathogens that repeatedly encounters drug pressure and
within-host competition among different malaria parasite strains.111 Fidock and co-workers have been
investigating the role of PfCRT in antimalarial drug resistance over the last few years. Results show that PfCRT
variants can affect parasite fitness, alter P. falciparum vulnerability to current therapies and protect immature
gametocytes against CQ drug action, and these authors have subsequently investigated the selection and
dissemination of geographically diverse halotypes (a set of DNA variations) of PfCRT genetically.111,112
1.5.4 Proposed Mechanisms of Antimalarial Drug Action
It is known that the quinoline antimalarial drugs CQ, AQ, QD, QN and MQ inhibit the formation of β-haematin
under various conditions.59,51,113,114,115 The exact mechanism of action of these antimalarial drugs is, however,
not entirely understood and substantial research has been devoted to understand this phenomenon. To date,
two main hypothesis exist regarding the mechanism by which inhibition occurs. It has been suggested that
antimalarial drug compounds form complexes with free Fe(III)PPIX in the aqueous solution of the DV of the
parasite, either via π-stacking or coordination, preventing the conversion of Fe(III)PPIX into β-
haematin.116,117,118 Early studies demonstrated that nitrogen-containing compounds and nitrogen-donor ligands
are able to complex with Fe(III)PPIX species.78,119,120 Alternatively, the other hypothesis proposes that drugs
adsorb onto the fastest growing crystal face (001) of β-haematin, impeding further growth.39,114 Owing to the
diverse speciation of Fe(III)PPIX (as a monomer, µ-oxo dimer , π-π dimer or cyclic dimer precursor for the
formation of haemozoin formation),87 the possible drug interactions with Fe(III)PPIX which could be of
importance in antimalarial drug action are endless. Investigating quinoline drug-Fe(III)PPIX complexes is one
way of understanding their mode of action.
1.5.4.1 Drug-Fe(III)PPIX Complexation
Drug complexes with free Fe(III)PPIX are proposed to prevent the formation of haemozoin and possibly
influence the overall toxicity within the parasite, leading to its overall death. The exact structures of the 4-
aminoquinoline and quinoline methanol drug complexes have been widely debated and resolving these
structures has been of great interest. Recently, the structures of the complexes of several quinoline methanol
drugs and Fe(III)PPIX have been resolved. On the other hand, there is great controversy with respect to the
proposed structure of 4-aminoquinoline complexes, such as CQ-Fe(III)PPIX.
1.5.4.1.1 Quinoline Methanol Complexes with Fe(III)PPIX
In 2008, de Villiers et al. reported the first crystal structure of a Fe(III)PPIX complex with an antimalarial
drug.88 The structure of the coordination complex formed between Fe(III)PPIX and Hf was determined using
Stellenbosch University https://scholar.sun.ac.za
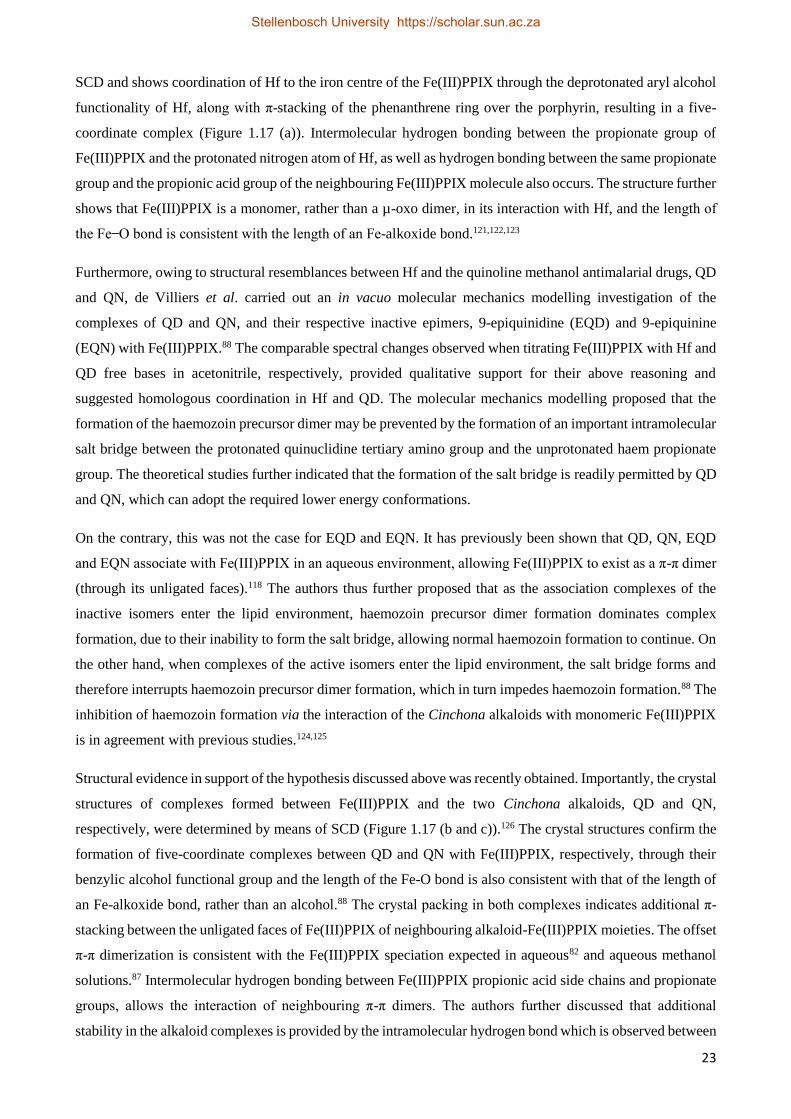
23
SCD and shows coordination of Hf to the iron centre of the Fe(III)PPIX through the deprotonated aryl alcohol
functionality of Hf, along with π-stacking of the phenanthrene ring over the porphyrin, resulting in a five-
coordinate complex (Figure 1.17 (a)). Intermolecular hydrogen bonding between the propionate group of
Fe(III)PPIX and the protonated nitrogen atom of Hf, as well as hydrogen bonding between the same propionate
group and the propionic acid group of the neighbouring Fe(III)PPIX molecule also occurs. The structure further
shows that Fe(III)PPIX is a monomer, rather than a µ-oxo dimer, in its interaction with Hf, and the length of
the Fe ̶O bond is consistent with the length of an Fe-alkoxide bond.121,122,123
Furthermore, owing to structural resemblances between Hf and the quinoline methanol antimalarial drugs, QD
and QN, de Villiers et al. carried out an in vacuo molecular mechanics modelling investigation of the
complexes of QD and QN, and their respective inactive epimers, 9-epiquinidine (EQD) and 9-epiquinine
(EQN) with Fe(III)PPIX.88 The comparable spectral changes observed when titrating Fe(III)PPIX with Hf and
QD free bases in acetonitrile, respectively, provided qualitative support for their above reasoning and
suggested homologous coordination in Hf and QD. The molecular mechanics modelling proposed that the
formation of the haemozoin precursor dimer may be prevented by the formation of an important intramolecular
salt bridge between the protonated quinuclidine tertiary amino group and the unprotonated haem propionate
group. The theoretical studies further indicated that the formation of the salt bridge is readily permitted by QD
and QN, which can adopt the required lower energy conformations.
On the contrary, this was not the case for EQD and EQN. It has previously been shown that QD, QN, EQD
and EQN associate with Fe(III)PPIX in an aqueous environment, allowing Fe(III)PPIX to exist as a π-π dimer
(through its unligated faces).118 The authors thus further proposed that as the association complexes of the
inactive isomers enter the lipid environment, haemozoin precursor dimer formation dominates complex
formation, due to their inability to form the salt bridge, allowing normal haemozoin formation to continue. On
the other hand, when complexes of the active isomers enter the lipid environment, the salt bridge forms and
therefore interrupts haemozoin precursor dimer formation, which in turn impedes haemozoin formation.88 The
inhibition of haemozoin formation via the interaction of the Cinchona alkaloids with monomeric Fe(III)PPIX
is in agreement with previous studies.124,125
Structural evidence in support of the hypothesis discussed above was recently obtained. Importantly, the crystal
structures of complexes formed between Fe(III)PPIX and the two Cinchona alkaloids, QD and QN,
respectively, were determined by means of SCD (Figure 1.17 (b and c)).126 The crystal structures confirm the
formation of five-coordinate complexes between QD and QN with Fe(III)PPIX, respectively, through their
benzylic alcohol functional group and the length of the Fe-O bond is also consistent with that of the length of
an Fe-alkoxide bond, rather than an alcohol.88 The crystal packing in both complexes indicates additional π-
stacking between the unligated faces of Fe(III)PPIX of neighbouring alkaloid-Fe(III)PPIX moieties. The offset
π-π dimerization is consistent with the Fe(III)PPIX speciation expected in aqueous82 and aqueous methanol
solutions.87 Intermolecular hydrogen bonding between Fe(III)PPIX propionic acid side chains and propionate
groups, allows the interaction of neighbouring π-π dimers. The authors further discussed that additional
stability in the alkaloid complexes is provided by the intramolecular hydrogen bond which is observed between
Stellenbosch University https://scholar.sun.ac.za
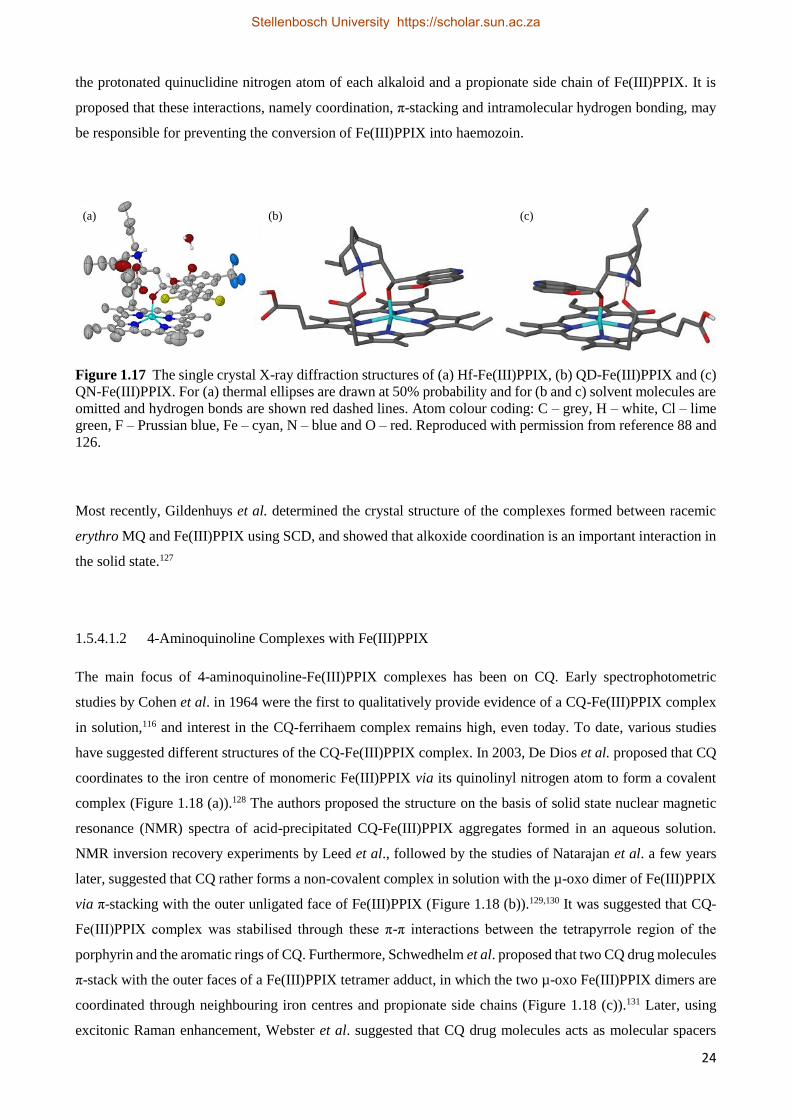
24
the protonated quinuclidine nitrogen atom of each alkaloid and a propionate side chain of Fe(III)PPIX. It is
proposed that these interactions, namely coordination, π-stacking and intramolecular hydrogen bonding, may
be responsible for preventing the conversion of Fe(III)PPIX into haemozoin.
Figure 1.17 The single crystal X-ray diffraction structures of (a) Hf-Fe(III)PPIX, (b) QD-Fe(III)PPIX and (c)
QN-Fe(III)PPIX. For (a) thermal ellipses are drawn at 50% probability and for (b and c) solvent molecules are
omitted and hydrogen bonds are shown red dashed lines. Atom colour coding: C – grey, H – white, Cl – lime
green, F – Prussian blue, Fe – cyan, N – blue and O – red. Reproduced with permission from reference 88 and
126.
Most recently, Gildenhuys et al. determined the crystal structure of the complexes formed between racemic
erythro MQ and Fe(III)PPIX using SCD, and showed that alkoxide coordination is an important interaction in
the solid state.127
1.5.4.1.2 4-Aminoquinoline Complexes with Fe(III)PPIX
The main focus of 4-aminoquinoline-Fe(III)PPIX complexes has been on CQ. Early spectrophotometric
studies by Cohen et al. in 1964 were the first to qualitatively provide evidence of a CQ-Fe(III)PPIX complex
in solution,116 and interest in the CQ-ferrihaem complex remains high, even today. To date, various studies
have suggested different structures of the CQ-Fe(III)PPIX complex. In 2003, De Dios et al. proposed that CQ
coordinates to the iron centre of monomeric Fe(III)PPIX via its quinolinyl nitrogen atom to form a covalent
complex (Figure 1.18 (a)).128 The authors proposed the structure on the basis of solid state nuclear magnetic
resonance (NMR) spectra of acid-precipitated CQ-Fe(III)PPIX aggregates formed in an aqueous solution.
NMR inversion recovery experiments by Leed et al., followed by the studies of Natarajan et al. a few years
later, suggested that CQ rather forms a non-covalent complex in solution with the µ-oxo dimer of Fe(III)PPIX
via π-stacking with the outer unligated face of Fe(III)PPIX (Figure 1.18 (b)).129,130 It was suggested that CQ-
Fe(III)PPIX complex was stabilised through these π-π interactions between the tetrapyrrole region of the
porphyrin and the aromatic rings of CQ. Furthermore, Schwedhelm et al. proposed that two CQ drug molecules
π-stack with the outer faces of a Fe(III)PPIX tetramer adduct, in which the two µ-oxo Fe(III)PPIX dimers are
coordinated through neighbouring iron centres and propionate side chains (Figure 1.18 (c)).131 Later, using
excitonic Raman enhancement, Webster et al. suggested that CQ drug molecules acts as molecular spacers
(a) (b) (c)
Stellenbosch University https://scholar.sun.ac.za
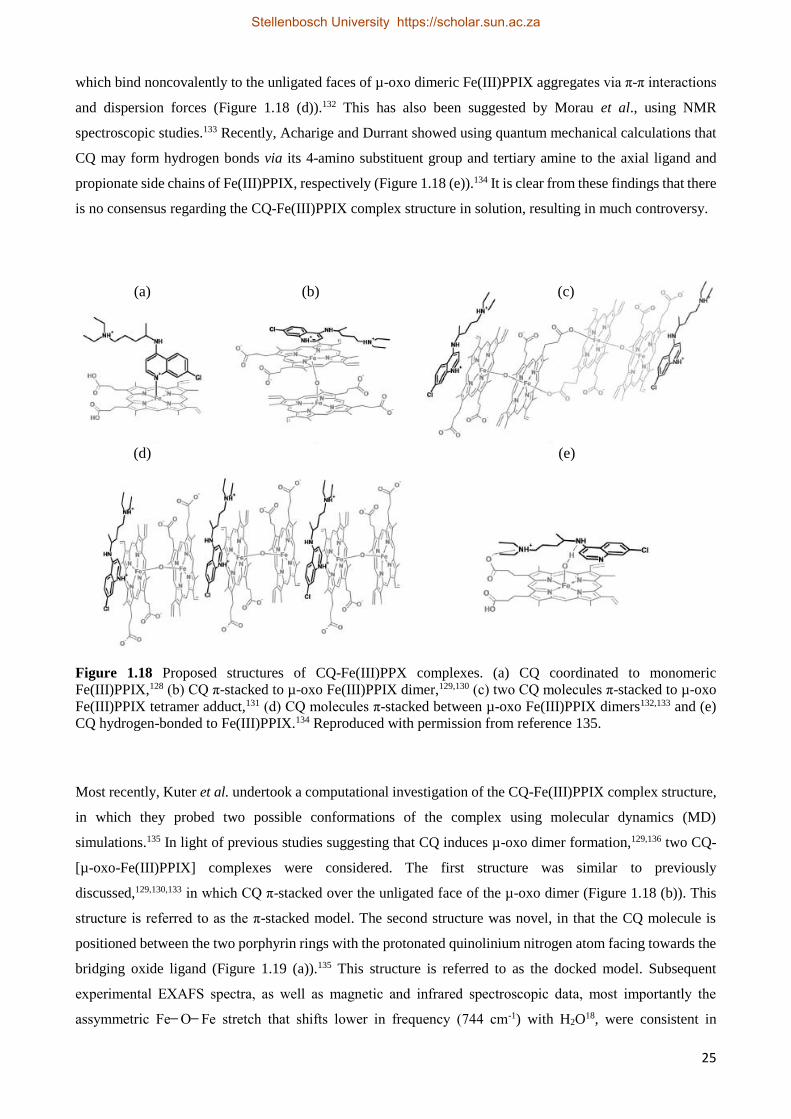
25
which bind noncovalently to the unligated faces of µ-oxo dimeric Fe(III)PPIX aggregates via π-π interactions
and dispersion forces (Figure 1.18 (d)).132 This has also been suggested by Morau et al., using NMR
spectroscopic studies.133 Recently, Acharige and Durrant showed using quantum mechanical calculations that
CQ may form hydrogen bonds via its 4-amino substituent group and tertiary amine to the axial ligand and
propionate side chains of Fe(III)PPIX, respectively (Figure 1.18 (e)).134 It is clear from these findings that there
is no consensus regarding the CQ-Fe(III)PPIX complex structure in solution, resulting in much controversy.
Figure 1.18 Proposed structures of CQ-Fe(III)PPX complexes. (a) CQ coordinated to monomeric
Fe(III)PPIX,128 (b) CQ π-stacked to µ-oxo Fe(III)PPIX dimer,129,130 (c) two CQ molecules π-stacked to µ-oxo
Fe(III)PPIX tetramer adduct,131 (d) CQ molecules π-stacked between µ-oxo Fe(III)PPIX dimers132,133 and (e)
CQ hydrogen-bonded to Fe(III)PPIX.134 Reproduced with permission from reference 135.
Most recently, Kuter et al. undertook a computational investigation of the CQ-Fe(III)PPIX complex structure,
in which they probed two possible conformations of the complex using molecular dynamics (MD)
simulations.135 In light of previous studies suggesting that CQ induces µ-oxo dimer formation,129,136 two CQ-
[µ-oxo-Fe(III)PPIX] complexes were considered. The first structure was similar to previously
discussed,129,130,133 in which CQ π-stacked over the unligated face of the µ-oxo dimer (Figure 1.18 (b)). This
structure is referred to as the π-stacked model. The second structure was novel, in that the CQ molecule is
positioned between the two porphyrin rings with the protonated quinolinium nitrogen atom facing towards the
bridging oxide ligand (Figure 1.19 (a)).135 This structure is referred to as the docked model. Subsequent
experimental EXAFS spectra, as well as magnetic and infrared spectroscopic data, most importantly the
assymmetric Fe ̶ O ̶ Fe stretch that shifts lower in frequency (744 cm-1) with H2O18, were consistent in
(a)
(e)
(b)
(d)
(c)
Stellenbosch University https://scholar.sun.ac.za
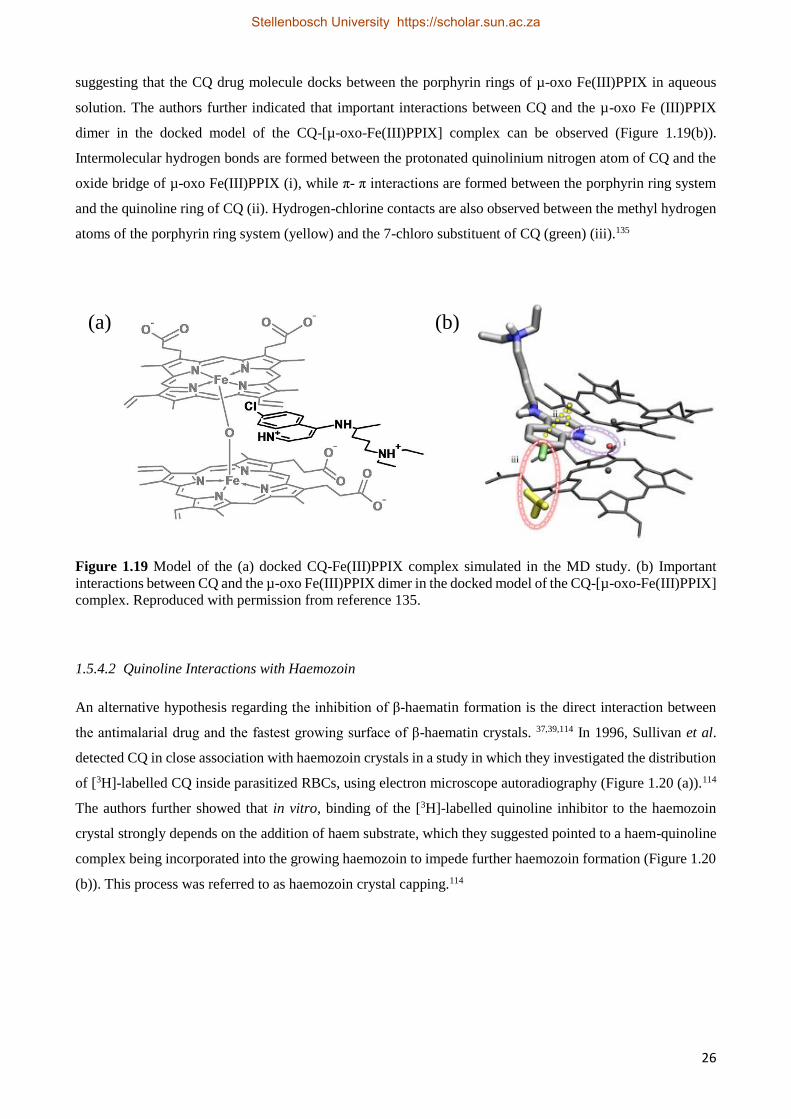
26
suggesting that the CQ drug molecule docks between the porphyrin rings of µ-oxo Fe(III)PPIX in aqueous
solution. The authors further indicated that important interactions between CQ and the µ-oxo Fe (III)PPIX
dimer in the docked model of the CQ-[µ-oxo-Fe(III)PPIX] complex can be observed (Figure 1.19(b)).
Intermolecular hydrogen bonds are formed between the protonated quinolinium nitrogen atom of CQ and the
oxide bridge of µ-oxo Fe(III)PPIX (i), while π- π interactions are formed between the porphyrin ring system
and the quinoline ring of CQ (ii). Hydrogen-chlorine contacts are also observed between the methyl hydrogen
atoms of the porphyrin ring system (yellow) and the 7-chloro substituent of CQ (green) (iii).135
Figure 1.19 Model of the (a) docked CQ-Fe(III)PPIX complex simulated in the MD study. (b) Important
interactions between CQ and the µ-oxo Fe(III)PPIX dimer in the docked model of the CQ-[µ-oxo-Fe(III)PPIX]
complex. Reproduced with permission from reference 135.
1.5.4.2 Quinoline Interactions with Haemozoin
An alternative hypothesis regarding the inhibition of β-haematin formation is the direct interaction between
the antimalarial drug and the fastest growing surface of β-haematin crystals. 37,39,114 In 1996, Sullivan et al.
detected CQ in close association with haemozoin crystals in a study in which they investigated the distribution
of [3H]-labelled CQ inside parasitized RBCs, using electron microscope autoradiography (Figure 1.20 (a)).114
The authors further showed that in vitro, binding of the [3H]-labelled quinoline inhibitor to the haemozoin
crystal strongly depends on the addition of haem substrate, which they suggested pointed to a haem-quinoline
complex being incorporated into the growing haemozoin to impede further haemozoin formation (Figure 1.20
(b)). This process was referred to as haemozoin crystal capping.114
(b)(a)
Stellenbosch University https://scholar.sun.ac.za
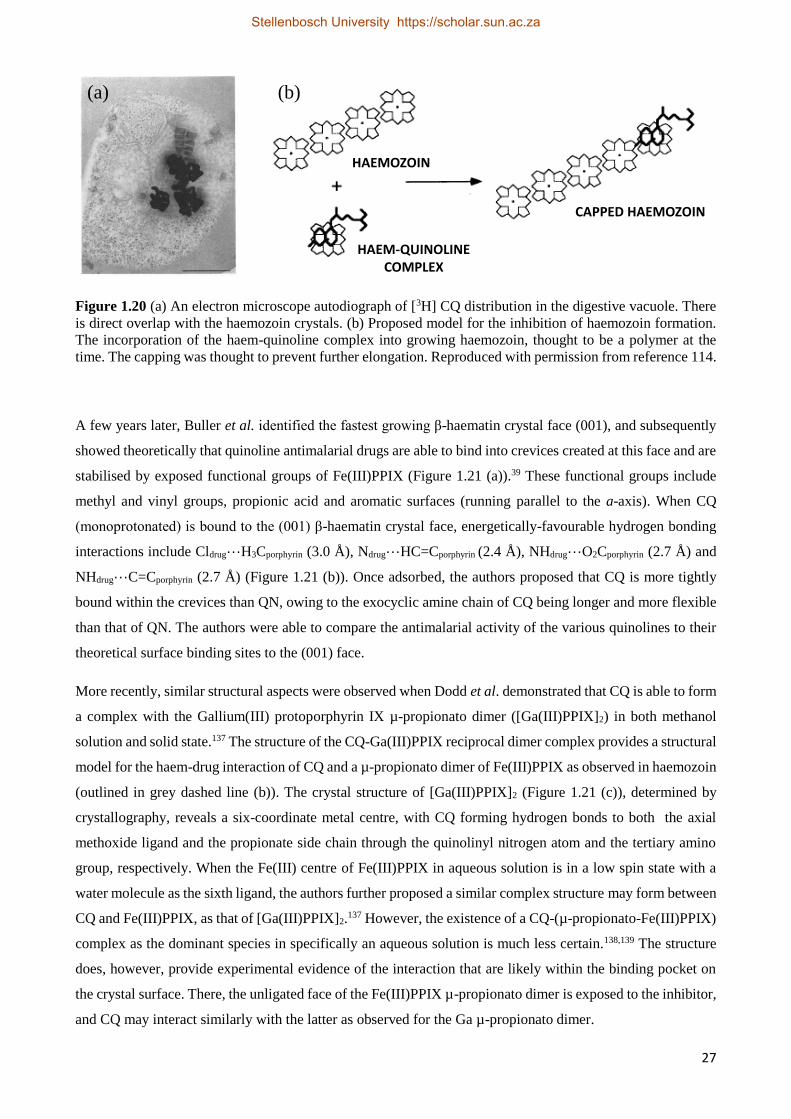
27
Figure 1.20 (a) An electron microscope autodiograph of [3H] CQ distribution in the digestive vacuole. There
is direct overlap with the haemozoin crystals. (b) Proposed model for the inhibition of haemozoin formation.
The incorporation of the haem-quinoline complex into growing haemozoin, thought to be a polymer at the
time. The capping was thought to prevent further elongation. Reproduced with permission from reference 114.
A few years later, Buller et al. identified the fastest growing β-haematin crystal face (001), and subsequently
showed theoretically that quinoline antimalarial drugs are able to bind into crevices created at this face and are
stabilised by exposed functional groups of Fe(III)PPIX (Figure 1.21 (a)).39 These functional groups include
methyl and vinyl groups, propionic acid and aromatic surfaces (running parallel to the a-axis). When CQ
(monoprotonated) is bound to the (001) β-haematin crystal face, energetically-favourable hydrogen bonding
interactions include Cldrug···H3Cporphyrin (3.0 Å), Ndrug···HC=Cporphyrin (2.4 Å), NHdrug···O2Cporphyrin (2.7 Å) and
NHdrug···C=Cporphyrin (2.7 Å) (Figure 1.21 (b)). Once adsorbed, the authors proposed that CQ is more tightly
bound within the crevices than QN, owing to the exocyclic amine chain of CQ being longer and more flexible
than that of QN. The authors were able to compare the antimalarial activity of the various quinolines to their
theoretical surface binding sites to the (001) face.
More recently, similar structural aspects were observed when Dodd et al. demonstrated that CQ is able to form
a complex with the Gallium(III) protoporphyrin IX µ-propionato dimer ([Ga(III)PPIX]2) in both methanol
solution and solid state.137 The structure of the CQ-Ga(III)PPIX reciprocal dimer complex provides a structural
model for the haem-drug interaction of CQ and a µ-propionato dimer of Fe(III)PPIX as observed in haemozoin
(outlined in grey dashed line (b)). The crystal structure of [Ga(III)PPIX]2 (Figure 1.21 (c)), determined by
crystallography, reveals a six-coordinate metal centre, with CQ forming hydrogen bonds to both the axial
methoxide ligand and the propionate side chain through the quinolinyl nitrogen atom and the tertiary amino
group, respectively. When the Fe(III) centre of Fe(III)PPIX in aqueous solution is in a low spin state with a
water molecule as the sixth ligand, the authors further proposed a similar complex structure may form between
CQ and Fe(III)PPIX, as that of [Ga(III)PPIX]2.137 However, the existence of a CQ-(µ-propionato-Fe(III)PPIX)
complex as the dominant species in specifically an aqueous solution is much less certain.138,139 The structure
does, however, provide experimental evidence of the interaction that are likely within the binding pocket on
the crystal surface. There, the unligated face of the Fe(III)PPIX µ-propionato dimer is exposed to the inhibitor,
and CQ may interact similarly with the latter as observed for the Ga µ-propionato dimer.
(a) (b)
CAPPED HAEMOZOIN
HAEMOZOIN
HAEM-QUINOLINE COMPLEX
Stellenbosch University https://scholar.sun.ac.za
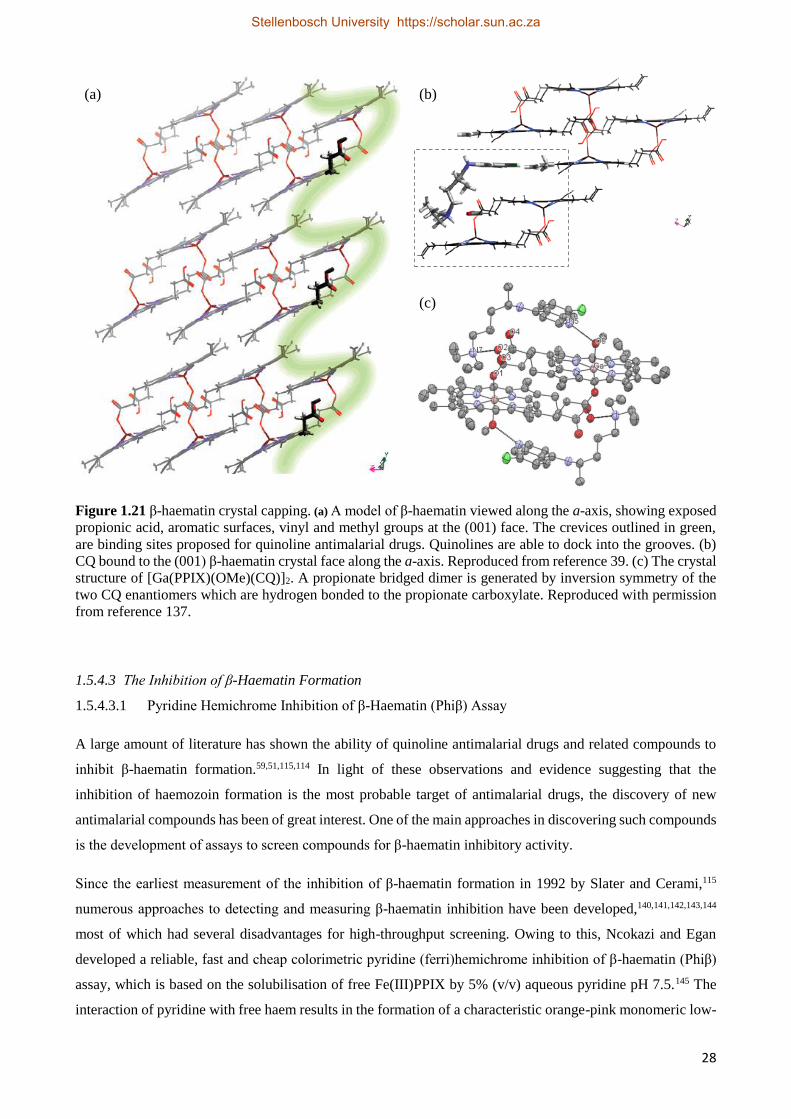
28
Figure 1.21 β-haematin crystal capping. (a) A model of β-haematin viewed along the a-axis, showing exposed
propionic acid, aromatic surfaces, vinyl and methyl groups at the (001) face. The crevices outlined in green,
are binding sites proposed for quinoline antimalarial drugs. Quinolines are able to dock into the grooves. (b)
CQ bound to the (001) β-haematin crystal face along the a-axis. Reproduced from reference 39. (c) The crystal
structure of [Ga(PPIX)(OMe)(CQ)]2. A propionate bridged dimer is generated by inversion symmetry of the
two CQ enantiomers which are hydrogen bonded to the propionate carboxylate. Reproduced with permission
from reference 137.
1.5.4.3 The Inhibition of β-Haematin Formation
1.5.4.3.1 Pyridine Hemichrome Inhibition of β-Haematin (Phiβ) Assay
A large amount of literature has shown the ability of quinoline antimalarial drugs and related compounds to
inhibit β-haematin formation.59,51,115,114 In light of these observations and evidence suggesting that the
inhibition of haemozoin formation is the most probable target of antimalarial drugs, the discovery of new
antimalarial compounds has been of great interest. One of the main approaches in discovering such compounds
is the development of assays to screen compounds for β-haematin inhibitory activity.
Since the earliest measurement of the inhibition of β-haematin formation in 1992 by Slater and Cerami,115
numerous approaches to detecting and measuring β-haematin inhibition have been developed,140,141,142,143,144
most of which had several disadvantages for high-throughput screening. Owing to this, Ncokazi and Egan
developed a reliable, fast and cheap colorimetric pyridine (ferri)hemichrome inhibition of β-haematin (Phiβ)
assay, which is based on the solubilisation of free Fe(III)PPIX by 5% (v/v) aqueous pyridine pH 7.5.145 The
interaction of pyridine with free haem results in the formation of a characteristic orange-pink monomeric low-
(a) (b)
(c)
Stellenbosch University https://scholar.sun.ac.za
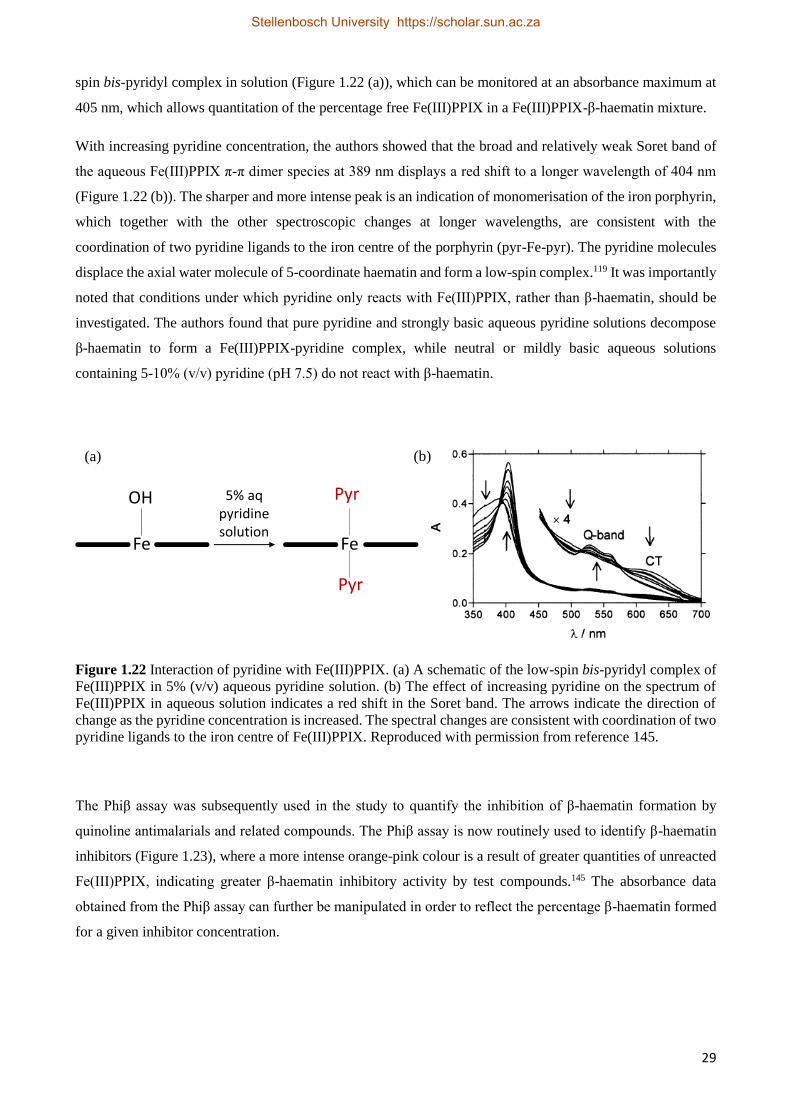
29
spin bis-pyridyl complex in solution (Figure 1.22 (a)), which can be monitored at an absorbance maximum at
405 nm, which allows quantitation of the percentage free Fe(III)PPIX in a Fe(III)PPIX-β-haematin mixture.
With increasing pyridine concentration, the authors showed that the broad and relatively weak Soret band of
the aqueous Fe(III)PPIX π-π dimer species at 389 nm displays a red shift to a longer wavelength of 404 nm
(Figure 1.22 (b)). The sharper and more intense peak is an indication of monomerisation of the iron porphyrin,
which together with the other spectroscopic changes at longer wavelengths, are consistent with the
coordination of two pyridine ligands to the iron centre of the porphyrin (pyr-Fe-pyr). The pyridine molecules
displace the axial water molecule of 5-coordinate haematin and form a low-spin complex.119 It was importantly
noted that conditions under which pyridine only reacts with Fe(III)PPIX, rather than β-haematin, should be
investigated. The authors found that pure pyridine and strongly basic aqueous pyridine solutions decompose
β-haematin to form a Fe(III)PPIX-pyridine complex, while neutral or mildly basic aqueous solutions
containing 5-10% (v/v) pyridine (pH 7.5) do not react with β-haematin.
Figure 1.22 Interaction of pyridine with Fe(III)PPIX. (a) A schematic of the low-spin bis-pyridyl complex of
Fe(III)PPIX in 5% (v/v) aqueous pyridine solution. (b) The effect of increasing pyridine on the spectrum of
Fe(III)PPIX in aqueous solution indicates a red shift in the Soret band. The arrows indicate the direction of
change as the pyridine concentration is increased. The spectral changes are consistent with coordination of two
pyridine ligands to the iron centre of Fe(III)PPIX. Reproduced with permission from reference 145.
The Phiβ assay was subsequently used in the study to quantify the inhibition of β-haematin formation by
quinoline antimalarials and related compounds. The Phiβ assay is now routinely used to identify β-haematin
inhibitors (Figure 1.23), where a more intense orange-pink colour is a result of greater quantities of unreacted
Fe(III)PPIX, indicating greater β-haematin inhibitory activity by test compounds.145 The absorbance data
obtained from the Phiβ assay can further be manipulated in order to reflect the percentage β-haematin formed
for a given inhibitor concentration.
(a)
Fe
OH
Fe
Pyr
Pyr
5% aqpyridine solution
(b)
Stellenbosch University https://scholar.sun.ac.za
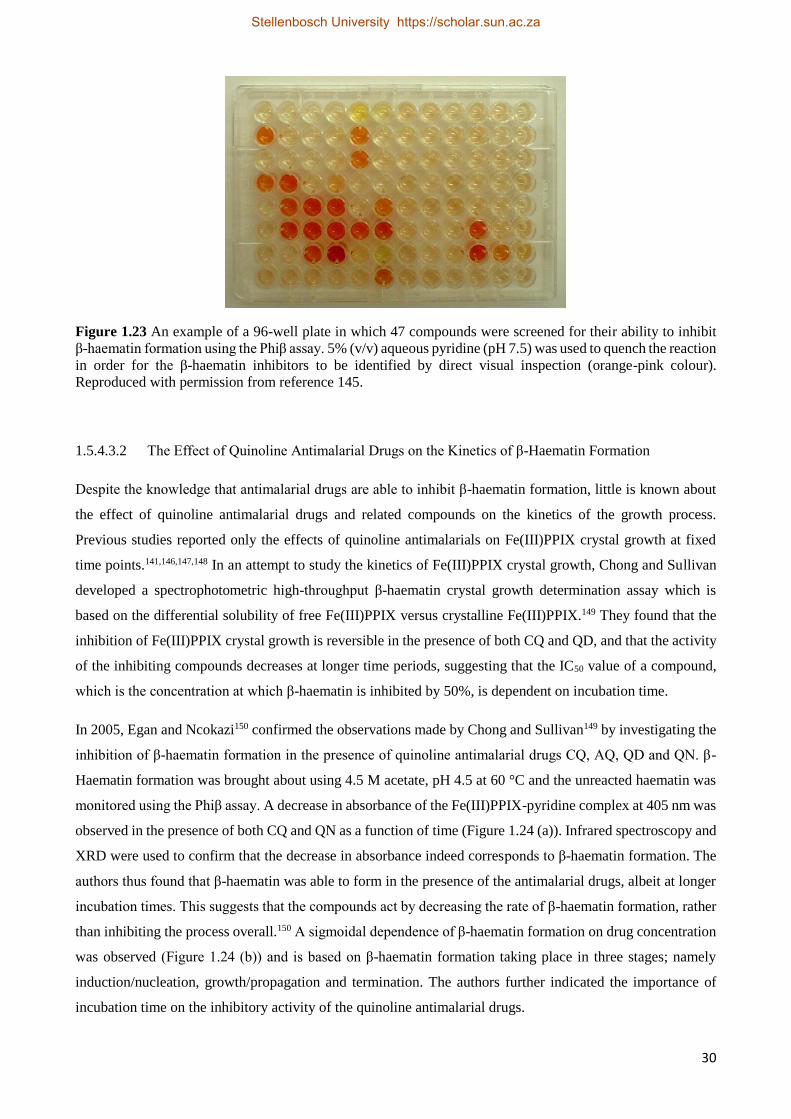
30
Figure 1.23 An example of a 96-well plate in which 47 compounds were screened for their ability to inhibit
β-haematin formation using the Phiβ assay. 5% (v/v) aqueous pyridine (pH 7.5) was used to quench the reaction
in order for the β-haematin inhibitors to be identified by direct visual inspection (orange-pink colour).
Reproduced with permission from reference 145.
1.5.4.3.2 The Effect of Quinoline Antimalarial Drugs on the Kinetics of β-Haematin Formation
Despite the knowledge that antimalarial drugs are able to inhibit β-haematin formation, little is known about
the effect of quinoline antimalarial drugs and related compounds on the kinetics of the growth process.
Previous studies reported only the effects of quinoline antimalarials on Fe(III)PPIX crystal growth at fixed
time points.141,146,147,148 In an attempt to study the kinetics of Fe(III)PPIX crystal growth, Chong and Sullivan
developed a spectrophotometric high-throughput β-haematin crystal growth determination assay which is
based on the differential solubility of free Fe(III)PPIX versus crystalline Fe(III)PPIX.149 They found that the
inhibition of Fe(III)PPIX crystal growth is reversible in the presence of both CQ and QD, and that the activity
of the inhibiting compounds decreases at longer time periods, suggesting that the IC50 value of a compound,
which is the concentration at which β-haematin is inhibited by 50%, is dependent on incubation time.
In 2005, Egan and Ncokazi150 confirmed the observations made by Chong and Sullivan149 by investigating the
inhibition of β-haematin formation in the presence of quinoline antimalarial drugs CQ, AQ, QD and QN. β-
Haematin formation was brought about using 4.5 M acetate, pH 4.5 at 60 °C and the unreacted haematin was
monitored using the Phiβ assay. A decrease in absorbance of the Fe(III)PPIX-pyridine complex at 405 nm was
observed in the presence of both CQ and QN as a function of time (Figure 1.24 (a)). Infrared spectroscopy and
XRD were used to confirm that the decrease in absorbance indeed corresponds to β-haematin formation. The
authors thus found that β-haematin was able to form in the presence of the antimalarial drugs, albeit at longer
incubation times. This suggests that the compounds act by decreasing the rate of β-haematin formation, rather
than inhibiting the process overall.150 A sigmoidal dependence of β-haematin formation on drug concentration
was observed (Figure 1.24 (b)) and is based on β-haematin formation taking place in three stages; namely
induction/nucleation, growth/propagation and termination. The authors further indicated the importance of
incubation time on the inhibitory activity of the quinoline antimalarial drugs.
Stellenbosch University https://scholar.sun.ac.za
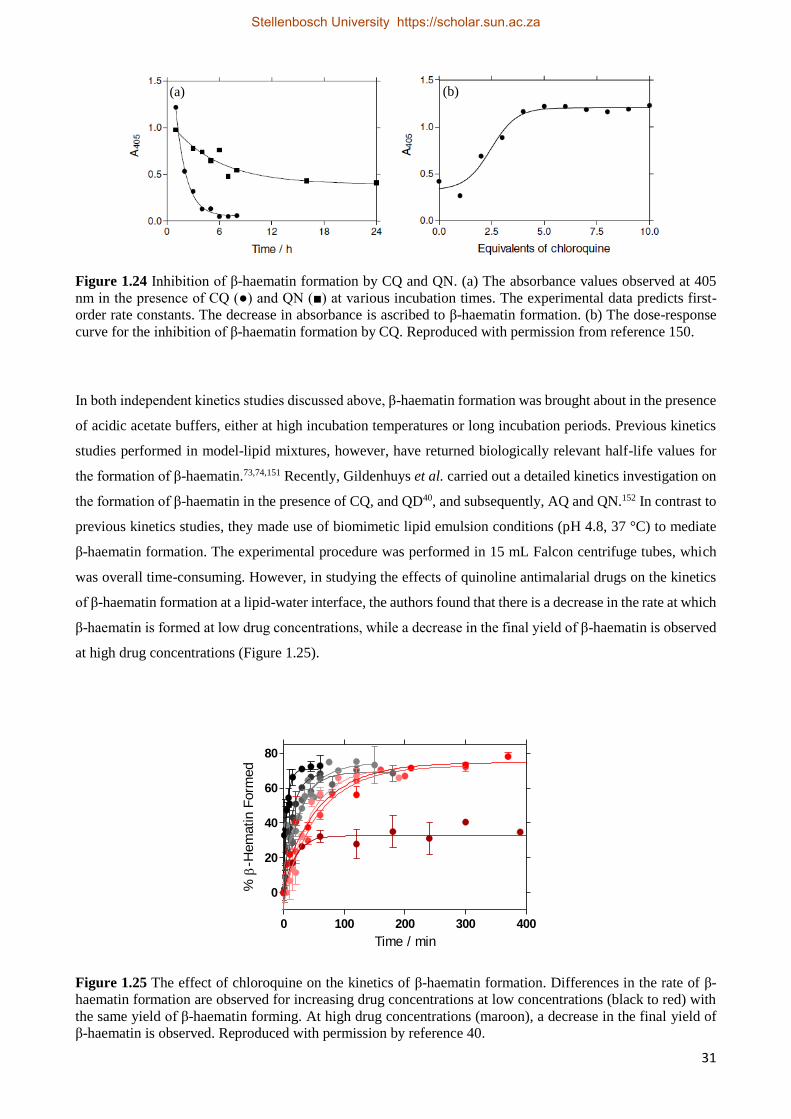
31
Figure 1.24 Inhibition of β-haematin formation by CQ and QN. (a) The absorbance values observed at 405
nm in the presence of CQ (●) and QN (■) at various incubation times. The experimental data predicts first-
order rate constants. The decrease in absorbance is ascribed to β-haematin formation. (b) The dose-response
curve for the inhibition of β-haematin formation by CQ. Reproduced with permission from reference 150.
In both independent kinetics studies discussed above, β-haematin formation was brought about in the presence
of acidic acetate buffers, either at high incubation temperatures or long incubation periods. Previous kinetics
studies performed in model-lipid mixtures, however, have returned biologically relevant half-life values for
the formation of β-haematin.73,74,151 Recently, Gildenhuys et al. carried out a detailed kinetics investigation on
the formation of β-haematin in the presence of CQ, and QD40, and subsequently, AQ and QN.152 In contrast to
previous kinetics studies, they made use of biomimetic lipid emulsion conditions (pH 4.8, 37 °C) to mediate
β-haematin formation. The experimental procedure was performed in 15 mL Falcon centrifuge tubes, which
was overall time-consuming. However, in studying the effects of quinoline antimalarial drugs on the kinetics
of β-haematin formation at a lipid-water interface, the authors found that there is a decrease in the rate at which
β-haematin is formed at low drug concentrations, while a decrease in the final yield of β-haematin is observed
at high drug concentrations (Figure 1.25).
0 100 200 300 400
0
20
40
60
80
Time / min
%
-Hem
atin F
orm
ed
Figure 1.25 The effect of chloroquine on the kinetics of β-haematin formation. Differences in the rate of β-
haematin formation are observed for increasing drug concentrations at low concentrations (black to red) with
the same yield of β-haematin forming. At high drug concentrations (maroon), a decrease in the final yield of
β-haematin is observed. Reproduced with permission by reference 40.
(a) (b)
Stellenbosch University https://scholar.sun.ac.za
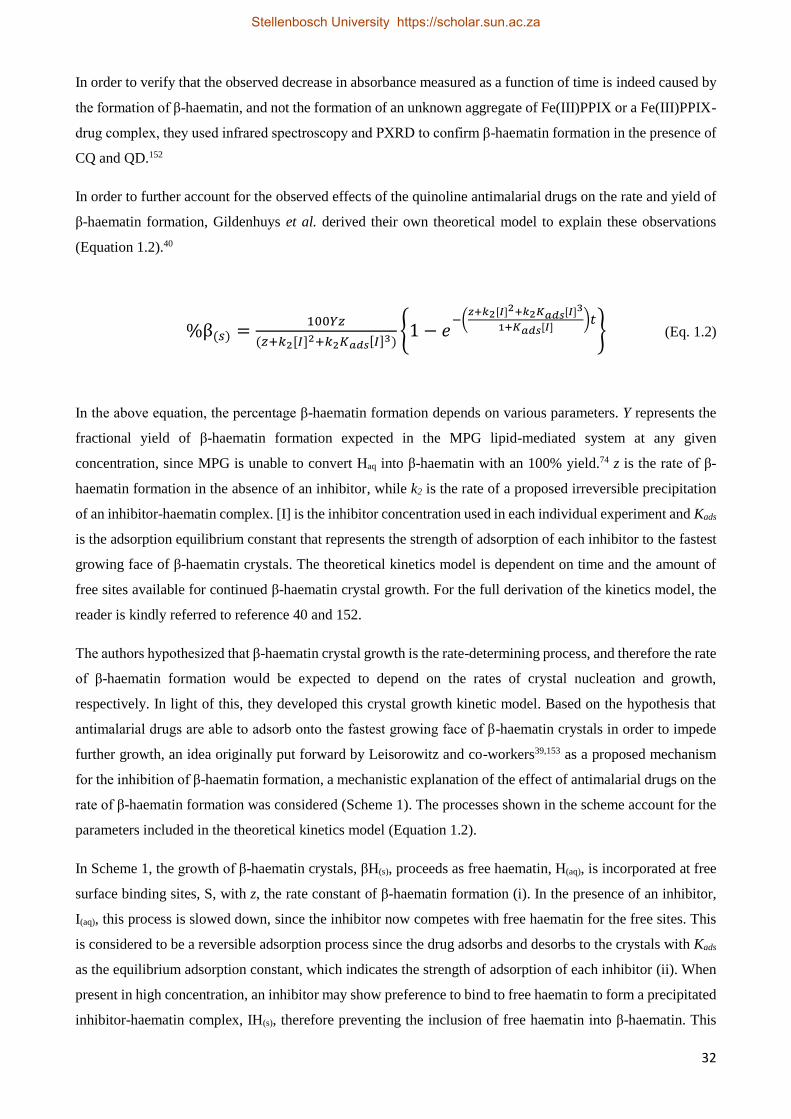
32
In order to verify that the observed decrease in absorbance measured as a function of time is indeed caused by
the formation of β-haematin, and not the formation of an unknown aggregate of Fe(III)PPIX or a Fe(III)PPIX-
drug complex, they used infrared spectroscopy and PXRD to confirm β-haematin formation in the presence of
CQ and QD.152
In order to further account for the observed effects of the quinoline antimalarial drugs on the rate and yield of
β-haematin formation, Gildenhuys et al. derived their own theoretical model to explain these observations
(Equation 1.2).40
%β(𝑠) =100𝑌𝑧
(𝑧+𝑘2[𝐼]2+𝑘2𝐾𝑎𝑑𝑠[𝐼]3){1 − 𝑒
−(𝑧+𝑘2[𝐼]2+𝑘2𝐾𝑎𝑑𝑠[𝐼]3
1+𝐾𝑎𝑑𝑠[𝐼])𝑡
} (Eq. 1.2)
In the above equation, the percentage β-haematin formation depends on various parameters. Y represents the
fractional yield of β-haematin formation expected in the MPG lipid-mediated system at any given
concentration, since MPG is unable to convert Haq into β-haematin with an 100% yield.74 z is the rate of β-
haematin formation in the absence of an inhibitor, while k2 is the rate of a proposed irreversible precipitation
of an inhibitor-haematin complex. [I] is the inhibitor concentration used in each individual experiment and Kads
is the adsorption equilibrium constant that represents the strength of adsorption of each inhibitor to the fastest
growing face of β-haematin crystals. The theoretical kinetics model is dependent on time and the amount of
free sites available for continued β-haematin crystal growth. For the full derivation of the kinetics model, the
reader is kindly referred to reference 40 and 152.
The authors hypothesized that β-haematin crystal growth is the rate-determining process, and therefore the rate
of β-haematin formation would be expected to depend on the rates of crystal nucleation and growth,
respectively. In light of this, they developed this crystal growth kinetic model. Based on the hypothesis that
antimalarial drugs are able to adsorb onto the fastest growing face of β-haematin crystals in order to impede
further growth, an idea originally put forward by Leisorowitz and co-workers39,153 as a proposed mechanism
for the inhibition of β-haematin formation, a mechanistic explanation of the effect of antimalarial drugs on the
rate of β-haematin formation was considered (Scheme 1). The processes shown in the scheme account for the
parameters included in the theoretical kinetics model (Equation 1.2).
In Scheme 1, the growth of β-haematin crystals, βH(s), proceeds as free haematin, H(aq), is incorporated at free
surface binding sites, S, with z, the rate constant of β-haematin formation (i). In the presence of an inhibitor,
I(aq), this process is slowed down, since the inhibitor now competes with free haematin for the free sites. This
is considered to be a reversible adsorption process since the drug adsorbs and desorbs to the crystals with Kads
as the equilibrium adsorption constant, which indicates the strength of adsorption of each inhibitor (ii). When
present in high concentration, an inhibitor may show preference to bind to free haematin to form a precipitated
inhibitor-haematin complex, IH(s), therefore preventing the inclusion of free haematin into β-haematin. This
Stellenbosch University https://scholar.sun.ac.za
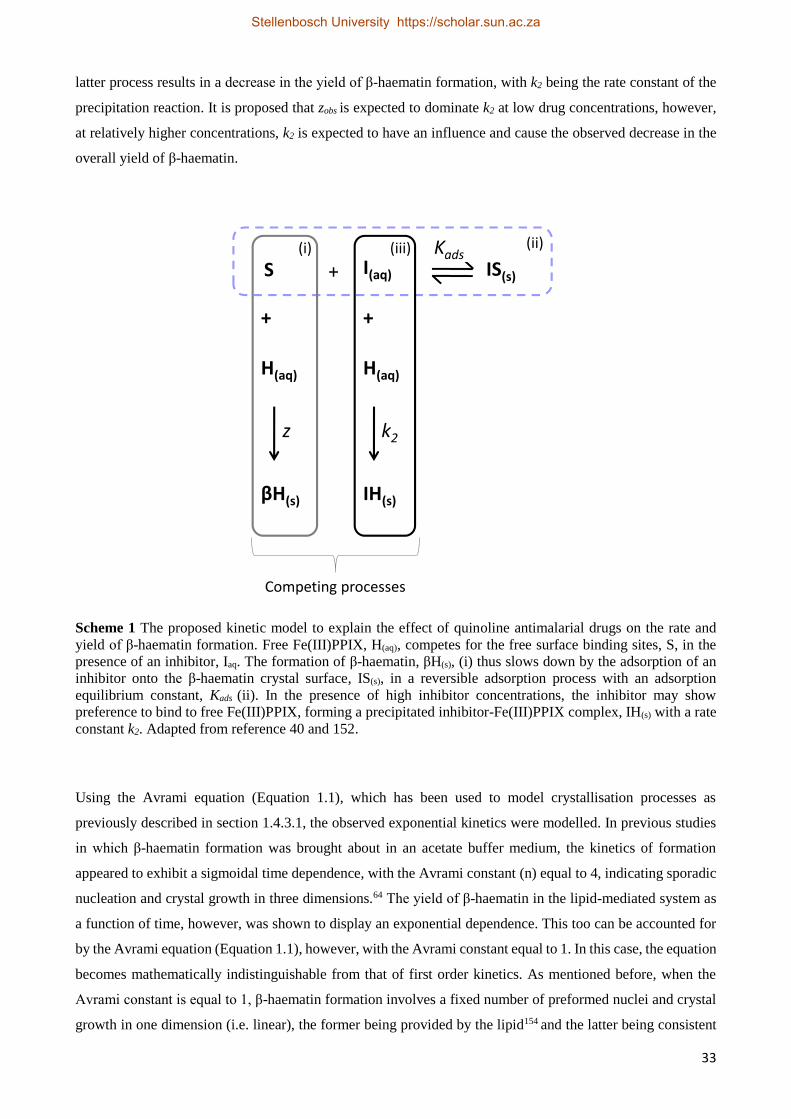
33
latter process results in a decrease in the yield of β-haematin formation, with k2 being the rate constant of the
precipitation reaction. It is proposed that zobs is expected to dominate k2 at low drug concentrations, however,
at relatively higher concentrations, k2 is expected to have an influence and cause the observed decrease in the
overall yield of β-haematin.
Scheme 1 The proposed kinetic model to explain the effect of quinoline antimalarial drugs on the rate and
yield of β-haematin formation. Free Fe(III)PPIX, H(aq), competes for the free surface binding sites, S, in the
presence of an inhibitor, Iaq. The formation of β-haematin, βH(s), (i) thus slows down by the adsorption of an
inhibitor onto the β-haematin crystal surface, IS(s), in a reversible adsorption process with an adsorption
equilibrium constant, Kads (ii). In the presence of high inhibitor concentrations, the inhibitor may show
preference to bind to free Fe(III)PPIX, forming a precipitated inhibitor-Fe(III)PPIX complex, IH(s) with a rate
constant k2. Adapted from reference 40 and 152.
Using the Avrami equation (Equation 1.1), which has been used to model crystallisation processes as
previously described in section 1.4.3.1, the observed exponential kinetics were modelled. In previous studies
in which β-haematin formation was brought about in an acetate buffer medium, the kinetics of formation
appeared to exhibit a sigmoidal time dependence, with the Avrami constant (n) equal to 4, indicating sporadic
nucleation and crystal growth in three dimensions.64 The yield of β-haematin in the lipid-mediated system as
a function of time, however, was shown to display an exponential dependence. This too can be accounted for
by the Avrami equation (Equation 1.1), however, with the Avrami constant equal to 1. In this case, the equation
becomes mathematically indistinguishable from that of first order kinetics. As mentioned before, when the
Avrami constant is equal to 1, β-haematin formation involves a fixed number of preformed nuclei and crystal
growth in one dimension (i.e. linear), the former being provided by the lipid154 and the latter being consistent
IS(s)+SKads
I(aq)
+
H(aq)
IH(s)
k2
)
+
H(aq)
βH(s)
z
Competing processes
(i) (ii)(iii)
Stellenbosch University https://scholar.sun.ac.za
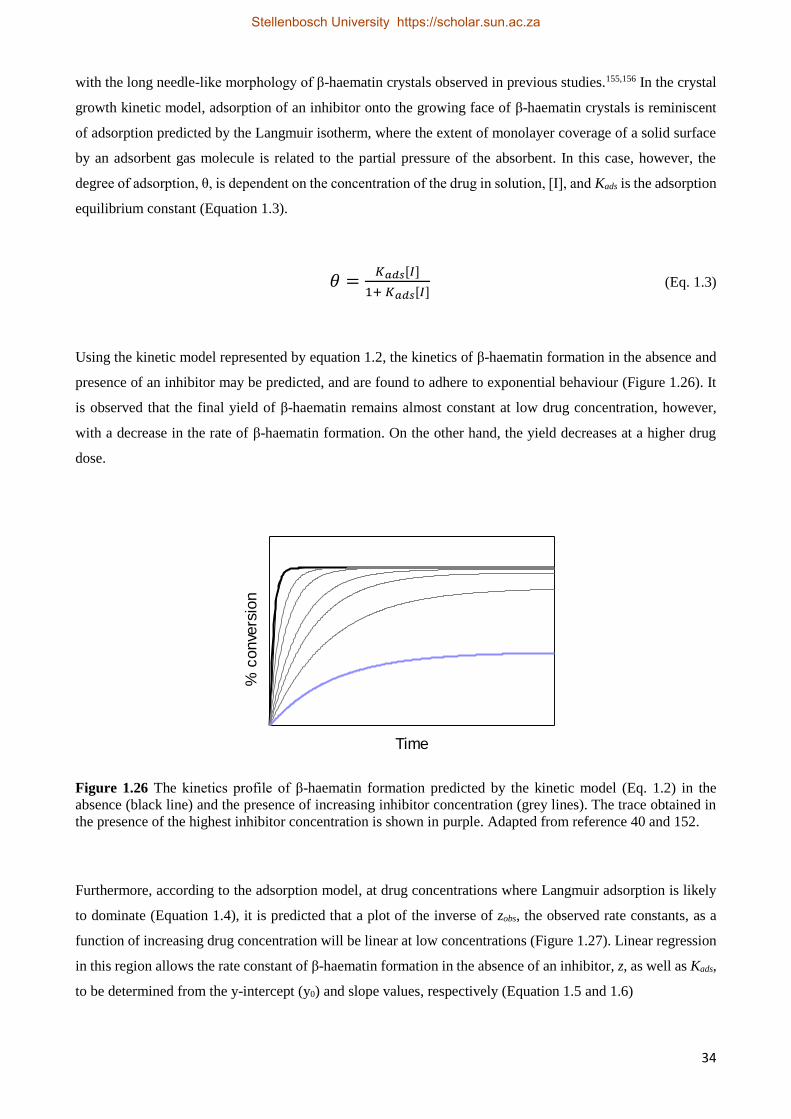
34
with the long needle-like morphology of β-haematin crystals observed in previous studies.155,156 In the crystal
growth kinetic model, adsorption of an inhibitor onto the growing face of β-haematin crystals is reminiscent
of adsorption predicted by the Langmuir isotherm, where the extent of monolayer coverage of a solid surface
by an adsorbent gas molecule is related to the partial pressure of the absorbent. In this case, however, the
degree of adsorption, θ, is dependent on the concentration of the drug in solution, [I], and Kads is the adsorption
equilibrium constant (Equation 1.3).
𝜃 =𝐾𝑎𝑑𝑠[𝐼]
1+ 𝐾𝑎𝑑𝑠[𝐼] (Eq. 1.3)
Using the kinetic model represented by equation 1.2, the kinetics of β-haematin formation in the absence and
presence of an inhibitor may be predicted, and are found to adhere to exponential behaviour (Figure 1.26). It
is observed that the final yield of β-haematin remains almost constant at low drug concentration, however,
with a decrease in the rate of β-haematin formation. On the other hand, the yield decreases at a higher drug
dose.
Time
% c
onve
rsio
n
Figure 1.26 The kinetics profile of β-haematin formation predicted by the kinetic model (Eq. 1.2) in the
absence (black line) and the presence of increasing inhibitor concentration (grey lines). The trace obtained in
the presence of the highest inhibitor concentration is shown in purple. Adapted from reference 40 and 152.
Furthermore, according to the adsorption model, at drug concentrations where Langmuir adsorption is likely
to dominate (Equation 1.4), it is predicted that a plot of the inverse of zobs, the observed rate constants, as a
function of increasing drug concentration will be linear at low concentrations (Figure 1.27). Linear regression
in this region allows the rate constant of β-haematin formation in the absence of an inhibitor, z, as well as Kads,
to be determined from the y-intercept (y0) and slope values, respectively (Equation 1.5 and 1.6)
Stellenbosch University https://scholar.sun.ac.za
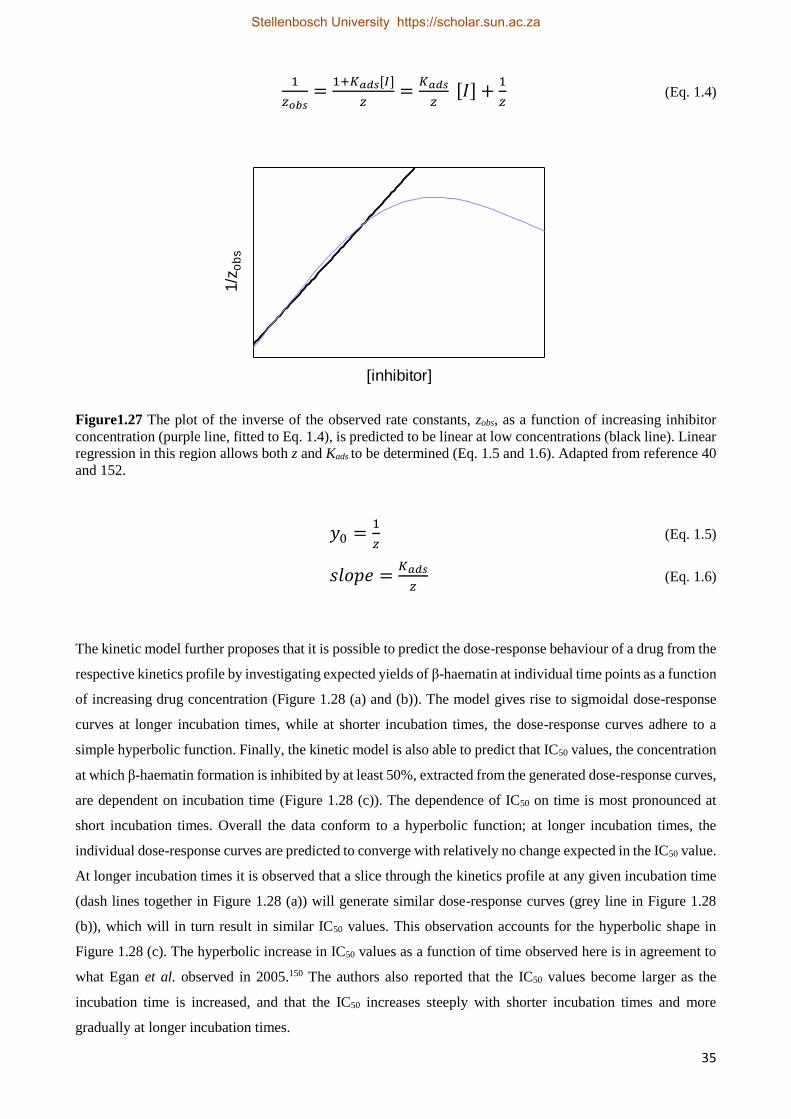
35
1
𝑧𝑜𝑏𝑠=
1+𝐾𝑎𝑑𝑠[𝐼]
𝑧=
𝐾𝑎𝑑𝑠
𝑧 [𝐼] +
1
𝑧 (Eq. 1.4)
[inhibitor]
1/z
ob
s
Figure1.27 The plot of the inverse of the observed rate constants, zobs, as a function of increasing inhibitor
concentration (purple line, fitted to Eq. 1.4), is predicted to be linear at low concentrations (black line). Linear
regression in this region allows both z and Kads to be determined (Eq. 1.5 and 1.6). Adapted from reference 40
and 152.
𝑦0 =1
𝑧 (Eq. 1.5)
𝑠𝑙𝑜𝑝𝑒 =𝐾𝑎𝑑𝑠
𝑧 (Eq. 1.6)
The kinetic model further proposes that it is possible to predict the dose-response behaviour of a drug from the
respective kinetics profile by investigating expected yields of β-haematin at individual time points as a function
of increasing drug concentration (Figure 1.28 (a) and (b)). The model gives rise to sigmoidal dose-response
curves at longer incubation times, while at shorter incubation times, the dose-response curves adhere to a
simple hyperbolic function. Finally, the kinetic model is also able to predict that IC50 values, the concentration
at which β-haematin formation is inhibited by at least 50%, extracted from the generated dose-response curves,
are dependent on incubation time (Figure 1.28 (c)). The dependence of IC50 on time is most pronounced at
short incubation times. Overall the data conform to a hyperbolic function; at longer incubation times, the
individual dose-response curves are predicted to converge with relatively no change expected in the IC50 value.
At longer incubation times it is observed that a slice through the kinetics profile at any given incubation time
(dash lines together in Figure 1.28 (a)) will generate similar dose-response curves (grey line in Figure 1.28
(b)), which will in turn result in similar IC50 values. This observation accounts for the hyperbolic shape in
Figure 1.28 (c). The hyperbolic increase in IC50 values as a function of time observed here is in agreement to
what Egan et al. observed in 2005.150 The authors also reported that the IC50 values become larger as the
incubation time is increased, and that the IC50 increases steeply with shorter incubation times and more
gradually at longer incubation times.
Stellenbosch University https://scholar.sun.ac.za
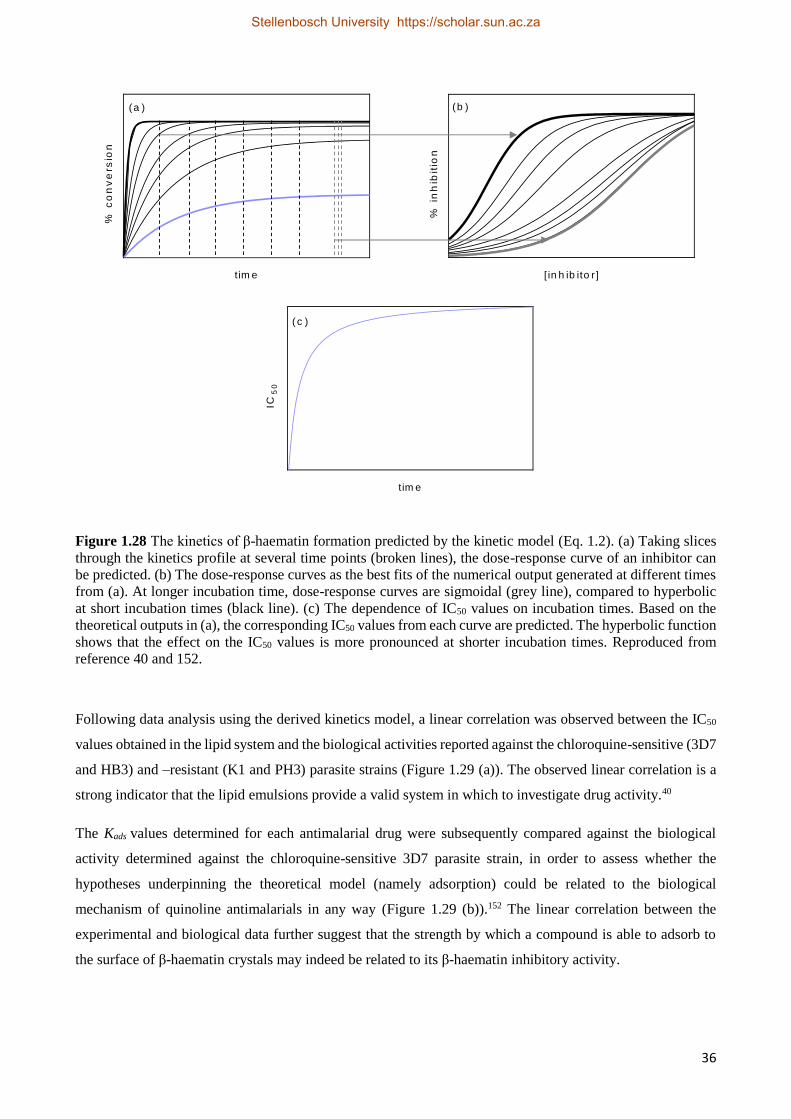
36
Figure 1.28 The kinetics of β-haematin formation predicted by the kinetic model (Eq. 1.2). (a) Taking slices
through the kinetics profile at several time points (broken lines), the dose-response curve of an inhibitor can
be predicted. (b) The dose-response curves as the best fits of the numerical output generated at different times
from (a). At longer incubation time, dose-response curves are sigmoidal (grey line), compared to hyperbolic
at short incubation times (black line). (c) The dependence of IC50 values on incubation times. Based on the
theoretical outputs in (a), the corresponding IC50 values from each curve are predicted. The hyperbolic function
shows that the effect on the IC50 values is more pronounced at shorter incubation times. Reproduced from
reference 40 and 152.
Following data analysis using the derived kinetics model, a linear correlation was observed between the IC50
values obtained in the lipid system and the biological activities reported against the chloroquine-sensitive (3D7
and HB3) and –resistant (K1 and PH3) parasite strains (Figure 1.29 (a)). The observed linear correlation is a
strong indicator that the lipid emulsions provide a valid system in which to investigate drug activity.40
The Kads values determined for each antimalarial drug were subsequently compared against the biological
activity determined against the chloroquine-sensitive 3D7 parasite strain, in order to assess whether the
hypotheses underpinning the theoretical model (namely adsorption) could be related to the biological
mechanism of quinoline antimalarials in any way (Figure 1.29 (b)).152 The linear correlation between the
experimental and biological data further suggest that the strength by which a compound is able to adsorb to
the surface of β-haematin crystals may indeed be related to its β-haematin inhibitory activity.
( c )
tim e
IC5
0
(a )
tim e
% c
on
ve
rsio
n( b )
[ in h ib ito r ]
% i
nh
ibit
ion
Stellenbosch University https://scholar.sun.ac.za
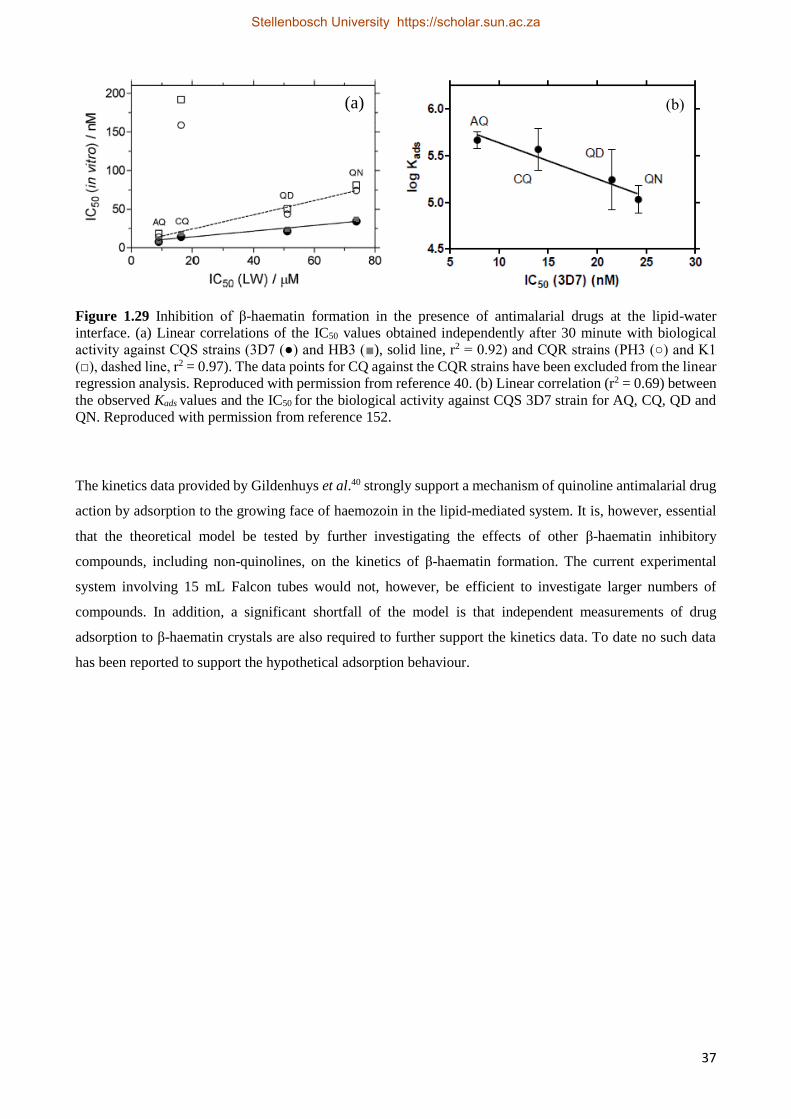
37
Figure 1.29 Inhibition of β-haematin formation in the presence of antimalarial drugs at the lipid-water
interface. (a) Linear correlations of the IC50 values obtained independently after 30 minute with biological
activity against CQS strains (3D7 (●) and HB3 (■), solid line, r2 = 0.92) and CQR strains (PH3 (○) and K1
(□), dashed line, r2 = 0.97). The data points for CQ against the CQR strains have been excluded from the linear
regression analysis. Reproduced with permission from reference 40. (b) Linear correlation (r2 = 0.69) between
the observed Kads values and the IC50 for the biological activity against CQS 3D7 strain for AQ, CQ, QD and
QN. Reproduced with permission from reference 152.
The kinetics data provided by Gildenhuys et al.40 strongly support a mechanism of quinoline antimalarial drug
action by adsorption to the growing face of haemozoin in the lipid-mediated system. It is, however, essential
that the theoretical model be tested by further investigating the effects of other β-haematin inhibitory
compounds, including non-quinolines, on the kinetics of β-haematin formation. The current experimental
system involving 15 mL Falcon tubes would not, however, be efficient to investigate larger numbers of
compounds. In addition, a significant shortfall of the model is that independent measurements of drug
adsorption to β-haematin crystals are also required to further support the kinetics data. To date no such data
has been reported to support the hypothetical adsorption behaviour.
(a) (b)
Stellenbosch University https://scholar.sun.ac.za
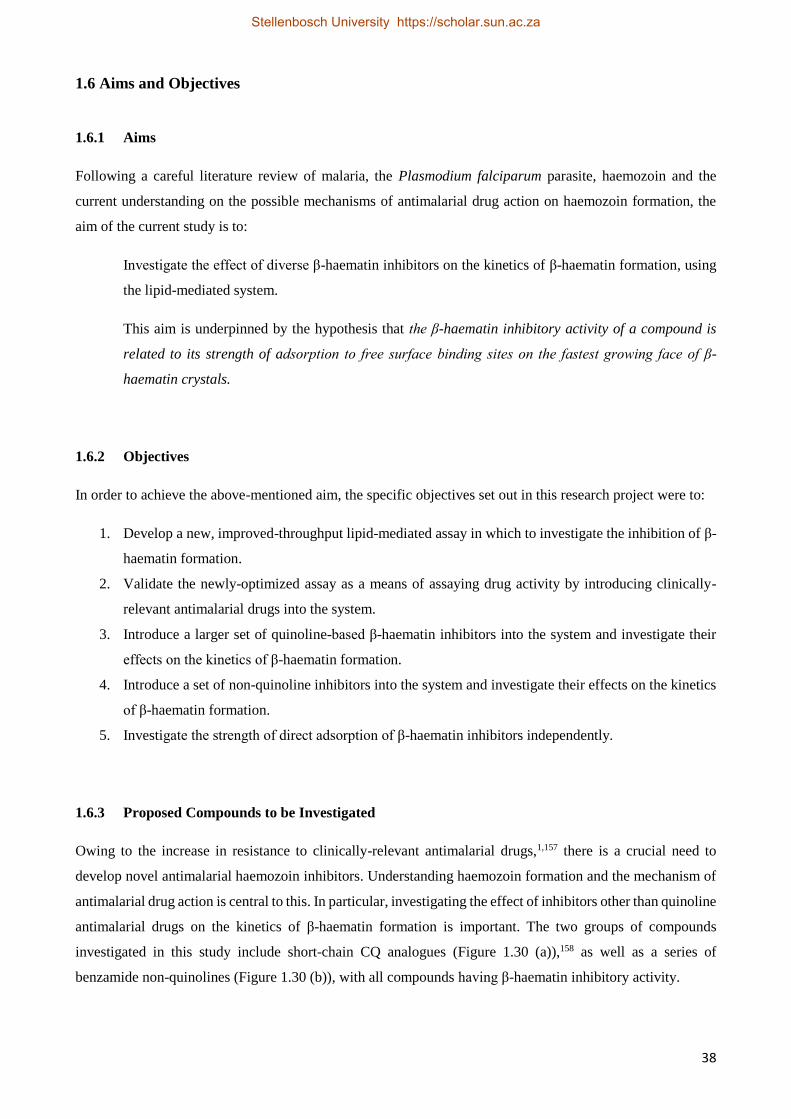
38
1.6 Aims and Objectives
1.6.1 Aims
Following a careful literature review of malaria, the Plasmodium falciparum parasite, haemozoin and the
current understanding on the possible mechanisms of antimalarial drug action on haemozoin formation, the
aim of the current study is to:
Investigate the effect of diverse β-haematin inhibitors on the kinetics of β-haematin formation, using
the lipid-mediated system.
This aim is underpinned by the hypothesis that the β-haematin inhibitory activity of a compound is
related to its strength of adsorption to free surface binding sites on the fastest growing face of β-
haematin crystals.
1.6.2 Objectives
In order to achieve the above-mentioned aim, the specific objectives set out in this research project were to:
1. Develop a new, improved-throughput lipid-mediated assay in which to investigate the inhibition of β-
haematin formation.
2. Validate the newly-optimized assay as a means of assaying drug activity by introducing clinically-
relevant antimalarial drugs into the system.
3. Introduce a larger set of quinoline-based β-haematin inhibitors into the system and investigate their
effects on the kinetics of β-haematin formation.
4. Introduce a set of non-quinoline inhibitors into the system and investigate their effects on the kinetics
of β-haematin formation.
5. Investigate the strength of direct adsorption of β-haematin inhibitors independently.
1.6.3 Proposed Compounds to be Investigated
Owing to the increase in resistance to clinically-relevant antimalarial drugs,1,157 there is a crucial need to
develop novel antimalarial haemozoin inhibitors. Understanding haemozoin formation and the mechanism of
antimalarial drug action is central to this. In particular, investigating the effect of inhibitors other than quinoline
antimalarial drugs on the kinetics of β-haematin formation is important. The two groups of compounds
investigated in this study include short-chain CQ analogues (Figure 1.30 (a)),158 as well as a series of
benzamide non-quinolines (Figure 1.30 (b)), with all compounds having β-haematin inhibitory activity.
Stellenbosch University https://scholar.sun.ac.za
39
Figure 1.30 (a) A series of N1, N1-diethyl-N2-(4-quinolinyl)-1, 2-ethanediamine compounds with different
substituents at the 7-position on the quinoline ring includes the 7-chloro (Q-Cl), -iodo (Q-I), -trifluoromethyl
(Q-CF3), -methoxy (Q-MeO) and –trifluoromethylthio (Q-SCF3) 4-aminoquinolines.158 (b) A series of
benzamide non-quinoline inhibitors with different substituents on the central aromatic ring, nQ-KW16, -17, -
23, -31, -32, and -33.
Q-Cl Q-I Q-CF3
Q-OMe Q-SCF3
nQ-KW16 nQ-KW23
nQ-KW33nQ-KW31 nQ-KW32
nQ-KW17
(a)
(b)
Stellenbosch University https://scholar.sun.ac.za
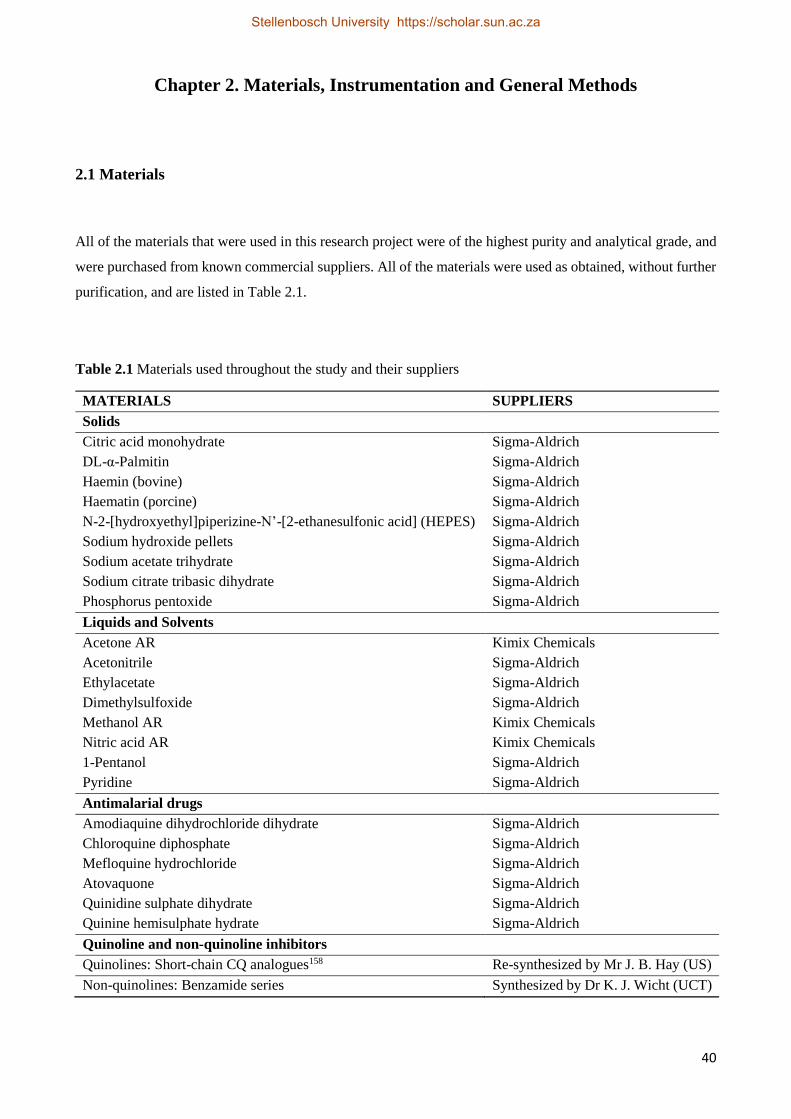
40
Chapter 2. Materials, Instrumentation and General Methods
2.1 Materials
All of the materials that were used in this research project were of the highest purity and analytical grade, and
were purchased from known commercial suppliers. All of the materials were used as obtained, without further
purification, and are listed in Table 2.1.
Table 2.1 Materials used throughout the study and their suppliers
MATERIALS SUPPLIERS
Solids
Citric acid monohydrate Sigma-Aldrich
DL-α-Palmitin Sigma-Aldrich
Haemin (bovine) Sigma-Aldrich
Haematin (porcine) Sigma-Aldrich
N-2-[hydroxyethyl]piperizine-N’-[2-ethanesulfonic acid] (HEPES) Sigma-Aldrich
Sodium hydroxide pellets Sigma-Aldrich
Sodium acetate trihydrate Sigma-Aldrich
Sodium citrate tribasic dihydrate Sigma-Aldrich
Phosphorus pentoxide Sigma-Aldrich
Liquids and Solvents
Acetone AR Kimix Chemicals
Acetonitrile Sigma-Aldrich
Ethylacetate Sigma-Aldrich
Dimethylsulfoxide Sigma-Aldrich
Methanol AR Kimix Chemicals
Nitric acid AR Kimix Chemicals
1-Pentanol Sigma-Aldrich
Pyridine Sigma-Aldrich
Antimalarial drugs
Amodiaquine dihydrochloride dihydrate Sigma-Aldrich
Chloroquine diphosphate Sigma-Aldrich
Mefloquine hydrochloride Sigma-Aldrich
Atovaquone Sigma-Aldrich
Quinidine sulphate dihydrate Sigma-Aldrich
Quinine hemisulphate hydrate Sigma-Aldrich
Quinoline and non-quinoline inhibitors
Quinolines: Short-chain CQ analogues158 Re-synthesized by Mr J. B. Hay (US)
Non-quinolines: Benzamide series Synthesized by Dr K. J. Wicht (UCT)
Stellenbosch University https://scholar.sun.ac.za
41
2.2 Instrumentation
2.2.1 Analytical Balance
An A&D Company HR-200 standard balance scale was used to weigh off materials weighing more than 10
mg and a Sartorius GMBH Göttingen sensitive balance scale was used to weigh off smaller quantities.
2.2.2 Centrifuge
A Hermle Labortechnik centrifuge (Z 206) with a maximum speed of 6000 rpm was used to centrifuge large-
volume samples in 15 mL Greiner Falcon centrifuge tubes. A Z 233 M-2 Hermle Labortechnik GbmH
centrifuge, with a maximum speed of 15000 rmp, was used to centrifuge smaller volumes in 2 mL eppendorf
tubes.
2.2.3 High Vacuum Pump
An Edwards Max high vacuum pump was used to dry materials overnight.
2.2.4 Infrared Spectroscopy
A NexusTM FT-IR spectrometer from Thermo Nicolet Instruments fitted with a Golden Gate attenuated total
reflection (ATR) accessory was used to record ATR-IR spectra.
2.2.5 Magnetic Stirrer Hot Plate
Heidolph MR-2002 and JKI JK-MSH-PRO standard magnetic stirrer hot plates were used to stir and heat
solutions.
2.2.6 Micro Glass Syringes
Microliter glass syringes (10 µL, 25 µL and 50 µL), obtained from Hamilton, were used for the accurate
delivery of small volumes of solutions. Glass is also preferred when handling solutions of haematin as it has
been shown to adsorb to plastic.82,87
Stellenbosch University https://scholar.sun.ac.za
42
2.2.7 Oven
Kinetics experiments were performed in a fan-assisted oven set at the required temperature (37 ± 1 °C).
2.2.8 pH Meter
A Mettler Toledo FE20 pH meter was used to perform all of the pH measurements. The electrode was
calibrated using pH buffer solutions (pH 4 and pH 7) obtained from Crison.
2.2.9 Powder X-Ray Diffraction
A PANalytical X-ray Powder Diffractometer was used to record PXRD data.
2.2.10 Scanning Electron Microscopy
A Leo 1430 VP scanning electron microscope was used to obtain structural images of samples. The images
show the surface morphology of the material.
2.2.11 Single- and Multi-Channel Micro Pipettes
For volumes greater than 25.0 µL, micro-pipettes were routinely used. Axygen Scientific single-channel (AP-
20, AP-200, AP-1000 and AP-5000) and Gilson multi-channel (P8X20 and P8X200) pipettes were used.
2.2.12 Ultrasonic Water Bath
An Elma TranssonicDigital ultrasonic water bath was used for direct adsorption studies. An operating
temperature of 37 ± 1 °C was maintained for the duration of the measurements, for which the ultrasound power
level 2 was used.
2.2.13 UV-Visible Spectroscopy
A Thermo Scientific Multisakan GO UV-Visible spectrophotometer was used to record single wavelength
readings as well as UV-visible spectra.
Stellenbosch University https://scholar.sun.ac.za
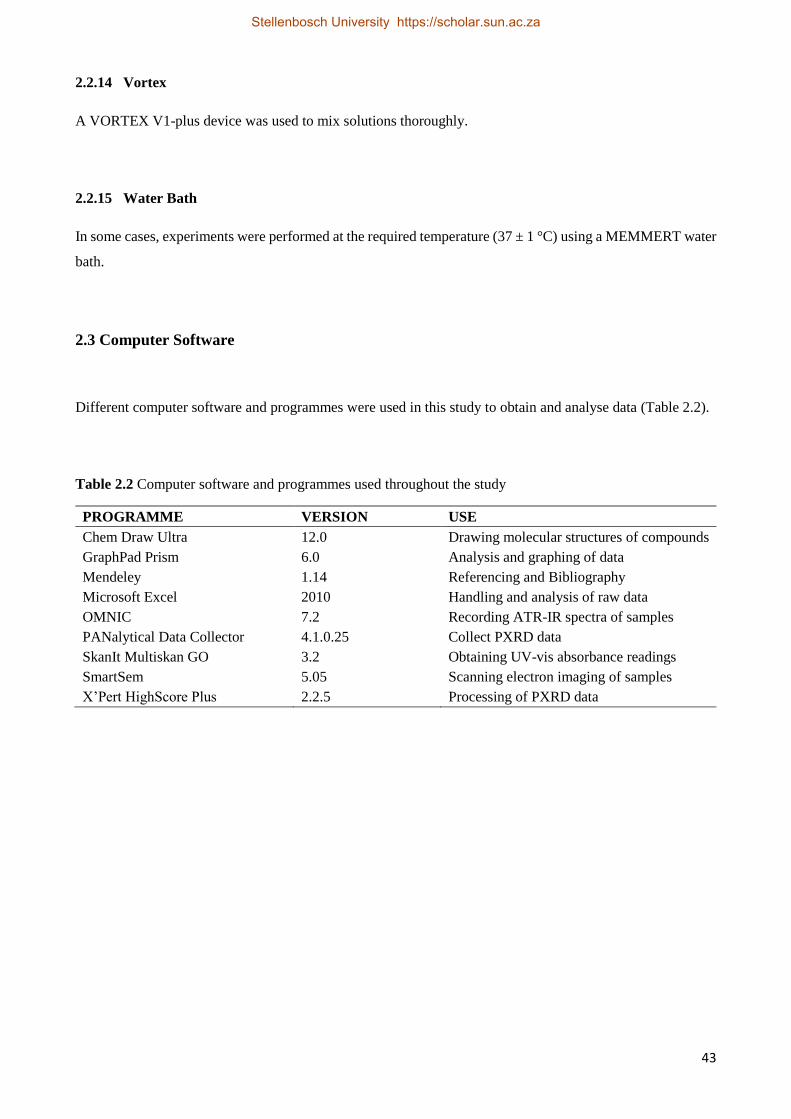
43
2.2.14 Vortex
A VORTEX V1-plus device was used to mix solutions thoroughly.
2.2.15 Water Bath
In some cases, experiments were performed at the required temperature (37 ± 1 °C) using a MEMMERT water
bath.
2.3 Computer Software
Different computer software and programmes were used in this study to obtain and analyse data (Table 2.2).
Table 2.2 Computer software and programmes used throughout the study
PROGRAMME VERSION USE
Chem Draw Ultra 12.0 Drawing molecular structures of compounds
GraphPad Prism 6.0 Analysis and graphing of data
Mendeley 1.14 Referencing and Bibliography
Microsoft Excel 2010 Handling and analysis of raw data
OMNIC 7.2 Recording ATR-IR spectra of samples
PANalytical Data Collector 4.1.0.25 Collect PXRD data
SkanIt Multiskan GO 3.2 Obtaining UV-vis absorbance readings
SmartSem 5.05 Scanning electron imaging of samples
X’Pert HighScore Plus 2.2.5 Processing of PXRD data
Stellenbosch University https://scholar.sun.ac.za
44
2.4 General Precautions in Sample Preparations and Handling Washing of Glassware and
Plasticware
Glass-distilled water was used to prepare water solvent solutions throughout the experiments. All glass- and
plasticware was washed with soap-water and rinsed with glass-distilled water and wash-acetone. Fe(III)PPIX-
contaminated glass syringes, cuvettes, glass- and plasticware were allowed to soak in 0.1 M NaOH for at least
one hour. After rinsing extensively with water, the cuvettes, glass- and plasticware were washed with 1 M
HNO3, followed by extensive rinsing with water. This procedure is important since Fe(III)PPIX adsorbs to
glass- and plasticware.82,87 All glassware were either air dried or dried in an oven at 37 °C after washing. All
pyridine-contaminated 24- and 96-well plates and lids were discarded immediately after use. New sterile plates
were used for every new experiment.
2.5 General Preparations
This section describes the solutions that were prepared often owing to their frequent use in the different
experiments carried out. The materials that were used to prepare these solutions have previously been listed in
Table 2.1.
2.5.1 50.0 mM Stock Solution of Citrate Buffer, pH 4.8
Citric acid monohydrate (5.255 g, 24.95 mmol) was dissolved in 450.0 mL distilled water. On adding a
concentrated solution of sodium hydroxide dropwise, the pH was adjusted to 4.8. The solution was then made
to volume in a 500 mL volumetric flask.
2.5.2 1:9 (v/v) Acetone: Methanol Solution
A solution was prepared in a 100.0 mL volumetric flask consisting of 10.0 mL of acetone, after which the
solution was made to volume with methanol.
2.5.3 0.10 M NaOH Solution
Solid NaOH pellets (1.000 g, 250.0 mmol) were dissolved in distilled water to a volume of 250.0 mL in a
volumetric flask.
Stellenbosch University https://scholar.sun.ac.za
45
2.5.4 2.0 M Stock Solution of HEPES Buffer, pH 7.5
HEPES acid (47.66 g, 200.0 mmol) was dissolved in 80.00 mL distilled water. On adding a concentrated
solution of sodium hydroxide dropwise, the pH was adjusted to 7.5. The solution was then made to volume
with distilled water in a 100 mL volumetric flask.
2.5.5 3.03 mM Lipid Solution
The neutral lipid, 1-monopalmitoyl-rac-glycerol (MPG), (10.0 mg, 30.26 μmol) was dissolved in 10.0 mL of
the 1:9 acetone: methanol solution. A fresh solution was prepared for each set of experiments.
2.5.6 3.16 mM Haematin Solution
Haematin (10.0 mg, 15.79 μmol) was dissolved in 2.00 mL of 0.10 M NaOH in a 15 mL Greiner Falcon
centrifuge tube. 3.00 mL of the 1:9 acetone: methanol solution was added after complete dissolution. A fresh
solution was prepared for each set of experiments.
2.5.7 30:30:40 (v/v) Pyridine: Aqueous Buffer: Acetone Solution
10.0 mL of 2.0 M HEPES buffer and 30.0 mL of pyridine were added to 40.0 mL acetone and thoroughly
mixed together. The solution was made up to 100.0 mL in a volumetric flask by adding distilled water.
2.5.8 0.20 M Stock Solution of HEPES Buffer, pH 7.5
HEPES acid (4.766 g, 20.0 mmol) was dissolved in 80.00 mL distilled water. On adding a concentrated
solution of sodium hydroxide dropwise, the pH was adjusted to 7.5. The solution was made up with distilled
water to 100.0 mL in a volumetric flask.
2.5.9 5: 45: 50 (v/v) Pyridine: Aqueous Buffer: Acetone Solution
10.0 mL of 0.20 M HEPES buffer and 5.00 mL of pyridine were added to 50.0 mL acetone and thoroughly
mixed together. The solution was made up to 100.0 mL in a volumetric flask by adding distilled water.
Stellenbosch University https://scholar.sun.ac.za
46
Chapter 3. The Effect of Quinoline Inhibitors on the Formation of β-Haematin
at the Lipid-Water Interface
3.1 Introduction
The inhibition of β-haematin (synthetic haemozoin) formation by clinically-relevant antimalarial drugs has
been of interest for a long period of time and to date, different systems have been investigated to probe their
mode of action in this regard.59,149,150 In a recent study conducted in our laboratory, the inhibition of β-haematin
formation has been investigated in a lipid-water interface system using the modified Phiβ assay,40 in which the
amount of free Fe(III)PPIX in a Fe(III)PPIX-β-haematin mixture is quantified (see section 1.5.4.3.1 for details
of the Phiβ assay). The study made use of monopalmitoyl-rac-glycerol (MPG) as a model lipid, and was the
first to systematically investigate the kinetic effect of four quinoline antimalarial drugs on the formation of β-
haematin under biomimetic conditions. A kinetic model underpinned by the Langmuir adsorption isotherm
was used to analyse the data, and the authors suggested that the β-haematin inhibitory activity of a compound
is related to its strength of adsorption to free surface binding sites on the growing β-haematin crystals.40 These
initial findings warranted further investigation, the most important being to study the effect of additional
inhibitors, in order to validate the hypothesis. Furthermore, the assay used in the original study was time-
consuming, and by improving the turnaround time per compound, it was proposed that a larger set of
compounds could be investigated. In the current study, clinically-relevant antimalarial drugs were initially
used to optimize an improved-throughput assay compared to the previous work. Having successfully
developed this more efficient assay, it has been possible to extend the data set to include a series of short-chain
chloroquine analogues,158 all of which contain the quinoline nucleus. Investigating a larger set of compounds
is of great importance to validate the hypothesis and substantiate the proposed theoretical kinetic model. For
each compound, activity and kinetics experiments have been carried out.
This chapter provides a detailed discussion of the experimental methods followed and results found, regarding
both the activity- and kinetics studies for quinoline-based β-haematin inhibitors.
Stellenbosch University https://scholar.sun.ac.za
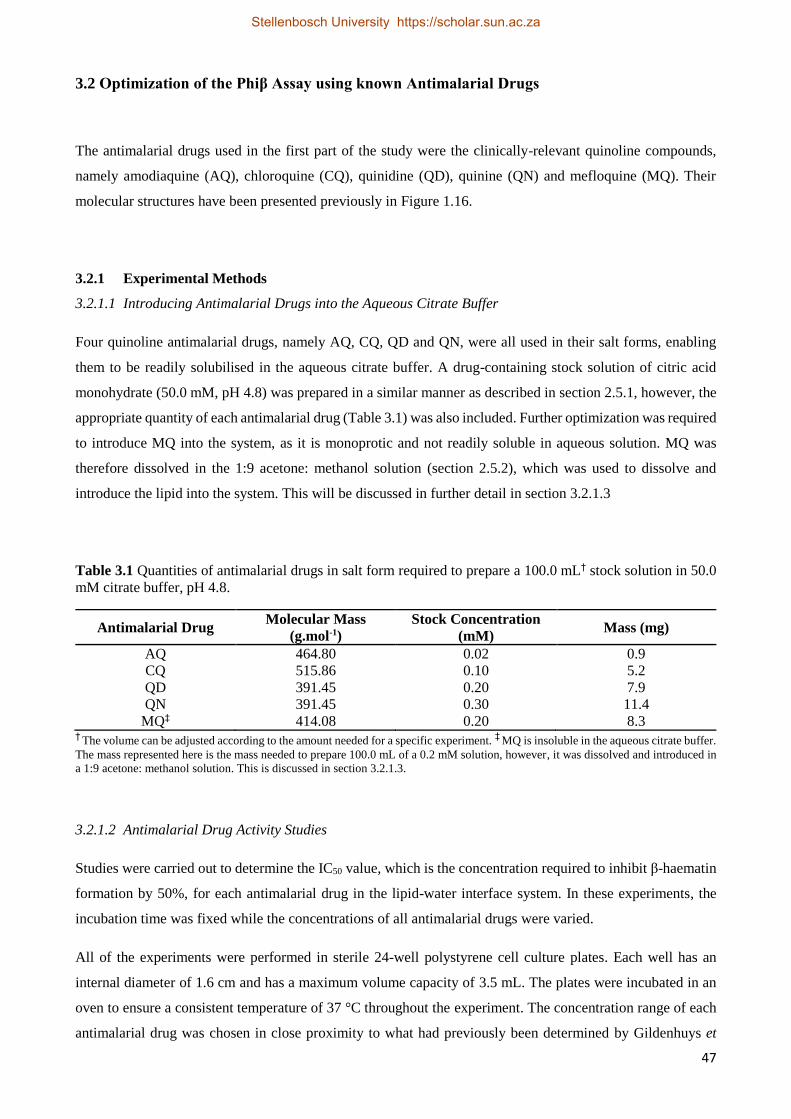
47
3.2 Optimization of the Phiβ Assay using known Antimalarial Drugs
The antimalarial drugs used in the first part of the study were the clinically-relevant quinoline compounds,
namely amodiaquine (AQ), chloroquine (CQ), quinidine (QD), quinine (QN) and mefloquine (MQ). Their
molecular structures have been presented previously in Figure 1.16.
3.2.1 Experimental Methods
3.2.1.1 Introducing Antimalarial Drugs into the Aqueous Citrate Buffer
Four quinoline antimalarial drugs, namely AQ, CQ, QD and QN, were all used in their salt forms, enabling
them to be readily solubilised in the aqueous citrate buffer. A drug-containing stock solution of citric acid
monohydrate (50.0 mM, pH 4.8) was prepared in a similar manner as described in section 2.5.1, however, the
appropriate quantity of each antimalarial drug (Table 3.1) was also included. Further optimization was required
to introduce MQ into the system, as it is monoprotic and not readily soluble in aqueous solution. MQ was
therefore dissolved in the 1:9 acetone: methanol solution (section 2.5.2), which was used to dissolve and
introduce the lipid into the system. This will be discussed in further detail in section 3.2.1.3
Table 3.1 Quantities of antimalarial drugs in salt form required to prepare a 100.0 mL† stock solution in 50.0
mM citrate buffer, pH 4.8.
Antimalarial Drug Molecular Mass
(g.mol-1)
Stock Concentration
(mM) Mass (mg)
AQ 464.80 0.02 0.9
CQ 515.86 0.10 5.2
QD 391.45 0.20 7.9
QN 391.45 0.30 11.4
MQ‡ 414.08 0.20 8.3 † The volume can be adjusted according to the amount needed for a specific experiment. ‡ MQ is insoluble in the aqueous citrate buffer.
The mass represented here is the mass needed to prepare 100.0 mL of a 0.2 mM solution, however, it was dissolved and introduced in
a 1:9 acetone: methanol solution. This is discussed in section 3.2.1.3.
3.2.1.2 Antimalarial Drug Activity Studies
Studies were carried out to determine the IC50 value, which is the concentration required to inhibit β-haematin
formation by 50%, for each antimalarial drug in the lipid-water interface system. In these experiments, the
incubation time was fixed while the concentrations of all antimalarial drugs were varied.
All of the experiments were performed in sterile 24-well polystyrene cell culture plates. Each well has an
internal diameter of 1.6 cm and has a maximum volume capacity of 3.5 mL. The plates were incubated in an
oven to ensure a consistent temperature of 37 °C throughout the experiment. The concentration range of each
antimalarial drug was chosen in close proximity to what had previously been determined by Gildenhuys et
Stellenbosch University https://scholar.sun.ac.za
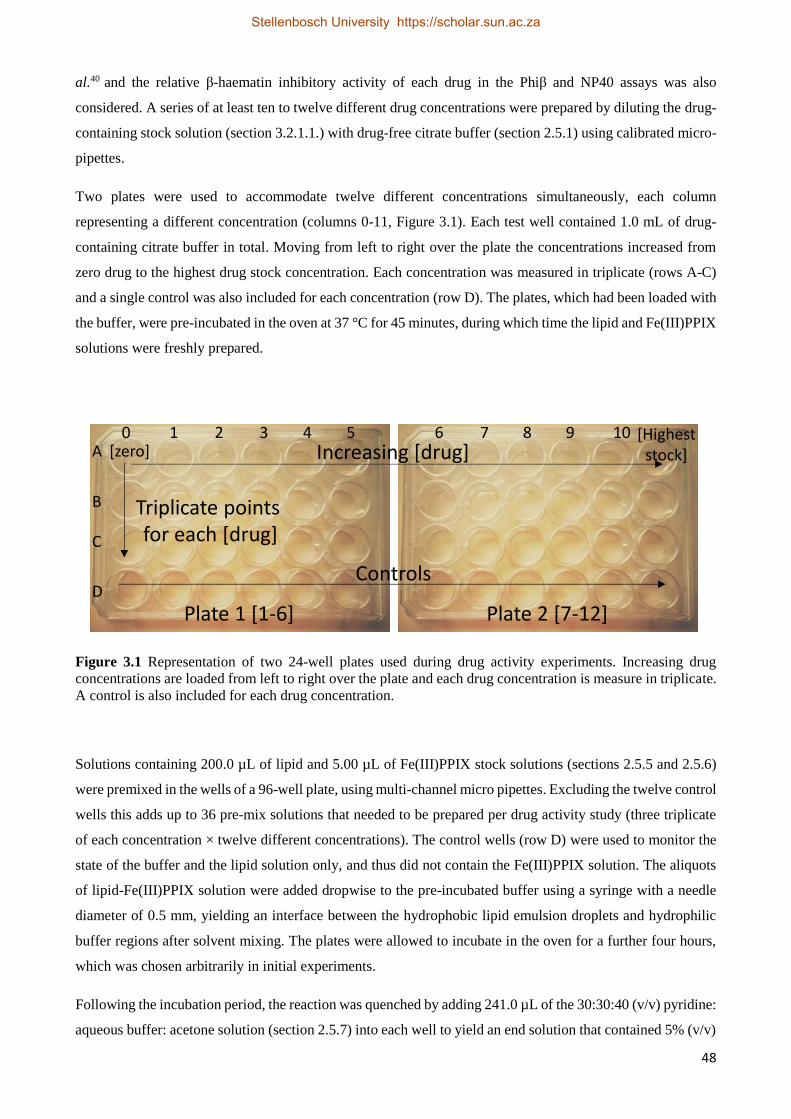
48
al.40 and the relative β-haematin inhibitory activity of each drug in the Phiβ and NP40 assays was also
considered. A series of at least ten to twelve different drug concentrations were prepared by diluting the drug-
containing stock solution (section 3.2.1.1.) with drug-free citrate buffer (section 2.5.1) using calibrated micro-
pipettes.
Two plates were used to accommodate twelve different concentrations simultaneously, each column
representing a different concentration (columns 0-11, Figure 3.1). Each test well contained 1.0 mL of drug-
containing citrate buffer in total. Moving from left to right over the plate the concentrations increased from
zero drug to the highest drug stock concentration. Each concentration was measured in triplicate (rows A-C)
and a single control was also included for each concentration (row D). The plates, which had been loaded with
the buffer, were pre-incubated in the oven at 37 °C for 45 minutes, during which time the lipid and Fe(III)PPIX
solutions were freshly prepared.
Figure 3.1 Representation of two 24-well plates used during drug activity experiments. Increasing drug
concentrations are loaded from left to right over the plate and each drug concentration is measure in triplicate.
A control is also included for each drug concentration.
Solutions containing 200.0 µL of lipid and 5.00 µL of Fe(III)PPIX stock solutions (sections 2.5.5 and 2.5.6)
were premixed in the wells of a 96-well plate, using multi-channel micro pipettes. Excluding the twelve control
wells this adds up to 36 pre-mix solutions that needed to be prepared per drug activity study (three triplicate
of each concentration × twelve different concentrations). The control wells (row D) were used to monitor the
state of the buffer and the lipid solution only, and thus did not contain the Fe(III)PPIX solution. The aliquots
of lipid-Fe(III)PPIX solution were added dropwise to the pre-incubated buffer using a syringe with a needle
diameter of 0.5 mm, yielding an interface between the hydrophobic lipid emulsion droplets and hydrophilic
buffer regions after solvent mixing. The plates were allowed to incubate in the oven for a further four hours,
which was chosen arbitrarily in initial experiments.
Following the incubation period, the reaction was quenched by adding 241.0 µL of the 30:30:40 (v/v) pyridine:
aqueous buffer: acetone solution (section 2.5.7) into each well to yield an end solution that contained 5% (v/v)
Plate 1 [1-6] Plate 2 [7-12]
Controls
Increasing [drug]
Triplicate points for each [drug]
[zero] [Highest
stock]A
B
C
D
0 2 3 41 8765 109
Stellenbosch University https://scholar.sun.ac.za
49
pyridine overall. After manually agitating the plate for one minute to ensure that the pyridine had interacted
fully with any unreacted Fe(III)PPIX, the plate was left to stand for 15 minutes to allow visible lipid precipitate
to settle. A 200.0 µL aliquot of the supernatant in each well was then transferred to an empty well in a clean
96-well plate and the absorbance value for each well was measured at 405 nm. This absorbance value was
compared to that of the zero-drug control, and was used as a measure of the amount of unreacted Fe(III)PPIX
remaining at each drug concentration, from which the IC50 value could be determined.
Measurements were conducted in triplicate for each antimalarial drug to improve the reliability of the results.
The observed absorbance values were plotted as a function of increasing drug concentration and fitted to a
sigmoidal or hyperbolic function, using nonlinear least squares fitting in GraphPad Prism. The IC50 value for
each antimalarial drug was then determined from the dose-response curves by as described in Figure 3.2.
A50=(Af-Ai)0.5
A50
IC50
Af
Ai
Increasing Inhibitor Concentration
A405
Figure 3.2 A schematic indication of how the absorbance values at A405 were used to calculate the IC50 values
for each drug. Inhibition of β-haematin formation by 50% was determined by subtracting the absorbance of
Fe(III)PPIX measured in the absence of drug (Ai) from that obtained at high drug concentration (Af) and
multiplying the product by 0.5. The drug concentration corresponding to this absorbance value (A50) is the
concentration of drug required to inhibit 50% of β-haematin formation and is termed the IC50 value.
3.2.1.3 Non-Aqueous Soluble Antimalarial Drugs
As mentioned above, MQ is insoluble in the aqueous citrate buffer solution, and hence has been treated
differently compared to the other antimalarial drugs. MQ was therefore dissolved in a 1:9 acetone: methanol
solution and incorporated into the aqueous citrate buffer in each well within a 100.0 µL aliquot before the pre-
incubation period. The quantity of MQ dissolved in the acetone: methanol stock solution was equal to the
amount that would be expected in an aqueous citrate buffer stock solution if the drug was soluble. The
concentrations were thus calculated relative to the total volume of the system in each well. The lipid-
Fe(III)PPIX premix solution was prepared in the remaining 100.0 µL of 1:9 acetone: methanol solution, which
was therefore double the concentration used previously to ensure the same lipid- and Fe(III)PPIX final
Stellenbosch University https://scholar.sun.ac.za
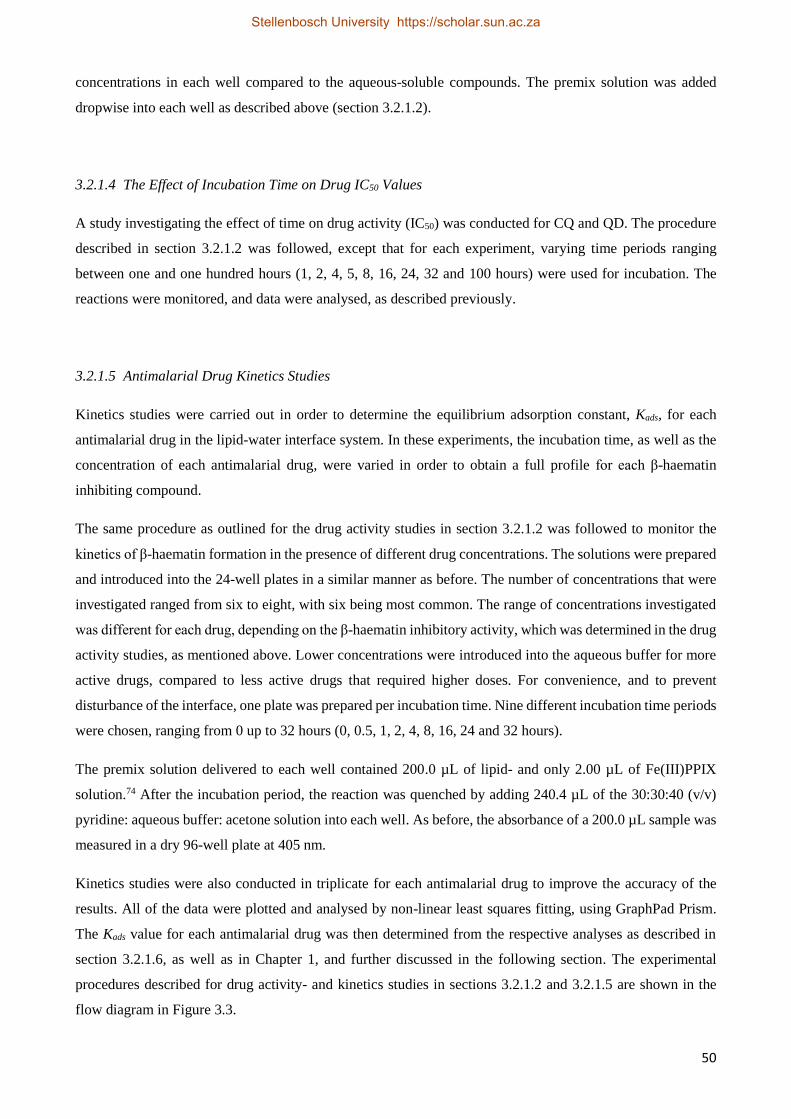
50
concentrations in each well compared to the aqueous-soluble compounds. The premix solution was added
dropwise into each well as described above (section 3.2.1.2).
3.2.1.4 The Effect of Incubation Time on Drug IC50 Values
A study investigating the effect of time on drug activity (IC50) was conducted for CQ and QD. The procedure
described in section 3.2.1.2 was followed, except that for each experiment, varying time periods ranging
between one and one hundred hours (1, 2, 4, 5, 8, 16, 24, 32 and 100 hours) were used for incubation. The
reactions were monitored, and data were analysed, as described previously.
3.2.1.5 Antimalarial Drug Kinetics Studies
Kinetics studies were carried out in order to determine the equilibrium adsorption constant, Kads, for each
antimalarial drug in the lipid-water interface system. In these experiments, the incubation time, as well as the
concentration of each antimalarial drug, were varied in order to obtain a full profile for each β-haematin
inhibiting compound.
The same procedure as outlined for the drug activity studies in section 3.2.1.2 was followed to monitor the
kinetics of β-haematin formation in the presence of different drug concentrations. The solutions were prepared
and introduced into the 24-well plates in a similar manner as before. The number of concentrations that were
investigated ranged from six to eight, with six being most common. The range of concentrations investigated
was different for each drug, depending on the β-haematin inhibitory activity, which was determined in the drug
activity studies, as mentioned above. Lower concentrations were introduced into the aqueous buffer for more
active drugs, compared to less active drugs that required higher doses. For convenience, and to prevent
disturbance of the interface, one plate was prepared per incubation time. Nine different incubation time periods
were chosen, ranging from 0 up to 32 hours (0, 0.5, 1, 2, 4, 8, 16, 24 and 32 hours).
The premix solution delivered to each well contained 200.0 µL of lipid- and only 2.00 µL of Fe(III)PPIX
solution.74 After the incubation period, the reaction was quenched by adding 240.4 µL of the 30:30:40 (v/v)
pyridine: aqueous buffer: acetone solution into each well. As before, the absorbance of a 200.0 µL sample was
measured in a dry 96-well plate at 405 nm.
Kinetics studies were also conducted in triplicate for each antimalarial drug to improve the accuracy of the
results. All of the data were plotted and analysed by non-linear least squares fitting, using GraphPad Prism.
The Kads value for each antimalarial drug was then determined from the respective analyses as described in
section 3.2.1.6, as well as in Chapter 1, and further discussed in the following section. The experimental
procedures described for drug activity- and kinetics studies in sections 3.2.1.2 and 3.2.1.5 are shown in the
flow diagram in Figure 3.3.
Stellenbosch University https://scholar.sun.ac.za
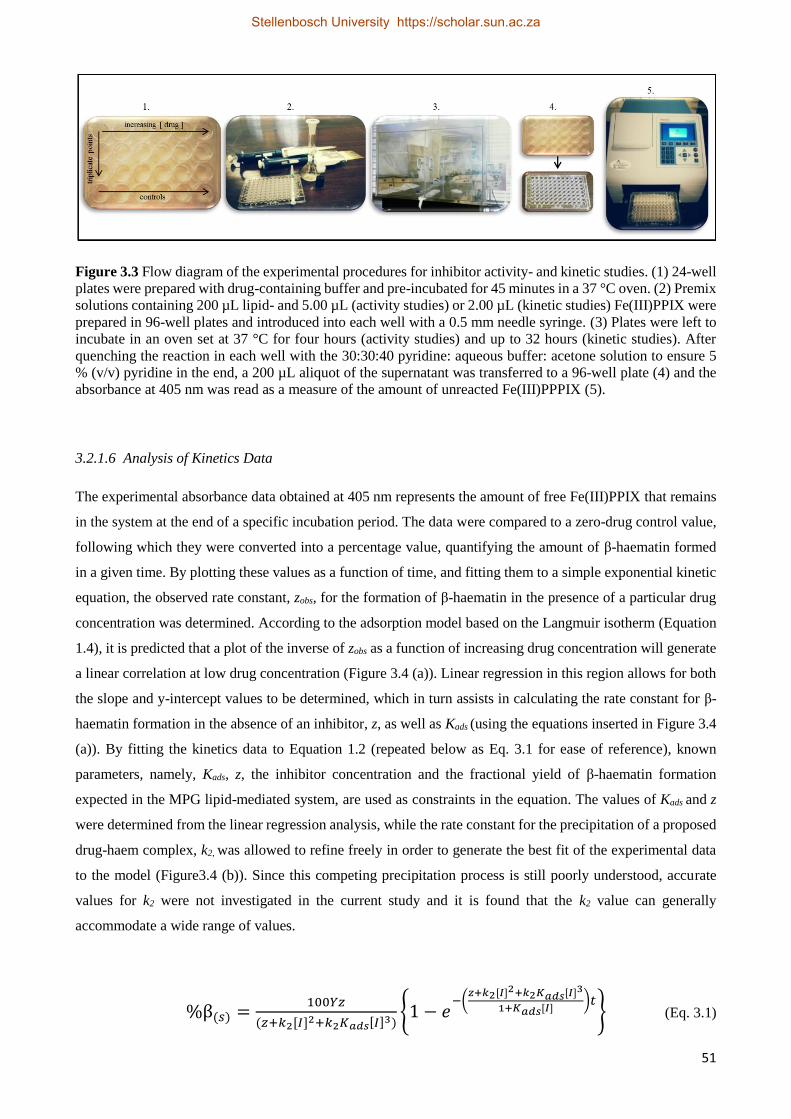
51
Figure 3.3 Flow diagram of the experimental procedures for inhibitor activity- and kinetic studies. (1) 24-well
plates were prepared with drug-containing buffer and pre-incubated for 45 minutes in a 37 °C oven. (2) Premix
solutions containing 200 µL lipid- and 5.00 µL (activity studies) or 2.00 µL (kinetic studies) Fe(III)PPIX were
prepared in 96-well plates and introduced into each well with a 0.5 mm needle syringe. (3) Plates were left to
incubate in an oven set at 37 °C for four hours (activity studies) and up to 32 hours (kinetic studies). After
quenching the reaction in each well with the 30:30:40 pyridine: aqueous buffer: acetone solution to ensure 5
% (v/v) pyridine in the end, a 200 µL aliquot of the supernatant was transferred to a 96-well plate (4) and the
absorbance at 405 nm was read as a measure of the amount of unreacted Fe(III)PPPIX (5).
3.2.1.6 Analysis of Kinetics Data
The experimental absorbance data obtained at 405 nm represents the amount of free Fe(III)PPIX that remains
in the system at the end of a specific incubation period. The data were compared to a zero-drug control value,
following which they were converted into a percentage value, quantifying the amount of β-haematin formed
in a given time. By plotting these values as a function of time, and fitting them to a simple exponential kinetic
equation, the observed rate constant, zobs, for the formation of β-haematin in the presence of a particular drug
concentration was determined. According to the adsorption model based on the Langmuir isotherm (Equation
1.4), it is predicted that a plot of the inverse of zobs as a function of increasing drug concentration will generate
a linear correlation at low drug concentration (Figure 3.4 (a)). Linear regression in this region allows for both
the slope and y-intercept values to be determined, which in turn assists in calculating the rate constant for β-
haematin formation in the absence of an inhibitor, z, as well as Kads (using the equations inserted in Figure 3.4
(a)). By fitting the kinetics data to Equation 1.2 (repeated below as Eq. 3.1 for ease of reference), known
parameters, namely, Kads, z, the inhibitor concentration and the fractional yield of β-haematin formation
expected in the MPG lipid-mediated system, are used as constraints in the equation. The values of Kads and z
were determined from the linear regression analysis, while the rate constant for the precipitation of a proposed
drug-haem complex, k2, was allowed to refine freely in order to generate the best fit of the experimental data
to the model (Figure3.4 (b)). Since this competing precipitation process is still poorly understood, accurate
values for k2 were not investigated in the current study and it is found that the k2 value can generally
accommodate a wide range of values.
%β(𝑠) =100𝑌𝑧
(𝑧+𝑘2[𝐼]2+𝑘2𝐾𝑎𝑑𝑠[𝐼]3){1 − 𝑒
−(𝑧+𝑘2[𝐼]2+𝑘2𝐾𝑎𝑑𝑠[𝐼]3
1+𝐾𝑎𝑑𝑠[𝐼])𝑡
} (Eq. 3.1)
Stellenbosch University https://scholar.sun.ac.za
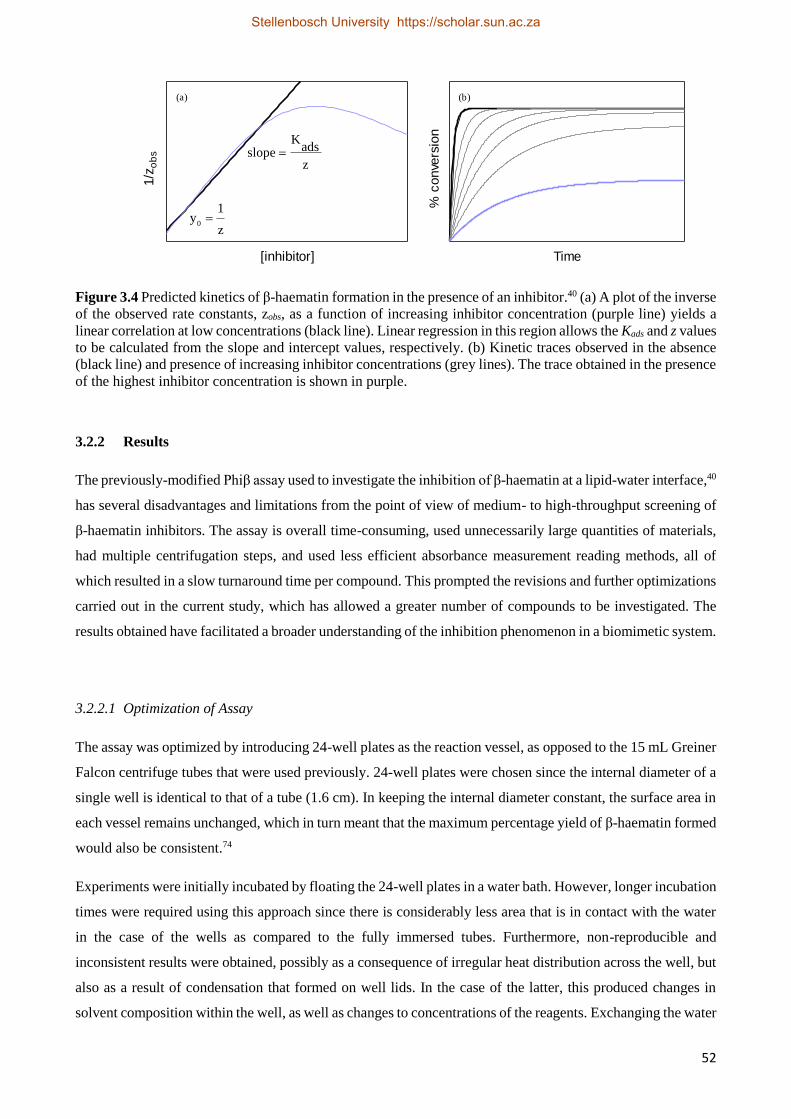
52
z
1y
0
z
adsK
slope
(a)
[inhibitor]
1/z
ob
s
(b)
Time
% c
onve
rsio
n
Figure 3.4 Predicted kinetics of β-haematin formation in the presence of an inhibitor.40 (a) A plot of the inverse
of the observed rate constants, zobs, as a function of increasing inhibitor concentration (purple line) yields a
linear correlation at low concentrations (black line). Linear regression in this region allows the Kads and z values
to be calculated from the slope and intercept values, respectively. (b) Kinetic traces observed in the absence
(black line) and presence of increasing inhibitor concentrations (grey lines). The trace obtained in the presence
of the highest inhibitor concentration is shown in purple.
3.2.2 Results
The previously-modified Phiβ assay used to investigate the inhibition of β-haematin at a lipid-water interface,40
has several disadvantages and limitations from the point of view of medium- to high-throughput screening of
β-haematin inhibitors. The assay is overall time-consuming, used unnecessarily large quantities of materials,
had multiple centrifugation steps, and used less efficient absorbance measurement reading methods, all of
which resulted in a slow turnaround time per compound. This prompted the revisions and further optimizations
carried out in the current study, which has allowed a greater number of compounds to be investigated. The
results obtained have facilitated a broader understanding of the inhibition phenomenon in a biomimetic system.
3.2.2.1 Optimization of Assay
The assay was optimized by introducing 24-well plates as the reaction vessel, as opposed to the 15 mL Greiner
Falcon centrifuge tubes that were used previously. 24-well plates were chosen since the internal diameter of a
single well is identical to that of a tube (1.6 cm). In keeping the internal diameter constant, the surface area in
each vessel remains unchanged, which in turn meant that the maximum percentage yield of β-haematin formed
would also be consistent.74
Experiments were initially incubated by floating the 24-well plates in a water bath. However, longer incubation
times were required using this approach since there is considerably less area that is in contact with the water
in the case of the wells as compared to the fully immersed tubes. Furthermore, non-reproducible and
inconsistent results were obtained, possibly as a consequence of irregular heat distribution across the well, but
also as a result of condensation that formed on well lids. In the case of the latter, this produced changes in
solvent composition within the well, as well as changes to concentrations of the reagents. Exchanging the water
Stellenbosch University https://scholar.sun.ac.za
53
bath for a fan-assisted oven produced more consistent results as better temperature control was achieved and
condensation was eliminated. An added benefit of using the oven over a water bath was the greater number of
plates that could be incubated in the former, facilitating more efficient means with which to conduct the study.
The oven is advantageous over the water bath in that it provides greater consistency and better results overall.
An equal volume of the lipid-Fe(III)PPIX premix solutions was introduced into the system as before, while
the volume of aqueous citrate buffer was decreased due to the smaller well capacity. Since the surface area of
each well was the same as previous experiments carried out in tubes, as mentioned above, the difference in the
buffer bulk was not expected to interfere in the formation of β-haematin.
UV-visible measurements by means of a single cuvette (2.0 mL) were also improved upon by introducing 96-
well plates for simultaneous measurement of multiple samples.
Under these revised conditions, the yield of β-haematin in the absence of an inhibitor was found to be the same
as in the original approach. Interestingly, however, a ten-fold decrease in the rate of β-haematin formation was
observed, with the rate decreasing from 0.171 ± 0.04 min-1 to 0.019 ± 0.002 min-1 (Figure 3.5).
0 50 100 150 200 2500
20
40
60
80
Time (min)
%
-Haem
atin F
orm
ed
Figure 3.5 Rate of β-haematin formation in the absence of an inhibitor. The previous rate observed using 15
mL Greiner Falcon tubes (●) is ten-fold faster compared to the rate determined in 24-well plates (●). A decrease
in the rate of β-haematin formation is observed (arrow). The observed rate constants determined from these
curves are 0.171 ± 0.04 min-1 and 0.019 ± 0.002 min-1, respectively.
In an attempt to understand the observed ten-fold decrease in the rate constant of β-haematin formation in the
absence of an inhibitor, an independent study was performed to investigate the influence of the solvent
concentrations in the 24-well system. Since all other quantities were the same, the difference in rate was
presumed to arise from the larger proportion of acetone: methanol used relative to the buffer volume in the 24-
well method as opposed to in the tubes. To probe this, β-haematin formation was performed in 15 mL Falcon
tubes, as demonstrated in the previous study,40 however, with an increased proportion of the acetone: methanol
Stellenbosch University https://scholar.sun.ac.za
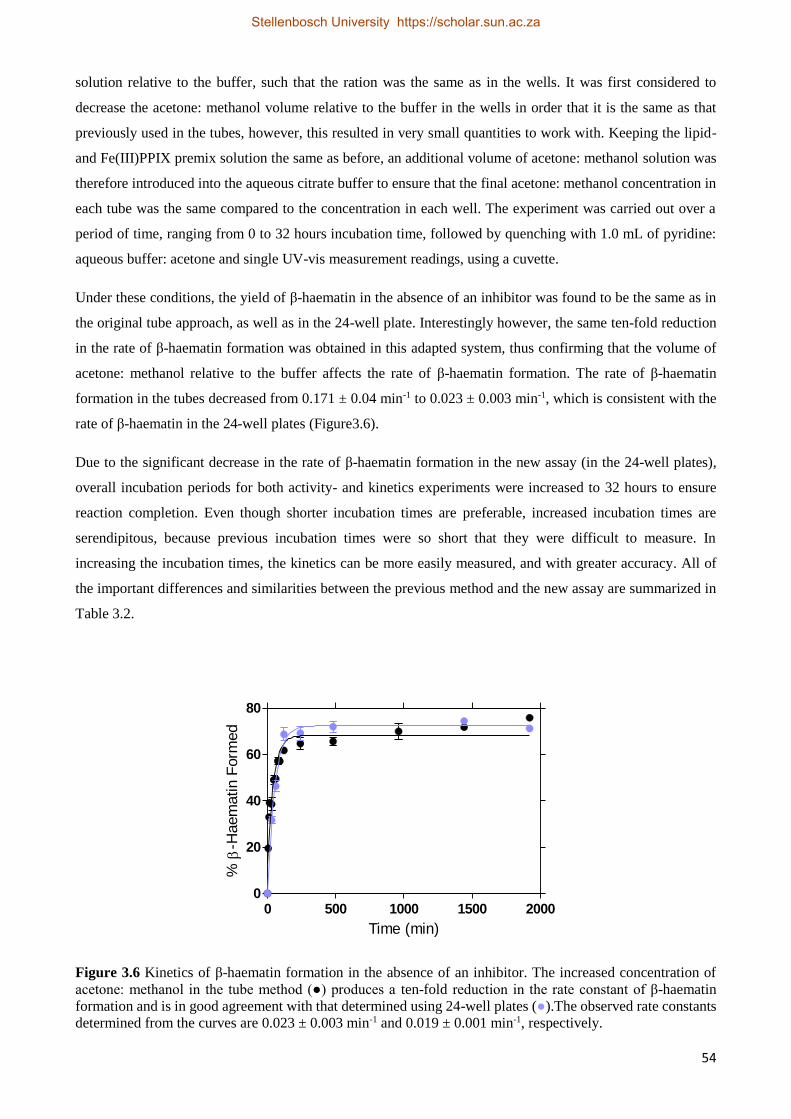
54
solution relative to the buffer, such that the ration was the same as in the wells. It was first considered to
decrease the acetone: methanol volume relative to the buffer in the wells in order that it is the same as that
previously used in the tubes, however, this resulted in very small quantities to work with. Keeping the lipid-
and Fe(III)PPIX premix solution the same as before, an additional volume of acetone: methanol solution was
therefore introduced into the aqueous citrate buffer to ensure that the final acetone: methanol concentration in
each tube was the same compared to the concentration in each well. The experiment was carried out over a
period of time, ranging from 0 to 32 hours incubation time, followed by quenching with 1.0 mL of pyridine:
aqueous buffer: acetone and single UV-vis measurement readings, using a cuvette.
Under these conditions, the yield of β-haematin in the absence of an inhibitor was found to be the same as in
the original tube approach, as well as in the 24-well plate. Interestingly however, the same ten-fold reduction
in the rate of β-haematin formation was obtained in this adapted system, thus confirming that the volume of
acetone: methanol relative to the buffer affects the rate of β-haematin formation. The rate of β-haematin
formation in the tubes decreased from 0.171 ± 0.04 min-1 to 0.023 ± 0.003 min-1, which is consistent with the
rate of β-haematin in the 24-well plates (Figure3.6).
Due to the significant decrease in the rate of β-haematin formation in the new assay (in the 24-well plates),
overall incubation periods for both activity- and kinetics experiments were increased to 32 hours to ensure
reaction completion. Even though shorter incubation times are preferable, increased incubation times are
serendipitous, because previous incubation times were so short that they were difficult to measure. In
increasing the incubation times, the kinetics can be more easily measured, and with greater accuracy. All of
the important differences and similarities between the previous method and the new assay are summarized in
Table 3.2.
0 500 1000 1500 20000
20
40
60
80
Time (min)
%
-Haem
atin F
orm
ed
Figure 3.6 Kinetics of β-haematin formation in the absence of an inhibitor. The increased concentration of
acetone: methanol in the tube method (●) produces a ten-fold reduction in the rate constant of β-haematin
formation and is in good agreement with that determined using 24-well plates (●).The observed rate constants
determined from the curves are 0.023 ± 0.003 min-1 and 0.019 ± 0.001 min-1, respectively.
Stellenbosch University https://scholar.sun.ac.za
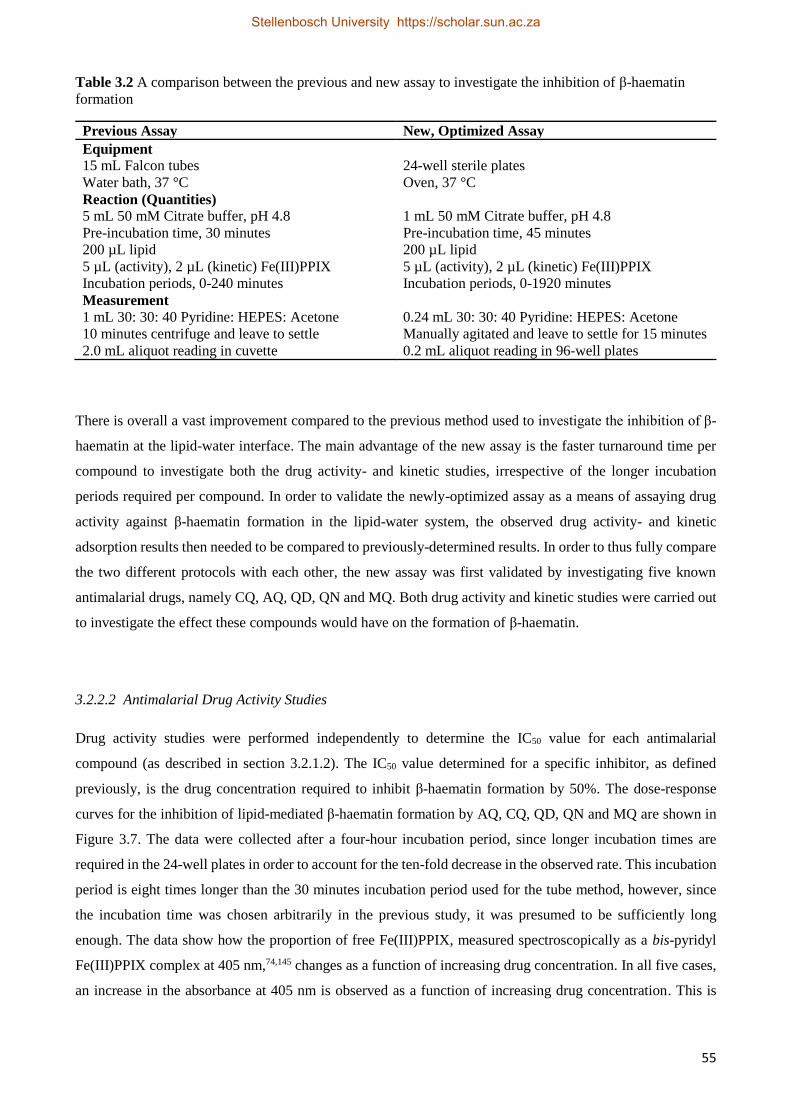
55
Table 3.2 A comparison between the previous and new assay to investigate the inhibition of β-haematin
formation
Previous Assay New, Optimized Assay
Equipment
15 mL Falcon tubes 24-well sterile plates
Water bath, 37 °C Oven, 37 °C
Reaction (Quantities)
5 mL 50 mM Citrate buffer, pH 4.8 1 mL 50 mM Citrate buffer, pH 4.8
Pre-incubation time, 30 minutes Pre-incubation time, 45 minutes
200 µL lipid 200 µL lipid
5 µL (activity), 2 µL (kinetic) Fe(III)PPIX 5 µL (activity), 2 µL (kinetic) Fe(III)PPIX
Incubation periods, 0-240 minutes Incubation periods, 0-1920 minutes
Measurement
1 mL 30: 30: 40 Pyridine: HEPES: Acetone 0.24 mL 30: 30: 40 Pyridine: HEPES: Acetone
10 minutes centrifuge and leave to settle Manually agitated and leave to settle for 15 minutes
2.0 mL aliquot reading in cuvette 0.2 mL aliquot reading in 96-well plates
There is overall a vast improvement compared to the previous method used to investigate the inhibition of β-
haematin at the lipid-water interface. The main advantage of the new assay is the faster turnaround time per
compound to investigate both the drug activity- and kinetic studies, irrespective of the longer incubation
periods required per compound. In order to validate the newly-optimized assay as a means of assaying drug
activity against β-haematin formation in the lipid-water system, the observed drug activity- and kinetic
adsorption results then needed to be compared to previously-determined results. In order to thus fully compare
the two different protocols with each other, the new assay was first validated by investigating five known
antimalarial drugs, namely CQ, AQ, QD, QN and MQ. Both drug activity and kinetic studies were carried out
to investigate the effect these compounds would have on the formation of β-haematin.
3.2.2.2 Antimalarial Drug Activity Studies
Drug activity studies were performed independently to determine the IC50 value for each antimalarial
compound (as described in section 3.2.1.2). The IC50 value determined for a specific inhibitor, as defined
previously, is the drug concentration required to inhibit β-haematin formation by 50%. The dose-response
curves for the inhibition of lipid-mediated β-haematin formation by AQ, CQ, QD, QN and MQ are shown in
Figure 3.7. The data were collected after a four-hour incubation period, since longer incubation times are
required in the 24-well plates in order to account for the ten-fold decrease in the observed rate. This incubation
period is eight times longer than the 30 minutes incubation period used for the tube method, however, since
the incubation time was chosen arbitrarily in the previous study, it was presumed to be sufficiently long
enough. The data show how the proportion of free Fe(III)PPIX, measured spectroscopically as a bis-pyridyl
Fe(III)PPIX complex at 405 nm,74,145 changes as a function of increasing drug concentration. In all five cases,
an increase in the absorbance at 405 nm is observed as a function of increasing drug concentration. This is
Stellenbosch University https://scholar.sun.ac.za
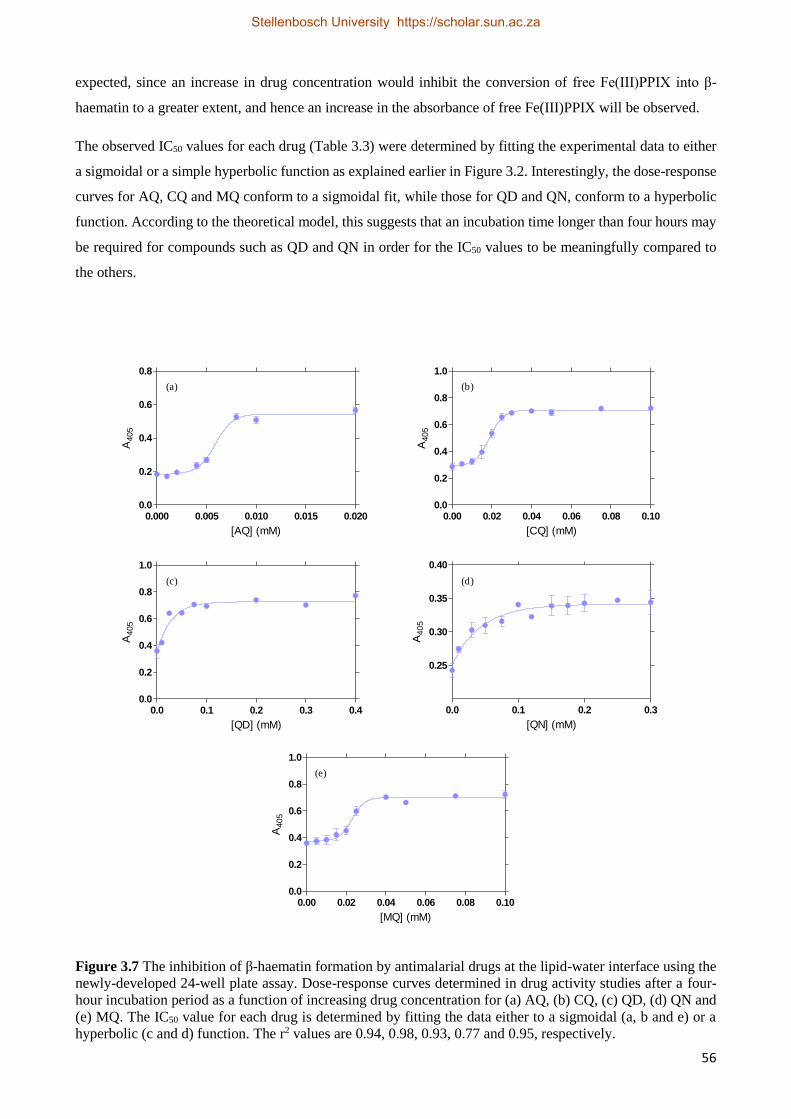
56
expected, since an increase in drug concentration would inhibit the conversion of free Fe(III)PPIX into β-
haematin to a greater extent, and hence an increase in the absorbance of free Fe(III)PPIX will be observed.
The observed IC50 values for each drug (Table 3.3) were determined by fitting the experimental data to either
a sigmoidal or a simple hyperbolic function as explained earlier in Figure 3.2. Interestingly, the dose-response
curves for AQ, CQ and MQ conform to a sigmoidal fit, while those for QD and QN, conform to a hyperbolic
function. According to the theoretical model, this suggests that an incubation time longer than four hours may
be required for compounds such as QD and QN in order for the IC50 values to be meaningfully compared to
the others.
0.000 0.005 0.010 0.015 0.0200.0
0.2
0.4
0.6
0.8
[AQ] (mM)
A405
0.00 0.02 0.04 0.06 0.08 0.100.0
0.2
0.4
0.6
0.8
1.0
[CQ] (mM)
A405
0.0 0.1 0.2 0.3 0.40.0
0.2
0.4
0.6
0.8
1.0
[QD] (mM)
A405
0.0 0.1 0.2 0.3
0.25
0.30
0.35
0.40
[QN] (mM)
A4
05
0.00 0.02 0.04 0.06 0.08 0.100.0
0.2
0.4
0.6
0.8
1.0
[MQ] (mM)
A405
(a)
(c)
(b)
(d)
(e)
Figure 3.7 The inhibition of β-haematin formation by antimalarial drugs at the lipid-water interface using the
newly-developed 24-well plate assay. Dose-response curves determined in drug activity studies after a four-
hour incubation period as a function of increasing drug concentration for (a) AQ, (b) CQ, (c) QD, (d) QN and
(e) MQ. The IC50 value for each drug is determined by fitting the data either to a sigmoidal (a, b and e) or a
hyperbolic (c and d) function. The r2 values are 0.94, 0.98, 0.93, 0.77 and 0.95, respectively.
Stellenbosch University https://scholar.sun.ac.za
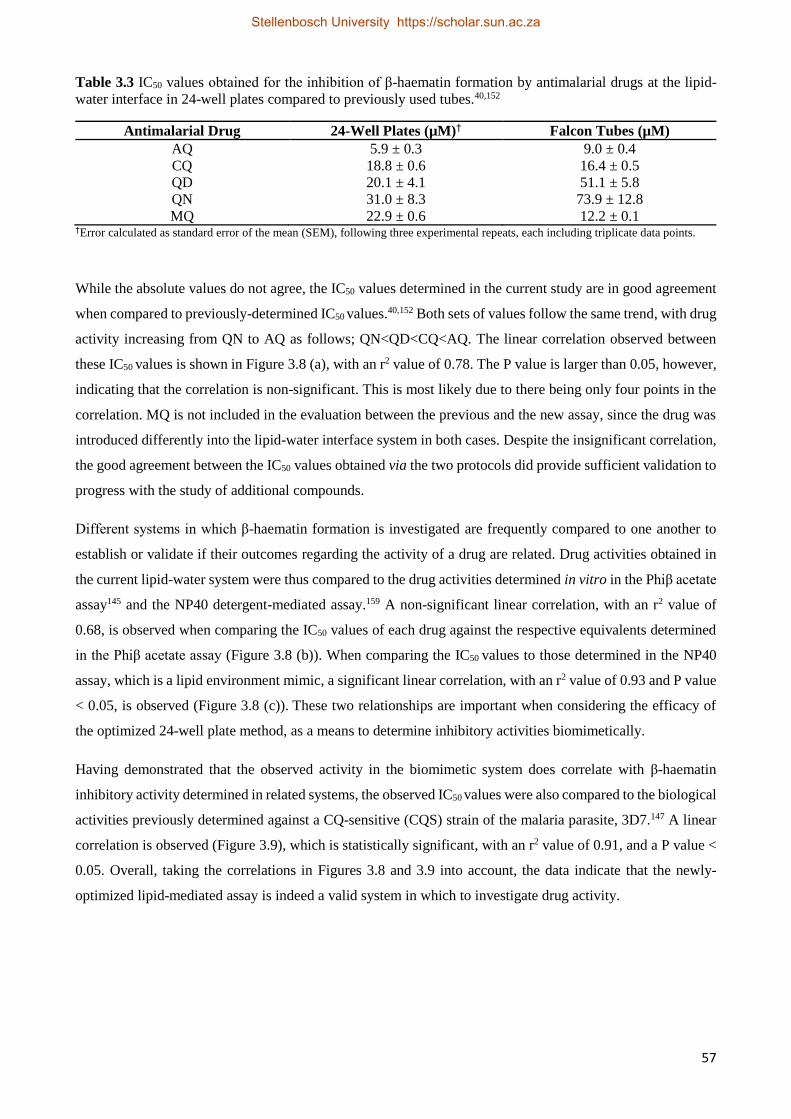
57
Table 3.3 IC50 values obtained for the inhibition of β-haematin formation by antimalarial drugs at the lipid-
water interface in 24-well plates compared to previously used tubes.40,152
Antimalarial Drug 24-Well Plates (µM)† Falcon Tubes (µM)
AQ 5.9 ± 0.3 9.0 ± 0.4
CQ 18.8 ± 0.6 16.4 ± 0.5
QD 20.1 ± 4.1 51.1 ± 5.8
QN 31.0 ± 8.3 73.9 ± 12.8
MQ 22.9 ± 0.6 12.2 ± 0.1 †Error calculated as standard error of the mean (SEM), following three experimental repeats, each including triplicate data points.
While the absolute values do not agree, the IC50 values determined in the current study are in good agreement
when compared to previously-determined IC50 values.40,152 Both sets of values follow the same trend, with drug
activity increasing from QN to AQ as follows; QN<QD<CQ<AQ. The linear correlation observed between
these IC50 values is shown in Figure 3.8 (a), with an r2 value of 0.78. The P value is larger than 0.05, however,
indicating that the correlation is non-significant. This is most likely due to there being only four points in the
correlation. MQ is not included in the evaluation between the previous and the new assay, since the drug was
introduced differently into the lipid-water interface system in both cases. Despite the insignificant correlation,
the good agreement between the IC50 values obtained via the two protocols did provide sufficient validation to
progress with the study of additional compounds.
Different systems in which β-haematin formation is investigated are frequently compared to one another to
establish or validate if their outcomes regarding the activity of a drug are related. Drug activities obtained in
the current lipid-water system were thus compared to the drug activities determined in vitro in the Phiβ acetate
assay145 and the NP40 detergent-mediated assay.159 A non-significant linear correlation, with an r2 value of
0.68, is observed when comparing the IC50 values of each drug against the respective equivalents determined
in the Phiβ acetate assay (Figure 3.8 (b)). When comparing the IC50 values to those determined in the NP40
assay, which is a lipid environment mimic, a significant linear correlation, with an r2 value of 0.93 and P value
< 0.05, is observed (Figure 3.8 (c)). These two relationships are important when considering the efficacy of
the optimized 24-well plate method, as a means to determine inhibitory activities biomimetically.
Having demonstrated that the observed activity in the biomimetic system does correlate with β-haematin
inhibitory activity determined in related systems, the observed IC50 values were also compared to the biological
activities previously determined against a CQ-sensitive (CQS) strain of the malaria parasite, 3D7.147 A linear
correlation is observed (Figure 3.9), which is statistically significant, with an r2 value of 0.91, and a P value <
0.05. Overall, taking the correlations in Figures 3.8 and 3.9 into account, the data indicate that the newly-
optimized lipid-mediated assay is indeed a valid system in which to investigate drug activity.
Stellenbosch University https://scholar.sun.ac.za
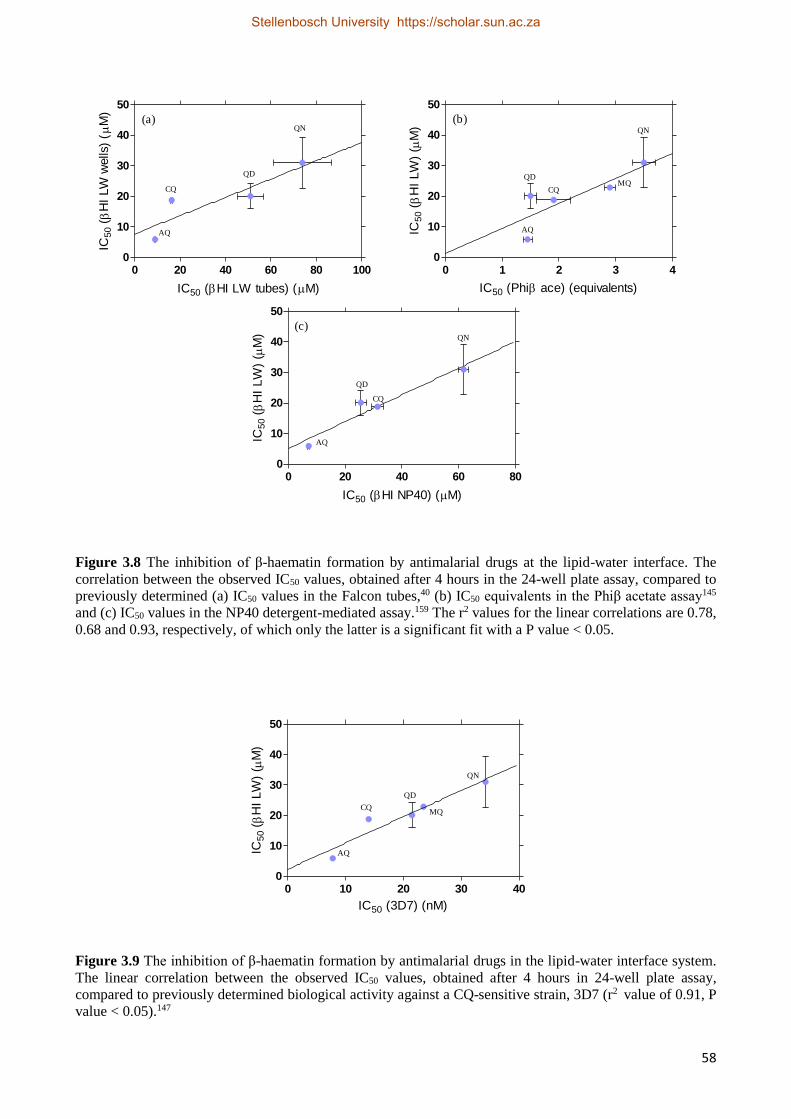
58
0 20 40 60 80 1000
10
20
30
40
50
AQ
CQ
QD
QN
IC50 (HI LW tubes) (M)
IC50
( H
I LW
wells
) (M
)
(a)
0 1 2 3 40
10
20
30
40
50
QD
QN
CQMQ
AQ
IC50 (Phi ace) (equivalents)
IC50
( H
I LW
)(
M)
(b)
0 20 40 60 800
10
20
30
40
50
QN
AQ
QD
CQ
IC50 (HI NP40) (M)
IC50
( H
I LW
)(
M)
(c)
Figure 3.8 The inhibition of β-haematin formation by antimalarial drugs at the lipid-water interface. The
correlation between the observed IC50 values, obtained after 4 hours in the 24-well plate assay, compared to
previously determined (a) IC50 values in the Falcon tubes,40 (b) IC50 equivalents in the Phiβ acetate assay145
and (c) IC50 values in the NP40 detergent-mediated assay.159 The r2 values for the linear correlations are 0.78,
0.68 and 0.93, respectively, of which only the latter is a significant fit with a P value < 0.05.
0 10 20 30 400
10
20
30
40
50
AQ
CQ
QD
MQ
QN
IC50 (3D7) (nM)
IC5
0(
HI
LW
)(
M)
Figure 3.9 The inhibition of β-haematin formation by antimalarial drugs in the lipid-water interface system.
The linear correlation between the observed IC50 values, obtained after 4 hours in 24-well plate assay,
compared to previously determined biological activity against a CQ-sensitive strain, 3D7 (r2 value of 0.91, P
value < 0.05).147
Stellenbosch University https://scholar.sun.ac.za
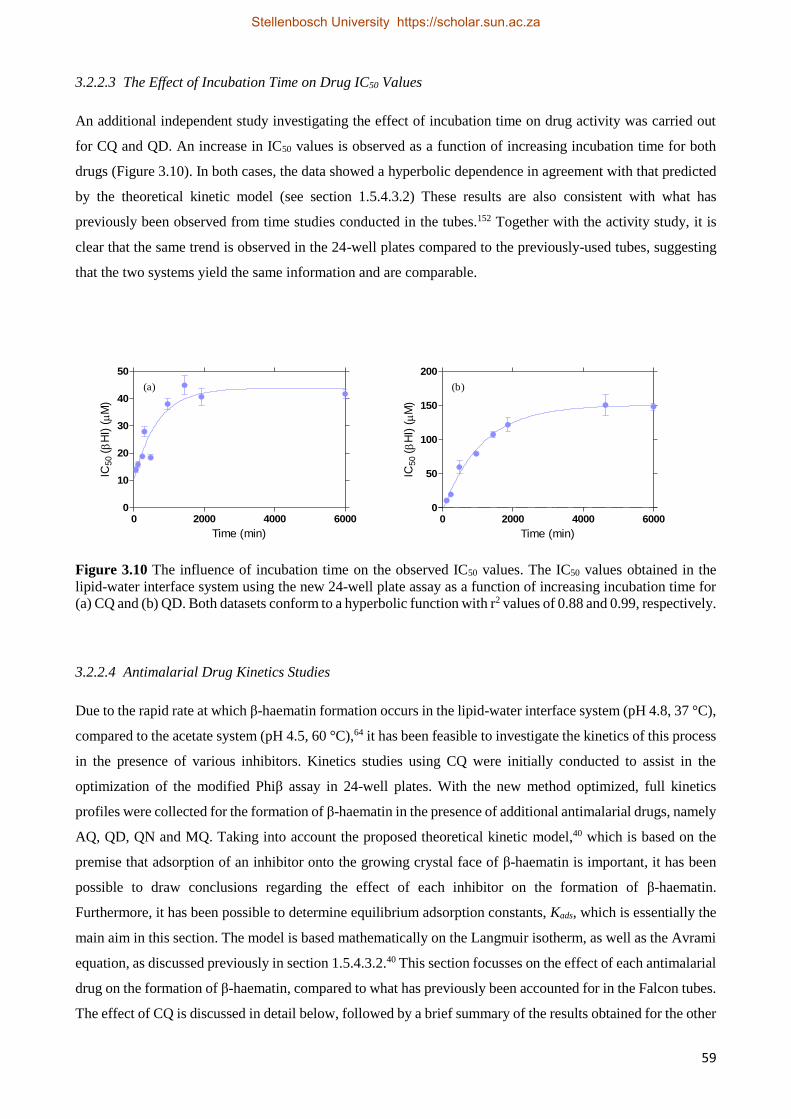
59
3.2.2.3 The Effect of Incubation Time on Drug IC50 Values
An additional independent study investigating the effect of incubation time on drug activity was carried out
for CQ and QD. An increase in IC50 values is observed as a function of increasing incubation time for both
drugs (Figure 3.10). In both cases, the data showed a hyperbolic dependence in agreement with that predicted
by the theoretical kinetic model (see section 1.5.4.3.2) These results are also consistent with what has
previously been observed from time studies conducted in the tubes.152 Together with the activity study, it is
clear that the same trend is observed in the 24-well plates compared to the previously-used tubes, suggesting
that the two systems yield the same information and are comparable.
0 2000 4000 60000
10
20
30
40
50
Time (min)
IC50
( H
I)(
M)
0 2000 4000 60000
50
100
150
200
Time (min)
IC50
( H
I)(
M)
(a) (b)
Figure 3.10 The influence of incubation time on the observed IC50 values. The IC50 values obtained in the
lipid-water interface system using the new 24-well plate assay as a function of increasing incubation time for
(a) CQ and (b) QD. Both datasets conform to a hyperbolic function with r2 values of 0.88 and 0.99, respectively.
3.2.2.4 Antimalarial Drug Kinetics Studies
Due to the rapid rate at which β-haematin formation occurs in the lipid-water interface system (pH 4.8, 37 °C),
compared to the acetate system (pH 4.5, 60 °C),64 it has been feasible to investigate the kinetics of this process
in the presence of various inhibitors. Kinetics studies using CQ were initially conducted to assist in the
optimization of the modified Phiβ assay in 24-well plates. With the new method optimized, full kinetics
profiles were collected for the formation of β-haematin in the presence of additional antimalarial drugs, namely
AQ, QD, QN and MQ. Taking into account the proposed theoretical kinetic model,40 which is based on the
premise that adsorption of an inhibitor onto the growing crystal face of β-haematin is important, it has been
possible to draw conclusions regarding the effect of each inhibitor on the formation of β-haematin.
Furthermore, it has been possible to determine equilibrium adsorption constants, Kads, which is essentially the
main aim in this section. The model is based mathematically on the Langmuir isotherm, as well as the Avrami
equation, as discussed previously in section 1.5.4.3.2.40 This section focusses on the effect of each antimalarial
drug on the formation of β-haematin, compared to what has previously been accounted for in the Falcon tubes.
The effect of CQ is discussed in detail below, followed by a brief summary of the results obtained for the other
Stellenbosch University https://scholar.sun.ac.za
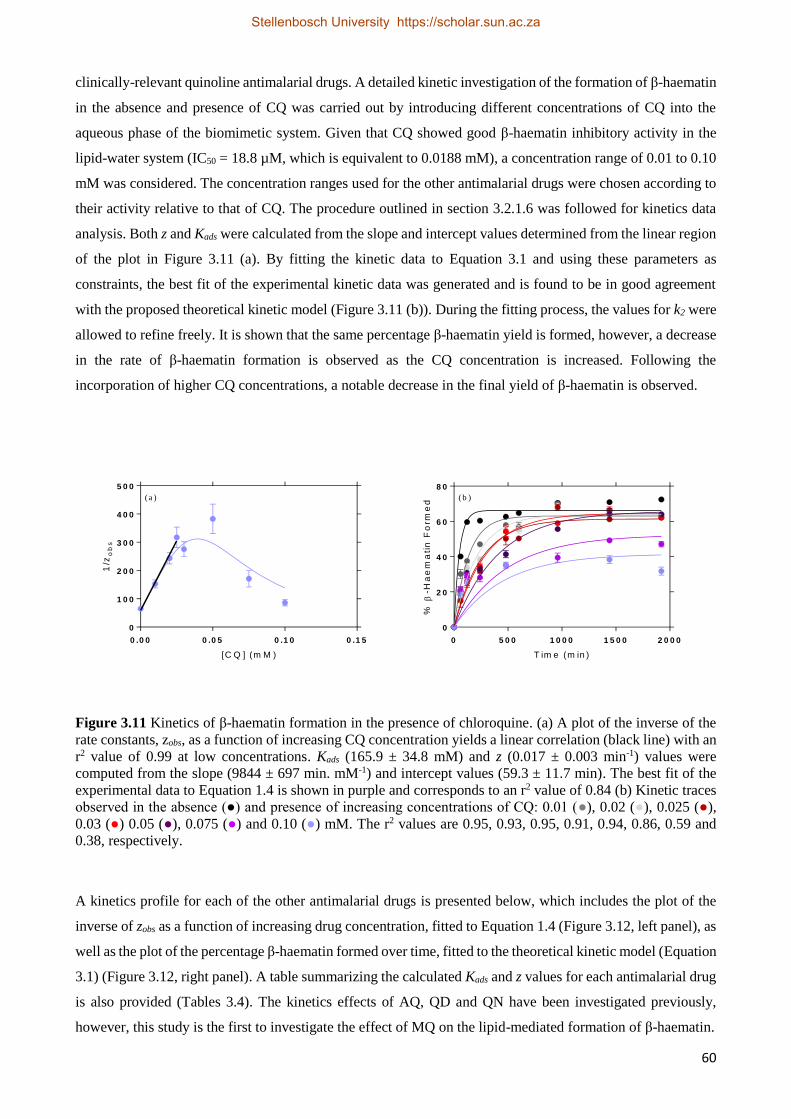
60
clinically-relevant quinoline antimalarial drugs. A detailed kinetic investigation of the formation of β-haematin
in the absence and presence of CQ was carried out by introducing different concentrations of CQ into the
aqueous phase of the biomimetic system. Given that CQ showed good β-haematin inhibitory activity in the
lipid-water system (IC50 = 18.8 µM, which is equivalent to 0.0188 mM), a concentration range of 0.01 to 0.10
mM was considered. The concentration ranges used for the other antimalarial drugs were chosen according to
their activity relative to that of CQ. The procedure outlined in section 3.2.1.6 was followed for kinetics data
analysis. Both z and Kads were calculated from the slope and intercept values determined from the linear region
of the plot in Figure 3.11 (a). By fitting the kinetic data to Equation 3.1 and using these parameters as
constraints, the best fit of the experimental kinetic data was generated and is found to be in good agreement
with the proposed theoretical kinetic model (Figure 3.11 (b)). During the fitting process, the values for k2 were
allowed to refine freely. It is shown that the same percentage β-haematin yield is formed, however, a decrease
in the rate of β-haematin formation is observed as the CQ concentration is increased. Following the
incorporation of higher CQ concentrations, a notable decrease in the final yield of β-haematin is observed.
0 .0 0 0 .0 5 0 .1 0 0 .1 5
0
1 0 0
2 0 0
3 0 0
4 0 0
5 0 0
[C Q ] (m M )
1/z
ob
s
0 5 0 0 1 0 0 0 1 5 0 0 2 0 0 0
0
2 0
4 0
6 0
8 0
T im e (m in )
%
-Ha
em
ati
n F
orm
ed
(a ) ( b )
Figure 3.11 Kinetics of β-haematin formation in the presence of chloroquine. (a) A plot of the inverse of the
rate constants, zobs, as a function of increasing CQ concentration yields a linear correlation (black line) with an
r2 value of 0.99 at low concentrations. Kads (165.9 ± 34.8 mM) and z (0.017 ± 0.003 min-1) values were
computed from the slope (9844 ± 697 min. mM-1) and intercept values (59.3 ± 11.7 min). The best fit of the
experimental data to Equation 1.4 is shown in purple and corresponds to an r2 value of 0.84 (b) Kinetic traces
observed in the absence (●) and presence of increasing concentrations of CQ: 0.01 (●), 0.02 (●), 0.025 (●),
0.03 (●) 0.05 (●), 0.075 (●) and 0.10 (●) mM. The r2 values are 0.95, 0.93, 0.95, 0.91, 0.94, 0.86, 0.59 and
0.38, respectively.
A kinetics profile for each of the other antimalarial drugs is presented below, which includes the plot of the
inverse of zobs as a function of increasing drug concentration, fitted to Equation 1.4 (Figure 3.12, left panel), as
well as the plot of the percentage β-haematin formed over time, fitted to the theoretical kinetic model (Equation
3.1) (Figure 3.12, right panel). A table summarizing the calculated Kads and z values for each antimalarial drug
is also provided (Tables 3.4). The kinetics effects of AQ, QD and QN have been investigated previously,
however, this study is the first to investigate the effect of MQ on the lipid-mediated formation of β-haematin.
Stellenbosch University https://scholar.sun.ac.za
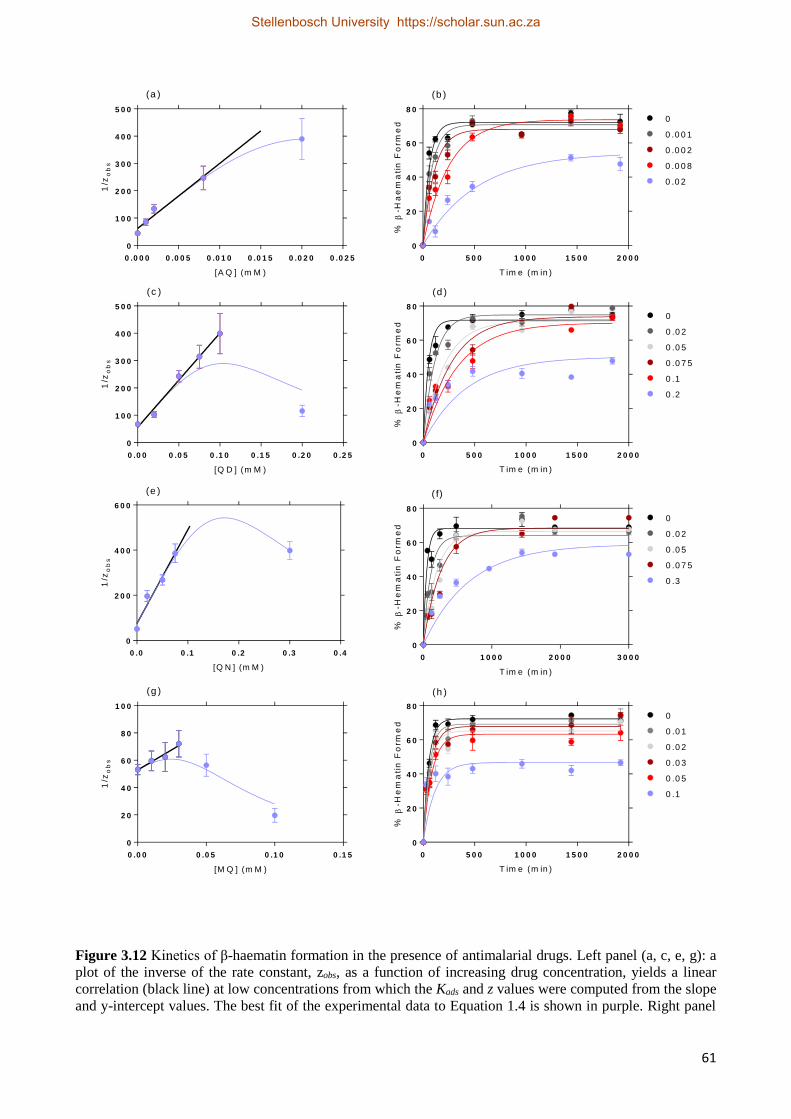
61
0 .0 0 0 0 .0 0 5 0 .0 1 0 0 .0 1 5 0 .0 2 0 0 .0 2 5
0
1 0 0
2 0 0
3 0 0
4 0 0
5 0 0
[A Q ] (m M )
1/z
ob
s
0 5 0 0 1 0 0 0 1 5 0 0 2 0 0 0
0
2 0
4 0
6 0
8 0
0 .0 2
0 .0 0 8
0 .0 0 2
0 .0 0 1
0
T im e (m in )
%
-Ha
em
ati
n F
orm
ed
0 .0 0 0 .0 5 0 .1 0 0 .1 5 0 .2 0 0 .2 5
0
1 0 0
2 0 0
3 0 0
4 0 0
5 0 0
[Q D ] (m M )
1/z
ob
s
0 5 0 0 1 0 0 0 1 5 0 0 2 0 0 0
0
2 0
4 0
6 0
8 0
0
0 .0 2
0 .0 5
0 .0 7 5
0 .1
0 .2
T im e (m in )
%
-He
ma
tin
Fo
rme
d
0 .0 0 .1 0 .2 0 .3 0 .4
0
2 0 0
4 0 0
6 0 0
[Q N ] (m M )
1/z
ob
s
0 1 0 0 0 2 0 0 0 3 0 0 0
0
2 0
4 0
6 0
8 0
0 .3
0 .0 7 5
0 .0 5
0 .0 2
0
T im e (m in )
%
-He
ma
tin
Fo
rme
d
0 .0 0 0 .0 5 0 .1 0 0 .1 5
0
2 0
4 0
6 0
8 0
1 0 0
[M Q ] (m M )
1/z
ob
s
0 5 0 0 1 0 0 0 1 5 0 0 2 0 0 0
0
2 0
4 0
6 0
8 0
0 .1
0 .0 5
0 .0 3
0
0 .0 1
0 .0 2
T im e (m in )
%
-He
ma
tin
Fo
rme
d
(a ) (b )
(c ) (d )
(e ) ( f)
(g ) (h )
Figure 3.12 Kinetics of β-haematin formation in the presence of antimalarial drugs. Left panel (a, c, e, g): a
plot of the inverse of the rate constant, zobs, as a function of increasing drug concentration, yields a linear
correlation (black line) at low concentrations from which the Kads and z values were computed from the slope
and y-intercept values. The best fit of the experimental data to Equation 1.4 is shown in purple. Right panel
Stellenbosch University https://scholar.sun.ac.za
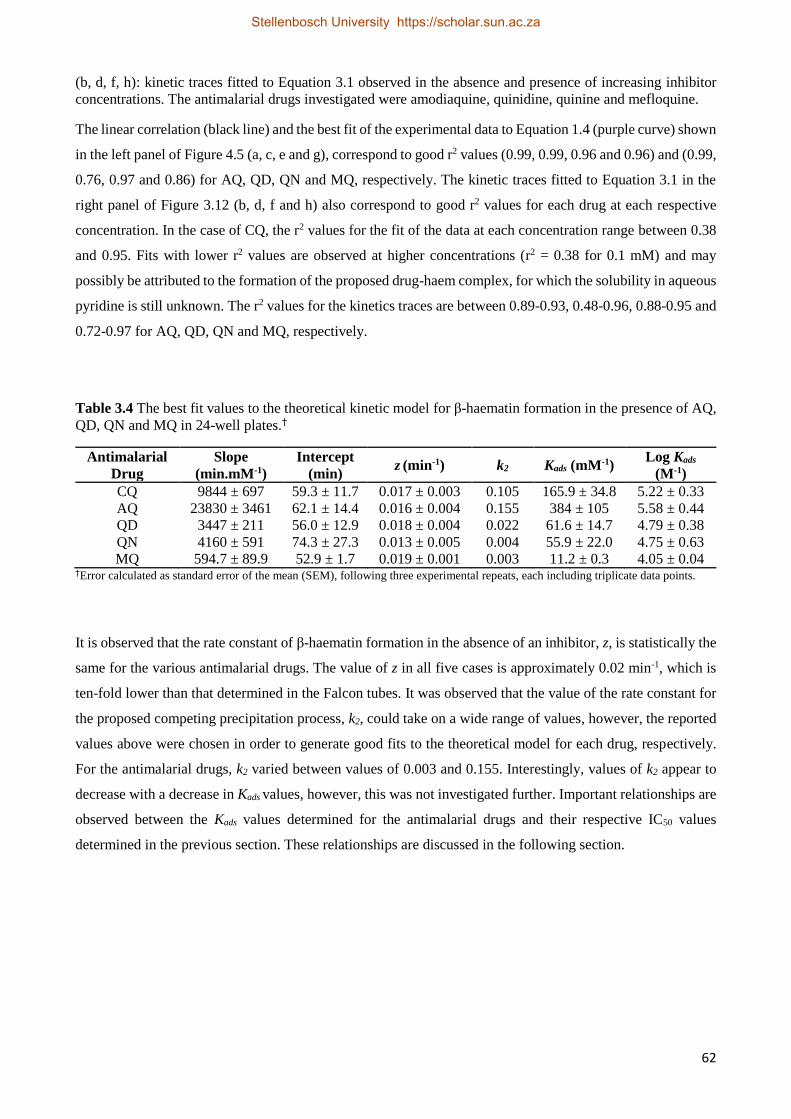
62
(b, d, f, h): kinetic traces fitted to Equation 3.1 observed in the absence and presence of increasing inhibitor
concentrations. The antimalarial drugs investigated were amodiaquine, quinidine, quinine and mefloquine.
The linear correlation (black line) and the best fit of the experimental data to Equation 1.4 (purple curve) shown
in the left panel of Figure 4.5 (a, c, e and g), correspond to good r2 values (0.99, 0.99, 0.96 and 0.96) and (0.99,
0.76, 0.97 and 0.86) for AQ, QD, QN and MQ, respectively. The kinetic traces fitted to Equation 3.1 in the
right panel of Figure 3.12 (b, d, f and h) also correspond to good r2 values for each drug at each respective
concentration. In the case of CQ, the r2 values for the fit of the data at each concentration range between 0.38
and 0.95. Fits with lower r2 values are observed at higher concentrations (r2 = 0.38 for 0.1 mM) and may
possibly be attributed to the formation of the proposed drug-haem complex, for which the solubility in aqueous
pyridine is still unknown. The r2 values for the kinetics traces are between 0.89-0.93, 0.48-0.96, 0.88-0.95 and
0.72-0.97 for AQ, QD, QN and MQ, respectively.
Table 3.4 The best fit values to the theoretical kinetic model for β-haematin formation in the presence of AQ,
QD, QN and MQ in 24-well plates.†
Antimalarial
Drug
Slope
(min.mM-1)
Intercept
(min) z (min-1) k2 Kads (mM-1)
Log Kads
(M-1)
CQ 9844 ± 697 59.3 ± 11.7 0.017 ± 0.003 0.105 165.9 ± 34.8 5.22 ± 0.33
AQ 23830 ± 3461 62.1 ± 14.4 0.016 ± 0.004 0.155 384 ± 105 5.58 ± 0.44
QD 3447 ± 211 56.0 ± 12.9 0.018 ± 0.004 0.022 61.6 ± 14.7 4.79 ± 0.38
QN 4160 ± 591 74.3 ± 27.3 0.013 ± 0.005 0.004 55.9 ± 22.0 4.75 ± 0.63
MQ 594.7 ± 89.9 52.9 ± 1.7 0.019 ± 0.001 0.003 11.2 ± 0.3 4.05 ± 0.04 †Error calculated as standard error of the mean (SEM), following three experimental repeats, each including triplicate data points.
It is observed that the rate constant of β-haematin formation in the absence of an inhibitor, z, is statistically the
same for the various antimalarial drugs. The value of z in all five cases is approximately 0.02 min-1, which is
ten-fold lower than that determined in the Falcon tubes. It was observed that the value of the rate constant for
the proposed competing precipitation process, k2, could take on a wide range of values, however, the reported
values above were chosen in order to generate good fits to the theoretical model for each drug, respectively.
For the antimalarial drugs, k2 varied between values of 0.003 and 0.155. Interestingly, values of k2 appear to
decrease with a decrease in Kads values, however, this was not investigated further. Important relationships are
observed between the Kads values determined for the antimalarial drugs and their respective IC50 values
determined in the previous section. These relationships are discussed in the following section.
Stellenbosch University https://scholar.sun.ac.za
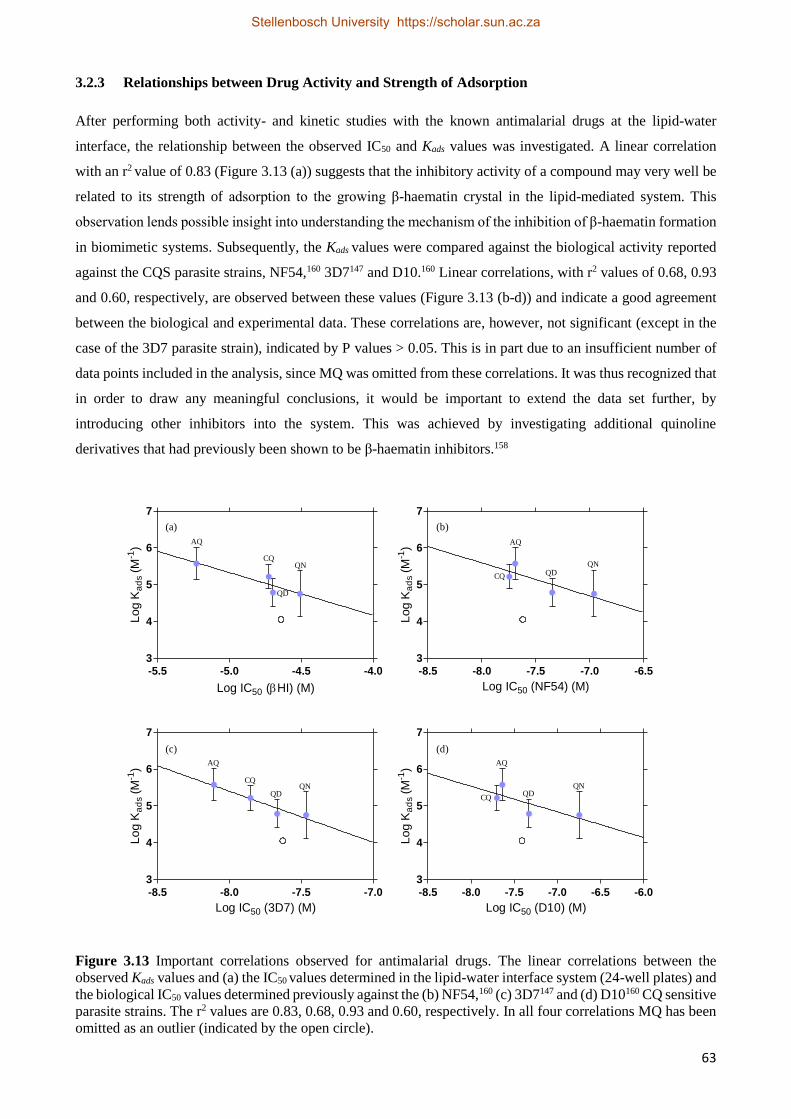
63
3.2.3 Relationships between Drug Activity and Strength of Adsorption
After performing both activity- and kinetic studies with the known antimalarial drugs at the lipid-water
interface, the relationship between the observed IC50 and Kads values was investigated. A linear correlation
with an r2 value of 0.83 (Figure 3.13 (a)) suggests that the inhibitory activity of a compound may very well be
related to its strength of adsorption to the growing β-haematin crystal in the lipid-mediated system. This
observation lends possible insight into understanding the mechanism of the inhibition of β-haematin formation
in biomimetic systems. Subsequently, the Kads values were compared against the biological activity reported
against the CQS parasite strains, NF54,160 3D7147 and D10.160 Linear correlations, with r2 values of 0.68, 0.93
and 0.60, respectively, are observed between these values (Figure 3.13 (b-d)) and indicate a good agreement
between the biological and experimental data. These correlations are, however, not significant (except in the
case of the 3D7 parasite strain), indicated by P values > 0.05. This is in part due to an insufficient number of
data points included in the analysis, since MQ was omitted from these correlations. It was thus recognized that
in order to draw any meaningful conclusions, it would be important to extend the data set further, by
introducing other inhibitors into the system. This was achieved by investigating additional quinoline
derivatives that had previously been shown to be β-haematin inhibitors.158
-5.5 -5.0 -4.5 -4.03
4
5
6
7
QD
AQ
CQQN
Log IC50 (HI) (M)
Log K
ad
s(M
-1)
-8.5 -8.0 -7.5 -7.0 -6.53
4
5
6
7
QD
AQ
CQ
QN
Log IC50 (NF54) (M)
Log K
ad
s(M
-1)
-8.5 -8.0 -7.5 -7.03
4
5
6
7
QD
AQ
CQQN
Log IC50 (3D7) (M)
Log K
ad
s(M
-1)
-8.5 -8.0 -7.5 -7.0 -6.5 -6.03
4
5
6
7
QD
AQ
CQ
QN
Log IC50 (D10) (M)
Log K
ad
s(M
-1)
(a) (b)
(c) (d)
Figure 3.13 Important correlations observed for antimalarial drugs. The linear correlations between the
observed Kads values and (a) the IC50 values determined in the lipid-water interface system (24-well plates) and
the biological IC50 values determined previously against the (b) NF54,160 (c) 3D7147 and (d) D10160 CQ sensitive
parasite strains. The r2 values are 0.83, 0.68, 0.93 and 0.60, respectively. In all four correlations MQ has been
omitted as an outlier (indicated by the open circle).
Stellenbosch University https://scholar.sun.ac.za
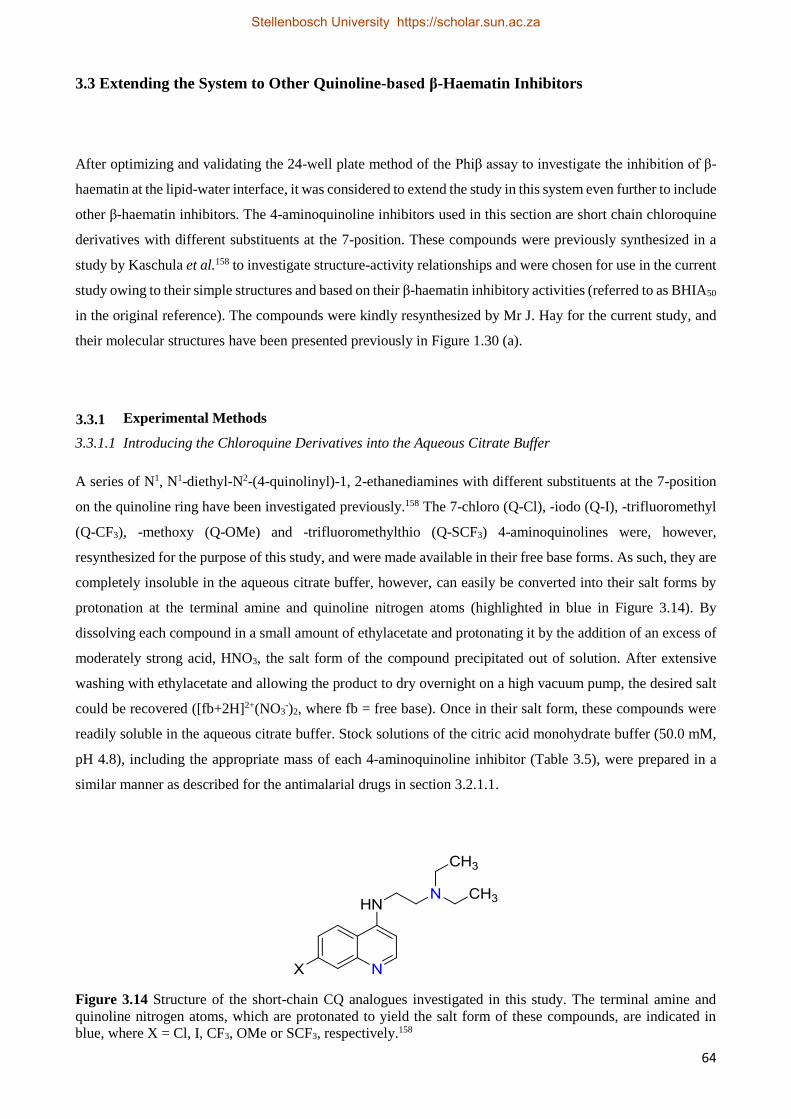
64
3.3 Extending the System to Other Quinoline-based β-Haematin Inhibitors
After optimizing and validating the 24-well plate method of the Phiβ assay to investigate the inhibition of β-
haematin at the lipid-water interface, it was considered to extend the study in this system even further to include
other β-haematin inhibitors. The 4-aminoquinoline inhibitors used in this section are short chain chloroquine
derivatives with different substituents at the 7-position. These compounds were previously synthesized in a
study by Kaschula et al.158 to investigate structure-activity relationships and were chosen for use in the current
study owing to their simple structures and based on their β-haematin inhibitory activities (referred to as BHIA50
in the original reference). The compounds were kindly resynthesized by Mr J. Hay for the current study, and
their molecular structures have been presented previously in Figure 1.30 (a).
3.2.1 Experimental Methods
3.3.1.1 Introducing the Chloroquine Derivatives into the Aqueous Citrate Buffer
A series of N1, N1-diethyl-N2-(4-quinolinyl)-1, 2-ethanediamines with different substituents at the 7-position
on the quinoline ring have been investigated previously.158 The 7-chloro (Q-Cl), -iodo (Q-I), -trifluoromethyl
(Q-CF3), -methoxy (Q-OMe) and -trifluoromethylthio (Q-SCF3) 4-aminoquinolines were, however,
resynthesized for the purpose of this study, and were made available in their free base forms. As such, they are
completely insoluble in the aqueous citrate buffer, however, can easily be converted into their salt forms by
protonation at the terminal amine and quinoline nitrogen atoms (highlighted in blue in Figure 3.14). By
dissolving each compound in a small amount of ethylacetate and protonating it by the addition of an excess of
moderately strong acid, HNO3, the salt form of the compound precipitated out of solution. After extensive
washing with ethylacetate and allowing the product to dry overnight on a high vacuum pump, the desired salt
could be recovered ([fb+2H]2+(NO3-)2, where fb = free base). Once in their salt form, these compounds were
readily soluble in the aqueous citrate buffer. Stock solutions of the citric acid monohydrate buffer (50.0 mM,
pH 4.8), including the appropriate mass of each 4-aminoquinoline inhibitor (Table 3.5), were prepared in a
similar manner as described for the antimalarial drugs in section 3.2.1.1.
Figure 3.14 Structure of the short-chain CQ analogues investigated in this study. The terminal amine and
quinoline nitrogen atoms, which are protonated to yield the salt form of these compounds, are indicated in
blue, where X = Cl, I, CF3, OMe or SCF3, respectively.158
3.3.1
Stellenbosch University https://scholar.sun.ac.za
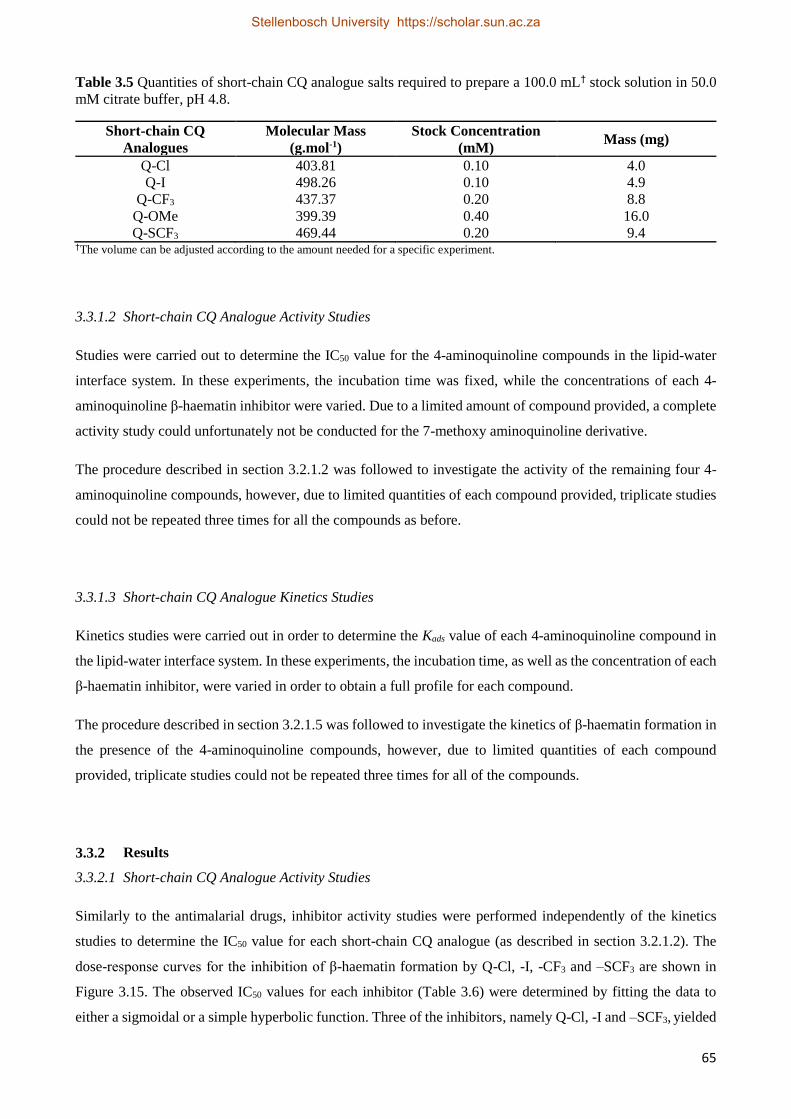
65
Table 3.5 Quantities of short-chain CQ analogue salts required to prepare a 100.0 mL† stock solution in 50.0
mM citrate buffer, pH 4.8.
Short-chain CQ
Analogues
Molecular Mass
(g.mol-1)
Stock Concentration
(mM) Mass (mg)
Q-Cl 403.81 0.10 4.0
Q-I 498.26 0.10 4.9
Q-CF3 437.37 0.20 8.8
Q-OMe 399.39 0.40 16.0
Q-SCF3 469.44 0.20 9.4 †The volume can be adjusted according to the amount needed for a specific experiment.
3.3.1.2 Short-chain CQ Analogue Activity Studies
Studies were carried out to determine the IC50 value for the 4-aminoquinoline compounds in the lipid-water
interface system. In these experiments, the incubation time was fixed, while the concentrations of each 4-
aminoquinoline β-haematin inhibitor were varied. Due to a limited amount of compound provided, a complete
activity study could unfortunately not be conducted for the 7-methoxy aminoquinoline derivative.
The procedure described in section 3.2.1.2 was followed to investigate the activity of the remaining four 4-
aminoquinoline compounds, however, due to limited quantities of each compound provided, triplicate studies
could not be repeated three times for all the compounds as before.
3.3.1.3 Short-chain CQ Analogue Kinetics Studies
Kinetics studies were carried out in order to determine the Kads value of each 4-aminoquinoline compound in
the lipid-water interface system. In these experiments, the incubation time, as well as the concentration of each
β-haematin inhibitor, were varied in order to obtain a full profile for each compound.
The procedure described in section 3.2.1.5 was followed to investigate the kinetics of β-haematin formation in
the presence of the 4-aminoquinoline compounds, however, due to limited quantities of each compound
provided, triplicate studies could not be repeated three times for all of the compounds.
3.2.2 Results
3.3.2.1 Short-chain CQ Analogue Activity Studies
Similarly to the antimalarial drugs, inhibitor activity studies were performed independently of the kinetics
studies to determine the IC50 value for each short-chain CQ analogue (as described in section 3.2.1.2). The
dose-response curves for the inhibition of β-haematin formation by Q-Cl, -I, -CF3 and –SCF3 are shown in
Figure 3.15. The observed IC50 values for each inhibitor (Table 3.6) were determined by fitting the data to
either a sigmoidal or a simple hyperbolic function. Three of the inhibitors, namely Q-Cl, -I and –SCF3, yielded
3.3.2
Stellenbosch University https://scholar.sun.ac.za
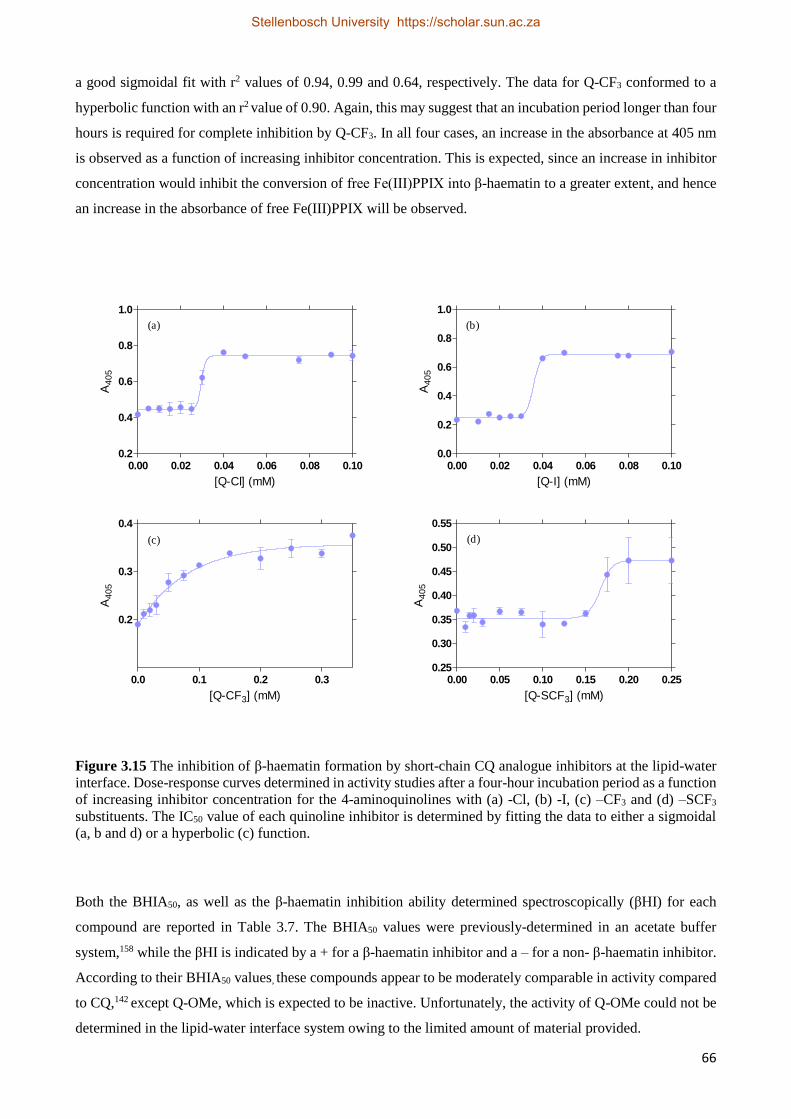
66
a good sigmoidal fit with r2 values of 0.94, 0.99 and 0.64, respectively. The data for Q-CF3 conformed to a
hyperbolic function with an r2 value of 0.90. Again, this may suggest that an incubation period longer than four
hours is required for complete inhibition by Q-CF3. In all four cases, an increase in the absorbance at 405 nm
is observed as a function of increasing inhibitor concentration. This is expected, since an increase in inhibitor
concentration would inhibit the conversion of free Fe(III)PPIX into β-haematin to a greater extent, and hence
an increase in the absorbance of free Fe(III)PPIX will be observed.
0.00 0.02 0.04 0.06 0.08 0.100.2
0.4
0.6
0.8
1.0
[Q-Cl] (mM)
A4
05
0.00 0.02 0.04 0.06 0.08 0.100.0
0.2
0.4
0.6
0.8
1.0
[Q-I] (mM)
A4
05
0.0 0.1 0.2 0.3
0.2
0.3
0.4
[Q-CF3] (mM)
A4
05
0.00 0.05 0.10 0.15 0.20 0.250.25
0.30
0.35
0.40
0.45
0.50
0.55
[Q-SCF3] (mM)
A4
05
(a)
(c)
(b)
(d)
Figure 3.15 The inhibition of β-haematin formation by short-chain CQ analogue inhibitors at the lipid-water
interface. Dose-response curves determined in activity studies after a four-hour incubation period as a function
of increasing inhibitor concentration for the 4-aminoquinolines with (a) -Cl, (b) -I, (c) –CF3 and (d) –SCF3
substituents. The IC50 value of each quinoline inhibitor is determined by fitting the data to either a sigmoidal
(a, b and d) or a hyperbolic (c) function.
Both the BHIA50, as well as the β-haematin inhibition ability determined spectroscopically (βHI) for each
compound are reported in Table 3.7. The BHIA50 values were previously-determined in an acetate buffer
system,158 while the βHI is indicated by a + for a β-haematin inhibitor and a – for a non- β-haematin inhibitor.
According to their BHIA50 values, these compounds appear to be moderately comparable in activity compared
to CQ,142 except Q-OMe, which is expected to be inactive. Unfortunately, the activity of Q-OMe could not be
determined in the lipid-water interface system owing to the limited amount of material provided.
Stellenbosch University https://scholar.sun.ac.za
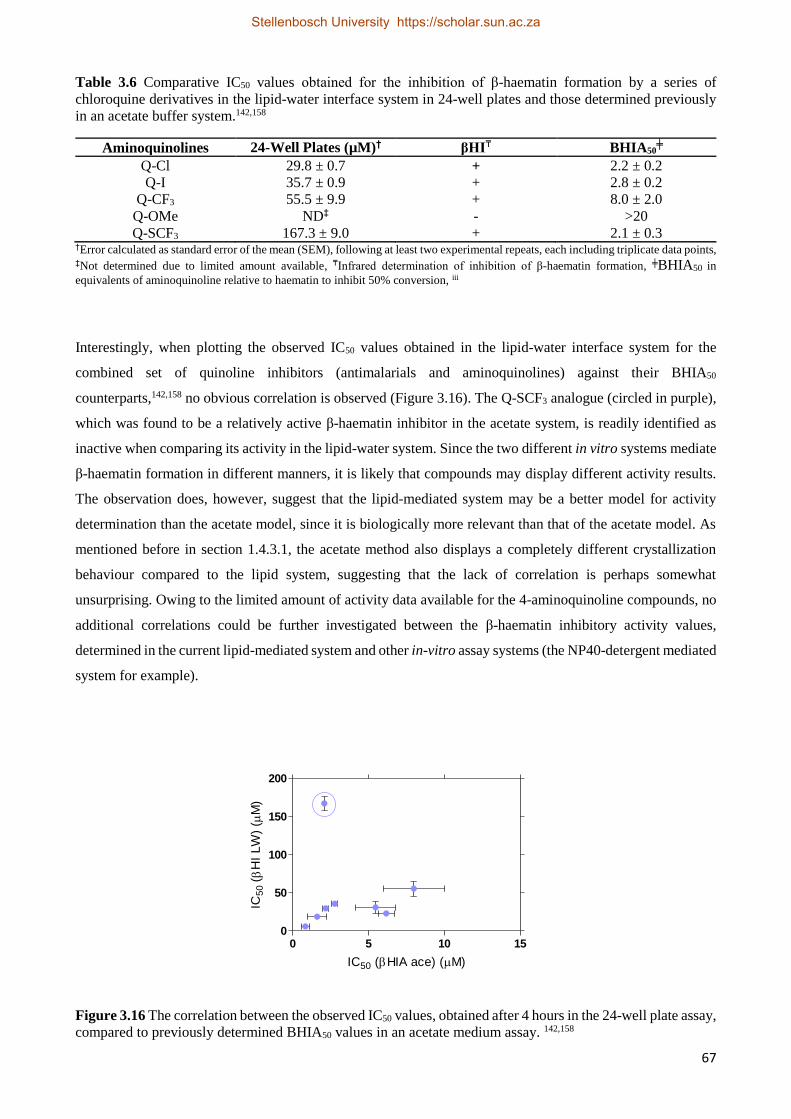
67
Table 3.6 Comparative IC50 values obtained for the inhibition of β-haematin formation by a series of
chloroquine derivatives in the lipid-water interface system in 24-well plates and those determined previously
in an acetate buffer system.142,158
Aminoquinolines 24-Well Plates (µM)† βHI₸ BHIA50╪
Q-Cl 29.8 ± 0.7 + 2.2 ± 0.2
Q-I 35.7 ± 0.9 + 2.8 ± 0.2
Q-CF3 55.5 ± 9.9 + 8.0 ± 2.0
Q-OMe ND‡ - >20
Q-SCF3 167.3 ± 9.0 + 2.1 ± 0.3 †Error calculated as standard error of the mean (SEM), following at least two experimental repeats, each including triplicate data points, ‡Not determined due to limited amount available, ₸Infrared determination of inhibition of β-haematin formation, ╪BHIA50 in
equivalents of aminoquinoline relative to haematin to inhibit 50% conversion, iii
Interestingly, when plotting the observed IC50 values obtained in the lipid-water interface system for the
combined set of quinoline inhibitors (antimalarials and aminoquinolines) against their BHIA50
counterparts,142,158 no obvious correlation is observed (Figure 3.16). The Q-SCF3 analogue (circled in purple),
which was found to be a relatively active β-haematin inhibitor in the acetate system, is readily identified as
inactive when comparing its activity in the lipid-water system. Since the two different in vitro systems mediate
β-haematin formation in different manners, it is likely that compounds may display different activity results.
The observation does, however, suggest that the lipid-mediated system may be a better model for activity
determination than the acetate model, since it is biologically more relevant than that of the acetate model. As
mentioned before in section 1.4.3.1, the acetate method also displays a completely different crystallization
behaviour compared to the lipid system, suggesting that the lack of correlation is perhaps somewhat
unsurprising. Owing to the limited amount of activity data available for the 4-aminoquinoline compounds, no
additional correlations could be further investigated between the β-haematin inhibitory activity values,
determined in the current lipid-mediated system and other in-vitro assay systems (the NP40-detergent mediated
system for example).
0 5 10 150
50
100
150
200
IC50 (HIA ace) (M)
IC5
0(
HI
LW
)(
M)
Figure 3.16 The correlation between the observed IC50 values, obtained after 4 hours in the 24-well plate assay,
compared to previously determined BHIA50 values in an acetate medium assay. 142,158
Stellenbosch University https://scholar.sun.ac.za
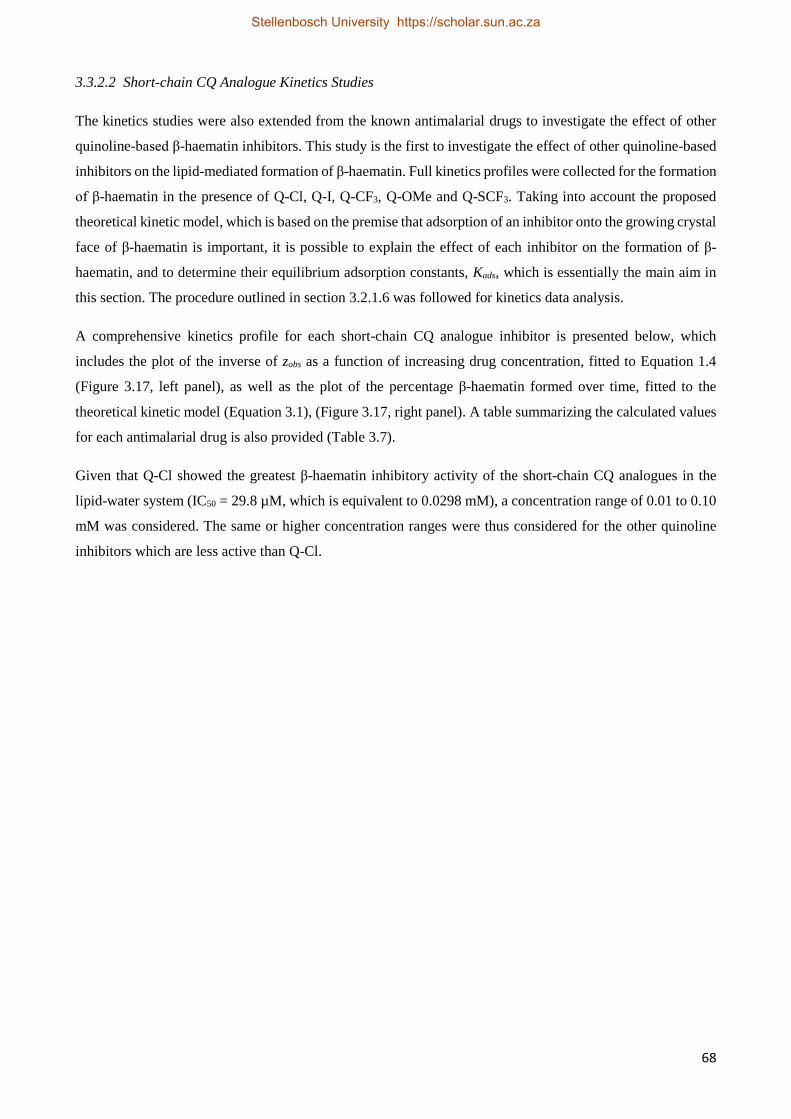
68
3.3.2.2 Short-chain CQ Analogue Kinetics Studies
The kinetics studies were also extended from the known antimalarial drugs to investigate the effect of other
quinoline-based β-haematin inhibitors. This study is the first to investigate the effect of other quinoline-based
inhibitors on the lipid-mediated formation of β-haematin. Full kinetics profiles were collected for the formation
of β-haematin in the presence of Q-Cl, Q-I, Q-CF3, Q-OMe and Q-SCF3. Taking into account the proposed
theoretical kinetic model, which is based on the premise that adsorption of an inhibitor onto the growing crystal
face of β-haematin is important, it is possible to explain the effect of each inhibitor on the formation of β-
haematin, and to determine their equilibrium adsorption constants, Kads, which is essentially the main aim in
this section. The procedure outlined in section 3.2.1.6 was followed for kinetics data analysis.
A comprehensive kinetics profile for each short-chain CQ analogue inhibitor is presented below, which
includes the plot of the inverse of zobs as a function of increasing drug concentration, fitted to Equation 1.4
(Figure 3.17, left panel), as well as the plot of the percentage β-haematin formed over time, fitted to the
theoretical kinetic model (Equation 3.1), (Figure 3.17, right panel). A table summarizing the calculated values
for each antimalarial drug is also provided (Table 3.7).
Given that Q-Cl showed the greatest β-haematin inhibitory activity of the short-chain CQ analogues in the
lipid-water system (IC50 = 29.8 µM, which is equivalent to 0.0298 mM), a concentration range of 0.01 to 0.10
mM was considered. The same or higher concentration ranges were thus considered for the other quinoline
inhibitors which are less active than Q-Cl.
Stellenbosch University https://scholar.sun.ac.za
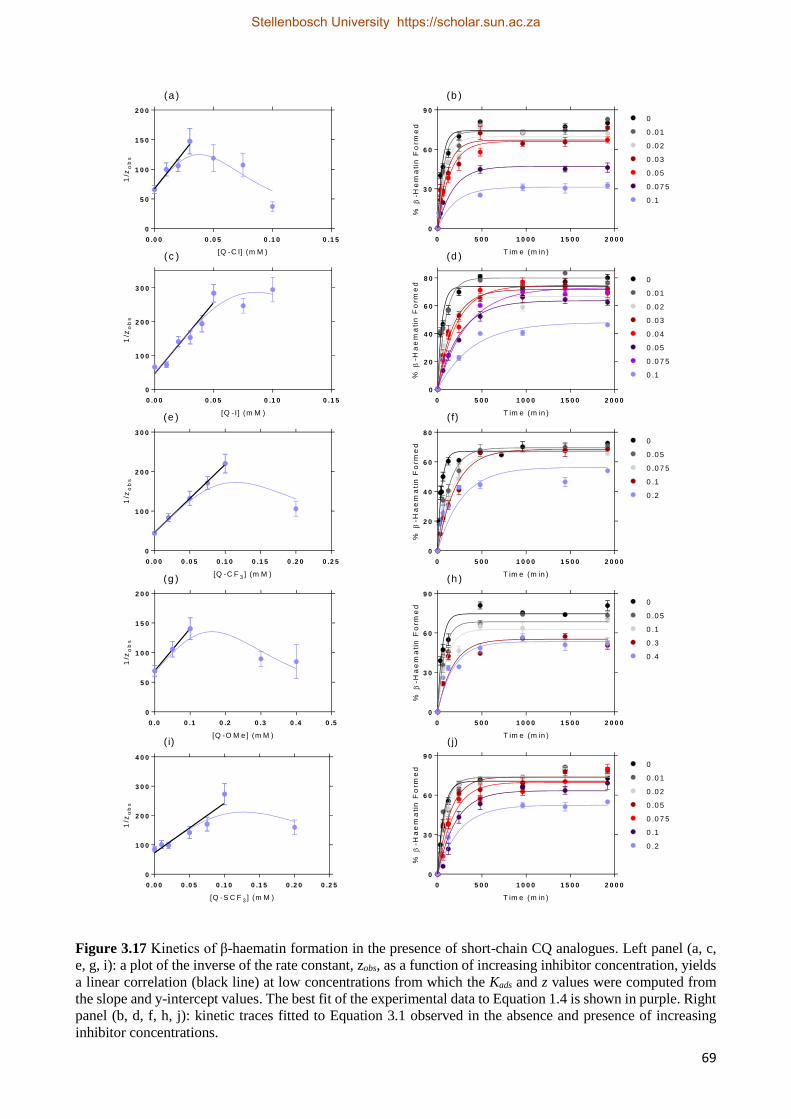
69
0 .0 0 0 .0 5 0 .1 0 0 .1 5
0
5 0
1 0 0
1 5 0
2 0 0
[Q -C l] (m M )
1/z
ob
s
0 5 0 0 1 0 0 0 1 5 0 0 2 0 0 0
0
3 0
6 0
9 0
0 .1
0 .0 7 5
0 .0 5
0 .0 3
0 .0 2
0 .0 1
0
T im e (m in )
%
-He
ma
tin
Fo
rme
d
0 .0 0 0 .0 5 0 .1 0 0 .1 5
0
1 0 0
2 0 0
3 0 0
[Q - I ] (m M )
1/z
ob
s
0 5 0 0 1 0 0 0 1 5 0 0 2 0 0 0
0
2 0
4 0
6 0
8 0 0
0 .0 1
0 .0 2
0 .0 3
0 .0 4
0 .0 5
0 .0 7 5
0 .1
T im e (m in )%
-H
ae
ma
tin
Fo
rme
d
0 .0 0 0 .0 5 0 .1 0 0 .1 5 0 .2 0 0 .2 5
0
1 0 0
2 0 0
3 0 0
[Q -C F 3 ] (m M )
1/z
ob
s
0 5 0 0 1 0 0 0 1 5 0 0 2 0 0 0
0
2 0
4 0
6 0
8 0
0 .2
0 .1
0 .0 7 5
0 .0 5
0
T im e (m in )
%
-Ha
em
ati
n F
orm
ed
0 .0 0 .1 0 .2 0 .3 0 .4 0 .5
0
5 0
1 0 0
1 5 0
2 0 0
[Q -O M e ] (m M )
1/z
ob
s
0 5 0 0 1 0 0 0 1 5 0 0 2 0 0 0
0
3 0
6 0
9 0
0
0 .0 5
0 .1
0 .3
0 .4
T im e (m in )
%
-Ha
em
ati
n F
orm
ed
0 .0 0 0 .0 5 0 .1 0 0 .1 5 0 .2 0 0 .2 5
0
1 0 0
2 0 0
3 0 0
4 0 0
[Q -S C F 3 ] (m M )
1/z
ob
s
0 5 0 0 1 0 0 0 1 5 0 0 2 0 0 0
0
3 0
6 0
9 0
0
0 .0 1
0 .0 2
0 .0 5
0 .0 7 5
0 .1
0 .2
T im e (m in )
%
-Ha
em
ati
n F
orm
ed
(a ) (b )
(c ) (d )
(e ) ( f)
(g ) (h )
( i) ( j)
Figure 3.17 Kinetics of β-haematin formation in the presence of short-chain CQ analogues. Left panel (a, c,
e, g, i): a plot of the inverse of the rate constant, zobs, as a function of increasing inhibitor concentration, yields
a linear correlation (black line) at low concentrations from which the Kads and z values were computed from
the slope and y-intercept values. The best fit of the experimental data to Equation 1.4 is shown in purple. Right
panel (b, d, f, h, j): kinetic traces fitted to Equation 3.1 observed in the absence and presence of increasing
inhibitor concentrations.
Stellenbosch University https://scholar.sun.ac.za
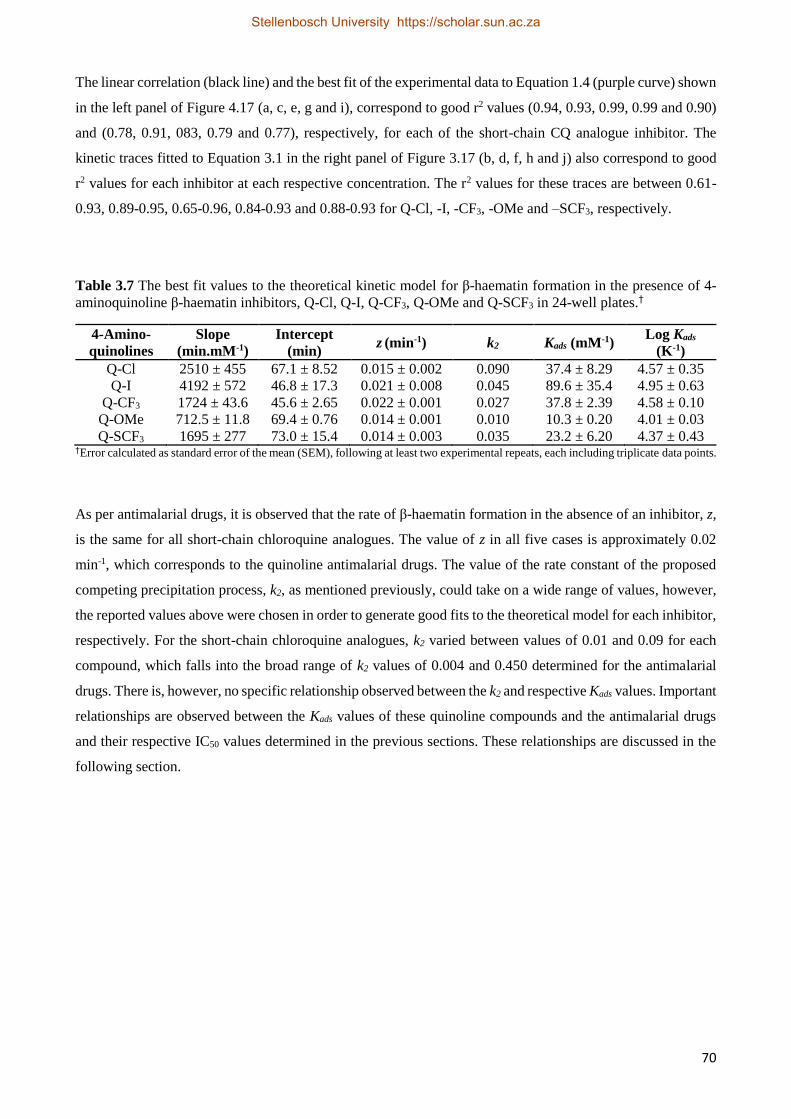
70
The linear correlation (black line) and the best fit of the experimental data to Equation 1.4 (purple curve) shown
in the left panel of Figure 4.17 (a, c, e, g and i), correspond to good r2 values (0.94, 0.93, 0.99, 0.99 and 0.90)
and (0.78, 0.91, 083, 0.79 and 0.77), respectively, for each of the short-chain CQ analogue inhibitor. The
kinetic traces fitted to Equation 3.1 in the right panel of Figure 3.17 (b, d, f, h and j) also correspond to good
r2 values for each inhibitor at each respective concentration. The r2 values for these traces are between 0.61-
0.93, 0.89-0.95, 0.65-0.96, 0.84-0.93 and 0.88-0.93 for Q-Cl, -I, -CF3, -OMe and –SCF3, respectively.
Table 3.7 The best fit values to the theoretical kinetic model for β-haematin formation in the presence of 4-
aminoquinoline β-haematin inhibitors, Q-Cl, Q-I, Q-CF3, Q-OMe and Q-SCF3 in 24-well plates.†
4-Amino-
quinolines
Slope
(min.mM-1)
Intercept
(min) z (min-1) k2 Kads (mM-1)
Log Kads
(K-1)
Q-Cl 2510 ± 455 67.1 ± 8.52 0.015 ± 0.002 0.090 37.4 ± 8.29 4.57 ± 0.35
Q-I 4192 ± 572 46.8 ± 17.3 0.021 ± 0.008 0.045 89.6 ± 35.4 4.95 ± 0.63
Q-CF3 1724 ± 43.6 45.6 ± 2.65 0.022 ± 0.001 0.027 37.8 ± 2.39 4.58 ± 0.10
Q-OMe 712.5 ± 11.8 69.4 ± 0.76 0.014 ± 0.001 0.010 10.3 ± 0.20 4.01 ± 0.03
Q-SCF3 1695 ± 277 73.0 ± 15.4 0.014 ± 0.003 0.035 23.2 ± 6.20 4.37 ± 0.43 †Error calculated as standard error of the mean (SEM), following at least two experimental repeats, each including triplicate data points.
As per antimalarial drugs, it is observed that the rate of β-haematin formation in the absence of an inhibitor, z,
is the same for all short-chain chloroquine analogues. The value of z in all five cases is approximately 0.02
min-1, which corresponds to the quinoline antimalarial drugs. The value of the rate constant of the proposed
competing precipitation process, k2, as mentioned previously, could take on a wide range of values, however,
the reported values above were chosen in order to generate good fits to the theoretical model for each inhibitor,
respectively. For the short-chain chloroquine analogues, k2 varied between values of 0.01 and 0.09 for each
compound, which falls into the broad range of k2 values of 0.004 and 0.450 determined for the antimalarial
drugs. There is, however, no specific relationship observed between the k2 and respective Kads values. Important
relationships are observed between the Kads values of these quinoline compounds and the antimalarial drugs
and their respective IC50 values determined in the previous sections. These relationships are discussed in the
following section.
Stellenbosch University https://scholar.sun.ac.za
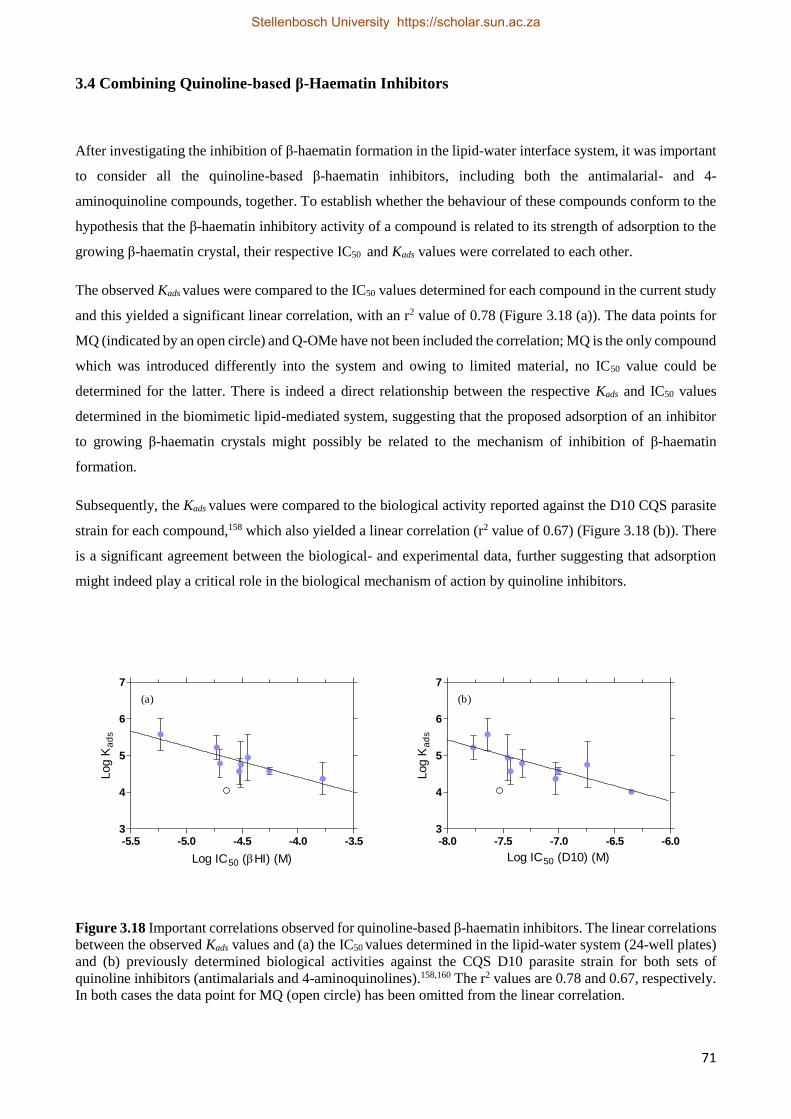
71
3.4 Combining Quinoline-based β-Haematin Inhibitors
After investigating the inhibition of β-haematin formation in the lipid-water interface system, it was important
to consider all the quinoline-based β-haematin inhibitors, including both the antimalarial- and 4-
aminoquinoline compounds, together. To establish whether the behaviour of these compounds conform to the
hypothesis that the β-haematin inhibitory activity of a compound is related to its strength of adsorption to the
growing β-haematin crystal, their respective IC50 and Kads values were correlated to each other.
The observed Kads values were compared to the IC50 values determined for each compound in the current study
and this yielded a significant linear correlation, with an r2 value of 0.78 (Figure 3.18 (a)). The data points for
MQ (indicated by an open circle) and Q-OMe have not been included the correlation; MQ is the only compound
which was introduced differently into the system and owing to limited material, no IC50 value could be
determined for the latter. There is indeed a direct relationship between the respective Kads and IC50 values
determined in the biomimetic lipid-mediated system, suggesting that the proposed adsorption of an inhibitor
to growing β-haematin crystals might possibly be related to the mechanism of inhibition of β-haematin
formation.
Subsequently, the Kads values were compared to the biological activity reported against the D10 CQS parasite
strain for each compound,158 which also yielded a linear correlation (r2 value of 0.67) (Figure 3.18 (b)). There
is a significant agreement between the biological- and experimental data, further suggesting that adsorption
might indeed play a critical role in the biological mechanism of action by quinoline inhibitors.
-5.5 -5.0 -4.5 -4.0 -3.53
4
5
6
7
Log IC50 (HI) (M)
Log K
ad
s
-8.0 -7.5 -7.0 -6.5 -6.03
4
5
6
7
Log IC50 (D10) (M)
Log K
ad
s
(a) (b)
Figure 3.18 Important correlations observed for quinoline-based β-haematin inhibitors. The linear correlations
between the observed Kads values and (a) the IC50 values determined in the lipid-water system (24-well plates)
and (b) previously determined biological activities against the CQS D10 parasite strain for both sets of
quinoline inhibitors (antimalarials and 4-aminoquinolines).158,160 The r2 values are 0.78 and 0.67, respectively.
In both cases the data point for MQ (open circle) has been omitted from the linear correlation.
Stellenbosch University https://scholar.sun.ac.za
72
3.5 Discussion
The main focus of this part of the study was to investigate the interaction between quinoline-based β-haematin
inhibitors, and Fe(III)PPIX, resulting in the inhibition of β-haematin formation. The first important objective
was to optimize the previously-used modified Phiβ assay. This work built on from preliminary studies reported
in our laboratory,40 which created a fundamental basis in understanding the behaviour of antimalarial drugs on
the formation of β-haematin. In order to develop a higher-throughput assay, the same known antimalarial drugs
were systematically incorporated into the lipid-mediated system, adjusting different variables in the process.
The main advantage of the optimized assay is the faster turnaround time per individual compound investigated
in the lipid-mediated system. Previously, it took weeks or months to conduct a detailed kinetics study for a
single β-haematin inhibitor, hence the effect of only four compounds on the formation of β-haematin had been
investigated prior to the current study in this system.40
It has previously been shown by Hoang et al.74 that an increase in the surface area of a vessel in which β-
haematin formation is performed results in a decrease in the overall percentage yield of β-haematin with little
to no change in the rate of formation. This study evidently suggested that the surface area of a vessel plays a
major role in the percentage yield of β-haematin formation. Interestingly, in the current study, the same amount
of β-haematin is formed, but over a longer period of time, when changing the experimental vessel from 15 mL
Greiner Falcon centrifuge tubes to 24-well plates. The diameter of the two vessels is, however, the same,
accounting for the same amount of β-haematin formed. The observed ten-fold decrease in the rate of β-
haematin formation in the absence of an inhibitor could be accounted for following an investigation of the
effect of different solvent concentrations in the system. A higher lipid-Fe(III)PPIX to buffer ratio is present in
the end volume of each well in a 24-well plate compared to the ratio in each Falcon tube, resulting in higher
organic solvent (acetone: methanol) concentrations. Based on the proposed evolution of a lipid emulsion during
solvent mixing rather than the formation of a distinct lipid-water interface,74 it is plausible that the rate of
diffusion of acetone and methanol, the solvents in which the lipid and Fe(III)PPIX are introduced into the
system, is slower in each well compared to a faster rate of diffusion in each tube. This in return will have an
effect on the rate at which the lipid-water interface forms in the system, and hence will influence the rate of β-
haematin formation. By increasing the incubation period, the maximum yield of β-haematin could still be
attained.
In order to probe the relative β-haematin inhibitory activity of each antimalarial drug, independent drug activity
studies were carried out with AQ, CQ, MQ, QD and QN in the newly-optimized lipid-mediated system. When
comparing the data obtained from the optimized assay to the previously-used lipid-mediated assay, the IC50
values are in good agreement with one another (Figure 3.8 (a)).40 The observed trend in drug activity is the
same, with AQ being the most active β-haematin inhibitor, followed by CQ, QD and QN, respectively. The 4-
aminoquinoline antimalarial drugs are more active β-haematin inhibitors in the lipid-water interface system
than the quinoline methanol antimalarial drugs. Subsequently, the β-haematin inhibitory activity of each drug
Stellenbosch University https://scholar.sun.ac.za
73
was also compared against previously-determined drug activities obtained from two different in vitro assays.
The Phiβ acetate assay was one of the first higher-throughput assays developed to investigate the formation of
β-haematin and the inhibition thereof.145 There is no correlation between the IC50 values determined in the
current lipid-mediated system and the IC50 values, determined as drug equivalents, in the acetate medium
(Figure 3.8 (b)). A significant correlation is, however, observed when comparing the relative IC50 values to the
drug activities determined in the NP40-detergent mediated assay, which is a lipid environment mimic assay
(Figure 3.8 (c)). These observations suggest that a lipid-mediated environment is more relevant for
investigating the inhibition of β-haematin formation than previously-used acetate medium assays.
Furthermore, a good correlation is also observed between the IC50 values obtained from the current system and
previously-determined activities against the 3D7 CQS parasite strain.147 Overall, taking the correlations in
Figures 3.8 and 3.9 into account, the data are indicative that the newly-optimized assay, incorporating in the
lipid-water interface in 24-well plates, is indeed a valid system in which to investigate drug activity
As the theoretical model predicts, the dose-response behaviour from the respective kinetics profiles generates
hyperbolic dose-response curves at shorter incubation times, and sigmoidal dose-response curves at longer
incubation times (Figure 1.28). In the current study, however, both dose-response curves are observed for the
experimental inhibition data for IC50 determination at a four-hour incubation period for the quinoline β-
haematin inhibitors (antimalarial drugs and short-chain chloroquine analogues). AQ, CQ, MQ, Q-Cl, Q-I and
Q-SCF3 produce sigmoidal dose-response curves, while QD, QN and Q-CF3 gives rise to a hyperbolic function.
According to the theoretical model, a hyperbolic dose-response curve is indicative of a measurement having
been made while the formation of β-haematin is still underway. On the other hand, the model predicts a
sigmoidal dose-response curve when the incubation time is sufficiently long such that the formation of β-
haematin has reached its maximum. Given the decreased rate of β-haematin formation in the 24-well plates, a
longer incubation time (four hours) was chosen compared to the earlier studies (30 minutes). In both cases, the
choice of incubation time was not informed by any particular experiment, and alternative incubation times
could have been chosen. What is important, however, is that incubation time was fixed for the activity studies,
allowing comparisons to be made and conclusions drawn based on the variable in the system, namely the
different inhibitors.
An independent time study shows that there is a non-linear relationship between the IC50 values and increasing
incubation time for CQ and QD (Figure 3.10). It is apparent that shorter incubation times have a more
prominent effect on the IC50 value of a specific drug, while little further change is observed at longer incubation
times. This is an important observation which was made in the previous study as well, suggesting the
importance of taking incubation times into consideration when investigating β-haematin inhibitors.40 The
incubation time at which activity studies were investigated in the current study was chosen arbitrarily as four
hours, compared to 30 minutes, which was also chosen arbitrarily in the previous study. The fact that the
absolute magnitude of the IC50 value for a particular drug is marginally different in the two studies may be due
in part to the fact that measurements were not made at the same incubation time. The increase in incubation
time in the current study was, however, decided upon owing to the ten-fold decrease observed in the rate of β-
Stellenbosch University https://scholar.sun.ac.za
74
haematin formation. It is important to note that since the IC50 value of a compound is related to incubation
time, a different IC50 would be expected when a different incubation time is chosen. This would have an impact
on the overall correlations which are made with the calculated IC50 values in the lipid-mediated system and
may improve the r2 values of these correlations overall. However, with the current incubation time of four
hours, the observed correlations still suggest that the lipid-mediated system is a suitable mimic of the in vivo
environment.
No significant relationship is observed for the quinoline β-haematin inhibitors (antimalarial drugs and short-
chain chloroquine analogues) when correlating their respective IC50 values obtained in the current lipid-
mediated system to the β-haematin inhibitory activity in an acetate medium system (determined as inhibitor
equivalents).158 The inhibitory activity for Q-SCF3 was determined to be better than Q-Cl in the acetate
system,158 however, it appears to be five time less active than the 7-chloro substituted short-chain 4-
aminoquinoline in the lipid-mediated system. The other three inhibitors were found to have similar activities
relative to each other when comparing the two systems; Q-Cl being more active than Q-I and Q-CF3,
respectively. This observation further supports the suggestion that the acetate medium, or any other non-
biological medium, as a system of β-haematin formation and inhibition thereof is unfavourable and
investigating β-haematin inhibitory activities in more biologically-relevant systems, such as the lipid-mediated
systems, is more effective and sensible. Biologically-relevant systems are in closer comparison to the
environment in the neutral lipid bodies within the digestive vacuole, in which haemozoin formation occurs in
vivo. The fact that false positives may occur in the acetate system and not in the lipid system, indicates that the
latter produces more reliable results.
In this part of the current study, the effect of quinoline-based β-haematin inhibitors on the formation of β-
haematin was investigated at the lipid-water interface. Compared to the previous kinetics studies,40 similar
observations were recorded with regards to overall β-haematin inhibition. A decrease in the rate of β-haematin
formation is observed as the inhibitor concentration is systematically increased, while a decrease in the
percentage yield of the β-haematin formed is evident when introducing very high concentrations of inhibitor.
This observation is made throughout the study for the antimalarial drugs and the 4-aminoquinoline analogues,
suggesting that both sets of quinoline-based inhibitors behave similarly in the inhibition of β-haematin
formation, even though the decrease in the yield of β-haematin formation is not noticeable for all the inhibitors.
It is considered that the quinoline-based inhibitors act by decreasing the rate of β-haematin formation at low
concentrations which are biologically relevant, rather than inhibiting the β-haematin formation completely. It
has been proposed that the decrease in the rate of β-haematin formation may be accounted for by the
noncovalent adsorption of the inhibitors to the growing crystal surface of β-haematin,39 while the decrease in
β-haematin yield at high inhibitor concentration, may be accounted for by the irreversible precipitation of
Fe(III)PPIX as an inhibitor complex.40 It is known that β-haematin inhibitory compounds are able to associate
with free Fe(III)PPIX in solution by means of coordination or π-stacking. Such complexation would prevent
its incorporation into β-haematin,117,118 which would therefore result in a decrease in the final yield of β-
haematin formed.
Stellenbosch University https://scholar.sun.ac.za
75
The observed rate constant of β-haematin formation in the absence of an inhibitor (z), was determined from
the plots of the inverse of zobs as a function of increasing inhibitor concentration, in each case. The value in all
cases for the quinoline-based inhibitors was found to be approximately 0.02 min-1. This observation is
consistent with what is expected, since z is independent of an inhibitor under similar system conditions. The
Kads values were also successfully extracted from these plots for each quinoline-based inhibitor, while the
experimental kinetics data recorded for each inhibitor conform to the proposed theoretical kinetic model used
to probe the behaviour of each inhibitor in the lipid-mediated system. For the best fit to the model, the Kads and
z values were constrained to the values attained from the linear regression analysis. Accurate values for k2, the
rate constant for the proposed competing process that results in the precipitation of haematin, were not
investigated in the current study, since this process is still poorly understood. The k2 values were thus allowed
to refine freely in order to generate the best fit of the experimental data to the model. The k2 value can generally
accommodate a range of values and is the only parameter that was adjusted to generate good r2 fits. In the
current study, k2 was varied in a broad range between 0.003 and 0.155 for the antimalarial drugs, while a range
of values between 0.01 and 0.09 was considered for the 4-aminoquinoline inhibitors. It is, however, important
to be able to determine the k2 values independently for each individual group of inhibitors, and this is
recommended for future studies to improve our understanding of the system and the interplay between different
processes involving Fe(III)PPIX.
Good linear correlations are observed between the observed Kads values and the β-haematin inhibitory activity
values for the antimalarial drugs determined in the current lipid-mediated system, as well as against different
biological CQS NF54, 3D7 and D10 parasite strains (Figure 3.13). These correlations suggest that the β-
haematin inhibitory activity of each compound is related to its strength of adsorption, which corresponds to
the main hypothesis of β-haematin inhibition. However, having only four data points in hand, the correlations
are not significant. In order to draw a meaningful conclusion about a possible activity-adsorption relationship,
these drugs were viewed together with a set of short-chain CQ analogues.
A significant linear correlation with an r2 value of 0.78 (P value < 0.01) is observed between the adsorption
constants (Kads) and the β-haematin inhibitory activities (IC50) obtained for the quinoline-based β-haematin
inhibitors (Figure 3.18 (a)). For AQ, the most active compound tested in the lipid-mediated system, the large
adsorption constant of Kads = 384 ± 105 mM-1 is inversely related to its low IC50 value, 5.9 ± 0.3 µM. Similarly,
but on the other end of the scale, the least active inhibitor, Q-SCF3 (IC50 value of 167 ± 9.0 µM) adsorbs sixteen
times weaker, Kads = 23.2 ± 6.20 mM-1. According to the significant relationship observed, it is proposed that
the strength at which the quinoline-based inhibitors might adsorb to the surface of β-haematin crystals,
inhibiting further growth, is associated with its β-haematin inhibitory activity, at least in the lipid-water
interface system.
Notably, a significant linear correlation with an r2 value of 0.67 is also observed between the Kads values and
previously-determined biological activity against the CQS D10 parasite strain (Figure 3.18 (b)). It is important
to notice that the data points are well spread out along the linear line, suggesting that the correlation is not in
any way a result of points assembling together or the weighting of one particular data point on either side of
Stellenbosch University https://scholar.sun.ac.za
76
the line. The adsorption-activity correlation is evident and correlating this to the observations made in the lipid-
mediated system, it further suggests that the biological mechanism of haemozoin inhibition by quinoline-based
inhibitors, might also be via adsorption. The somewhat less-impressive value of r2 may be a consequence of
several other factors that contribute in the biological system, for example a compounds rate of metabolism and
rate of accumulation in the digestive vacuole.
The kinetics β-haematin formation in the presence of the 4-aminoquinoline- and quinoline methanol
antimalarial drugs, as well as the short-chain CQ analogue inhibitors, all conform to the proposed theoretical
kinetic model, which was developed in an attempt to explain the effect of each inhibitor on the formation of
β-haematin in the lipid-mediated system. The results reported in this chapter strongly support the hypothesis
of inhibitor adsorption to the β-haematin crystal surface, as the mode of action, at least in the case of quinoline-
containing inhibitors.
Stellenbosch University https://scholar.sun.ac.za
77
3.6 Conclusion
The previously modified Phiβ assay, used to investigate the inhibition of β-haematin formation in the lipid-
water interface system, was successfully optimized in this study. The assay was developed by primarily
introducing 24- and 96-well plates, as well recording multiple UV-visible measurements simultaneously. The
assay was validated as biologically-relevant by investigating the β-haematin inhibitory activity of clinically-
relevant antimalarial drugs. The newly-optimized assay reproduced results similar to what has previously been
recorded, however, in a faster turnaround time per compound, which led to kinetics studies investigating β-
haematin formation in the presence of these antimalarial drugs. The set of quinoline-based inhibitors was
increased by introducing a series of short-chain CQ analogues into the system, which had not been investigated
in this manner to date. Based on the results reported in this chapter, an increase in a quinoline-based inhibitor
concentration results in a decrease in the rate of β-haematin formation. This was observed at low
concentrations, while a decrease in the yield of β-haematin formation was observed when introducing higher
doses of each inhibitor. The kinetics data observed for the non-clinically relevant quinoline-based inhibitors,
provide great insight into understanding β-haematin inhibition, in adding to what has been reported to date in
this regard. Overall, the results reported in this chapter suggest that there might be a direct relationship between
the β-haematin inhibitory activity of a compound and its strength of adsorption to the growing face of β-
haematin crystals.
Stellenbosch University https://scholar.sun.ac.za
78
Chapter 4. The Effect of Non-Quinoline Inhibitors on the Formation of
β-Haematin at the Lipid-Water Interface
4.1 Introduction
Owing to the increase in parasite resistance to previously successful quinoline-based antimalarial drugs, such
as CQ, the development of novel chemotherapeutic agents is of high imporatnce.161 This is well known to date
and has been a great motivation behind understanding the mechanism of antimalarial drug action to improve
rational drug design to overcome quinoline resistance. The kinetics results obtained for the inhibition of β-
haematin formation by quinoline-based β-haematin inhibitors, reported in the previous chapter and based on
previous studies,40 has provided significant insight regarding the possible mechanism of action of an inhibitor
on the formation of β-haematin crystals. Based on these results, a complimentary study has been carried out in
order to investigate the effect of non-quinoline-based β-haematin inhibitors on the formation of β-haematin.
This is the first study carried out in order to investigate the effect of benzamide non-quinoline β-haematin
inhibitors in the biologically-relevant lipid-water interface system, using monopalmitoyl-rac-glycerol (MPG)
to mediate the formation of β-haematin. Introducing these compounds into the system and comparing their
effect on the kinetics of β-haematin formation relative to the quinoline-based β-haematin inhibitors extends
the set of compounds for which the theoretical kinetic model developed previously, may be applied. For each
compound, activity and kinetics experiments have been carried out.
This chapter provides a detailed discussion of the experimental methods followed and results found, regarding
both the activity- and kinetics studies for a series of benzamide β-haematin inhibitors.
Stellenbosch University https://scholar.sun.ac.za
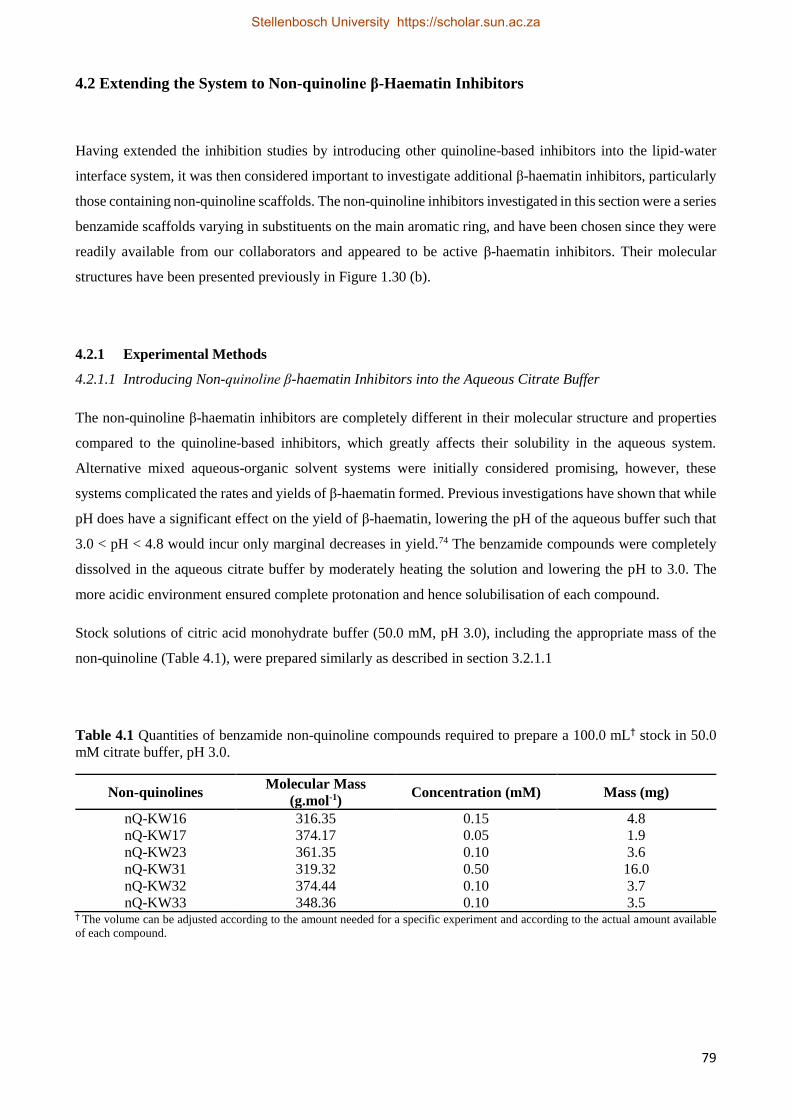
79
4.2 Extending the System to Non-quinoline β-Haematin Inhibitors
Having extended the inhibition studies by introducing other quinoline-based inhibitors into the lipid-water
interface system, it was then considered important to investigate additional β-haematin inhibitors, particularly
those containing non-quinoline scaffolds. The non-quinoline inhibitors investigated in this section were a series
benzamide scaffolds varying in substituents on the main aromatic ring, and have been chosen since they were
readily available from our collaborators and appeared to be active β-haematin inhibitors. Their molecular
structures have been presented previously in Figure 1.30 (b).
4.2.1 Experimental Methods
4.2.1.1 Introducing Non-quinoline β-haematin Inhibitors into the Aqueous Citrate Buffer
The non-quinoline β-haematin inhibitors are completely different in their molecular structure and properties
compared to the quinoline-based inhibitors, which greatly affects their solubility in the aqueous system.
Alternative mixed aqueous-organic solvent systems were initially considered promising, however, these
systems complicated the rates and yields of β-haematin formed. Previous investigations have shown that while
pH does have a significant effect on the yield of β-haematin, lowering the pH of the aqueous buffer such that
3.0 < pH < 4.8 would incur only marginal decreases in yield.74 The benzamide compounds were completely
dissolved in the aqueous citrate buffer by moderately heating the solution and lowering the pH to 3.0. The
more acidic environment ensured complete protonation and hence solubilisation of each compound.
Stock solutions of citric acid monohydrate buffer (50.0 mM, pH 3.0), including the appropriate mass of the
non-quinoline (Table 4.1), were prepared similarly as described in section 3.2.1.1
Table 4.1 Quantities of benzamide non-quinoline compounds required to prepare a 100.0 mL† stock in 50.0
mM citrate buffer, pH 3.0.
Non-quinolines Molecular Mass
(g.mol-1) Concentration (mM) Mass (mg)
nQ-KW16 316.35 0.15 4.8
nQ-KW17 374.17 0.05 1.9
nQ-KW23 361.35 0.10 3.6
nQ-KW31 319.32 0.50 16.0
nQ-KW32 374.44 0.10 3.7
nQ-KW33 348.36 0.10 3.5 † The volume can be adjusted according to the amount needed for a specific experiment and according to the actual amount available
of each compound.
Stellenbosch University https://scholar.sun.ac.za
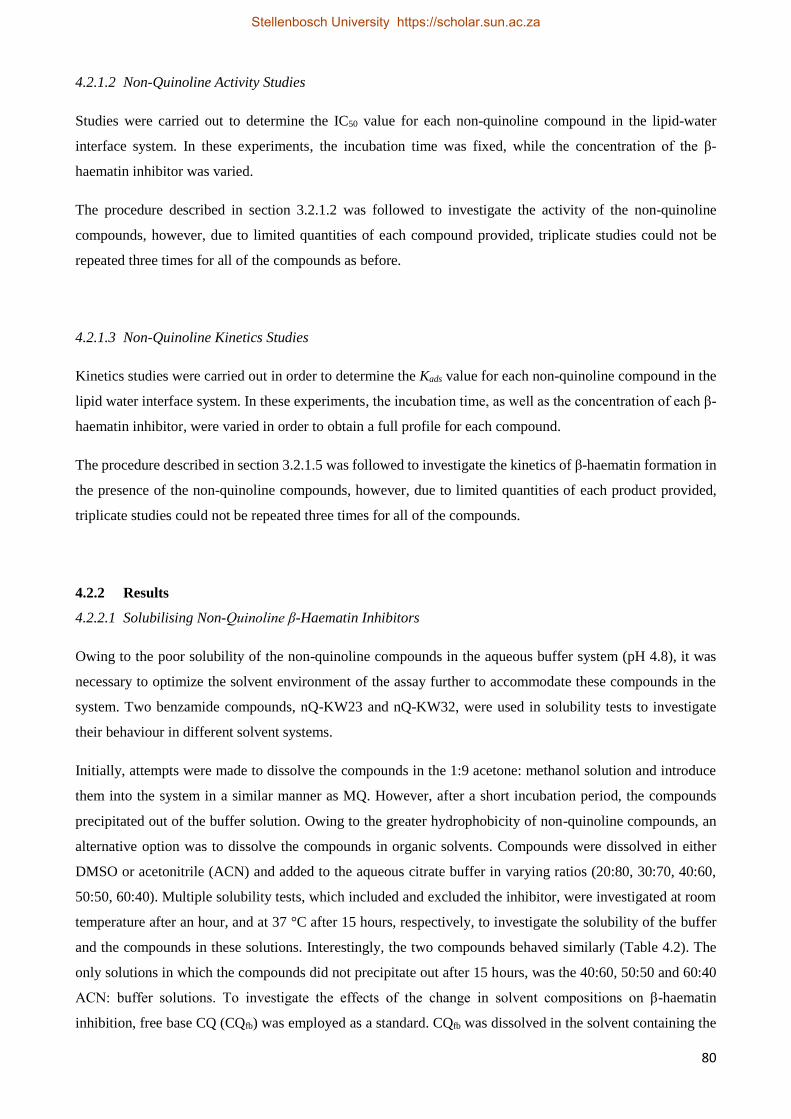
80
4.2.1.2 Non-Quinoline Activity Studies
Studies were carried out to determine the IC50 value for each non-quinoline compound in the lipid-water
interface system. In these experiments, the incubation time was fixed, while the concentration of the β-
haematin inhibitor was varied.
The procedure described in section 3.2.1.2 was followed to investigate the activity of the non-quinoline
compounds, however, due to limited quantities of each compound provided, triplicate studies could not be
repeated three times for all of the compounds as before.
4.2.1.3 Non-Quinoline Kinetics Studies
Kinetics studies were carried out in order to determine the Kads value for each non-quinoline compound in the
lipid water interface system. In these experiments, the incubation time, as well as the concentration of each β-
haematin inhibitor, were varied in order to obtain a full profile for each compound.
The procedure described in section 3.2.1.5 was followed to investigate the kinetics of β-haematin formation in
the presence of the non-quinoline compounds, however, due to limited quantities of each product provided,
triplicate studies could not be repeated three times for all of the compounds.
4.2.2 Results
4.2.2.1 Solubilising Non-Quinoline β-Haematin Inhibitors
Owing to the poor solubility of the non-quinoline compounds in the aqueous buffer system (pH 4.8), it was
necessary to optimize the solvent environment of the assay further to accommodate these compounds in the
system. Two benzamide compounds, nQ-KW23 and nQ-KW32, were used in solubility tests to investigate
their behaviour in different solvent systems.
Initially, attempts were made to dissolve the compounds in the 1:9 acetone: methanol solution and introduce
them into the system in a similar manner as MQ. However, after a short incubation period, the compounds
precipitated out of the buffer solution. Owing to the greater hydrophobicity of non-quinoline compounds, an
alternative option was to dissolve the compounds in organic solvents. Compounds were dissolved in either
DMSO or acetonitrile (ACN) and added to the aqueous citrate buffer in varying ratios (20:80, 30:70, 40:60,
50:50, 60:40). Multiple solubility tests, which included and excluded the inhibitor, were investigated at room
temperature after an hour, and at 37 °C after 15 hours, respectively, to investigate the solubility of the buffer
and the compounds in these solutions. Interestingly, the two compounds behaved similarly (Table 4.2). The
only solutions in which the compounds did not precipitate out after 15 hours, was the 40:60, 50:50 and 60:40
ACN: buffer solutions. To investigate the effects of the change in solvent compositions on β-haematin
inhibition, free base CQ (CQfb) was employed as a standard. CQfb was dissolved in the solvent containing the
Stellenbosch University https://scholar.sun.ac.za
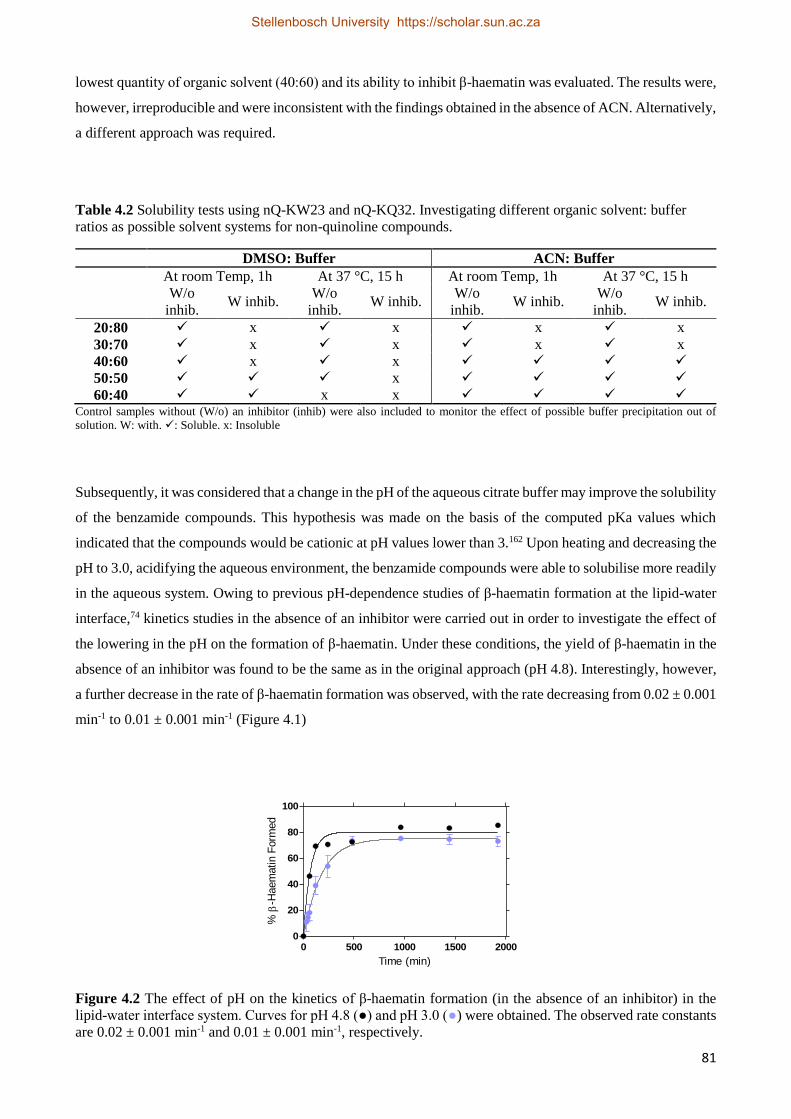
81
lowest quantity of organic solvent (40:60) and its ability to inhibit β-haematin was evaluated. The results were,
however, irreproducible and were inconsistent with the findings obtained in the absence of ACN. Alternatively,
a different approach was required.
Table 4.2 Solubility tests using nQ-KW23 and nQ-KQ32. Investigating different organic solvent: buffer
ratios as possible solvent systems for non-quinoline compounds.
DMSO: Buffer ACN: Buffer
At room Temp, 1h At 37 °C, 15 h At room Temp, 1h At 37 °C, 15 h
W/o
inhib. W inhib.
W/o
inhib. W inhib.
W/o
inhib. W inhib.
W/o
inhib. W inhib.
20:80 x x x x
30:70 x x x x
40:60 x x
50:50 x
60:40 x x Control samples without (W/o) an inhibitor (inhib) were also included to monitor the effect of possible buffer precipitation out of
solution. W: with. : Soluble. x: Insoluble
Subsequently, it was considered that a change in the pH of the aqueous citrate buffer may improve the solubility
of the benzamide compounds. This hypothesis was made on the basis of the computed pKa values which
indicated that the compounds would be cationic at pH values lower than 3.162 Upon heating and decreasing the
pH to 3.0, acidifying the aqueous environment, the benzamide compounds were able to solubilise more readily
in the aqueous system. Owing to previous pH-dependence studies of β-haematin formation at the lipid-water
interface,74 kinetics studies in the absence of an inhibitor were carried out in order to investigate the effect of
the lowering in the pH on the formation of β-haematin. Under these conditions, the yield of β-haematin in the
absence of an inhibitor was found to be the same as in the original approach (pH 4.8). Interestingly, however,
a further decrease in the rate of β-haematin formation was observed, with the rate decreasing from 0.02 ± 0.001
min-1 to 0.01 ± 0.001 min-1 (Figure 4.1)
0 500 1000 1500 20000
20
40
60
80
100
Time (min)
%
-Haem
atin F
orm
ed
Figure 4.2 The effect of pH on the kinetics of β-haematin formation (in the absence of an inhibitor) in the
lipid-water interface system. Curves for pH 4.8 (●) and pH 3.0 (●) were obtained. The observed rate constants
are 0.02 ± 0.001 min-1 and 0.01 ± 0.001 min-1, respectively.
Stellenbosch University https://scholar.sun.ac.za
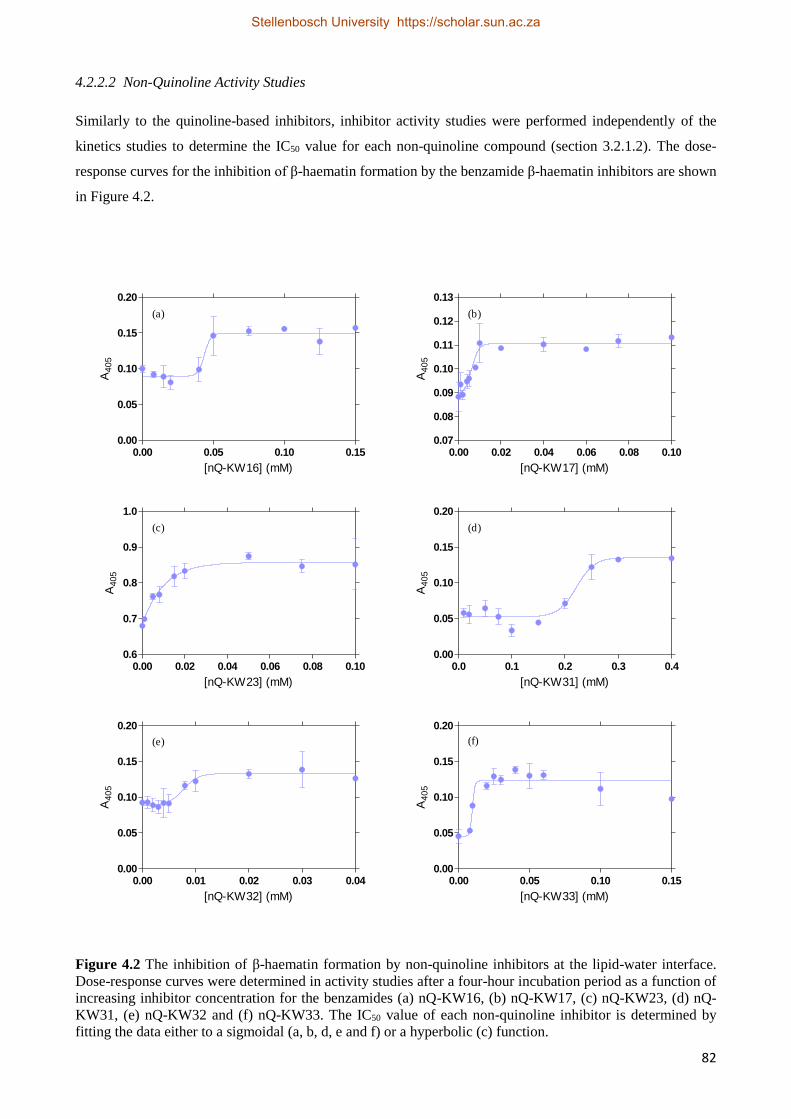
82
4.2.2.2 Non-Quinoline Activity Studies
Similarly to the quinoline-based inhibitors, inhibitor activity studies were performed independently of the
kinetics studies to determine the IC50 value for each non-quinoline compound (section 3.2.1.2). The dose-
response curves for the inhibition of β-haematin formation by the benzamide β-haematin inhibitors are shown
in Figure 4.2.
0.00 0.05 0.10 0.150.00
0.05
0.10
0.15
0.20
[nQ-KW16] (mM)
A4
05
0.00 0.02 0.04 0.06 0.08 0.100.07
0.08
0.09
0.10
0.11
0.12
0.13
[nQ-KW17] (mM)
A4
05
0.00 0.02 0.04 0.06 0.08 0.100.6
0.7
0.8
0.9
1.0
[nQ-KW23] (mM)
A405
0.0 0.1 0.2 0.3 0.40.00
0.05
0.10
0.15
0.20
[nQ-KW31] (mM)
A4
05
0.00 0.01 0.02 0.03 0.040.00
0.05
0.10
0.15
0.20
[nQ-KW32] (mM)
A4
05
0.00 0.05 0.10 0.150.00
0.05
0.10
0.15
0.20
[nQ-KW33] (mM)
A4
05
(a) (b)
(c) (d)
(e) (f)
Figure 4.2 The inhibition of β-haematin formation by non-quinoline inhibitors at the lipid-water interface.
Dose-response curves were determined in activity studies after a four-hour incubation period as a function of
increasing inhibitor concentration for the benzamides (a) nQ-KW16, (b) nQ-KW17, (c) nQ-KW23, (d) nQ-
KW31, (e) nQ-KW32 and (f) nQ-KW33. The IC50 value of each non-quinoline inhibitor is determined by
fitting the data either to a sigmoidal (a, b, d, e and f) or a hyperbolic (c) function.
Stellenbosch University https://scholar.sun.ac.za
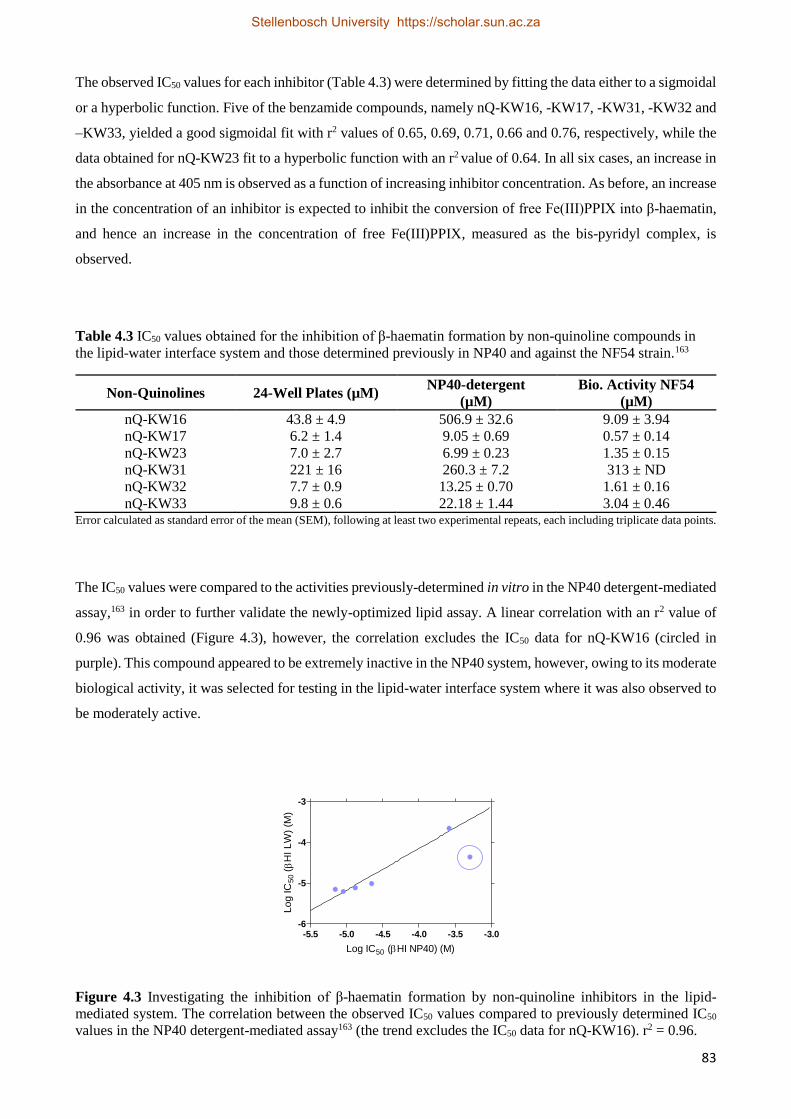
83
The observed IC50 values for each inhibitor (Table 4.3) were determined by fitting the data either to a sigmoidal
or a hyperbolic function. Five of the benzamide compounds, namely nQ-KW16, -KW17, -KW31, -KW32 and
–KW33, yielded a good sigmoidal fit with r2 values of 0.65, 0.69, 0.71, 0.66 and 0.76, respectively, while the
data obtained for nQ-KW23 fit to a hyperbolic function with an r2 value of 0.64. In all six cases, an increase in
the absorbance at 405 nm is observed as a function of increasing inhibitor concentration. As before, an increase
in the concentration of an inhibitor is expected to inhibit the conversion of free Fe(III)PPIX into β-haematin,
and hence an increase in the concentration of free Fe(III)PPIX, measured as the bis-pyridyl complex, is
observed.
Table 4.3 IC50 values obtained for the inhibition of β-haematin formation by non-quinoline compounds in
the lipid-water interface system and those determined previously in NP40 and against the NF54 strain.163
Non-Quinolines 24-Well Plates (µM) NP40-detergent
(µM)
Bio. Activity NF54
(µM)
nQ-KW16 43.8 ± 4.9 506.9 ± 32.6 9.09 ± 3.94
nQ-KW17 6.2 ± 1.4 9.05 ± 0.69 0.57 ± 0.14
nQ-KW23 7.0 ± 2.7 6.99 ± 0.23 1.35 ± 0.15
nQ-KW31 221 ± 16 260.3 ± 7.2 313 ± ND
nQ-KW32 7.7 ± 0.9 13.25 ± 0.70 1.61 ± 0.16
nQ-KW33 9.8 ± 0.6 22.18 ± 1.44 3.04 ± 0.46 Error calculated as standard error of the mean (SEM), following at least two experimental repeats, each including triplicate data points.
The IC50 values were compared to the activities previously-determined in vitro in the NP40 detergent-mediated
assay,163 in order to further validate the newly-optimized lipid assay. A linear correlation with an r2 value of
0.96 was obtained (Figure 4.3), however, the correlation excludes the IC50 data for nQ-KW16 (circled in
purple). This compound appeared to be extremely inactive in the NP40 system, however, owing to its moderate
biological activity, it was selected for testing in the lipid-water interface system where it was also observed to
be moderately active.
-5.5 -5.0 -4.5 -4.0 -3.5 -3.0-6
-5
-4
-3
Log IC50 (HI NP40) (M)
Lo
g IC
50
( H
I L
W)
(M)
Figure 4.3 Investigating the inhibition of β-haematin formation by non-quinoline inhibitors in the lipid-
mediated system. The correlation between the observed IC50 values compared to previously determined IC50
values in the NP40 detergent-mediated assay163 (the trend excludes the IC50 data for nQ-KW16). r2 = 0.96.
Stellenbosch University https://scholar.sun.ac.za
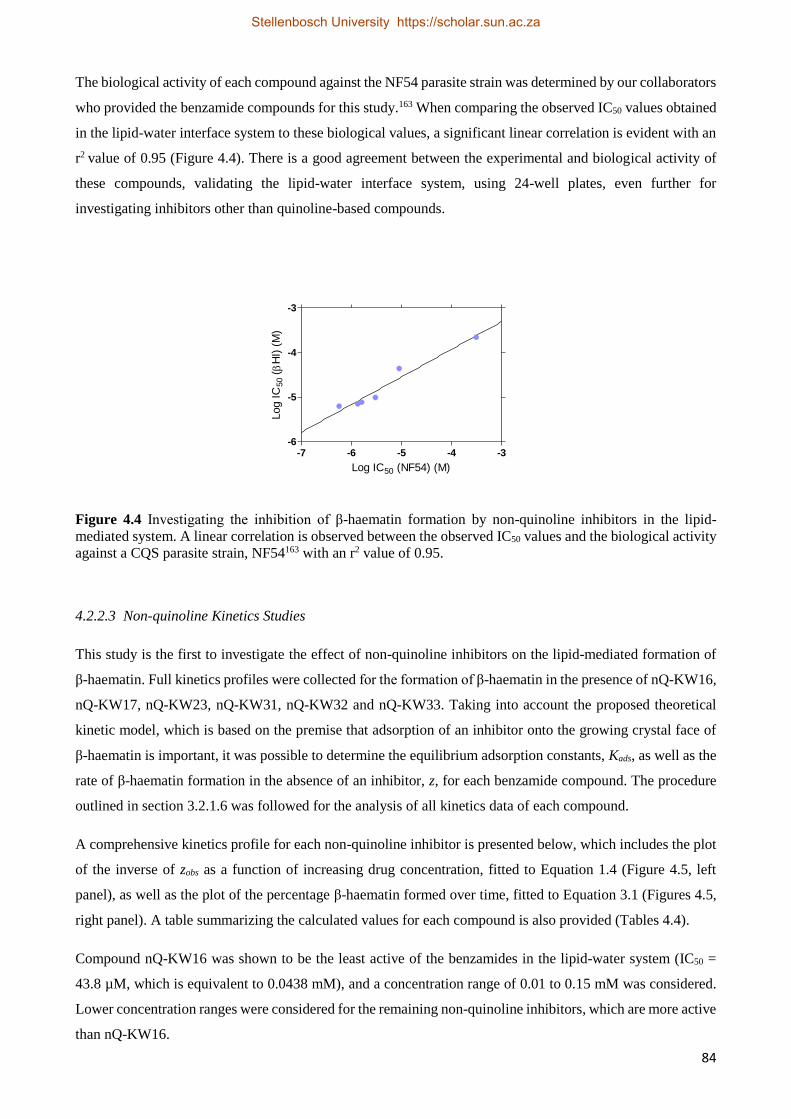
84
The biological activity of each compound against the NF54 parasite strain was determined by our collaborators
who provided the benzamide compounds for this study.163 When comparing the observed IC50 values obtained
in the lipid-water interface system to these biological values, a significant linear correlation is evident with an
r2 value of 0.95 (Figure 4.4). There is a good agreement between the experimental and biological activity of
these compounds, validating the lipid-water interface system, using 24-well plates, even further for
investigating inhibitors other than quinoline-based compounds.
-7 -6 -5 -4 -3-6
-5
-4
-3
Log IC50 (NF54) (M)
Log I
C50
( H
I)(M
)
Figure 4.4 Investigating the inhibition of β-haematin formation by non-quinoline inhibitors in the lipid-
mediated system. A linear correlation is observed between the observed IC50 values and the biological activity
against a CQS parasite strain, NF54163 with an r2 value of 0.95.
4.2.2.3 Non-quinoline Kinetics Studies
This study is the first to investigate the effect of non-quinoline inhibitors on the lipid-mediated formation of
β-haematin. Full kinetics profiles were collected for the formation of β-haematin in the presence of nQ-KW16,
nQ-KW17, nQ-KW23, nQ-KW31, nQ-KW32 and nQ-KW33. Taking into account the proposed theoretical
kinetic model, which is based on the premise that adsorption of an inhibitor onto the growing crystal face of
β-haematin is important, it was possible to determine the equilibrium adsorption constants, Kads, as well as the
rate of β-haematin formation in the absence of an inhibitor, z, for each benzamide compound. The procedure
outlined in section 3.2.1.6 was followed for the analysis of all kinetics data of each compound.
A comprehensive kinetics profile for each non-quinoline inhibitor is presented below, which includes the plot
of the inverse of zobs as a function of increasing drug concentration, fitted to Equation 1.4 (Figure 4.5, left
panel), as well as the plot of the percentage β-haematin formed over time, fitted to Equation 3.1 (Figures 4.5,
right panel). A table summarizing the calculated values for each compound is also provided (Tables 4.4).
Compound nQ-KW16 was shown to be the least active of the benzamides in the lipid-water system (IC50 =
43.8 µM, which is equivalent to 0.0438 mM), and a concentration range of 0.01 to 0.15 mM was considered.
Lower concentration ranges were considered for the remaining non-quinoline inhibitors, which are more active
than nQ-KW16.
Stellenbosch University https://scholar.sun.ac.za
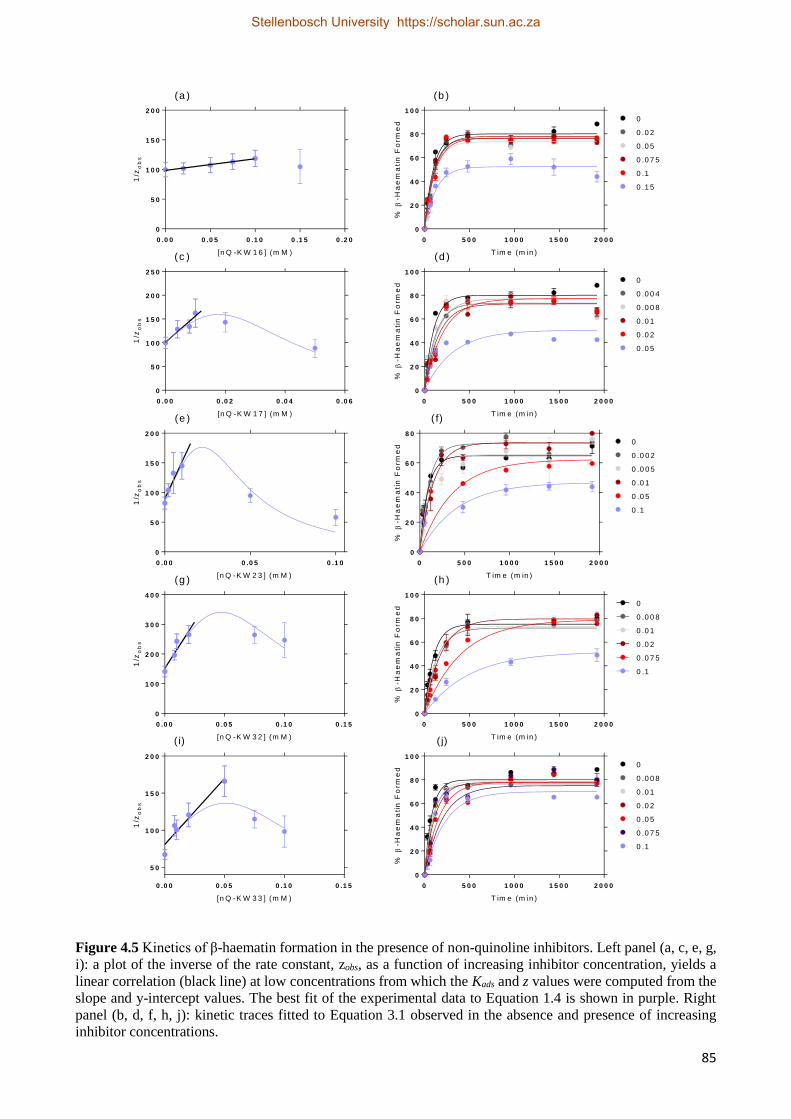
85
0 .0 0 0 .0 5 0 .1 0 0 .1 5 0 .2 0
0
5 0
1 0 0
1 5 0
2 0 0
[n Q -K W 1 6 ] (m M )
1/z
ob
s
0 5 0 0 1 0 0 0 1 5 0 0 2 0 0 0
0
2 0
4 0
6 0
8 0
1 0 0
0
0 .0 2
0 .0 5
0 .0 7 5
0 .1
0 .1 5
T im e (m in )
%
-Ha
em
ati
n F
orm
ed
0 .0 0 0 .0 2 0 .0 4 0 .0 6
0
5 0
1 0 0
1 5 0
2 0 0
2 5 0
[n Q -K W 1 7 ] (m M )
1/z
ob
s
0 5 0 0 1 0 0 0 1 5 0 0 2 0 0 0
0
2 0
4 0
6 0
8 0
1 0 0
0
0 .0 0 4
0 .0 0 8
0 .0 1
0 .0 2
0 .0 5
T im e (m in )
%
-Ha
em
ati
n F
orm
ed
0 .0 0 0 .0 5 0 .1 0
0
5 0
1 0 0
1 5 0
2 0 0
[n Q -K W 2 3 ] (m M )
1/z
ob
s
0 5 0 0 1 0 0 0 1 5 0 0 2 0 0 0
0
2 0
4 0
6 0
8 0
0
0 .0 0 2
0 .0 0 5
0 .0 1
0 .0 5
0 .1
T im e (m in )
%
-Ha
em
ati
n F
orm
ed
0 .0 0 0 .0 5 0 .1 0 0 .1 5
0
1 0 0
2 0 0
3 0 0
4 0 0
[n Q -K W 3 2 ] (m M )
1/z
ob
s
0 5 0 0 1 0 0 0 1 5 0 0 2 0 0 0
0
2 0
4 0
6 0
8 0
1 0 0
0
0 .0 0 8
0 .0 1
0 .0 2
0 .0 7 5
0 .1
T im e (m in )
%
-Ha
em
ati
n F
orm
ed
0 .0 0 0 .0 5 0 .1 0 0 .1 5
5 0
1 0 0
1 5 0
2 0 0
[n Q -K W 3 3 ] (m M )
1/z
ob
s
0 5 0 0 1 0 0 0 1 5 0 0 2 0 0 0
0
2 0
4 0
6 0
8 0
1 0 0
0 .1
0 .0 7 5
0 .0 5
0 .0 2
0 .0 1
0 .0 0 8
0
T im e (m in )
%
-Ha
em
ati
n F
orm
ed
(a ) (b )
(c ) (d )
(e ) ( f)
(g ) (h )
( i) ( j)
Figure 4.5 Kinetics of β-haematin formation in the presence of non-quinoline inhibitors. Left panel (a, c, e, g,
i): a plot of the inverse of the rate constant, zobs, as a function of increasing inhibitor concentration, yields a
linear correlation (black line) at low concentrations from which the Kads and z values were computed from the
slope and y-intercept values. The best fit of the experimental data to Equation 1.4 is shown in purple. Right
panel (b, d, f, h, j): kinetic traces fitted to Equation 3.1 observed in the absence and presence of increasing
inhibitor concentrations.
Stellenbosch University https://scholar.sun.ac.za
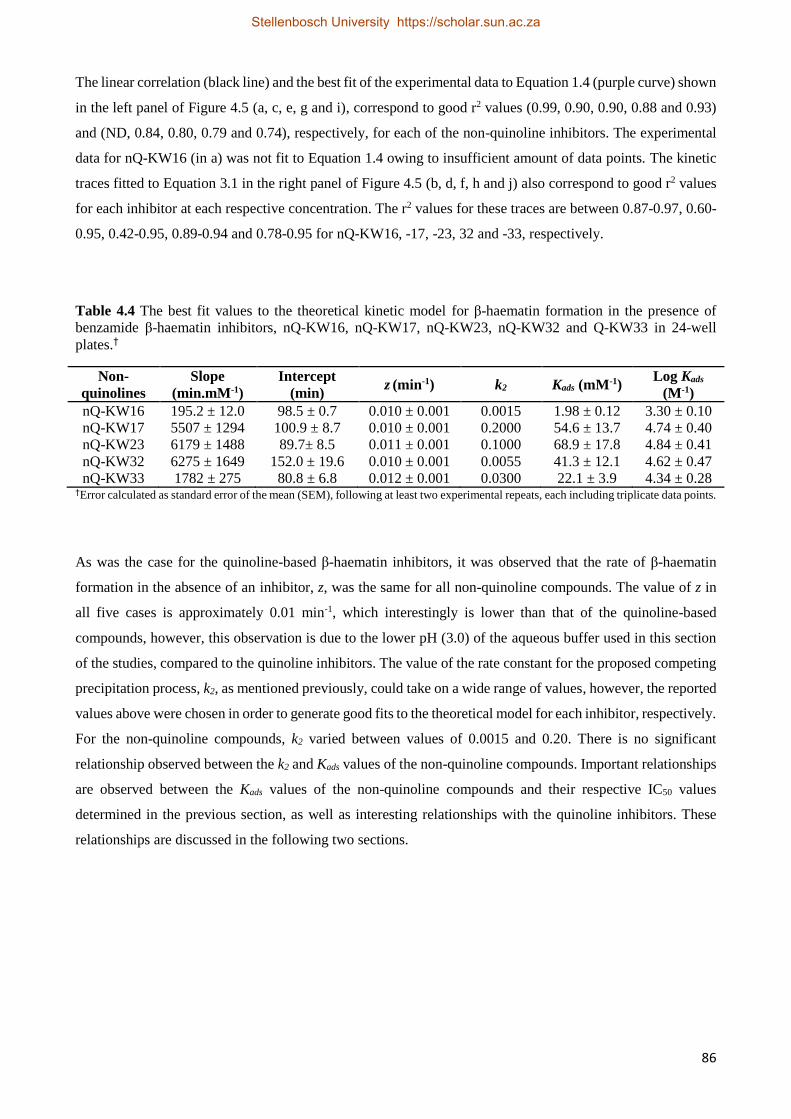
86
The linear correlation (black line) and the best fit of the experimental data to Equation 1.4 (purple curve) shown
in the left panel of Figure 4.5 (a, c, e, g and i), correspond to good r2 values (0.99, 0.90, 0.90, 0.88 and 0.93)
and (ND, 0.84, 0.80, 0.79 and 0.74), respectively, for each of the non-quinoline inhibitors. The experimental
data for nQ-KW16 (in a) was not fit to Equation 1.4 owing to insufficient amount of data points. The kinetic
traces fitted to Equation 3.1 in the right panel of Figure 4.5 (b, d, f, h and j) also correspond to good r2 values
for each inhibitor at each respective concentration. The r2 values for these traces are between 0.87-0.97, 0.60-
0.95, 0.42-0.95, 0.89-0.94 and 0.78-0.95 for nQ-KW16, -17, -23, 32 and -33, respectively.
Table 4.4 The best fit values to the theoretical kinetic model for β-haematin formation in the presence of
benzamide β-haematin inhibitors, nQ-KW16, nQ-KW17, nQ-KW23, nQ-KW32 and Q-KW33 in 24-well
plates.†
Non-
quinolines
Slope
(min.mM-1)
Intercept
(min) z (min-1) k2 Kads (mM-1)
Log Kads
(M-1)
nQ-KW16 195.2 ± 12.0 98.5 ± 0.7 0.010 ± 0.001 0.0015 1.98 ± 0.12 3.30 ± 0.10
nQ-KW17 5507 ± 1294 100.9 ± 8.7 0.010 ± 0.001 0.2000 54.6 ± 13.7 4.74 ± 0.40
nQ-KW23 6179 ± 1488 89.7± 8.5 0.011 ± 0.001 0.1000 68.9 ± 17.8 4.84 ± 0.41
nQ-KW32 6275 ± 1649 152.0 ± 19.6 0.010 ± 0.001 0.0055 41.3 ± 12.1 4.62 ± 0.47
nQ-KW33 1782 ± 275 80.8 ± 6.8 0.012 ± 0.001 0.0300 22.1 ± 3.9 4.34 ± 0.28 †Error calculated as standard error of the mean (SEM), following at least two experimental repeats, each including triplicate data points.
As was the case for the quinoline-based β-haematin inhibitors, it was observed that the rate of β-haematin
formation in the absence of an inhibitor, z, was the same for all non-quinoline compounds. The value of z in
all five cases is approximately 0.01 min-1, which interestingly is lower than that of the quinoline-based
compounds, however, this observation is due to the lower pH (3.0) of the aqueous buffer used in this section
of the studies, compared to the quinoline inhibitors. The value of the rate constant for the proposed competing
precipitation process, k2, as mentioned previously, could take on a wide range of values, however, the reported
values above were chosen in order to generate good fits to the theoretical model for each inhibitor, respectively.
For the non-quinoline compounds, k2 varied between values of 0.0015 and 0.20. There is no significant
relationship observed between the k2 and Kads values of the non-quinoline compounds. Important relationships
are observed between the Kads values of the non-quinoline compounds and their respective IC50 values
determined in the previous section, as well as interesting relationships with the quinoline inhibitors. These
relationships are discussed in the following two sections.
Stellenbosch University https://scholar.sun.ac.za
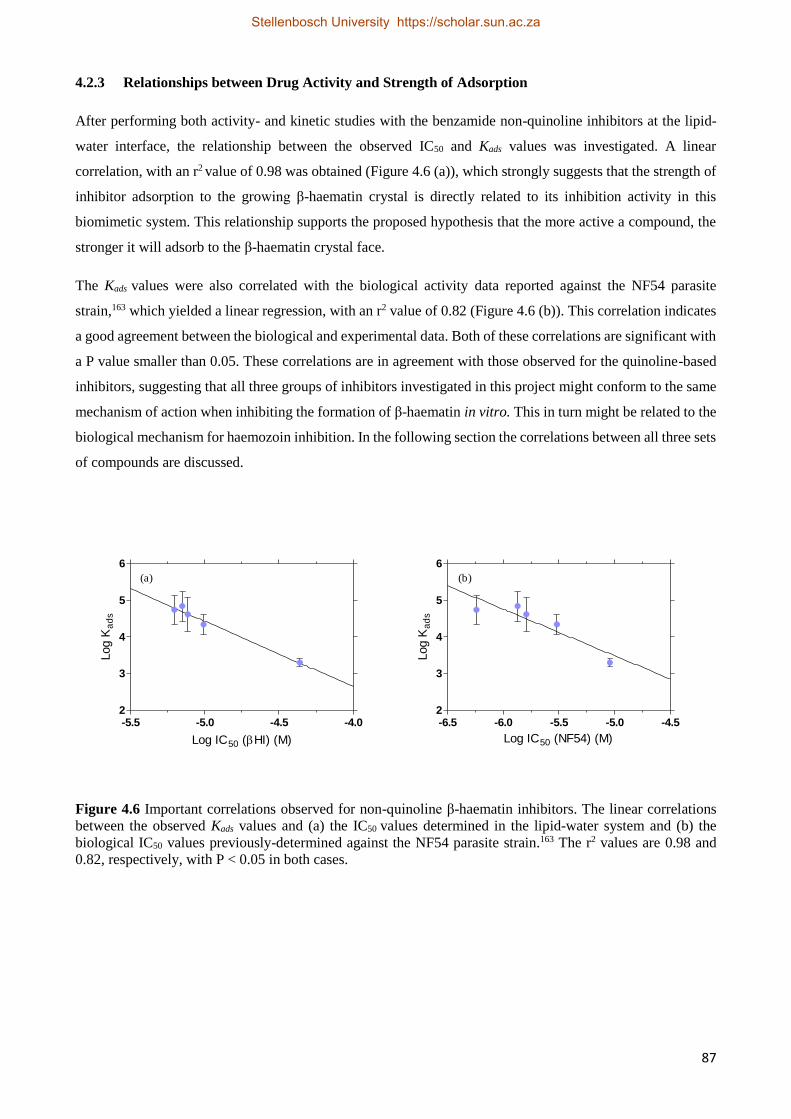
87
4.2.3 Relationships between Drug Activity and Strength of Adsorption
After performing both activity- and kinetic studies with the benzamide non-quinoline inhibitors at the lipid-
water interface, the relationship between the observed IC50 and Kads values was investigated. A linear
correlation, with an r2 value of 0.98 was obtained (Figure 4.6 (a)), which strongly suggests that the strength of
inhibitor adsorption to the growing β-haematin crystal is directly related to its inhibition activity in this
biomimetic system. This relationship supports the proposed hypothesis that the more active a compound, the
stronger it will adsorb to the β-haematin crystal face.
The Kads values were also correlated with the biological activity data reported against the NF54 parasite
strain,163 which yielded a linear regression, with an r2 value of 0.82 (Figure 4.6 (b)). This correlation indicates
a good agreement between the biological and experimental data. Both of these correlations are significant with
a P value smaller than 0.05. These correlations are in agreement with those observed for the quinoline-based
inhibitors, suggesting that all three groups of inhibitors investigated in this project might conform to the same
mechanism of action when inhibiting the formation of β-haematin in vitro. This in turn might be related to the
biological mechanism for haemozoin inhibition. In the following section the correlations between all three sets
of compounds are discussed.
-5.5 -5.0 -4.5 -4.02
3
4
5
6
Log IC50 (HI) (M)
Log K
ad
s
-6.5 -6.0 -5.5 -5.0 -4.52
3
4
5
6
Log IC50 (NF54) (M)
Log K
ad
s
(a) (b)
Figure 4.6 Important correlations observed for non-quinoline β-haematin inhibitors. The linear correlations
between the observed Kads values and (a) the IC50 values determined in the lipid-water system and (b) the
biological IC50 values previously-determined against the NF54 parasite strain.163 The r2 values are 0.98 and
0.82, respectively, with P < 0.05 in both cases.
Stellenbosch University https://scholar.sun.ac.za
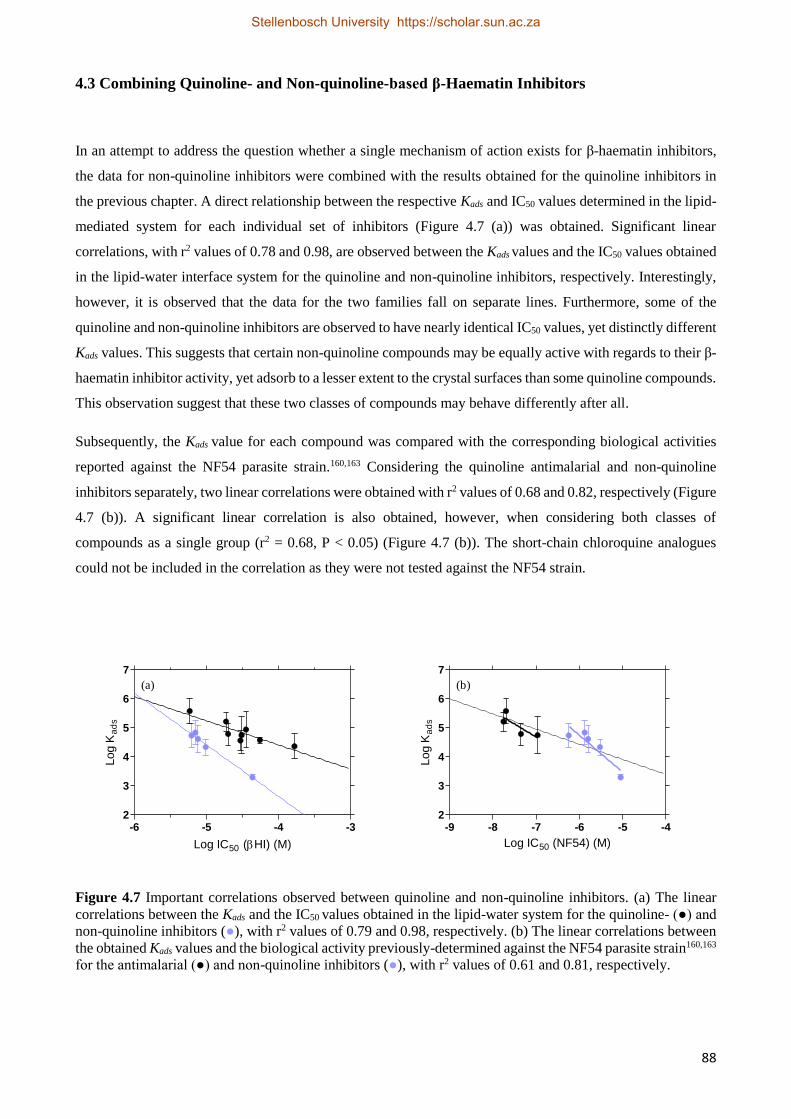
88
4.3 Combining Quinoline- and Non-quinoline-based β-Haematin Inhibitors
In an attempt to address the question whether a single mechanism of action exists for β-haematin inhibitors,
the data for non-quinoline inhibitors were combined with the results obtained for the quinoline inhibitors in
the previous chapter. A direct relationship between the respective Kads and IC50 values determined in the lipid-
mediated system for each individual set of inhibitors (Figure 4.7 (a)) was obtained. Significant linear
correlations, with r2 values of 0.78 and 0.98, are observed between the Kads values and the IC50 values obtained
in the lipid-water interface system for the quinoline and non-quinoline inhibitors, respectively. Interestingly,
however, it is observed that the data for the two families fall on separate lines. Furthermore, some of the
quinoline and non-quinoline inhibitors are observed to have nearly identical IC50 values, yet distinctly different
Kads values. This suggests that certain non-quinoline compounds may be equally active with regards to their β-
haematin inhibitor activity, yet adsorb to a lesser extent to the crystal surfaces than some quinoline compounds.
This observation suggest that these two classes of compounds may behave differently after all.
Subsequently, the Kads value for each compound was compared with the corresponding biological activities
reported against the NF54 parasite strain.160,163 Considering the quinoline antimalarial and non-quinoline
inhibitors separately, two linear correlations were obtained with r2 values of 0.68 and 0.82, respectively (Figure
4.7 (b)). A significant linear correlation is also obtained, however, when considering both classes of
compounds as a single group (r2 = 0.68, P < 0.05) (Figure 4.7 (b)). The short-chain chloroquine analogues
could not be included in the correlation as they were not tested against the NF54 strain.
-6 -5 -4 -32
3
4
5
6
7
Log IC50 (HI) (M)
Log K
ad
s
-9 -8 -7 -6 -5 -42
3
4
5
6
7
Log IC50 (NF54) (M)
Log K
ad
s
(a) (b)
Figure 4.7 Important correlations observed between quinoline and non-quinoline inhibitors. (a) The linear
correlations between the Kads and the IC50 values obtained in the lipid-water system for the quinoline- (●) and
non-quinoline inhibitors (●), with r2 values of 0.79 and 0.98, respectively. (b) The linear correlations between
the obtained Kads values and the biological activity previously-determined against the NF54 parasite strain160,163
for the antimalarial (●) and non-quinoline inhibitors (●), with r2 values of 0.61 and 0.81, respectively.
Stellenbosch University https://scholar.sun.ac.za
89
When the antimalarial drugs and the non-quinoline inhibitors are considered as one group, no significant
correlation is observed between the β-haematin inhibitory activities and the NF54 biological activities for these
compounds (Figure 4.8). A relationship can, however, be observed when the two groups of compounds are
investigated separately.
-10 -8 -6 -4 -2-6
-5
-4
-3
Log IC50 (NF54) (M)
Log I
C5
0(
HI)
(M
)
Figure 4.8 No correlation is observed between the IC50 values obtained in the lipid-water interface system and
the NF54 biological activities160,163 for the antimalarial drugs (●) and the non-quinoline inhibitors (●), when
they are considered as a group of compounds.
Stellenbosch University https://scholar.sun.ac.za
90
4.4 Discussion
The aim of the work presented in this chapter is directly related to that of the work reported in the previous
chapter, namely to investigate the inhibition of β-haematin formation, however, by introducing non-quinoline
inhibitors into the lipid-water interface system. The introduction of other β-haematin inhibitors, which are
structurally different to those possessing a quinoline moiety, into the system was considered, since parasite
resistance to known quinoline-based antimalarial drugs has increased in recent years.161 Chemically-distinct
compounds possessing the same mode of action are attractive as new antimalarial drug candidates and are thus
investigated in this study. This is the first study carried out in order to investigate the effects of benzamide
inhibitors on the kinetics of β-haematin formation in the lipid-mediated system.
Owing to their poor solubility in aqueous medium, the newly-optimized assay was further modified to facilitate
the incorporation of the benzamide non-quinoline compounds into the aqueous citrate buffer system. To readily
solubilise the compounds in the aqueous solvent, the pH was lowered to 3. Hoang et al.74 has previously
determined the pH dependence of β-haematin formation in the lipid-water interface system and recorded a
bell-shaped curve, indicating maximum β-haematin production between pH 3 and 4. This aided the decision
to lower the pH, since optimal β-haematin formation was still expected, and subsequently confirmed, in the
biomimetic system.
In order to probe their relative β-haematin inhibitory activities, independent activity studies were carried out
with a series of benzamide β-haematin inhibitors in the newly-optimized system. Again, as previously noted
for the quinoline inhibitors, some of the inhibitors conform to a sigmoidal dose-response curve, while others
conform to a hyperbolic dose-response curve. In this case, only one benzamide compound, nQ-KW23, fits to
a hyperbolic function, suggesting that a four-hour incubation time may simply be too short of a time for nQ-
KW23 to inhibit β-haematin formation, compared to the other compounds for which a four-hour incubation
time may be enough or too long.
A significant relationship is observed between the IC50 values obtained in the current lipid-water interface
system and the NP40 detergent-mediated system (Figure 4.3), justifying the relevance of lipid-mediated
systems, which are biologically more relevant in which to investigate β-haematin inhibition. The obtained IC50
values show a good correlation to what has previously been reported against the CQS NF54 parasite strain
(Figure 4.4). This indicates that the lipid-mediated assay is an efficient system in which inhibitor activity can
be determined. The relative β-haematin inhibitory activity of each compound is similar in the three systems
(lipid-water, NP40 and biological); it was found that nQ-KW17 is the most active inhibitor, while nQ-KW31
is the least active inhibitor in the series. An IC50 value of 221 ± 16 µM was obtained for nQ-KW31 within the
lipid-water interface system, indicating the inactive nature of this compound as a β-haematin inhibitor. This is
in agreement to what has been reported for nQ-KW31 against the CQS NF54 parasite strain and in the NP40
detergent-mediated system. Interestingly, the IC50 value obtained for nQ-KW16 is not in agreement with what
was previously obtained in the NP40 detergent-mediated system. It was found that the inhibitor is moderately
Stellenbosch University https://scholar.sun.ac.za
91
active in the lipid-mediated system, however, it was reported to be completely inactive in the NP-40 detergent-
mediated system. This suggests that the lipid-mediated system is ultimately a better biomimetic system, when
comparing the activity to what has been obtained against the NF54 parasite strain.
Furthermore, kinetics studies were carried out in the lipid-mediated system in order to investigate the effect of
each non-quinoline compound on the formation of β-haematin. A decrease in the rate of β-haematin formation
is observed as the inhibitor concentration was systematically increased. This observation may be accounted
for by the reversible adsorption process of the inhibitor to the surface of β-haematin crystals, decreasing the
rate of formation, rather than inhibiting it completely. A noticeable decrease in the yield of β-haematin
formation is observed at high inhibitor concentrations for nQ-KW16, nQ-KW23 and nQ-KW32. The
noticeable decrease in the yield of β-haematin is not observed for the other inhibitors, suggesting that a higher
inhibitor concentration might be required in order for the proposed precipitation of the inhibitor-haematin
complex to become evident. The observed decrease in the percentage yield of β-haematin formation may be
accounted for by a Fe(III)PPIX-inhibitor complex forming in solution.117,118 This may suggest that the
inhibitors which show this noticeable decrease in the yield may form precipitation complexes with the free
haematin more rapidly than other inhibitors. Upon fitting the inverse of the observed rate constants as a
function of increasing inhibitor concentration, the respective Kads and z values are determined for each
inhibitor. The rate constant in the absence of an inhibitor is identical for all the non-quinoline inhibitors, with
z values equal to ≈ 0.01 min-1, which is feasible, since z is independent of the inhibitor under similar system
conditions. The rate constant is, however, lower in the pH 3 aqueous citrate buffer compared to the pH 4.8
buffer system, in which the quinoline-based inhibitors were investigated
The experimental kinetics data recorded in this study conform to the proposed theoretical kinetic model,
suggesting that the model is valid for inhibitors other than only quinoline-based inhibitors. Similar to the
quinoline inhibitors, the Kads and z values were determined from the linear regression analysis, and used for
the best fit to the model. Accurate values for k2, the rate constant for the competing process that results in the
precipitation of haematin, were not investigated in the current study, since this process is still poorly
understood. The k2 values were thus allowed to refine freely to generate the best fit of the experimental data to
the model. The k2 value can generally accommodate a range of values and is the only parameter that was
allowed to vary in order to generate good r2 fits. In the current study, k2 was varied in a broad range between
0.0015 and 0.20 for the benzamide non-quinoline inhibitors.
A significant linear correlation, with an r2 value of 0.98 (P value < 0.01) is observed between the adsorption
constants (Kads) and the β-haematin inhibitory activities (IC50) obtained for the non-quinoline β-haematin
inhibitors (Figure 4.6 (a)). It was found that nQ-KW23 has the largest Kads value of the all the non-quinoline
inhibitors, however, it was expected that nQ-KW17, the most active inhibitor, to have the largest adsorption
constant. These respective Kads values are close to each other in magnitude (68.9 ± 17.8 compared to 54.6 ±
13.7 mM-1), however, the log Kads values only deviate by 0.1 log units from each other, resulting in the good
linear correlation. nQ-KW16, which was found to be the least active benzamide inhibitor in the lipid-mediated
system, obtaining an IC50 value seven times larger than that of nQ-KW17, was found to have the weakest
Stellenbosch University https://scholar.sun.ac.za
92
adsorption constant, Kads = 1.98 ± 0.12 mM-1. Similar to the quinoline inhibitors, this significant correlation
suggests that the strength at which this group of non-quinoline inhibitors may adsorb to the surface of β-
haematin crystals, inhibiting further growth, is associated with its β-haematin inhibitory activity, in the lipid-
water interface system.
Another significant linear correlation, with an r2 value of 0.82 (P value < 0.04) is observed when considering
the relationship between the Kads values obtained from the lipid-mediated system and previously-determined
biological β-haematin inhibitory activities reported against the CQS NF54 parasite strain. Subsequently, the
adsorption-activity correlation for this group of non-quinoline compounds is evident and correlating this to the
observations made in the lipid-mediated system, it further suggests that the biological mechanism of
haemozoin inhibition by non-quinoline-based inhibitors, might also be via adsorption.
Irrespective of the individual correlation observed between the Kads and the IC50 values of each set of quinoline-
and non-quinoline-based β-haematin inhibitors, it is important to consider the two groups of β-haematin
inhibitors together. Figure 4.7 shows two plots in which the following correlations were investigated: the Kads
and IC50 values obtained in the lipid-mediated system for both sets of quinoline-and non-quinoline-based
inhibitors (a) and the Kads values obtained in the lipid-mediated system against the biological CQS NF54
parasite strain for the antimalarial drugs and non-quinoline-based inhibitors (b). The IC50 values obtained in
the lipid-mediated system against the biological CQS NF54 parasite strain for the antimalarial drugs and non-
quinoline-based inhibitors Figure 4.8.
Even though the linear trends for each individual set of inhibitors are good, an important observation is made
regarding the β-haematin inhibition mechanism of action by these compounds. Three fundamentally important
observations are; firstly, there is indeed a significant correlation between the obtained Kads values and the
biological activities determined against the CQS NF54 parasite strain, when considering the antimalarial drugs
and non-quinoline-based inhibitors together (Figure 4.7 (b), r2 value of 0.68). This suggests that the inhibitor
concentration required to inhibit haemozoin formation by 50%, is dependent on the specific strength of
adsorption of a specific inhibitor to a haemozoin crystal surface. Secondly, when considering the plot of the
observed IC50 values against the biological activities determined against the CQS NF54 parasite strain for the
same group of inhibitors, the antimalarial drugs and non-quinoline-based inhibitors, no correlation is observed
(Figure 4.8) There is, however, separate correlations for the two individual inhibitor families, however, the
data points are completely random when they are considered together. These observations are contradictory
towards each other, since both the β-haematin inhibitory activity and the Kads values were determined in the
same biologically relevant, lipid-mediated system. Thirdly, it is interesting to notice that there are compounds
which have virtually the same β-haematin inhibitory activity, however, their respective Kads values differ
greatly from each other (Figure 4.7 (a)). As an example, AQ and nQ-KW17 both possess similar log IC50
values; -5.23 and -5.21, respectively, however, their Kads values differ more than seven-fold; 384 ± 105 mM-1
and 54.6 ± 13.7 mM-1, respectively. Similarly, the Kads value for Q-I is nearly forty-five-fold larger than that
of nQ-KW16, however, they were found to have similar β-haematin inhibitory activity. There are consequently
inhibitors that adsorb stronger than others, however, their relative β-haematin inhibitory activity is the same.
Stellenbosch University https://scholar.sun.ac.za
93
These observations raise further questions in understanding β-haematin inhibiting compounds and their mode
of action by which they inhibit β-haematin formation, since these compounds appear to behave differently
when they are compared together as a group of β-haematin inhibitors.
When considering the main kinetic model, Equation 1.2, which explains the effect of an inhibitor on the
formation of β-haematin,40 it is evident that there are two factors, namely Kads and k2, that may contribute to
individual inhibitors possessing the same IC50 value. In an attempt to rationalize the interplay between these
two factors, arbitrary values were chosen initially for z, Kads and k2 in the kinetic model. A series of curves are
obtained for the percentage β-haematin formation as a function of time (Figure 4.9 (a)). The decrease in the
rate and overall yield of β-haematin formation are observed as previously described; the decrease in rate being
accounted for by the adsorption of an inhibitor to the β-haematin crystal surface and the decrease in the yield
being attributed to the proposed irreversible precipitation of a Fe(III)PPIX-inhibitor complex. When the IC50
value for β-haematin inhibition is measured, essentially the expected percentage inhibition of β-haematin at a
specific time point as a function of drug concentration is investigated. It is possible therefore to predict a dose-
response curve from the kinetics profile by examining expected yields at a particular time point, as a function
of drug concentration. The dose-response curve obtained from the original set of kinetics traces at a specific
time point yields a specific IC50 value (Figure 4.9 (b)).
However, by increasing the arbitrary value for Kads ten-fold, and keeping z and k2 constant, another series of
curves are obtained (Figure 4.9 (c)). It is evident that the rate of β-haematin formation slows down more
dramatically with increasing inhibitor concentration. Likewise, a dose-response curve obtained from the set of
curves, at a specific time point, as a result of increasing Kads, thus also yields a specific IC50 value (Figure 4.9
(d)). If Kads is increased ten-fold, however, less of the inhibitor is needed to inhibit β-haematin formation by
50% and the IC50 value is expected to be lower. Indeed this is the case if the two theoretical data sets are
compared with one another.
By increasing the original arbitrary value of k2 five thousand-fold, hence rapid precipitation of the Fe(III)PPIX-
inhibitor complex, and keeping the original values for z and Kads constant, another series of curves, different
from the original, are obtained (Figure 4.9 (e)). A more distinct decrease in the overall yield of β-haematin
formation is observed after each addition of inhibitor concentration. Measuring the IC50 value at the same time
point, a predicted dose-response curve is obtained (Figure 4.9 (f)). In both cases (Figure 4.9 (d) and Figure 4.9
(f)), β-haematin formation is inhibited by at least 50% after the fourth addition of the inhibitor.
Another interesting observation is made when the dose-response curves obtained after increasing Kads and k2,
respectively, are compared to the original. The slight sigmoidal-shaped dose-response curve changes in shape
to a less sigmoidal function, and rather fits a hyperbolic function. This suggests that the incubation time may
not be exclusively responsible for the shape of the respective dose-response curves, however, this, along with
the rate of precipitation, k2, should be investigated further.
Stellenbosch University https://scholar.sun.ac.za
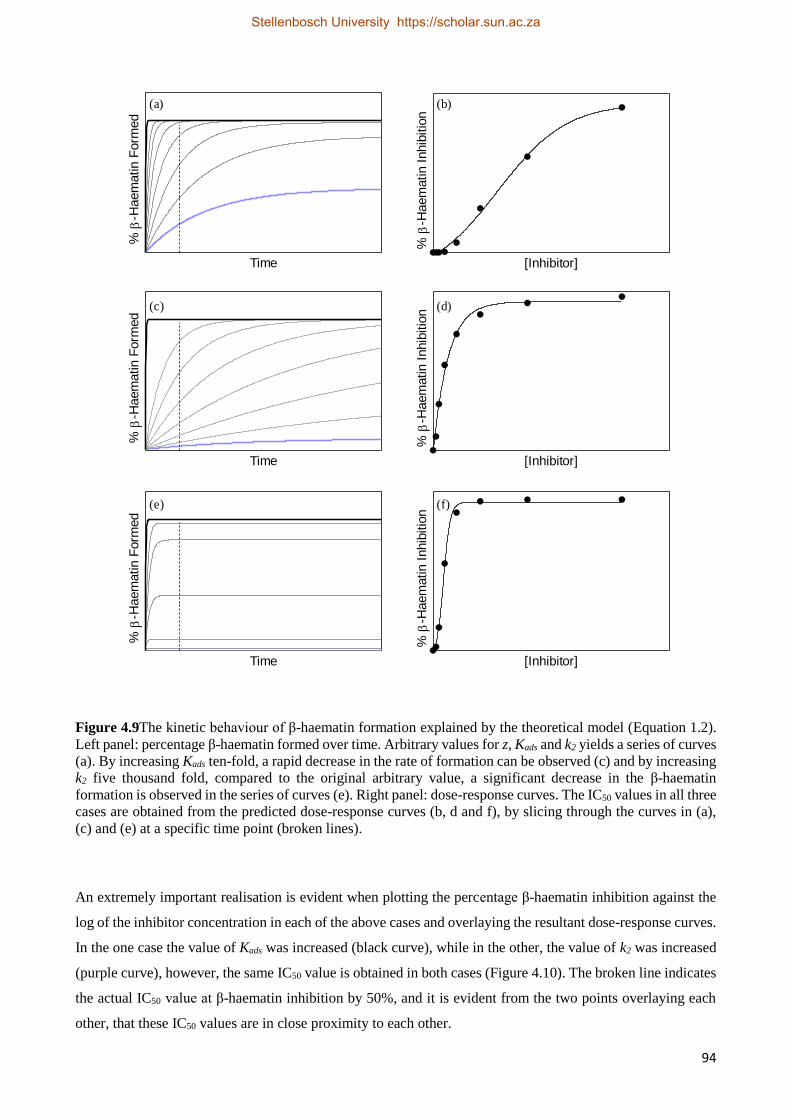
94
Time
%
-Haem
atin F
orm
ed
Time
%
-Haem
atin F
orm
ed
[Inhibitor]
%
-Haem
atin I
nhib
itio
n
[Inhibitor]
%
-Haem
atin I
nhib
itio
n
Time
%
-Haem
atin F
orm
ed
[Inhibitor]
%
-Haem
atin I
nhib
itio
n
(b)(a)
(c)
(f)
(d)
(e)
Figure 4.9The kinetic behaviour of β-haematin formation explained by the theoretical model (Equation 1.2).
Left panel: percentage β-haematin formed over time. Arbitrary values for z, Kads and k2 yields a series of curves
(a). By increasing Kads ten-fold, a rapid decrease in the rate of formation can be observed (c) and by increasing
k2 five thousand fold, compared to the original arbitrary value, a significant decrease in the β-haematin
formation is observed in the series of curves (e). Right panel: dose-response curves. The IC50 values in all three
cases are obtained from the predicted dose-response curves (b, d and f), by slicing through the curves in (a),
(c) and (e) at a specific time point (broken lines).
An extremely important realisation is evident when plotting the percentage β-haematin inhibition against the
log of the inhibitor concentration in each of the above cases and overlaying the resultant dose-response curves.
In the one case the value of Kads was increased (black curve), while in the other, the value of k2 was increased
(purple curve), however, the same IC50 value is obtained in both cases (Figure 4.10). The broken line indicates
the actual IC50 value at β-haematin inhibition by 50%, and it is evident from the two points overlaying each
other, that these IC50 values are in close proximity to each other.
Stellenbosch University https://scholar.sun.ac.za
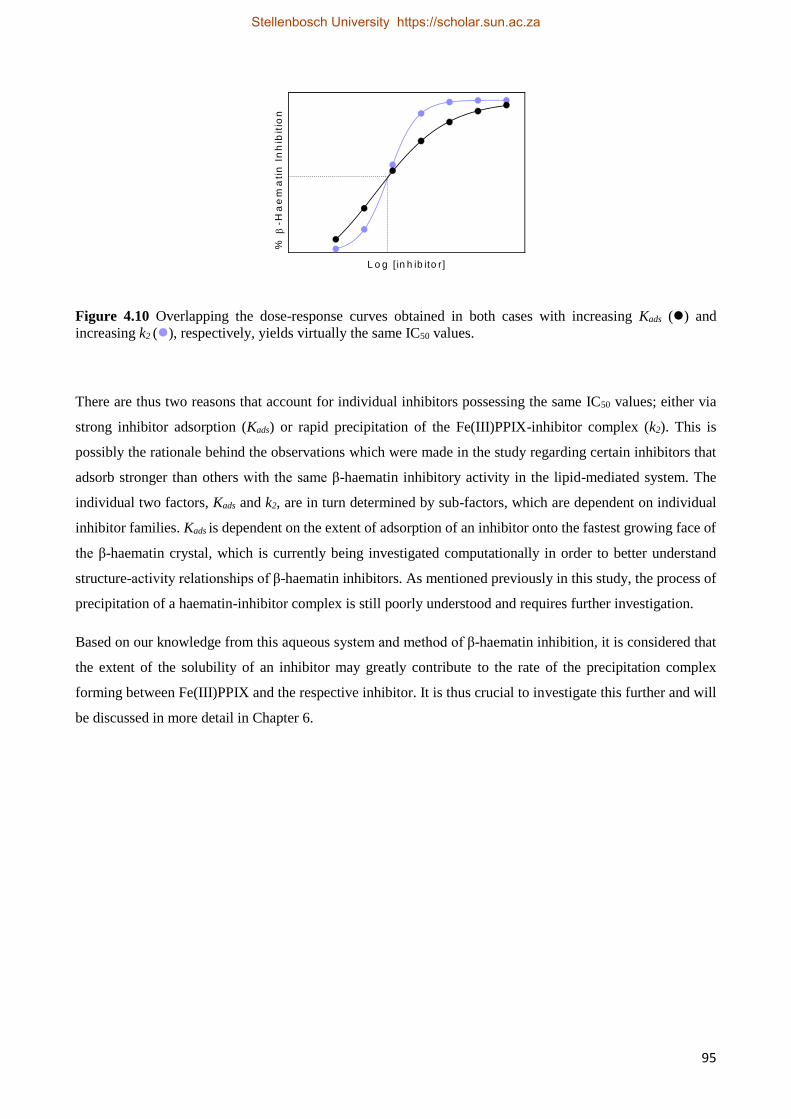
95
L o g [ in h ib ito r]
%
-Ha
em
ati
n I
nh
ibit
ion
Figure 4.10 Overlapping the dose-response curves obtained in both cases with increasing Kads () and
increasing k2 (), respectively, yields virtually the same IC50 values.
There are thus two reasons that account for individual inhibitors possessing the same IC50 values; either via
strong inhibitor adsorption (Kads) or rapid precipitation of the Fe(III)PPIX-inhibitor complex (k2). This is
possibly the rationale behind the observations which were made in the study regarding certain inhibitors that
adsorb stronger than others with the same β-haematin inhibitory activity in the lipid-mediated system. The
individual two factors, Kads and k2, are in turn determined by sub-factors, which are dependent on individual
inhibitor families. Kads is dependent on the extent of adsorption of an inhibitor onto the fastest growing face of
the β-haematin crystal, which is currently being investigated computationally in order to better understand
structure-activity relationships of β-haematin inhibitors. As mentioned previously in this study, the process of
precipitation of a haematin-inhibitor complex is still poorly understood and requires further investigation.
Based on our knowledge from this aqueous system and method of β-haematin inhibition, it is considered that
the extent of the solubility of an inhibitor may greatly contribute to the rate of the precipitation complex
forming between Fe(III)PPIX and the respective inhibitor. It is thus crucial to investigate this further and will
be discussed in more detail in Chapter 6.
Stellenbosch University https://scholar.sun.ac.za
96
4.5 Conclusion
The current, newly-optimized assay was further developed in order to investigate a wider set of β-haematin
inhibiting compounds. Non-quinoline compounds of the benzamide series were introduced into the lipid-water
interface system, by decreasing the pH of the aqueous buffer to 3. The inhibitory activity, as well as the effects
on the kinetics of β-haematin formation, of these compounds was successfully investigated in the lipid-
mediated system. A decrease in the rate of β-haematin formation in the absence of an inhibitor, compared to
the rate in the pH 4.8 aqueous buffer system, was observed. Based on the results reported in this chapter, a
similar observation to that of the quinoline-based inhibitors was made; an increase in the benzamide inhibitor
concentration resulted in a decrease in the rate of β-haematin formation at low concentrations, while a decrease
in the yield of β-haematin formation was observed when introducing higher doses of each inhibitor. The
kinetics results are in agreement to what is predicted by the theoretical kinetic model and also suggest that β-
haematin inhibitory activity may be related to the strength of adsorption of an inhibitor to the growing face of
a β-haematin crystal. By introducing the non-quinoline compounds into the lipid-mediated system, and fitting
the experimental kinetic data to the proposed kinetic model, provides further insight into understanding the β-
haematin inhibition process. The validity of the model has been extended, since a set of both non-clinically
related quinoline- and non-quinoline-based inhibitors has been introduced into the system. The results reported
in this chapter further introduced thought-provoking information, which concerns quinoline and non-quinoline
β-haematin inhibitors possessing virtually the same β-haematin inhibitory activity, however, appearing to
adsorb stronger than one another. According to the theoretical kinetic model, it is evident that the IC50 values
are dependent on both Kads and k2. A further understanding in the competing precipitation process of the
inhibitor-Fe(III)PPIX complex is required to account for the behaviour of different β-haematin inhibitors.
Additional kinetics studies, including different series of non-quinoline β-haematin inhibitors are also required
to further extend the biological-relevant system of β-haematin inhibition. It is also important to investigate the
adsorption of inhibitors to β-haematin independently, since kinetics alone cannot account for the proposed
mechanism of action in β-haematin inhibition.
Stellenbosch University https://scholar.sun.ac.za
97
Chapter 5. Independent Adsorption Studies
5.1 Introduction
The results reported in the previous two chapters have provided considerable insight into understanding the
possible mechanism of action of the inhibition of β-haematin formation, however, kinetics alone cannot
account for this proposed chemical inhibition process occurring. These findings warranted further
investigation, in which evidence for adsorption of inhibitors to β-haematin was independently confirmed.
Direct adsorption studies have previously been investigated in our laboratory using two known antimalarial
drugs, CQ and QD.152 These studies were, however, time-consuming and were carried out as preliminary
studies with little optimization. This motivated a more detailed investigation into the direct adsorption to the
surface of pre-formed β-haematin crystals by known antimalarial drugs, AQ, CQ, QD and QN, and a short-
chain CQ analogue, Q-CF3. The method in which the direct adsorption studies are performed was optimized
in order to investigate a greater number of inhibitors in a shorter period of time. By calculating the proposed
amount of inhibitor adsorbed to the β-haematin crystals using Beer’s Law, and considering the Langmuir
Isotherm, which explains monolayer coverage of an adsorbent to a solid surface, the relative strength of
adsorption of an inhibitor to β-haematin crystals, K, was determined for each compound respectively. This is
the first detailed study to investigate the direct adsorption of four antimalarial drugs and a short-chain CQ
analogue to the surface of β-haematin crystals, enabling one to obtain an actual adsorption value.
Stellenbosch University https://scholar.sun.ac.za
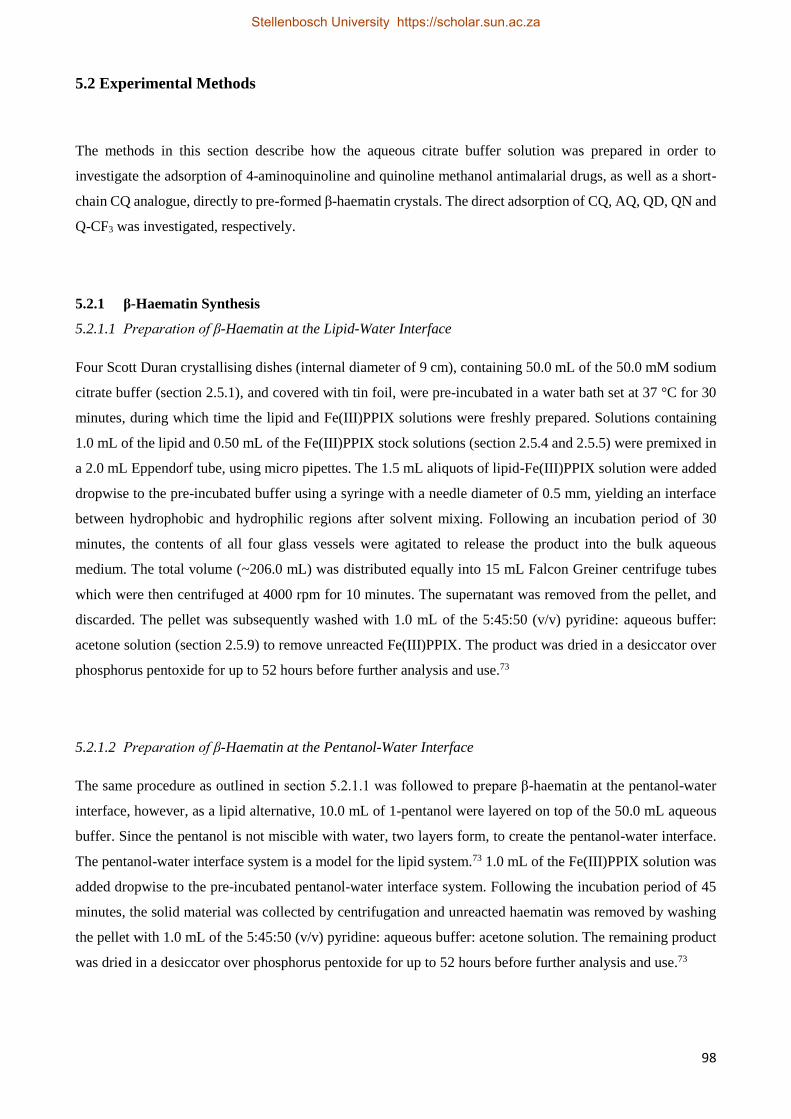
98
5.2 Experimental Methods
The methods in this section describe how the aqueous citrate buffer solution was prepared in order to
investigate the adsorption of 4-aminoquinoline and quinoline methanol antimalarial drugs, as well as a short-
chain CQ analogue, directly to pre-formed β-haematin crystals. The direct adsorption of CQ, AQ, QD, QN and
Q-CF3 was investigated, respectively.
5.2.1 β-Haematin Synthesis
5.2.1.1 Preparation of β-Haematin at the Lipid-Water Interface
Four Scott Duran crystallising dishes (internal diameter of 9 cm), containing 50.0 mL of the 50.0 mM sodium
citrate buffer (section 2.5.1), and covered with tin foil, were pre-incubated in a water bath set at 37 °C for 30
minutes, during which time the lipid and Fe(III)PPIX solutions were freshly prepared. Solutions containing
1.0 mL of the lipid and 0.50 mL of the Fe(III)PPIX stock solutions (section 2.5.4 and 2.5.5) were premixed in
a 2.0 mL Eppendorf tube, using micro pipettes. The 1.5 mL aliquots of lipid-Fe(III)PPIX solution were added
dropwise to the pre-incubated buffer using a syringe with a needle diameter of 0.5 mm, yielding an interface
between hydrophobic and hydrophilic regions after solvent mixing. Following an incubation period of 30
minutes, the contents of all four glass vessels were agitated to release the product into the bulk aqueous
medium. The total volume (~206.0 mL) was distributed equally into 15 mL Falcon Greiner centrifuge tubes
which were then centrifuged at 4000 rpm for 10 minutes. The supernatant was removed from the pellet, and
discarded. The pellet was subsequently washed with 1.0 mL of the 5:45:50 (v/v) pyridine: aqueous buffer:
acetone solution (section 2.5.9) to remove unreacted Fe(III)PPIX. The product was dried in a desiccator over
phosphorus pentoxide for up to 52 hours before further analysis and use.73
5.2.1.2 Preparation of β-Haematin at the Pentanol-Water Interface
The same procedure as outlined in section 5.2.1.1 was followed to prepare β-haematin at the pentanol-water
interface, however, as a lipid alternative, 10.0 mL of 1-pentanol were layered on top of the 50.0 mL aqueous
buffer. Since the pentanol is not miscible with water, two layers form, to create the pentanol-water interface.
The pentanol-water interface system is a model for the lipid system.73 1.0 mL of the Fe(III)PPIX solution was
added dropwise to the pre-incubated pentanol-water interface system. Following the incubation period of 45
minutes, the solid material was collected by centrifugation and unreacted haematin was removed by washing
the pellet with 1.0 mL of the 5:45:50 (v/v) pyridine: aqueous buffer: acetone solution. The remaining product
was dried in a desiccator over phosphorus pentoxide for up to 52 hours before further analysis and use.73
Stellenbosch University https://scholar.sun.ac.za
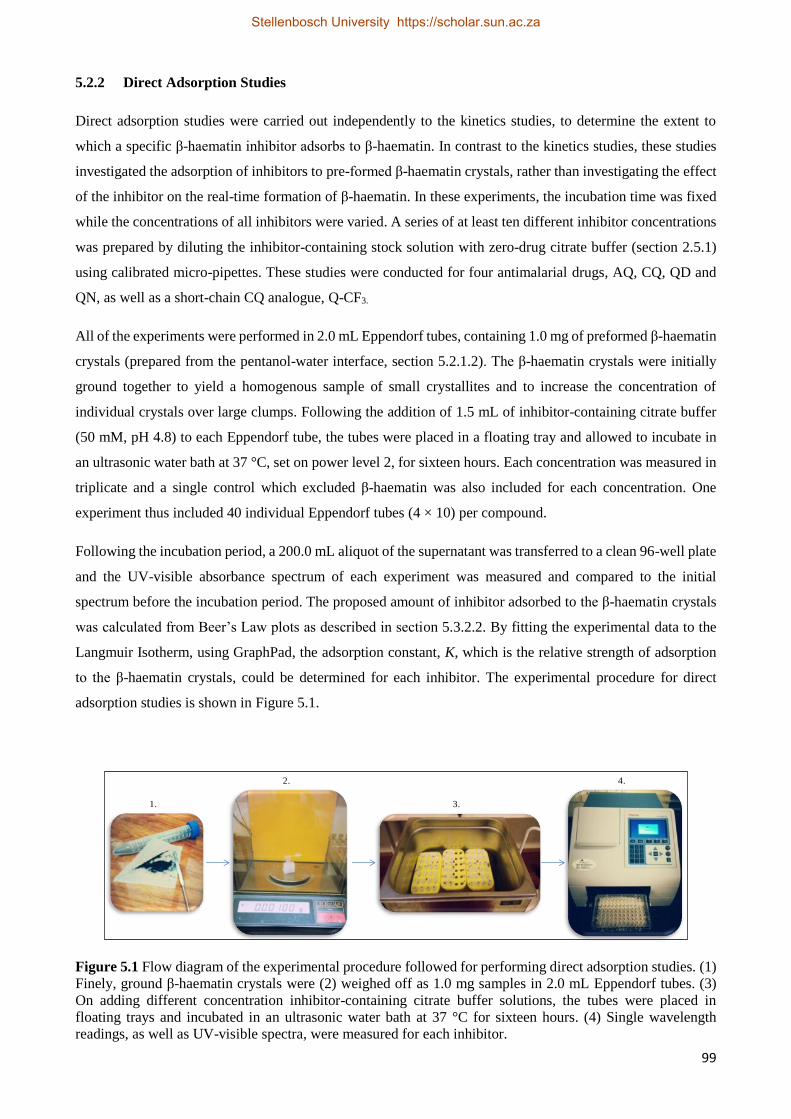
99
5.2.2 Direct Adsorption Studies
Direct adsorption studies were carried out independently to the kinetics studies, to determine the extent to
which a specific β-haematin inhibitor adsorbs to β-haematin. In contrast to the kinetics studies, these studies
investigated the adsorption of inhibitors to pre-formed β-haematin crystals, rather than investigating the effect
of the inhibitor on the real-time formation of β-haematin. In these experiments, the incubation time was fixed
while the concentrations of all inhibitors were varied. A series of at least ten different inhibitor concentrations
was prepared by diluting the inhibitor-containing stock solution with zero-drug citrate buffer (section 2.5.1)
using calibrated micro-pipettes. These studies were conducted for four antimalarial drugs, AQ, CQ, QD and
QN, as well as a short-chain CQ analogue, Q-CF3.
All of the experiments were performed in 2.0 mL Eppendorf tubes, containing 1.0 mg of preformed β-haematin
crystals (prepared from the pentanol-water interface, section 5.2.1.2). The β-haematin crystals were initially
ground together to yield a homogenous sample of small crystallites and to increase the concentration of
individual crystals over large clumps. Following the addition of 1.5 mL of inhibitor-containing citrate buffer
(50 mM, pH 4.8) to each Eppendorf tube, the tubes were placed in a floating tray and allowed to incubate in
an ultrasonic water bath at 37 °C, set on power level 2, for sixteen hours. Each concentration was measured in
triplicate and a single control which excluded β-haematin was also included for each concentration. One
experiment thus included 40 individual Eppendorf tubes (4 × 10) per compound.
Following the incubation period, a 200.0 mL aliquot of the supernatant was transferred to a clean 96-well plate
and the UV-visible absorbance spectrum of each experiment was measured and compared to the initial
spectrum before the incubation period. The proposed amount of inhibitor adsorbed to the β-haematin crystals
was calculated from Beer’s Law plots as described in section 5.3.2.2. By fitting the experimental data to the
Langmuir Isotherm, using GraphPad, the adsorption constant, K, which is the relative strength of adsorption
to the β-haematin crystals, could be determined for each inhibitor. The experimental procedure for direct
adsorption studies is shown in Figure 5.1.
Figure 5.1 Flow diagram of the experimental procedure followed for performing direct adsorption studies. (1)
Finely, ground β-haematin crystals were (2) weighed off as 1.0 mg samples in 2.0 mL Eppendorf tubes. (3)
On adding different concentration inhibitor-containing citrate buffer solutions, the tubes were placed in
floating trays and incubated in an ultrasonic water bath at 37 °C for sixteen hours. (4) Single wavelength
readings, as well as UV-visible spectra, were measured for each inhibitor.
1.
2.
3.
4.
Stellenbosch University https://scholar.sun.ac.za
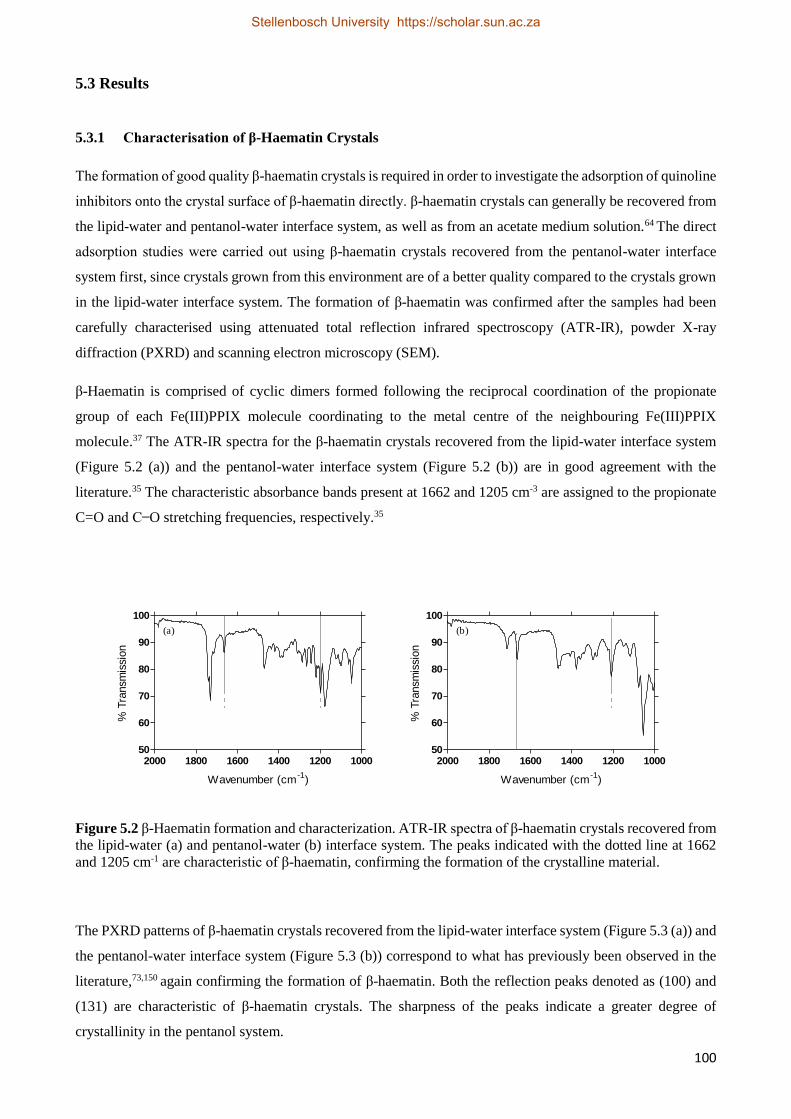
100
5.3 Results
5.3.1 Characterisation of β-Haematin Crystals
The formation of good quality β-haematin crystals is required in order to investigate the adsorption of quinoline
inhibitors onto the crystal surface of β-haematin directly. β-haematin crystals can generally be recovered from
the lipid-water and pentanol-water interface system, as well as from an acetate medium solution.64 The direct
adsorption studies were carried out using β-haematin crystals recovered from the pentanol-water interface
system first, since crystals grown from this environment are of a better quality compared to the crystals grown
in the lipid-water interface system. The formation of β-haematin was confirmed after the samples had been
carefully characterised using attenuated total reflection infrared spectroscopy (ATR-IR), powder X-ray
diffraction (PXRD) and scanning electron microscopy (SEM).
β-Haematin is comprised of cyclic dimers formed following the reciprocal coordination of the propionate
group of each Fe(III)PPIX molecule coordinating to the metal centre of the neighbouring Fe(III)PPIX
molecule.37 The ATR-IR spectra for the β-haematin crystals recovered from the lipid-water interface system
(Figure 5.2 (a)) and the pentanol-water interface system (Figure 5.2 (b)) are in good agreement with the
literature.35 The characteristic absorbance bands present at 1662 and 1205 cm-3 are assigned to the propionate
C=O and C ̶ O stretching frequencies, respectively.35
10001200140016001800200050
60
70
80
90
100
Wavenumber (cm-1
)
% T
ransm
issi
on
10001200140016001800200050
60
70
80
90
100
Wavenumber (cm-1
)
% T
ransm
issi
on
(a) (b)
Figure 5.2 β-Haematin formation and characterization. ATR-IR spectra of β-haematin crystals recovered from
the lipid-water (a) and pentanol-water (b) interface system. The peaks indicated with the dotted line at 1662
and 1205 cm-1 are characteristic of β-haematin, confirming the formation of the crystalline material.
The PXRD patterns of β-haematin crystals recovered from the lipid-water interface system (Figure 5.3 (a)) and
the pentanol-water interface system (Figure 5.3 (b)) correspond to what has previously been observed in the
literature,73,150 again confirming the formation of β-haematin. Both the reflection peaks denoted as (100) and
(131) are characteristic of β-haematin crystals. The sharpness of the peaks indicate a greater degree of
crystallinity in the pentanol system.
Stellenbosch University https://scholar.sun.ac.za
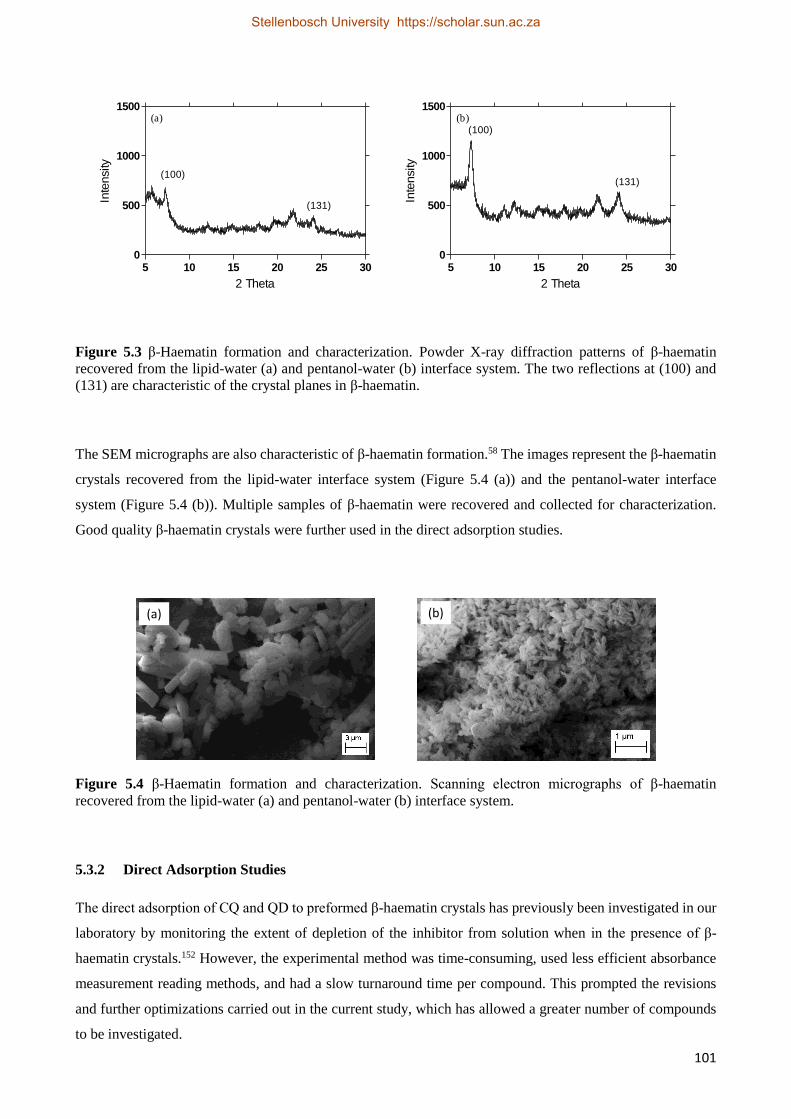
101
5 10 15 20 25 300
500
1000
1500
Inte
nsity
(100)
(131)
2 Theta
5 10 15 20 25 300
500
1000
1500
(131)
(100)
2 Theta
Inte
nsity
(b)(a)
Figure 5.3 β-Haematin formation and characterization. Powder X-ray diffraction patterns of β-haematin
recovered from the lipid-water (a) and pentanol-water (b) interface system. The two reflections at (100) and
(131) are characteristic of the crystal planes in β-haematin.
The SEM micrographs are also characteristic of β-haematin formation.58 The images represent the β-haematin
crystals recovered from the lipid-water interface system (Figure 5.4 (a)) and the pentanol-water interface
system (Figure 5.4 (b)). Multiple samples of β-haematin were recovered and collected for characterization.
Good quality β-haematin crystals were further used in the direct adsorption studies.
Figure 5.4 β-Haematin formation and characterization. Scanning electron micrographs of β-haematin
recovered from the lipid-water (a) and pentanol-water (b) interface system.
5.3.2 Direct Adsorption Studies
The direct adsorption of CQ and QD to preformed β-haematin crystals has previously been investigated in our
laboratory by monitoring the extent of depletion of the inhibitor from solution when in the presence of β-
haematin crystals.152 However, the experimental method was time-consuming, used less efficient absorbance
measurement reading methods, and had a slow turnaround time per compound. This prompted the revisions
and further optimizations carried out in the current study, which has allowed a greater number of compounds
to be investigated.
(a) (b)
Stellenbosch University https://scholar.sun.ac.za
102
5.3.2.1 Method of Optimization
When considering an experimental method for direct adsorption studies, the primary objective was to maintain
conditions in line with those used in the activity and kinetics studies as far as possible. The temperature at
which the direct adsorption studies were carried out was thus increased from room temperature (~25 °C) to
37 °C. To ensure homogeneity of the β-haematin weighed off into Eppendorf tubes, samples were ground
together. The studies were also carried out in a heated ultrasonic water bath; in this way, it was assumed that
crystallites would not clump together, thus ensuring maximal contact between the inhibitor in solution and the
β-haematin crystal surfaces. The efficiency of measurement of each inhibitor concentration was improved by
transferring a 200.0 µL aliquot of the supernatant from each tube to a 96-well plate and performing multiple
absorbance readings simultaneously.
The optimization steps outlined above have resulted in considerable improvement compared to the previous
method used to investigate the direct adsorption of inhibitors to preformed β-haematin crystals. All of the
important differences and similarities between the previous and the new method are summarized in Table 5.1.
Table 5.1 A comparison between the previous and new experimental direct adsorption method.
Previous Method Optimized Method
2.0 mL Eppendorf tubes 2.0 mL Eppendorf tubes
1.0 mg preformed β-haematin crystals 1.0 mg preformed β-haematin crystals
2.0 mL inhibitor-containing buffer solutions 1.5 mL inhibitor-containing buffer solutions
Room temperature 37 °C
Incubation period, 72 hours Incubation period, 16 hours
Unshaken Shaken continually in ultrasonic water bath
2.0 mL aliquot measurements in cuvette 0.2 mL aliquot measurements in 96-well plates
5.3.2.2 Recording Initial UV-visible Spectra
A full UV-visible spectrum was recorded from 200-600 nm for different concentrations of AQ, CQ, QD, QN
and Q-CF3 respectively, in order to determine the maximum absorbance wavelength of each inhibitor (Figure
5.5). The wavelengths selected for monitoring throughout the direct adsorption studies were 342, 344, 332,
344 and 341 nm, for AQ, CQ, QD, QN and Q-CF3, respectively. After placing the preformed β-haematin
crystals in a solution containing a particular concentration of an inhibitor, the absorbance reading of the
supernatant at the relevant reference wavelength was measured after 16 hours (At) and compared to the initial
absorbance (Ai) reading.
Stellenbosch University https://scholar.sun.ac.za
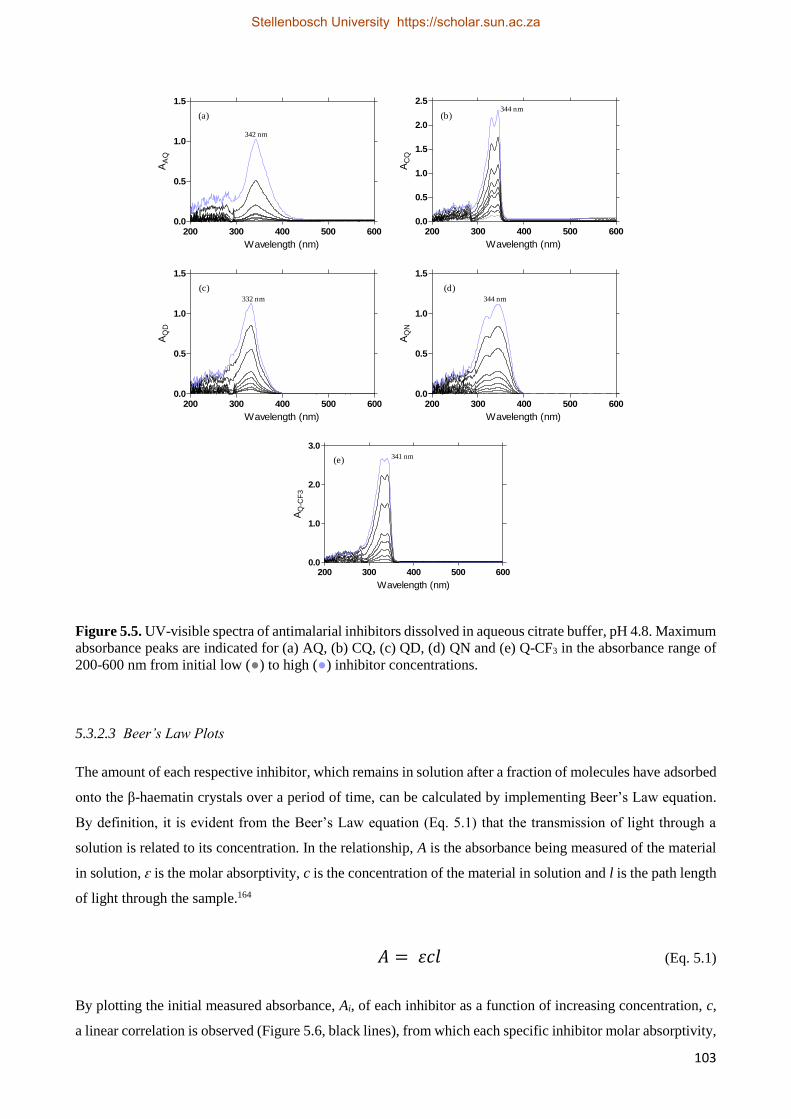
103
200 300 400 500 6000.0
0.5
1.0
1.5
342 nm
Wavelength (nm)
AA
Q
200 300 400 500 6000.0
0.5
1.0
1.5
2.0
2.5344 nm
Wavelength (nm)
AC
Q200 300 400 500 600
0.0
0.5
1.0
1.5
332 nm
Wavelength (nm)
AQ
D
200 300 400 500 6000.0
0.5
1.0
1.5
344 nm
Wavelength (nm)
AQ
N
(a)
(d)
(b)
(c)
200 300 400 500 6000.0
1.0
2.0
3.0341 nm
Wavelength (nm)
AQ
-CF
3
(e)
Figure 5.5. UV-visible spectra of antimalarial inhibitors dissolved in aqueous citrate buffer, pH 4.8. Maximum
absorbance peaks are indicated for (a) AQ, (b) CQ, (c) QD, (d) QN and (e) Q-CF3 in the absorbance range of
200-600 nm from initial low (●) to high (●) inhibitor concentrations.
5.3.2.3 Beer’s Law Plots
The amount of each respective inhibitor, which remains in solution after a fraction of molecules have adsorbed
onto the β-haematin crystals over a period of time, can be calculated by implementing Beer’s Law equation.
By definition, it is evident from the Beer’s Law equation (Eq. 5.1) that the transmission of light through a
solution is related to its concentration. In the relationship, A is the absorbance being measured of the material
in solution, ԑ is the molar absorptivity, c is the concentration of the material in solution and l is the path length
of light through the sample.164
𝐴 = 𝜀𝑐𝑙 (Eq. 5.1)
By plotting the initial measured absorbance, Ai, of each inhibitor as a function of increasing concentration, c,
a linear correlation is observed (Figure 5.6, black lines), from which each specific inhibitor molar absorptivity,
Stellenbosch University https://scholar.sun.ac.za
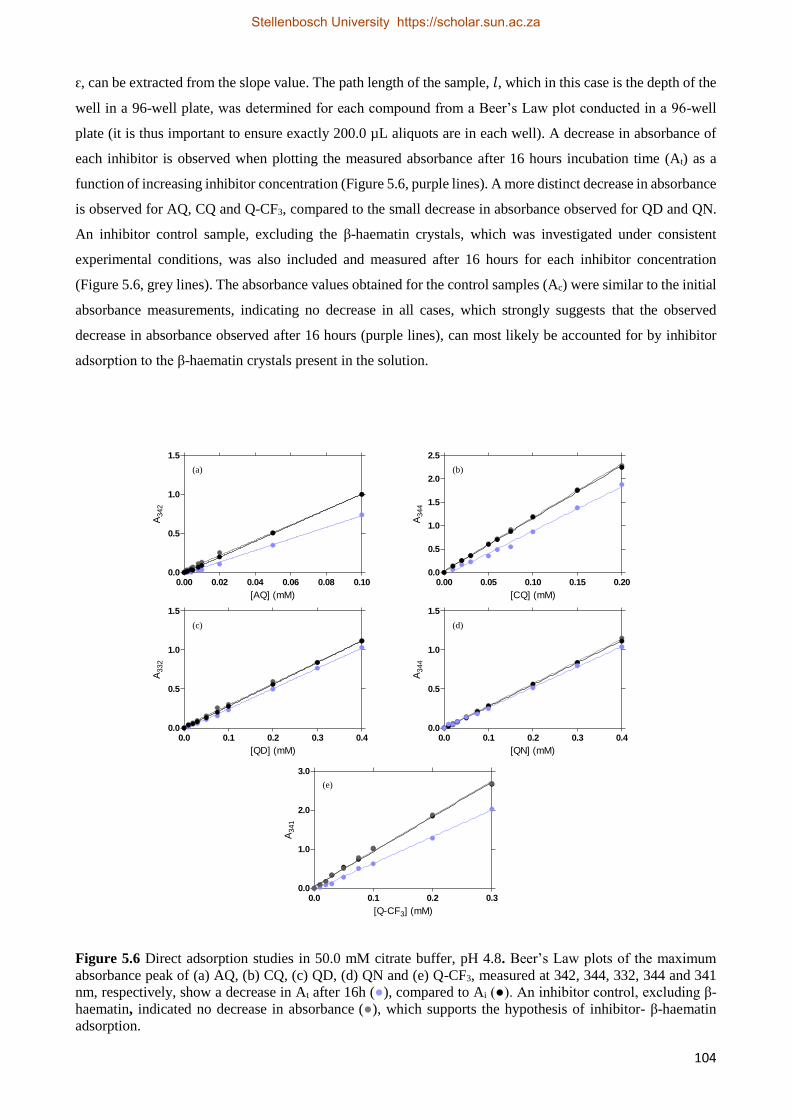
104
ԑ, can be extracted from the slope value. The path length of the sample, 𝑙, which in this case is the depth of the
well in a 96-well plate, was determined for each compound from a Beer’s Law plot conducted in a 96-well
plate (it is thus important to ensure exactly 200.0 µL aliquots are in each well). A decrease in absorbance of
each inhibitor is observed when plotting the measured absorbance after 16 hours incubation time (At) as a
function of increasing inhibitor concentration (Figure 5.6, purple lines). A more distinct decrease in absorbance
is observed for AQ, CQ and Q-CF3, compared to the small decrease in absorbance observed for QD and QN.
An inhibitor control sample, excluding the β-haematin crystals, which was investigated under consistent
experimental conditions, was also included and measured after 16 hours for each inhibitor concentration
(Figure 5.6, grey lines). The absorbance values obtained for the control samples (Ac) were similar to the initial
absorbance measurements, indicating no decrease in all cases, which strongly suggests that the observed
decrease in absorbance observed after 16 hours (purple lines), can most likely be accounted for by inhibitor
adsorption to the β-haematin crystals present in the solution.
0.00 0.02 0.04 0.06 0.08 0.100.0
0.5
1.0
1.5
[AQ] (mM)
A342
0.00 0.05 0.10 0.15 0.200.0
0.5
1.0
1.5
2.0
2.5
[CQ] (mM)
A344
0.0 0.1 0.2 0.3 0.40.0
0.5
1.0
1.5
[QD] (mM)
A332
0.0 0.1 0.2 0.3 0.40.0
0.5
1.0
1.5
[QN] (mM)
A344
0.0 0.1 0.2 0.30.0
1.0
2.0
3.0
[Q-CF3] (mM)
A341
(a)
(d)(c)
(b)
(e)
Figure 5.6 Direct adsorption studies in 50.0 mM citrate buffer, pH 4.8. Beer’s Law plots of the maximum
absorbance peak of (a) AQ, (b) CQ, (c) QD, (d) QN and (e) Q-CF3, measured at 342, 344, 332, 344 and 341
nm, respectively, show a decrease in At after 16h (●), compared to Ai (●). An inhibitor control, excluding β-
haematin, indicated no decrease in absorbance (●), which supports the hypothesis of inhibitor- β-haematin
adsorption.
Stellenbosch University https://scholar.sun.ac.za
105
5.3.2.4 Explaining the Observed Direct Adsorption Behaviour using the Langmuir Isotherm
It is apparent from the Beer’s Law plots in section 5.3.2.3 that a decrease in the inhibitor concentration in
solution does indeed occur over a period of time for all compounds, when present together with β-haematin
crystals in an aqueous citrate buffer solution. To further extract valuable information from the experimental
data, the Langmuir Isotherm was again considered. In order to calculate the amount of inhibitor adsorbed to
the β-haematin sample, the experimental data were fitted to equation 5.2, which is a mass-balance form of the
Langmuir isotherm. 165, 166
𝑞𝑒 =𝐾 ∙ 𝑄𝑎
0 ∙ 𝐶𝑒
1 +𝐾 ∙ 𝐶𝑒 (Eq. 5.2)
The Langmuir Isotherm is based on monolayer coverage and constant binding energy between a solid surface
and adsorbent,165 which is in this case β-haematin and the inhibiting inhibitor, respectively. In the above
equation, qe represents the mass of the adsorbed inhibitor per mass of β-haematin crystals at equilibrium, while
Ce is the inhibitor concentration in solution when the amount of inhibitor adsorbed equals qe, i.e. the inhibitor
concentration after adsorption. Qa0 represents the maximum adsorption capacity (the amount of adsorption
corresponding to monolayer coverage) and K is the adsorption constant, or the Langmuir constant, quantifying
the relative strength of inhibitor adsorption onto the β-haematin crystals.
Ce values for each inhibitor concentration are calculated by substituting the absorbance values, measured after
16 hours, as well as the extracted ԑ values (determined from the slope as mentioned above), into Equation 5.1.
(with 𝑙 = 1). Values of qe are calculated by subtracting Ce from the initial concentration, and converting it into
the actual mass of inhibitor adsorbed per milligram of β-haematin.
The experimental data of qe as a function of increasing Ce for each inhibitor are plotted in Figure 5.7. Ce is
increasing owing to the initial increase in inhibitor concentrations. The experimental data conform to a non-
linear fit of Equation 5.2 with r2 values of 0.94, 0.91, 0.89, 0.91 and 0.93 for AQ, CQ, QD, QN and Q-CF3
respectively. Default constraints were set for the K and Qa0 values to be greater than 0.
Subsequently, fitting the experimental data to Equation 5.2, yields K and Qa0 values for each inhibitor. These
values are given in Table 5.2. The values of K are of most interest, since these values represent the proposed
relative strength at which the inhibitor adsorbs to the β-haematin crystals.
Stellenbosch University https://scholar.sun.ac.za
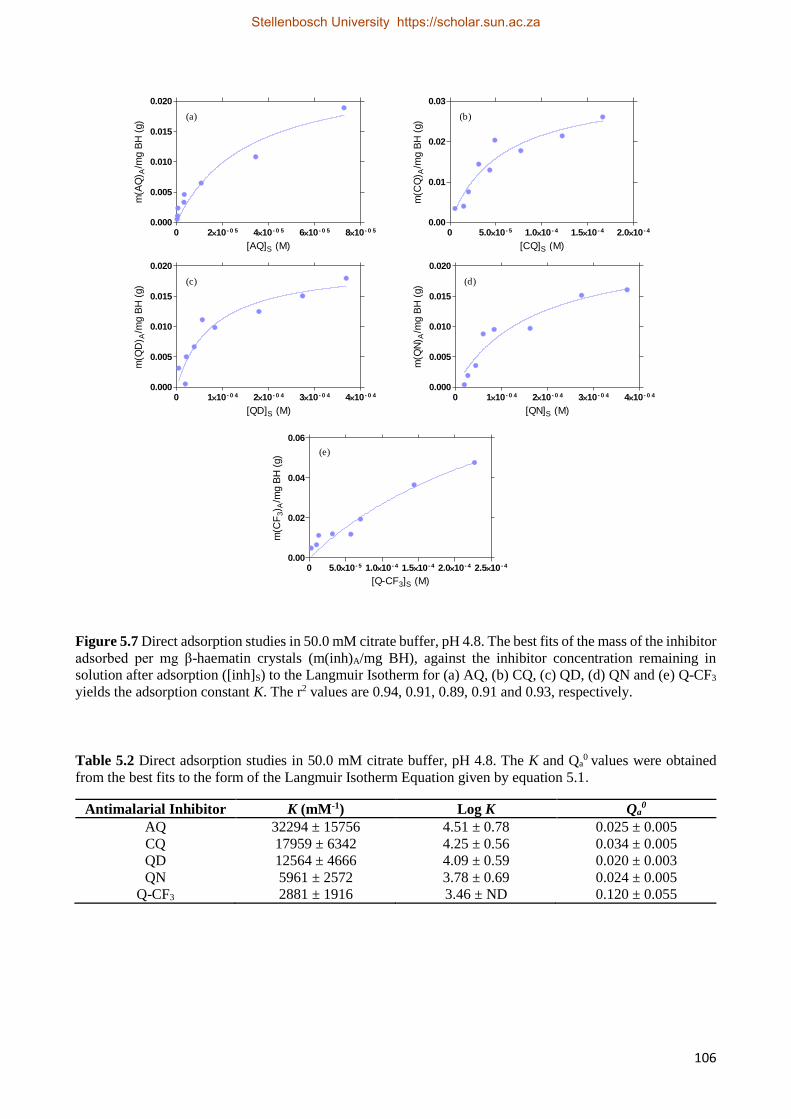
106
0 210 - 0 5 410 - 0 5 610 - 0 5 810 - 0 5
0.000
0.005
0.010
0.015
0.020
[AQ]S (M)
m(A
Q) A
/mg B
H (
g)
0 5.010 - 5 1.010 - 4 1.510 - 4 2.010 - 4
0.00
0.01
0.02
0.03
[CQ]S (M)
m(C
Q) A
/mg B
H (
g)
0 110 - 0 4 210 - 0 4 310 - 0 4 410 - 0 4
0.000
0.005
0.010
0.015
0.020
[QD]S (M)
m(Q
D) A
/mg B
H (
g)
0 110 - 0 4 210 - 0 4 310 - 0 4 410 - 0 4
0.000
0.005
0.010
0.015
0.020
[QN]S (M)m
(QN
) A/m
g B
H (
g)
0 5.010- 5 1.010 - 4 1.510- 4 2.010- 4 2.510 - 4
0.00
0.02
0.04
0.06
[Q-CF3]S (M)
m(C
F3) A
/mg B
H (
g)
(a)
(d)(c)
(b)
(e)
Figure 5.7 Direct adsorption studies in 50.0 mM citrate buffer, pH 4.8. The best fits of the mass of the inhibitor
adsorbed per mg β-haematin crystals (m(inh)A/mg BH), against the inhibitor concentration remaining in
solution after adsorption ([inh]S) to the Langmuir Isotherm for (a) AQ, (b) CQ, (c) QD, (d) QN and (e) Q-CF3
yields the adsorption constant K. The r2 values are 0.94, 0.91, 0.89, 0.91 and 0.93, respectively.
Table 5.2 Direct adsorption studies in 50.0 mM citrate buffer, pH 4.8. The K and Qa0 values were obtained
from the best fits to the form of the Langmuir Isotherm Equation given by equation 5.1.
Antimalarial Inhibitor K (mM-1) Log K Qa0
AQ 32294 ± 15756 4.51 ± 0.78 0.025 ± 0.005
CQ 17959 ± 6342 4.25 ± 0.56 0.034 ± 0.005
QD 12564 ± 4666 4.09 ± 0.59 0.020 ± 0.003
QN 5961 ± 2572 3.78 ± 0.69 0.024 ± 0.005
Q-CF3 2881 ± 1916 3.46 ± ND 0.120 ± 0.055
Stellenbosch University https://scholar.sun.ac.za
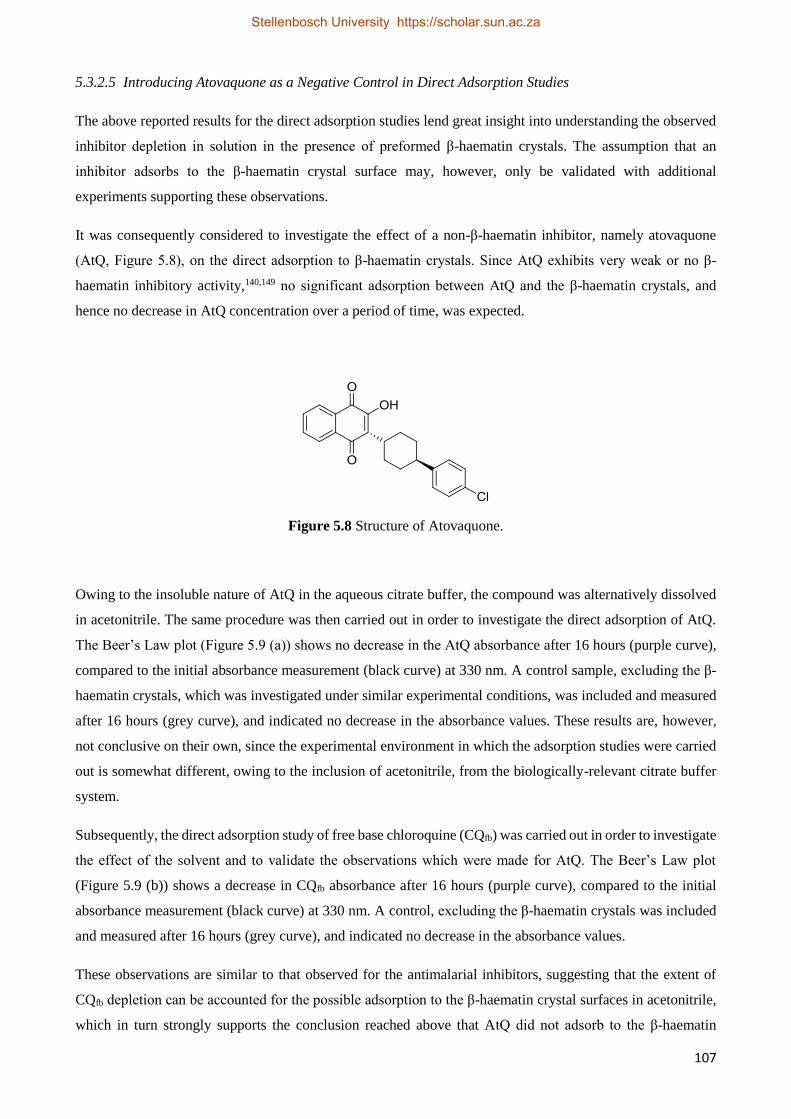
107
5.3.2.5 Introducing Atovaquone as a Negative Control in Direct Adsorption Studies
The above reported results for the direct adsorption studies lend great insight into understanding the observed
inhibitor depletion in solution in the presence of preformed β-haematin crystals. The assumption that an
inhibitor adsorbs to the β-haematin crystal surface may, however, only be validated with additional
experiments supporting these observations.
It was consequently considered to investigate the effect of a non-β-haematin inhibitor, namely atovaquone
(AtQ, Figure 5.8), on the direct adsorption to β-haematin crystals. Since AtQ exhibits very weak or no β-
haematin inhibitory activity,140,149 no significant adsorption between AtQ and the β-haematin crystals, and
hence no decrease in AtQ concentration over a period of time, was expected.
Figure 5.8 Structure of Atovaquone.
Owing to the insoluble nature of AtQ in the aqueous citrate buffer, the compound was alternatively dissolved
in acetonitrile. The same procedure was then carried out in order to investigate the direct adsorption of AtQ.
The Beer’s Law plot (Figure 5.9 (a)) shows no decrease in the AtQ absorbance after 16 hours (purple curve),
compared to the initial absorbance measurement (black curve) at 330 nm. A control sample, excluding the β-
haematin crystals, which was investigated under similar experimental conditions, was included and measured
after 16 hours (grey curve), and indicated no decrease in the absorbance values. These results are, however,
not conclusive on their own, since the experimental environment in which the adsorption studies were carried
out is somewhat different, owing to the inclusion of acetonitrile, from the biologically-relevant citrate buffer
system.
Subsequently, the direct adsorption study of free base chloroquine (CQfb) was carried out in order to investigate
the effect of the solvent and to validate the observations which were made for AtQ. The Beer’s Law plot
(Figure 5.9 (b)) shows a decrease in CQfb absorbance after 16 hours (purple curve), compared to the initial
absorbance measurement (black curve) at 330 nm. A control, excluding the β-haematin crystals was included
and measured after 16 hours (grey curve), and indicated no decrease in the absorbance values.
These observations are similar to that observed for the antimalarial inhibitors, suggesting that the extent of
CQfb depletion can be accounted for the possible adsorption to the β-haematin crystal surfaces in acetonitrile,
which in turn strongly supports the conclusion reached above that AtQ did not adsorb to the β-haematin
Stellenbosch University https://scholar.sun.ac.za
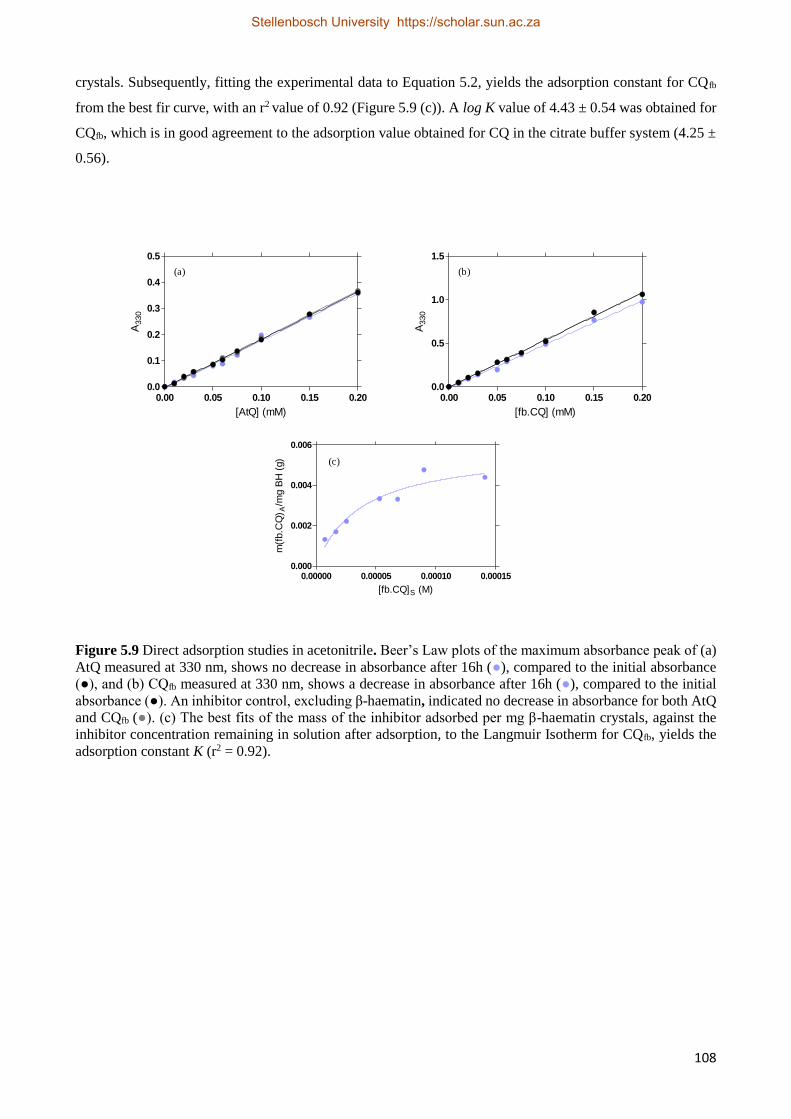
108
crystals. Subsequently, fitting the experimental data to Equation 5.2, yields the adsorption constant for CQfb
from the best fir curve, with an r2 value of 0.92 (Figure 5.9 (c)). A log K value of 4.43 ± 0.54 was obtained for
CQfb, which is in good agreement to the adsorption value obtained for CQ in the citrate buffer system (4.25 ±
0.56).
0.00 0.05 0.10 0.15 0.200.0
0.1
0.2
0.3
0.4
0.5
[AtQ] (mM)
A330
0.00 0.05 0.10 0.15 0.200.0
0.5
1.0
1.5
[fb.CQ] (mM)A
330
(a) (b)
0.00000 0.00005 0.00010 0.000150.000
0.002
0.004
0.006
[fb.CQ]S (M)
m(f
b.C
Q) A
/mg B
H (
g) (c)
Figure 5.9 Direct adsorption studies in acetonitrile. Beer’s Law plots of the maximum absorbance peak of (a)
AtQ measured at 330 nm, shows no decrease in absorbance after 16h (●), compared to the initial absorbance
(●), and (b) CQfb measured at 330 nm, shows a decrease in absorbance after 16h (●), compared to the initial
absorbance (●). An inhibitor control, excluding β-haematin, indicated no decrease in absorbance for both AtQ
and CQfb (●). (c) The best fits of the mass of the inhibitor adsorbed per mg β-haematin crystals, against the
inhibitor concentration remaining in solution after adsorption, to the Langmuir Isotherm for CQfb, yields the
adsorption constant K (r2 = 0.92).
Stellenbosch University https://scholar.sun.ac.za
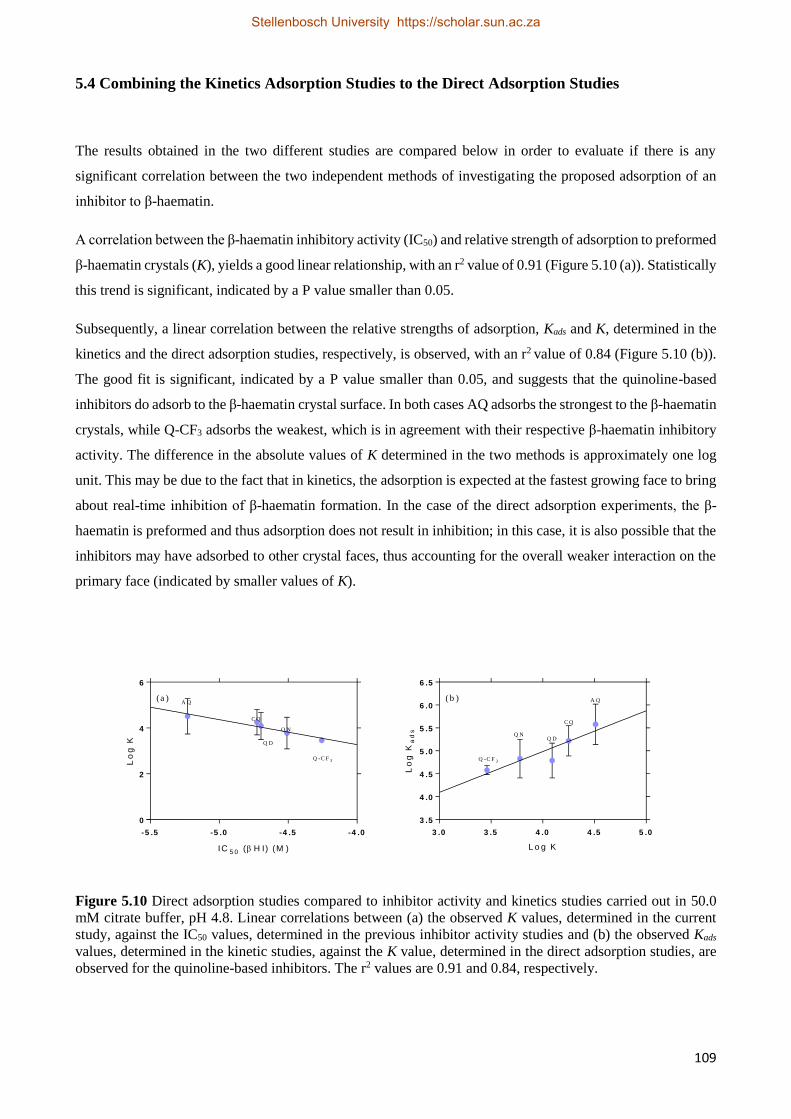
109
5.4 Combining the Kinetics Adsorption Studies to the Direct Adsorption Studies
The results obtained in the two different studies are compared below in order to evaluate if there is any
significant correlation between the two independent methods of investigating the proposed adsorption of an
inhibitor to β-haematin.
A correlation between the β-haematin inhibitory activity (IC50) and relative strength of adsorption to preformed
β-haematin crystals (K), yields a good linear relationship, with an r2 value of 0.91 (Figure 5.10 (a)). Statistically
this trend is significant, indicated by a P value smaller than 0.05.
Subsequently, a linear correlation between the relative strengths of adsorption, Kads and K, determined in the
kinetics and the direct adsorption studies, respectively, is observed, with an r2 value of 0.84 (Figure 5.10 (b)).
The good fit is significant, indicated by a P value smaller than 0.05, and suggests that the quinoline-based
inhibitors do adsorb to the β-haematin crystal surface. In both cases AQ adsorbs the strongest to the β-haematin
crystals, while Q-CF3 adsorbs the weakest, which is in agreement with their respective β-haematin inhibitory
activity. The difference in the absolute values of K determined in the two methods is approximately one log
unit. This may be due to the fact that in kinetics, the adsorption is expected at the fastest growing face to bring
about real-time inhibition of β-haematin formation. In the case of the direct adsorption experiments, the β-
haematin is preformed and thus adsorption does not result in inhibition; in this case, it is also possible that the
inhibitors may have adsorbed to other crystal faces, thus accounting for the overall weaker interaction on the
primary face (indicated by smaller values of K).
-5 .5 -5 .0 -4 .5 -4 .0
0
2
4
6
C Q
A Q
Q D
Q N
Q -C F 3
IC 5 0 ( H I) (M )
Lo
g K
3 .0 3 .5 4 .0 4 .5 5 .0
3 .5
4 .0
4 .5
5 .0
5 .5
6 .0
6 .5
A Q
C Q
Q DQ N
Q -C F 3
L o g K
Lo
g K
ad
s
(a ) ( b )
Figure 5.10 Direct adsorption studies compared to inhibitor activity and kinetics studies carried out in 50.0
mM citrate buffer, pH 4.8. Linear correlations between (a) the observed K values, determined in the current
study, against the IC50 values, determined in the previous inhibitor activity studies and (b) the observed Kads
values, determined in the kinetic studies, against the K value, determined in the direct adsorption studies, are
observed for the quinoline-based inhibitors. The r2 values are 0.91 and 0.84, respectively.
Stellenbosch University https://scholar.sun.ac.za
110
5.5 Discussion
The focus of this chapter has been to independently investigate the proposed adsorption by quinoline-based
inhibitors to preformed β-haematin crystals. β-Haematin crystals were successfully synthesized in a pentanol-
water interface system, since this method of preparation yields larger amounts of good quality crystals,
compared to the lipid-mediated system, and is frequently used as a lipid alternative system for β-haematin
formation.73 The β-haematin crystals were successfully characterized using infrared spectroscopy, powder X-
ray diffraction and scanning electron microscopy. Only good quality, homogenous β-haematin samples were
used in the direct adsorption studies.
Direct adsorption studies have previously been carried out in order to establish whether there is any interaction
between an inhibitor and the surface of preformed β-haematin crystals. The method of investigation has,
however, been optimized in the current study, which now has a faster turnaround time per compound, is
biologically more relevant and measures multiple absorbance readings simultaneously.
The direct adsorption of four clinically known antimalarial drugs, AQ, CQ, QD and QN, as well as a short-
chain CQ analogue, Q-CF3, was investigated in an aqueous citrate buffer, over 16 hours at 37 °C. A decrease
in absorbance is observed for all the quinoline inhibitors at their respective maximum absorbance wavelengths
(Figure 5.6). Interestingly, a greater decrease in absorbance is observed for the two 4-aminoquinoline
antimalarials, AQ and CQ, compared to the decrease in absorbance observed for the two quinoline methanol
antimalarials, QD and QN. These observations suggest that more AQ and CQ have interacted with the β-
haematin crystals than the quinoline methanol antimalarial drugs, resulting in a greater decrease in absorbance,
which is in agreement with the activity results reported in Chapter 3, since it has been observed that AQ and
CQ are more active β-haematin inhibitors than QD and QN. Higher doses of QD and QN are most likely
required to induce a larger decrease in absorbance.
The extent of depletion of each inhibitor in solution may be accounted for by a β-haematin-inhibitor interaction
occurring. Since no free Fe(III)PPIX is present in the solution, the interaction is not expected to be the
irreversible precipitation reaction of a Fe(III)PPIX-inhibitor complex. Rather therefore, the only possible
interaction that may be occurring is direct adsorption of the inhibitor to the β-haematin crystal surface. A
control sample, which included only the inhibitor-containing buffer, did not indicate a decrease in absorbance,
which in return supports the above statement.
Subsequently, the mass of the inhibitor adsorbed per mg β-haematin crystals as a function of the inhibitor
concentration remaining in solution after adsorption, was fit to the Langmuir Isotherm. Non-linear curves
(Figure 5.7) were obtained, from which the adsorption constant, K, was determined for each quinoline
inhibitor. A decrease in the strength of direct adsorption is observed, K decreasing from AQ to Q-CF3;
AQ>CQ>QD>QN> Q-CF3. AQ may possibly adsorb the strongest to the preformed β-haematin crystals, and
Q-CF3 the weakest.
Stellenbosch University https://scholar.sun.ac.za
111
Direct adsorption studies for AtQ indicated no decrease in absorbance, suggesting that no interaction to the β-
haematin crystals occurred, which was expected since AtQ is not a β-haematin inhibitor.140,149 Direct adsorption
studies for CQfb were, however, carried out in order to validate the observations that were made in the
acetonitrile environment. A decrease in the concentration of CQfb, similar to the quinoline inhibitors, is
observed, suggesting that the extent of CQfb depletion in acetonitrile may also be accounted for by the direct
adsorption to the surface of the preformed β-haematin crystals. This in turn provides support for the case that
AtQ did not adsorb to the β-haematin crystals. A log K value of 4.43 ± 0.54 for CQfb corresponds well to the
log K value obtained in the buffer system (4.25 ± 0.56). Regardless of the two different environments in which
the direct adsorption studies were carried out, the observations that AtQ does not show a decrease in
absorbance, while CQfb does, suggest that a decrease in inhibitor concentration (as evidence by a decrease in
absorbance) in the presence of performed β-haematin crystals, is most likely owing to a inhibitor- β-haematin
adsorption interaction.
Furthermore, the adsorption constants, K, determined in the independent investigation compared to the β-
haematin inhibitory activity obtained in Chapter 3, show a linear correlation between the quinoline inhibitors
(Figure 5.10 (a)). The correlation suggests that more active inhibitors, like AQ, adsorb more strongly to the β-
haematin crystals than less active inhibitors, such as Q-CF3. This is in agreement to the overall hypothesis that
the strength of adsorption of an inhibitor to β-haematin may be related to its relative β-haematin inhibition
activity.
Subsequently, a direct correlation is observed between the adsorption constants, Kads, which were determined
in the kinetics studies, and the adsorption constants, K, which were determined in the direct adsorption studies
(Figure 5.10 (b)). The linear correlation suggests that the strength of adsorption determined theoretically in the
kinetics studies are related to their relative strength of adsorption independently. The absolute values differ in
orders of magnitudes, however, the same trend in adsorption strength is observed for the quinoline-based
inhibitors. Using preformed β-haematin crystals in the direct adsorption studies is not the same as inhibiting
β-haematin crystal growth as a dynamic process. The direct adsorption of an inhibitor to the β-haematin
crystals is furthermore also not face-specific in this case, since inhibitors can adsorb to multiple faces of the
preformed β-haematin crystal. Unpublished computational data by one of our co-workers suggests that
interactions at the second fastest growing face may also take place, while the kinetics model is based on the
fastest growing face only. The absence of the lipid solution in the citrate buffer system, compared to the kinetics
lipid-water interface system, may possibly have an effect on the extent at which the quinoline inhibitors interact
with the β-haematin crystals.
Overall, the most probable inhibitor-β-haematin interaction is considered to be adsorption; however, this still
cannot be completely confirmed based on the current results alone. Additional studies, investigating the face
or faces to which adsorption may be occurring, are required to explain the observations reported in this chapter.
This is currently being investigated computationally, however, independent experimental results would also
be required to completely understand the mode of inhibitor-β-haematin interaction.
Stellenbosch University https://scholar.sun.ac.za
112
5.6 Conclusion
The previous method in which the direct adsorption of an inhibitor to the surface of β-haematin crystals was
investigated, has been optimized in the current study. The direct adsorption studies were expanded by
investigating four clinically known antimalarial drugs, as well as a short-chain CQ analogue. The decrease in
absorbance for a range of concentrations over a period of time may be accounted for by the possible absorption
of the inhibitor to the surface of the preformed β-haematin crystals present in the aqueous system. This
assumption is valid since a control sample, excluding β-haematin crystals, indicated no decrease in absorbance
when investigated under the similar experimental conditions. By fitting the mass of the inhibitor adsorbed per
mg β-haematin, against the inhibitor concentration which remains in solution after adsorption to the Langmuir
Isotherm, the relative strength of inhibitor adsorption to β-haematin crystals, K, was obtained. The K values
determined in the current study are in agreement to the β-haematin inhibitory activity, as well as the Kads values
obtained for each inhibitor from the kinetics studies carried out in the lipid system (Chapter 3). The direct
adsorption studies are, however, not sufficient enough to draw a definite conclusion on the exact inhibition
mechanism of action, since this experimental method does not provide adequate information on the site of
inhibitor adsorption. Even though the β-haematin crystal face to which adsorption occurs can be predicted and
investigated computationally, this should ideally be probed experimentally.
Stellenbosch University https://scholar.sun.ac.za
113
Chapter 6. Overall Conclusion and Future Work
6.1 Overall Conclusion
The main aim of this research project, underpinned by the hypothesis that the β-haematin inhibitory activity
of a compound is related to its strength of adsorption to free surface binding sites on the fastest growing face
of the crystalline material, was to investigate the effect of diverse β-haematin inhibitors on the kinetics of β-
haematin formation using a lipid-mediated system.
This aim was achieved by firstly developing a new, improved-throughput lipid-mediated assay in which to
investigate the inhibition of β-haematin formation. A previously-used Phiβ assay40 was optimized by
introducing 24-well plates and was successfully validated as a means of assaying drug activity by introducing
clinically-relevant antimalarial drugs, namely chloroquine, amodiaquine, quinidine, quinine and mefloquine
into the system. Having developed this more efficient lipophilic assay, it has been possible throughout this
project to extend the data set to include short-chain chloroquine analogues, as well as a series of benzamide
non-quinoline β-haematin inhibitors.
β-Haematin inhibitory activity was investigated for the first time in this way under biologically-relevant
conditions (pH4.8, 37 °C). The experimentally-determined IC50 values for all of the compounds show good
correlation with biological activity determined against various chloroquine-sensitive parasite strains, namely
3D7, D10 and NF54. Furthermore, the investigation of the kinetics on β-haematin formation at the lipid-water
interface in the presence of antimalarial drugs, short-chain CQ analogues, as well as the benzamide non-
quinolines, shows that an increase in inhibitor concentration results in a decrease in the rate of β-haematin
formation. This was observed at low concentrations, while a decrease in the yield of β-haematin formation was
observed when introducing higher doses of each inhibitor. The exponential kinetics results are similar to what
has previously been recorded,40 and can be explained by a theoretical kinetic model, previously developed in
our group.40 Importantly, consistent β-haematin formation rate constants in the absence of an inhibitor were
observed in the biologically-relevant environment, however, the rate was slightly faster in the pH 4.8 buffer
solution, compared to pH 3.0.
The experimental data strongly support a mechanism of inhibitor action via adsorption to the surface of β-
haematin crystals by both sets of quinoline- and non-quinoline inhibitors, and it is proposed that the equilibrium
between adsorbed and desorbed inhibitor is responsible for the decrease in the rate of β-haematin formation.
The decrease in the yield of β-haematin at high concentrations may be accounted for by the proposed
irreversible precipitation of an inhibitor-Fe(III)PPIX complex. The interaction between each individual
inhibitor and the crystal surface was measured (Kads) and found to correlate well with its β-haematin inhibitory
Stellenbosch University https://scholar.sun.ac.za
114
activity determined in the lipid-mediated system, as well as the biological activity determined against D10 and
NF54 chloroquine-sensitive parasite strains, for quinoline- and non-quinoline-based inhibitors, respectively.
An important observation made during this study is that various quinoline- and non-quinoline β-haematin
inhibitors can have the same β-haematin IC50 value, yet quite different Kads values. Using the theoretical kinetic
model it has become evident that both Kads and k2 have a direct effect on the IC50 value of a respective inhibitor.
It would seem that the interplay between the two parameters determines the overall activity of a family of
compounds. The formation of inhibitor-haem complexes did not, however, form part of this project, so that
independent studies regarding k2 are required urgently to improve our understanding of the different processes
involving Fe(III)PPIX.
Since kinetics alone cannot account for the proposed mechanism of β-haematin inhibition, independent studies
were carried out to investigate the relative strength by which an inhibitor is able to adsorb to the surface of
preformed β-haematin crystals. The interaction between the inhibitor and the preformed β-haematin was
measured (K) and was found correlate well with the inhibitory activity and Kads values determined in the
kinetics experiments.
Overall, this research project provides important insight into the possible mode of β-haematin inhibition by
quinoline- and importantly, non-quinoline-based inhibitors. Indeed, adsorption (Kads) is an important process
and was observed to correlate to both β-haematin and biological activities of the compounds investigated. If
the interactions that aid the adsorption of compounds to surface binding sites are identified, the insight will be
invaluable in the rational design of novel haemozoin inhibitors.
6.2 Future Work
The results of the work presented in Chapter 3 and 4 regarding the investigation of the kinetics of β-haematin
formation in the presence of a variety of inhibitors at the lipid-water interface provide a great deal of insight
into the possible mode of action of these inhibitors, however, the following future studies are proposed to
further our understanding:
1. To investigate a wider range of non-quinoline β-haematin inhibitors and determine their effects on the
kinetics of β-haematin formation in order to demonstrate the validity of the theoretical kinetic model
further.
2. To use fluorescence microscopy in conjunction with the β-haematin inhibition studies; by tagging an
inhibitor with a fluorescent marker, it may be possible to visualise the adsorbed inhibitor on the surface
of β-haematin crystals. This may contribute definitive insight into the mechanism of action of the
inhibitors.
Stellenbosch University https://scholar.sun.ac.za
115
Subsequent to the kinetics of β-haematin formation, which mainly focus on the equilibrium adsorption constant
of an inhibitor, Kads, in this study, it is evident from the results presented in Chapter 4 that a better understanding
of the proposed competing precipitation of an inhibitor-Fe(III)PPIX complex is required, and future studies in
this regard are suggested as follows:
3. To investigate k2 independently, in order to truly understand how the rate of precipitation of an
inhibitor and free Fe(III)PPIX in solution plays a role in the formation of an inhibitor-haem complex,
which in turn may have an effect on β-haematin formation. The solubility of inhibitor-Fe(III)PPIX
complexes in aqueous pyridine is of high importance and differential solubility of β-haematin
inhibitors may provide significant insight in this regard. This data will improve the overall
understanding of the system and of the relationship between different processes involving Fe(III)PPIX.
The results presented in Chapter 5 further support the hypothesis that β-haematin inhibition is brought about
by direct adsorption of an inhibitor to preformed β-haematin crystal surfaces, however, subsequent
experimental proof is still required to further support this phenomenon independently. Future studies in this
regard include:
4. Infrared and/or solid-state UV-vis spectroscopic analyses and characterization of β-haematin crystals
after leaving samples exposed to an aqueous inhibitor solution, in order to probe the presence of an
inhibitor adsorbed to the preformed β-haematin crystal surface.
Stellenbosch University https://scholar.sun.ac.za
116
Chapter 7: References
1 World Health Organisation, 2014.
2 F. E. G. Cox, Clin. Microbiol. Rev., 2002, 15, 595–612.
3 F. E. G. Cox, Parasit. Vectors, 2010, 3, 5.
4 G. Harrison, Mosquitoes, malaria and man., John Murray, London, United Kingdom, 1978.
5 G. M. Lancisi, De noxiis paludum effuvius eorumque remediis, Salvioni, J M: Rome, 1717.
6 A. Laveran, Bull Mém Soc Méd Hôpitaux Paris, 1881, 17, 158–164.
7 A. Laveran, Trait. des Fiévres Palustres avec la Descr. des Microbes du Palud. Paris Doin, 1884.
8 A. F. A. King, Pop Sci, 1883, 23, 644–658.
9 P. Manson, J Linn Soc, 1878, 14, 304–311.
10 R. Ross, Memoirs With a Full Account of the Great Malaria Problem and Its Solution, 1923, vol. 13.
11 B. Grassi, Atti dei. Linncei. Mem., 1901, 3, 229–505.
12 K. Kirk, Physiol. Rev., 2001, 81, 495–537.
13 R. Carter and K. N. Mendis, Clin. Microbiol. Rev., 2002, 15, 564–594.
14 E. Ashley, R. McGready, S. Proux and F. Nosten, Travel Med. Infect. Dis., 2006, 4, 159–173.
15 L. H. Bannister, J. M. Hopkins, R. E. Fowler, S. Krishna and G. H. Mitchell, Parasitol. Today, 2000,
16, 427–433.
16 Y. Michalakis and F. Renaud, Nature, 2009, 462, 298–300.
17 K. K. Eggleson, K. L. Duffin and D. E. Goldberg, J. Biol. Chem., 1999, 274, 32411–32417.
18 M. Krugliak, J. Zhang and H. Ginsburg, Mol. Biochem. Parasitol., 2002, 119, 249–256.
19 R. Hayward, K. J. Saliba and K. Kirk, J. Cell Sci., 2006, 119, 1016–1025.
20 S. E. Francis, I. Y. Gluzman, A. Oksman, A. Knickerbocker, R. Mueller, M. L. Bryant, D. R.
Sherman, D. G. Russell and D. E. Goldberg, EMBO J., 1994, 13, 306–317.
21 I. Y. Gluzman, S. E. Francis, A. Oksman, C. E. Smith, K. L. Duffin and D. E. Goldberg, J. Clin.
Invest., 1994, 93, 1602–1608.
22 S. E. Francis, I. Y. Gluzman, A. Oksman, D. E. Goldberg and D. Banerjee, Mol. Biochem. Parasitol.,
1996, 83, 189–200.
Stellenbosch University https://scholar.sun.ac.za
117
23 P. J. Rosenthal, J. H. McKerrow, M. Aikawa, H. Nagasawa and J. H. Leech, J. Clin. Invest., 1988, 82,
1560–1566.
24 L. M. B. Ursos and P. D. Roepe, Med. Res. Rev., 2002, 22, 465–491.
25 T. J. Egan, J. M. Combrinck, J. Egan, G. R. Hearne, H. M. Marques, S. Ntenteni, B. T. Sewell, P. J.
Smith, D. Taylor, D. A. van Schalkwyk and J. C. Walden, Biochem. J., 2002, 365, 343–347.
26 T. J. Egan, Mol. Biochem. Parasitol., 2008, 157, 127–136.
27 P. L. Olliaro and Y. Yuthavong, Pharmacol. Ther., 1999, 81, 91–110.
28 M. F. Oliveira, J. C. P. D’Avila, C. R. Torres, P. L. Oliveira, A. J. Tempone, F. D. Rumjanek, C. M.
S. Braga, J. R. Silva, M. Dansa-Petretski, M. A. Oliveira, W. De Souza and S. T. Ferreira, Mol.
Biochem. Parasitol., 2000, 111, 217–221.
29 M. M. Chen, L. Shi and D. J. Sullivan, Mol. Biochem. Parasitol., 2001, 113, 1–8.
30 J. M. Pisciotta, E. L. Ponder, B. Fried and D. Sullivan, Int. J. Parasitol., 2005, 35, 1037–1042.
31 H. Meckel, Zeitschr f Psychiatr. IV, 1847, 198–226.
32 R. Virchow, Arch. fur Pathol. Anat., 1849, 2, 587–598.
33 W. H. Brown, J. Exp. Med., 1911, 13, 290–299.
34 C. D. Fitch and P. Kanjananggulpan, J. Biol. Chem., 1987, 262, 15552–15555.
35 A. F. Slater, W. J. Swiggard, B. R. Orton, W. D. Flitter, D. E. Goldberg, A. Cerami and G. B.
Henderson, Proc. Natl. Acad. Sci. U. S. A., 1991, 88, 325–329.
36 D. S. Bohle, R. E. Dinnebier, S. K. Madsen and P. W. Stephens, J. Biol. Chem., 1997, 272, 713–716.
37 S. Pagola, P. W. Stephens, D. S. Bohle, A. D. Kosar and S. K. Madsen, Nature, 2000, 404, 307–310.
38 A. Hamsik, Z. Physiol. Chem., 1936, 190.
39 R. Buller, M. L. Peterson, Ö. Almarsson and L. Leiserowitz, Cryst. Growth Des., 2002, 2, 553–562.
40 J. Gildenhuys, T. le Roex, T. J. Egan and K. A. de Villiers, J. Am. Chem. Soc., 2013, 135, 1037–1047.
41 E. Hempelmann and T. J. Egan, Trends Parasitol., 2002, 18, 11.
42 D. J. Sullivan, I. Y. Gluzman and D. E. Goldberg, Science, 1996, 271, 219–222.
43 C. Y. H. Choi, J. F. Cerda, C. Hsiu-An, G. T. Babcock and M. A. Marletta, Biochemistry, 1999, 38,
16916–16924.
44 A. Lynn, S. Chandra, P. Malhotra and V. S. Chauhan, FEBS Lett., 1999, 459, 267–271.
45 J. Ziegler, R. T. Chang, D. W. Wright, V. Pennsyl, R. V September, V. Re, M. Recei and V. January,
1999, 2395–2400.
46 V. Papalexis, M. A. Siomos, N. Campanale, X. G. Guo, G. Kocak, M. Foley and L. Tilley, Mol.
Biochem. Parasitol., 2001, 115, 77–86.
Stellenbosch University https://scholar.sun.ac.za
118
47 T. Akompong, M. Kadekoppala, T. Harrison, A. Oksman, D. E. Goldberg, H. Fujioka, B. U. Samuel,
D. Sullivan and K. Haldar, J. Biol. Chem., 2002, 277, 28923–28933.
48 G. S. Noland, N. Briones and D. J. Sullivan, Mol. Biochem. Parasitol., 2003, 130, 91–99.
49 D. J. Sullivan, Int. J. Parasitol., 2002, 32, 1645–1653.
50 M. Chugh, V. Sundararaman, S. Kumar, V. S. Reddy, W. A. Siddiqui, K. D. Stuart and P. Malhotra,
PNAS, 2013, 110, 5392–5397.
51 A. Dorn, R. Stoffel, H. Matile, A. Bubendorf and R. G. Ridley, Nature, 1995, 374, 269–271.
52 K. Bendrat, B. J. Berger and A. Cerami, Nature, 1995, 378, 138–139.
53 A. Dorn, S. R. Vippagunta, H. Matile, C. Jaquet, J. L. Vennerstrom and R. G. Ridley, Biochem.
Pharmacol., 1998, 55, 727–736.
54 C. D. Fitch, G. Z. Cai, Y. F. Chen and J. D. Shoemaker, Biochim. Biophys. Acta - Mol. Basis Dis.,
1999, 1454, 31–37.
55 K. E. Jackson, N. Klonis, D. J. P. Ferguson, A. Adisa, C. Dogovski and L. Tilley, Mol. Microbiol.,
2004, 54, 109–122.
56 I. Coppens and O. Vielemeyer, Int. J. Parasitol., 2005, 35, 597–615.
57 J. M. Pisciotta, I. Coppens, A. K. Tripathi, P. F. Scholl, J. Shuman, S. Bajad, V. Shulaev and D. J.
Sullivan, Biochem. J., 2007, 402, 197–204.
58 M. F. Oliveira, S. W. Kycia, A. Gomez, A. J. Kosar, D. S. Bohle, E. Hempelmann, D. Menezes, M.
A. Vannier-Santos, P. L. Oliveira and S. T. Ferreira, FEBS Lett., 2005, 579, 6010–6016.
59 T. J. Egan, D. C. Ross and P. A. Adams, FEBS Lett., 1994, 352, 54–57.
60 N. Basilico, D. Monti, P. Olliaro and D. Taramelli, FEBS Lett., 1997, 409, 297–299.
61 N. Basilico, E. Pagani, D. Monti, P. Olliaro and D. Taramelli, J. Antimicrob. Chemother., 1998, 42,
55–60.
62 D. S. Bohle, Biochem. Biophys. Res. Commun., 1993, 193, 504–508.
63 P. A. Adams, T. J. Egan, D. C. Ross†, J. Silver and P. J. Marsh, Biochem. J., 1996, 27, 25–27.
64 T. J. Egan, W. W. Mavuso and K. K. Ncokazi, Biochemistry, 2001, 40, 204–213.
65 M. J. Avrami, J. Chem. Phys., 1939, 7, 1103–1112.
66 M. J. Avrami, J. Chem. Phys., 1940, 8, 212–224.
67 T. J. Egan and M. G. Tshivhase, Dalton Trans., 2006, 5024–5032.
68 M. D. Carter, V. V Phelan, R. D. Sandlin, B. O. Bachmann and D. W. Wright, Comb. Chem. High
Throughput Screen., 2010, 13, 285–292.
69 R. D. Sandlin, M. D. Carter, P. J. Lee, J. M. Auschwitz, S. E. Leed, J. D. Johnson and D. W. Wright,
Antimicrob. Agents Chemother., 2011, 55, 3363–3369.
Stellenbosch University https://scholar.sun.ac.za
119
70 R. D. Sandlin, K. Y. Fong, K. J. Wicht, H. M. Carrell, T. J. Egan and D. W. Wright, Int. J. Parasitol.
Drugs Drug Resist., 2014, 4, 316–325.
71 N. T. Huy, A. Maeda, D. T. Uyen, D. T. X. Trang, M. Sasai, T. Shiono, T. Oida, S. Harada and K.
Kamei, Acta Trop., 2007, 101, 130–138.
72 R. Stiebler, A. N. Hoang, T. J. Egan, D. W. Wright and M. F. Oliveira, PLoS One, 2010, 5, 1–10.
73 T. J. Egan, J. Y. J. Chen, K. A. de Villiers, T. E. Mabotha, K. J. Naidoo, K. K. Ncokazi, S. J.
Langford, D. McNaughton, S. Pandiancherri and B. R. Wood, FEBS Lett., 2006, 580, 5105–5110.
74 A. N. Hoang, K. K. Ncokazi, K. A. de Villiers, D. W. Wright and T. J. Egan, Dalton Trans., 2010, 39,
1235–1244.
75 M. A. Ketchum, K. N. Olafson, E. V. Petrova, J. D. Rimer and P. G. Vekilov, J. Chem. Phys., 2013,
139.
76 P. G. Vekilov, J. D. Rimer, K. N. Olafson and M. A. Ketchum, CrystEngComm, 2015.
77 N. T. Huy, Y. Shima, A. Maeda, T. T. Men, K. Hirayama, A. Hirase, A. Miyazawa and K. Kamei,
PLoS One, 2013, 8, 1–7.
78 J. Shack and W. M. Clarke, J. Biol. Chem., 1947, 171, 143–187.
79 H. Davies, J. Biol. Chem., 1938, 135, 597–622.
80 S. B. Brown, P. Jones and I. R. Lantzke, Nature, 1969, 223, 960–961.
81 B. S. B. Brown, T. C. Dean and P. Jones, 1970, 733–739.
82 K. A. de Villiers, C. H. Kaschula, T. J. Egan and H. M. Marques, J. Biol. Inorg. Chem., 2007, 12,
101–117.
83 D. H. O’Keeffe, C. H. Barlow, G. A. Smythe, W. H. Fuchsman, T. H. Moss, H. R. Lilienthal and W.
S. Caughey, Bioinorg. Chem., 1975, 5, 125–147.
84 D. L. Budd, G. N. La Mar, K. C. Langry, K. M. Smith and R. Nayyir-Mazhir, J. Am. Chem. Soc.,
1979, 101, 6091.
85 D. F. Koenig, Acta Crystallogr, 1965, 18, 663–673.
86 B. Cheng, M. K. Safo, R. D. Orosz, C. A. Reed, P. G. Debrunner and W. R. Scheidt, 1994, 33, 1319–
1324.
87 C. Asher, K. A. de Villiers and T. J. Egan, Inorg. Chem., 2009, 48, 7994–8003.
88 K. A. de Villiers, H. M. Marques and T. J. Egan, J. Inorg. Biochem., 2008, 102, 1660–1667.
89 K. A. de Villiers, M. Osipova, T. E. Mabotha, I. Solomonov, Y. Feldman, K. Kjaer, I. Weissbuch, T.
J. Egan and L. Leiserowitz, Cryst. Growth Des., 2009, 9, 626–632.
90 K. J. Saliba, P. I. Folb and P. J. Smith, Biochem. Pharmacol., 1998, 56, 313–320.
91 A. F. Slater, Pharmacol. Ther., 1993, 57, 203–35.
Stellenbosch University https://scholar.sun.ac.za
120
92 A. Yayon, Z. I. Cabantchik and H. Ginsburg, EMBO J., 1984, 3, 2695–2700.
93 C. P. Sanchez, W. D. Stein and M. Lanzer, Trends Parasitol., 2007, 23, 332–339.
94 S. R. Meshnick and M. J. Dobson, The history of anti-malarial drugs., Humana Press Inc., Totowa,
NJ, 2001, vol. 6.
95 D. C. Smith, J. Hist. Med. Allied Sci., 1976, 31, 343–367.
96 P. F. Russell, Man’s mastery of malaria, Oxford University Press, London, 1955.
97 G. Gramiccia, The life of Charles Ledger (1818-1905), London: Macmillan, 1988.
98 M. Foley and L. Tilley, Pharmacol. Ther., 1998, 79, 55–87.
99 D. Greenwood, J. Antimicrob. Chemother., 1995, 36, 857–872.
100 C. Ohnmacht and A. Patel, J. Med. Chem., 1971, 14, 926–928.
101 T. R. Sweeney, Drugs with quinine-like action In. Antimalarial drugs II. Current antimalarials and
new drug developments, Springer-Verlag, Berlin, Heidelberg, 1984.
102 C. M. Trenholme, R. L. Williams, R. E. Desjardins, H. Frischer, P. E. Carson, K. H. Rieckmann and
C. J. Canfield, Science (80-. )., 1975, 190, 792–794.
103 K. J. Palmer, S. M. Holliday and R. N. Brogden, Drugs, 1993, 45, 430–475.
104 M. Foley and L. Tilley, Int. J. Parasitol., 1997, 27, 231–240.
105 D. J. Krogstad, I. Y. Gluzman, D. E. Kyle, a M. Oduola, S. K. Martin, W. K. Milhous and P. H.
Schlesinger, Science, 1987, 238, 1283–1285.
106 D. A. Fidock, T. Nomura, A. K. Talley, R. A. Cooper, S. M. Dzekunov, M. T. Ferdig, L. M. B. Ursos,
A. S. Sidhu, B. Naudé, K. W. Deitsh, X. Z. Su, J. C. Wootton, P. D. Roepe and T. E. Wellems, Mol
Cell., 2000, 6, 861–871.
107 A. F. Cowman, K. S, D. Galatis and J. G. Culvenor, J. Cell Biol., 1991, 113, 1033–1042.
108 T. E. Wellems, a Walker-Jonah and L. J. Panton, Proc. Natl. Acad. Sci. U. S. A., 1991, 88, 3382–
3386.
109 A. F. Cowman, D. Galatis and J. K. Thompson, Proc. Natl. Acad. Sci. U. S. A., 1994, 91, 1143–1147.
110 M. T. Ferdig, R. a. Cooper, J. Mu, B. Deng, D. a. Joy, X. Z. Su and T. E. Wellems, Mol. Microbiol.,
2004, 52, 985–997.
111 I. Petersen, S. J. Gabryszewski, G. L. Johnston, S. K. Dhingra, A. Ecker, R. E. Lewis, M. J. de
Almeida, J. Straimer, P. H. Henrich, E. Palatulan, D. J. Johnson, O. Coburn-Flynn, C. Sanchez, A. M.
Lehane, M. Lanzer and D. a. Fidock, Mol. Microbiol., 2015, 97, n/a–n/a.
112 A. Ecker, A. M. Lehane, J. Clain and D. a. Fidock, Trends Parasitol., 2012, 28, 504–514.
113 A. Dorn, S. R. Vippagunta, H. Matile, C. Jaquet, J. L. Vennerstrom and R. G. Ridley, Biochem.
Pharmacol., 1998, 55, 727–736.
Stellenbosch University https://scholar.sun.ac.za
121
114 D. J. Sullivan, I. Y. Gluzman, D. G. Russell and D. E. Goldberg, Proc. Natl. Acad. Sci. U. S. A., 1996,
93, 11865–11870.
115 A. F. Slater and A. Cerami, Nature, 1992, 355, 167–169.
116 S. N. Cohen, K. O. Phifer and K. L. Yielding, Nature, 1964, 202, 805–806.
117 A. C. Chou, R. Chevli and C. D. Fitch, Biochemistry, 1980, 19, 1543–1549.
118 T. J. Egan, J. Inorg. Biochem., 2006, 100, 916–926.
119 H. M. Marques, O. Q. Munro and M. L. Crawcour, Inorganica Chim. Acta, 1992, 196, 221–229.
120 H. M. Marques, Inorganica Chim. Acta, 1991, 190, 291–295.
121 J. L. Hoard, M. J. Hamor and W. S. Caughey, J. Am. Chem. Soc., 1965, 87, 2312–2319.
122 C. Lecomte, D. L. Chadwick, P. Coppens and E. D. Stevens, 1983, 2982–2992.
123 M. R. Johnson, W. K. Seok, W. Ma, C. Slebodnick, K. M. Wilcoxen and J. A. Ibers, J. Org. Chem.,
1996, 61, 3298–3303.
124 L. B. Casabianca, D. An, J. K. Natarajan, J. N. Alumasa, P. D. Roepe, C. Wolf and A. C. De Dios,
2008, 47, 6077–6081.
125 L. B. Casabianca, J. B. Kallgren, J. K. Natarajan, J. N. Alumasa, P. D. Roepe, C. Wolf and A. C. De
Dios, J. Inorg. Biochem., 2009, 103, 745–748.
126 K. A. de Villiers, J. Gildenhuys and T. le Roex, ACS Chem. Biol, 2012, 7, 666–671.
127 J. K. Gildenhuys, C. J. Sammy, R. Muller, V. Streltsov, T. le Roex, D. Kuter and K. A. de Villiers,
Dalt. Trans., 2015, In Press, 9–12.
128 A. C. de Dios, R. Tycko, L. M. B. Ursos and P. D. Roepe, J. Phys. Chem. A, 2003, 107, 5821–5825.
129 A. Leed, K. Dubay, L. M. B. Ursos, D. Sears, A. C. De Dios and P. D. Roepe, Biochemistry, 2002,
41, 10245–10255.
130 J. K. Natarajan, J. N. Alumasa, K. Yearick, K. A. Ekoue-kovi, L. B. Casabianca, A. C. De Dios, C.
Wolf and P. D. Roepe, J. Med. Chem, 2008, 51, 3466–3479.
131 K. F. Schwedhelm, M. Horstmann, J. H. Faber, Y. Reichert, M. Buchner, G. Bringmann and C.
Faber, Open Spectrosc. J., 2008, 2, 10–18.
132 G. T. Webster, D. Mcnaughton and B. R. Wood, J. Phys. Chem. B, 2009, 113, 6910–6916.
133 S. Moreau, B. Perly, C. Chachaty and C. Deleuze, Biochim. Biophys. Acta, 1985, 840, 107–116.
134 A. M. D. S. D. Acharige and M. Durrant, Transit. Met Chem, 2014, 39, 721–726.
135 D. Kuter, V. Streltsov, N. Davydova, G. A. Venter, K. J. Naidoo and T. J. Egan, J. Inorg. Biochem.,
2015.
136 D. Kuter, S. J. Benjamin and T. J. Egan, J. Inorg. Biochem., 2014, 133, 40–49.
Stellenbosch University https://scholar.sun.ac.za
122
137 E. L. Dodd and D. S. Bohle, Chem. Commun., 2014, 50, 13765–13768.
138 M. S. Walczak, K. Lawniczak-Jablonska, A. Wolska, A. Sienkiewicz, L. Suarez, A. J. Kosar and D.
S. Bohle, J. Phys. Chem. B, 2011, 115, 1145–1150.
139 M. S. Walczak, K. Lawniczak-Jablonska, A. Wolska, M. Sikora, A. Sienkiewicz, L. Suarez, A. J.
Kosar, M.-J. Bellemare and D. S. Bohle, J. Phys. Chem. B, 2011, 115, 4419–4426.
140 N. Basilico, E. Pagani, D. Monti, P. Olliaro and D. Taramelli, J. Antimicrob. Chemother., 1998, 42,
55–60.
141 R. Baelmans, E. Deharo, G. Bourdy, V. Munoz, C. Quenevo, M. Sauvain and H. Ginsburg, J.
Ethnopharmacol., 2000, 73, 271–275.
142 S. Parapini, N. Basilico, E. Pasini, T. J. Egan, P. Olliaro, D. Taramelli and D. Monti, Exp. Parasitol.,
2000, 96, 249–256.
143 J. Ziegler, L. Pasierb, K. a. Cole and D. W. Wright, J. Inorg. Biochem., 2003, 96, 478–486.
144 M. Kalkanidis, N. Klonis, L. Tilley and L. W. Deady, Biochem. Pharmacol., 2002, 63, 833–842.
145 K. K. Ncokazi and T. J. Egan, Anal. Biochem., 2005, 338, 306–319.
146 K. A. Cole, J. Ziegler, C. A. Evans and D. W. Wright, J. Inorg. Biochem., 2000, 78, 109–115.
147 S. R. Hawley, P. G. Bray, M. Mungthin, J. D. Atkinson, P. M. O’Neill and S. a. Ward, Antimicrob.
Agents Chemother., 1998, 42, 682–686.
148 E. Deharo, R. N. García, P. Oporto, a. Gimenez, M. Sauvain, V. Jullian and H. Ginsburg, Exp.
Parasitol., 2002, 100, 252–256.
149 C. R. Chong and D. J. Sullivan, Biochem. Pharmacol., 2003, 66, 2201–2212.
150 T. J. Egan and K. K. Ncokazi, J. Inorg. Biochem., 2005, 99, 1532–1539.
151 R. F. Pasternack, B. Munda, A. Bickford, E. J. Gibbs and L. M. Scolaro, J. Inorg. Biochem., 2010,
104, 1119–1124.
152 J. Gildenhuys, Stellenbosch University: PhD Thesis, 2013.
153 I. Solomonov, M. Osipova, Y. Feldman, C. Baehtz, K. Kjaer, I. K. Robinson, G. T. Webster, D.
McNaughton, B. R. Wood, I. Weissbuch and L. Leiserowitz, J. Am. Chem. Soc., 2007, 129 , 2615–
2627.
154 K. A. de Villiers, M. Osipova, T. E. Mabotha, I. Solomonov, Y. Feldman, K. Kjaer, I. Weissbuch, T.
J. Egan and L. Leiserowitz, Cryst. Growth Des., 2009, 9, 626–632.
155 D. S. Bohle, A. D. Kosar and P. W. Stephens, Acta Crystallogr. Sect. D Biol. Crystallogr., 2002, 58,
1752–1756.
156 I. Solomonov, M. Osipova, Y. Feldman, C. Baehtz, K. Kjaer, I. K. Robinson, G. T. Webster, D.
McNaughton, B. R. Wood, I. Weissbuch and L. Leiserowitz, J. Am. Chem. Soc., 2007, 129 , 2615–
2627.
157 T. E. Wellems and C. V Plowe, J. Infect. Dis., 2001, 184, 770–776.
Stellenbosch University https://scholar.sun.ac.za
123
158 C. H. Kaschula, T. J. Egan, R. Hunter, N. Basilico, S. Parapini, D. Taramelli, E. Pasini and D. Monti,
J. Med. Chem., 2002, 45, 3531–3539.
159 R. Muller, Personal Communication, 2015.
160 J. M. Combrinck, Personal Communication, 2015.
161 P. G. Kremsner and S. Krishna, Lancet, 2004, 364, 285–294.
162 MarvinSketch, 5.5.1.0, ChemAxon Ltd., Budapest, 2011.
163 K. J. Wicht, Personal Communication, 2015.
164 D. A. Skoog, D. M. West, F. J. Holler and S. R. Crouch, Fundamentals of Analytical Chemistry,
Thomson Brooks/Cole, 2004.
165 I. Langmuir, J. Am. Chem. Soc., 1916, 38, 2221–2295.
166 R. Tseng, F. Wu and R. Juang, Carbon., 2002, 41, 487-495.
Stellenbosch University https://scholar.sun.ac.za


![Flexible Load Balancing with Multi-dimensional State-space Collapse: Throughput … · 2020. 4. 28. · Given a throughput optimal load balancing policy, if there exists an 2(0;1]](https://static.fdocument.org/doc/165x107/60f8d6ad82289657c10a2577/flexible-load-balancing-with-multi-dimensional-state-space-collapse-throughput.jpg)