
©TNS 2014 3 - esvep.gr total 6.63 Head&Shoulders 8.70 ... Coca -Cola Colgate Nescafe Ariel Soupline...
69
©TNS 2014 1 Helena Chari | TNS @helena_chari Συνέδριο ΕΣΒΕΠ 26.2.2014
Transcript of ©TNS 2014 3 - esvep.gr total 6.63 Head&Shoulders 8.70 ... Coca -Cola Colgate Nescafe Ariel Soupline...

©TNS 2014 1
Helena Chari | TNS
@helena_chariΣυνέδριο ΕΣΒΕΠ
26.2.2014
Living in a half-built house
©TNS 2014 2

©TNS 2014 3
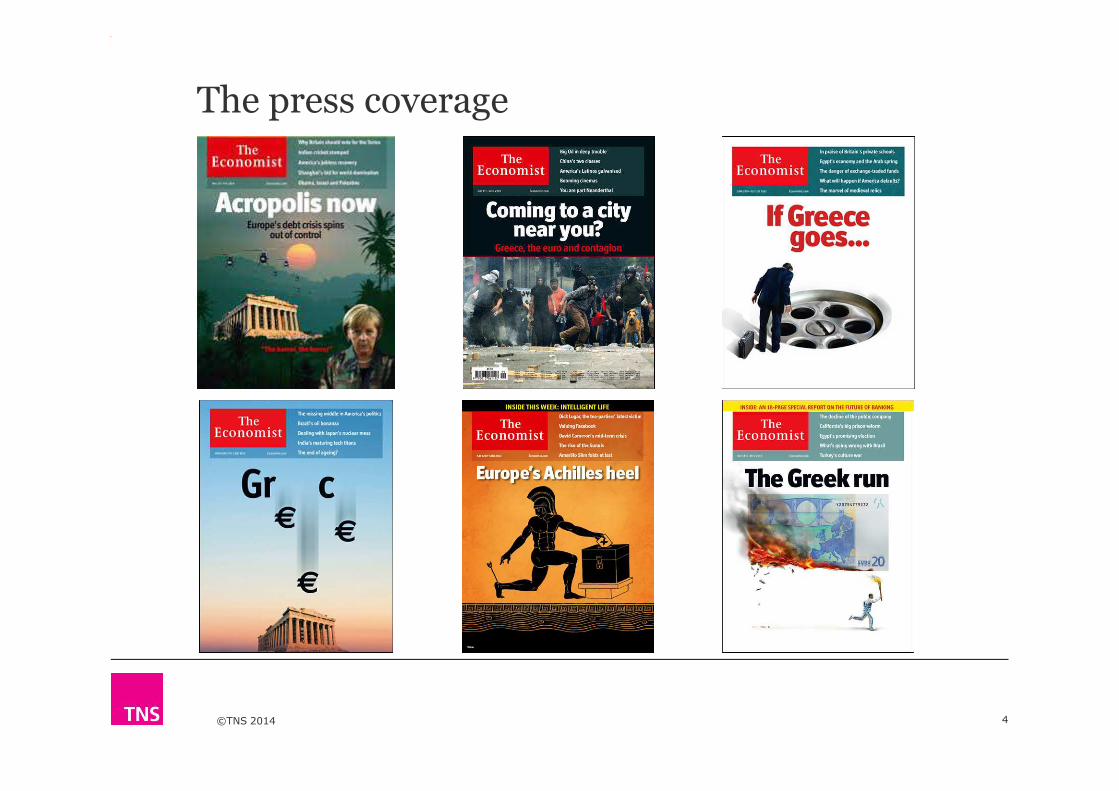
The press coverage
©TNS 2014 4
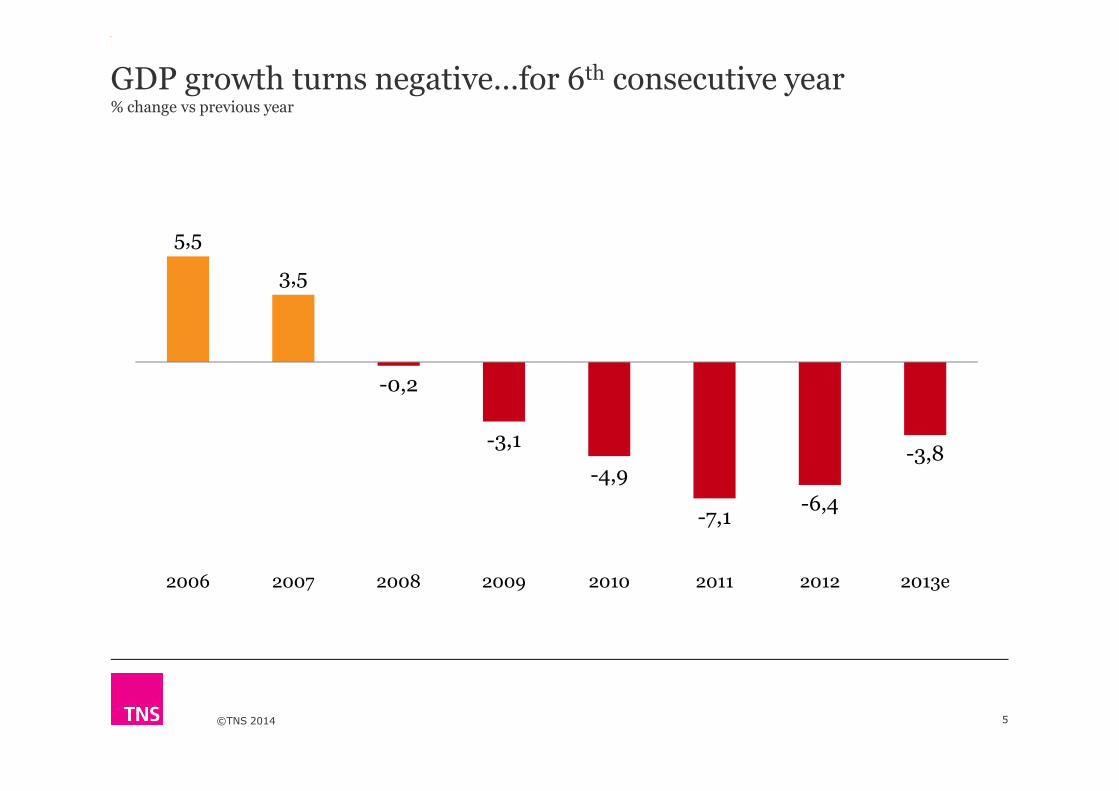
GDP growth turns negative…for 6th consecutive year% change vs previous year
5,5
3,5
-0,2
©TNS 2014 5
-0,2
-3,1
-4,9
-7,1-6,4
-3,8
2006 2007 2008 2009 2010 2011 2012 2013e

-40%gross disposable income
©TNS 2014 6
Source: ELSTAT
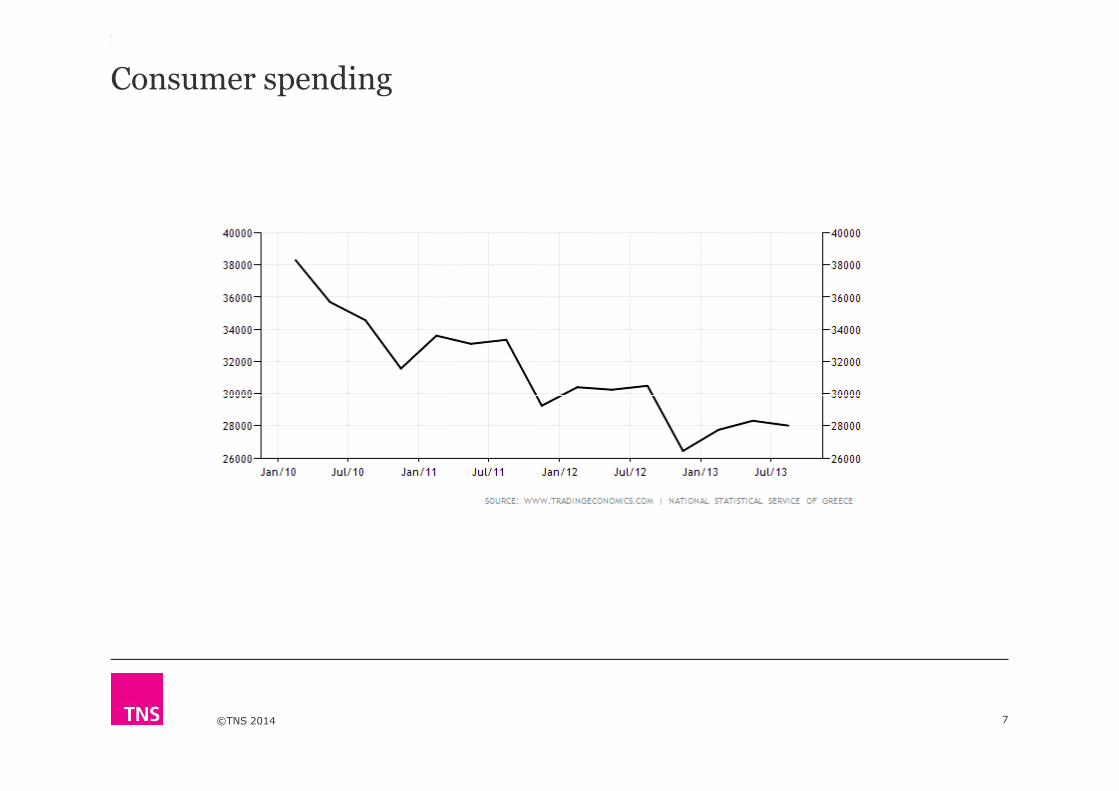
Consumer spending
©TNS 2014 7
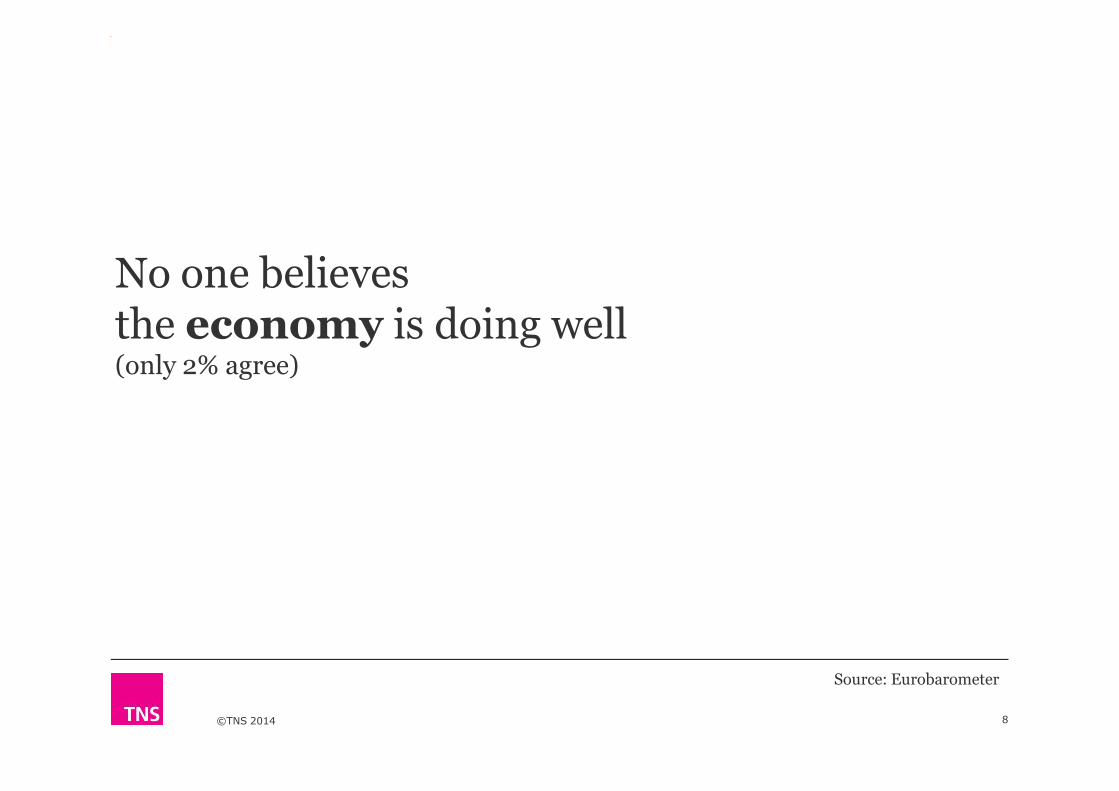
No one believes the economy is doing well(only 2% agree)
©TNS 2014 8
Source: Eurobarometer
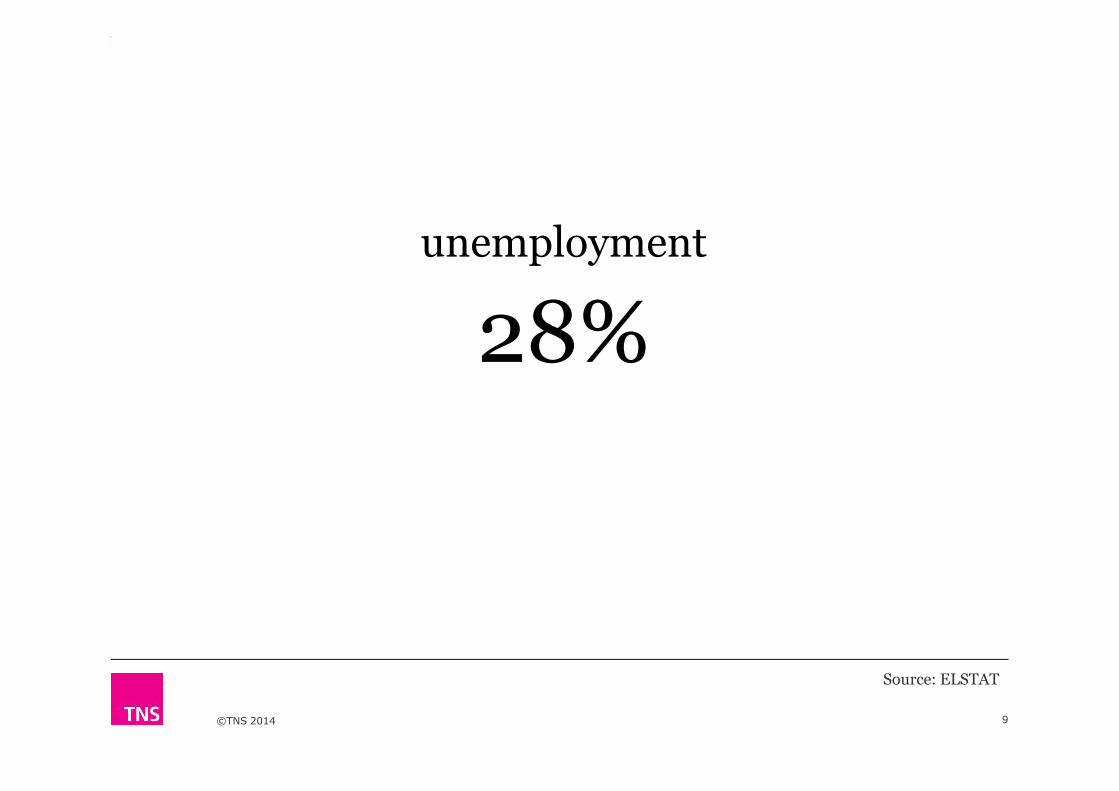
28%unemployment
©TNS 2014 9
Source: ELSTAT
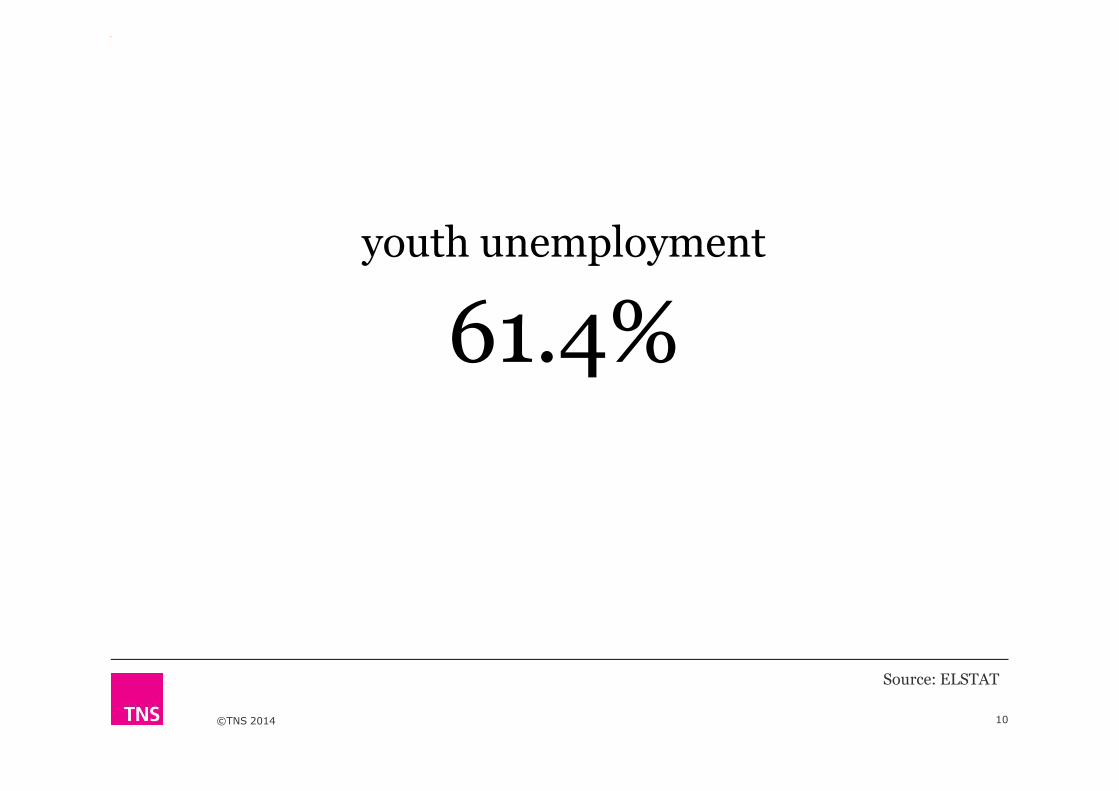
61.4%youth unemployment
©TNS 2014 10
Source: ELSTAT
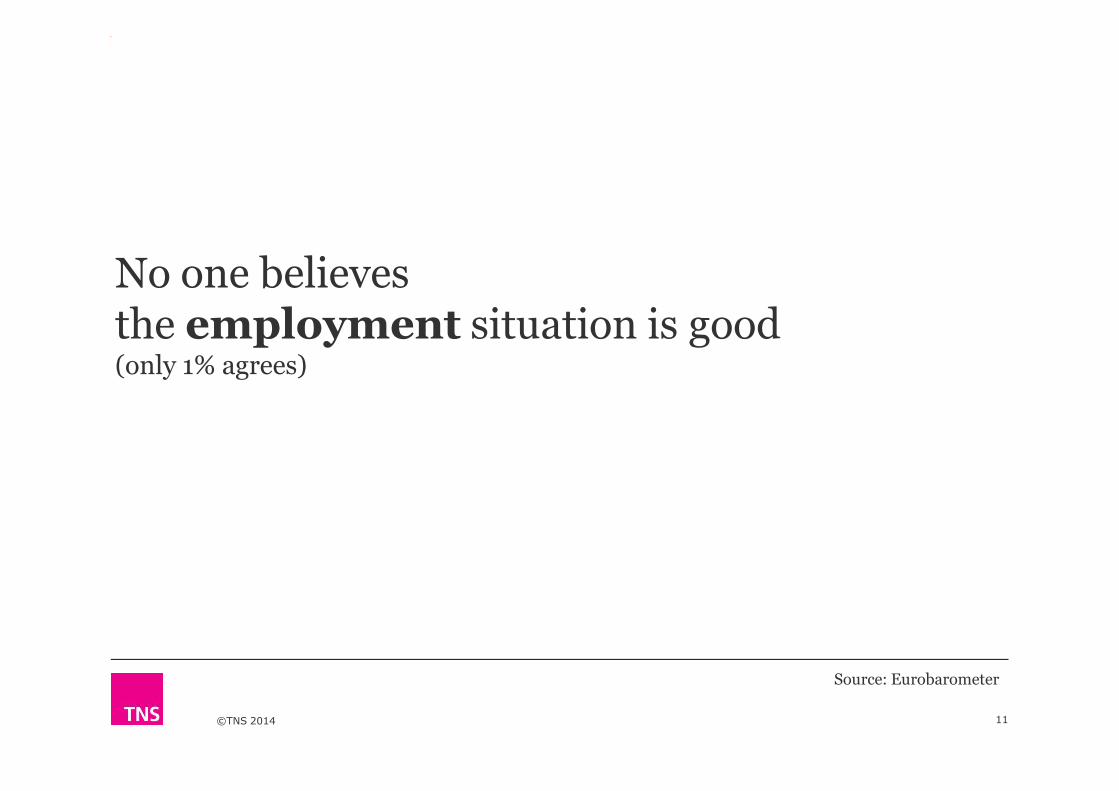
No one believes the employment situation is good(only 1% agrees)
©TNS 2014 11
Source: Eurobarometer

17
34
49
28
39
59
4
10
12
15
20
Political parties
Government
Parliament
Television
The UN
The EU
2008
2013
Levels of trust have hit the floor (except for the Internet)‘tend to trust’ - %
©TNS 2014 12
59
30
35
48
33
21
23
23
32
38
The EU
Regional/Local public authorities
The press
Radio
Internet
2013
Source: Eurobarometer 69 & 80

©TNS 2014 13

46
3732
36 38
Spring '11 Autumn '11 Autumn '12 Spring '13 Autumn '13
Satisfaction with life (total 'satisfied')
26
19 1821 22
Personal job situation (total 'good')
How we currently see things
©TNS 2014 14
Spring '11 Autumn '11 Autumn '12 Spring '13 Autumn '13
36
24 22 22
29
Spring '11 Autumn '11 Autumn '12 Spring '13 Autumn '13
Financial situation of h/h (total 'good')
Source: Eurobarometer

4661 57
46 42
Spring '11 Autumn '11 Autumn '12 Spring '13 Autumn '13
Your life in general (total 'worse')
30
4236 35
30
Personal job situation (total 'worse')
What we expect in 12 months
©TNS 2014 15
Spring '11 Autumn '11 Autumn '12 Spring '13 Autumn '13
5967
6257
52
Spring '11 Autumn '11 Autumn '12 Spring '13 Autumn '13
Financial situation of h/h (total 'worse')
Source: Eurobarometer

79 82 81
68 70
Spring '11 Autumn '11 Autumn '12 Spring '13 Autumn '13
Employment situation in Greece (total 'worse')
We also expect things to be less worse for the economy & unemployment
©TNS 2014 16
7578 76
62 63
Spring '11 Autumn '11 Autumn '12 Spring '13 Autumn '13
Situation of Greek economy (total 'worse')
Source: Eurobarometer
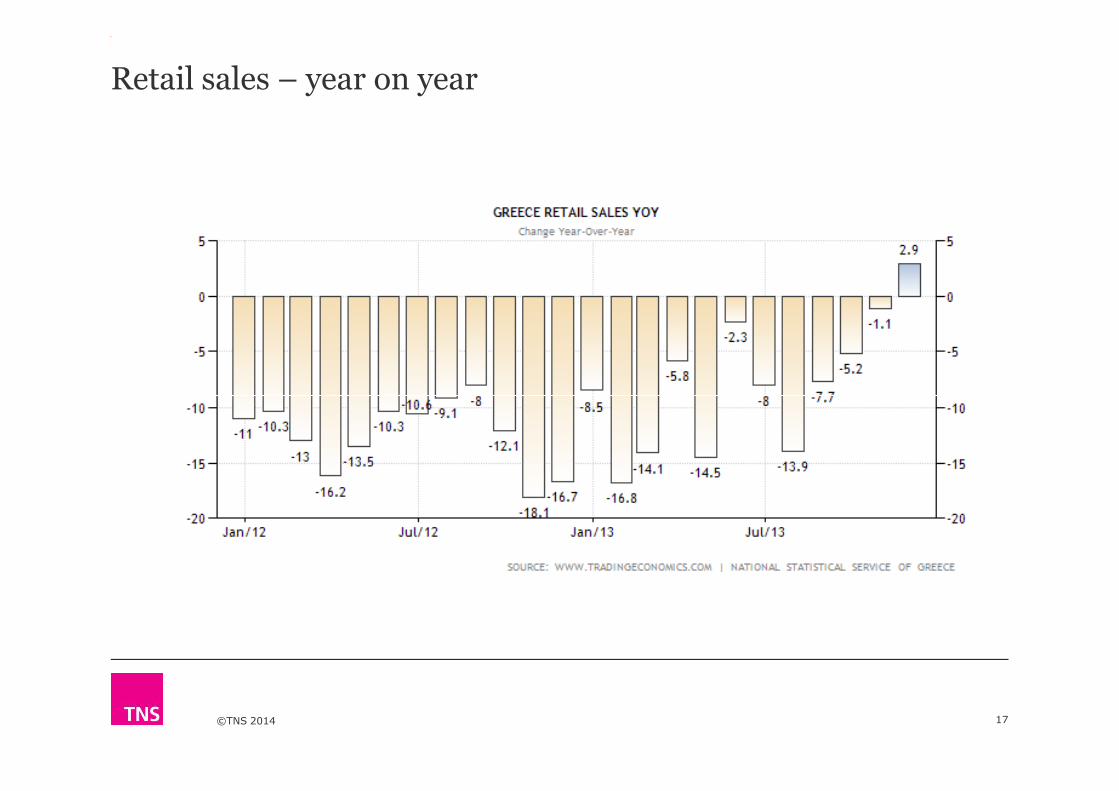
Retail sales – year on year
©TNS 2014 17

Retail sales – year on year
©TNS 2014 18
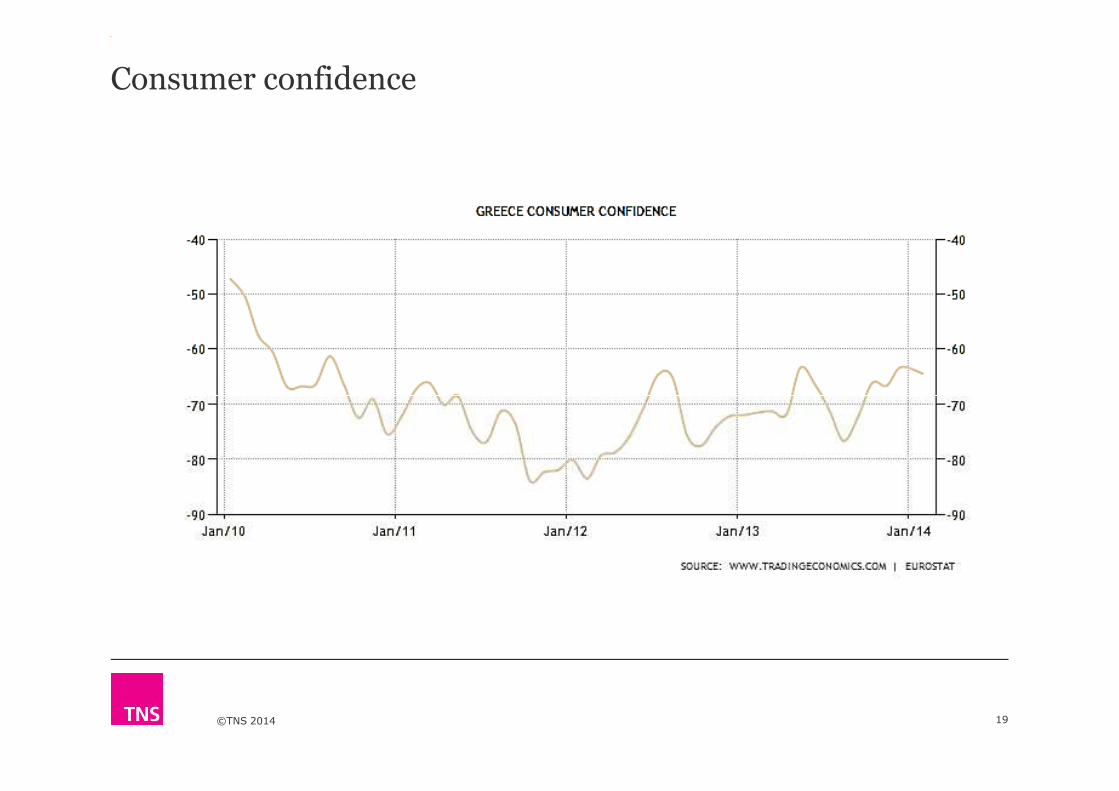
Consumer confidence
©TNS 2014 19
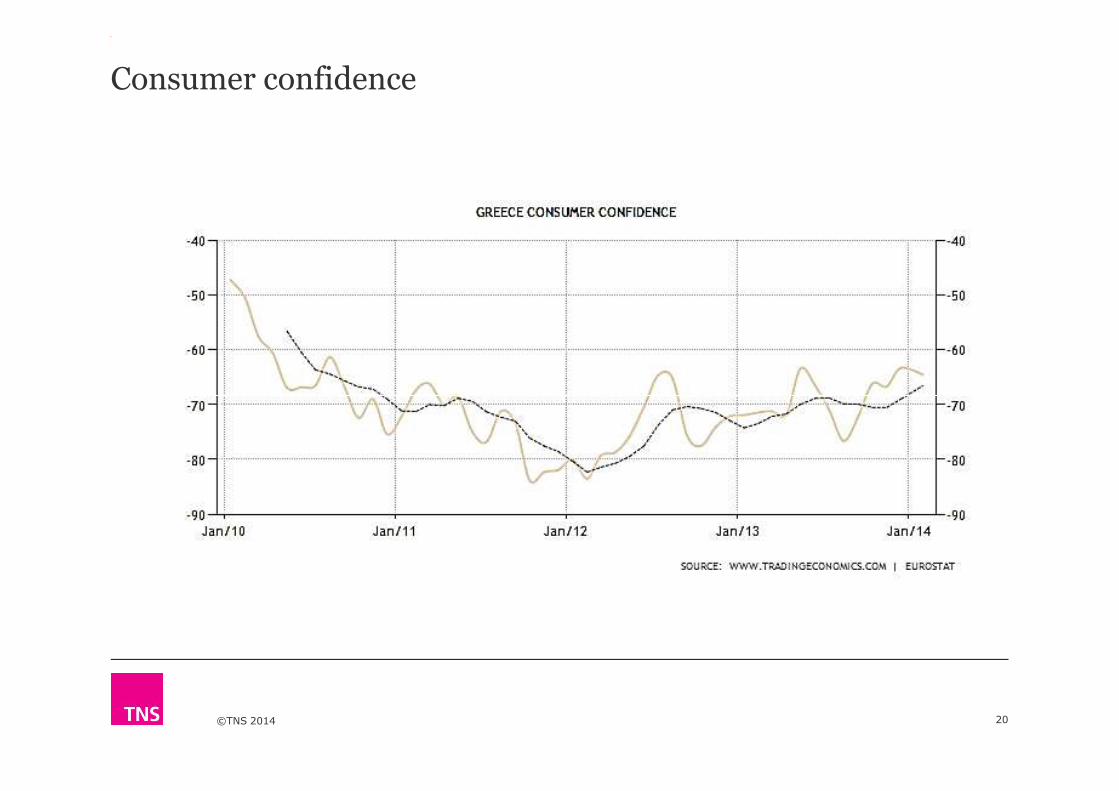
Consumer confidence
©TNS 2014 20
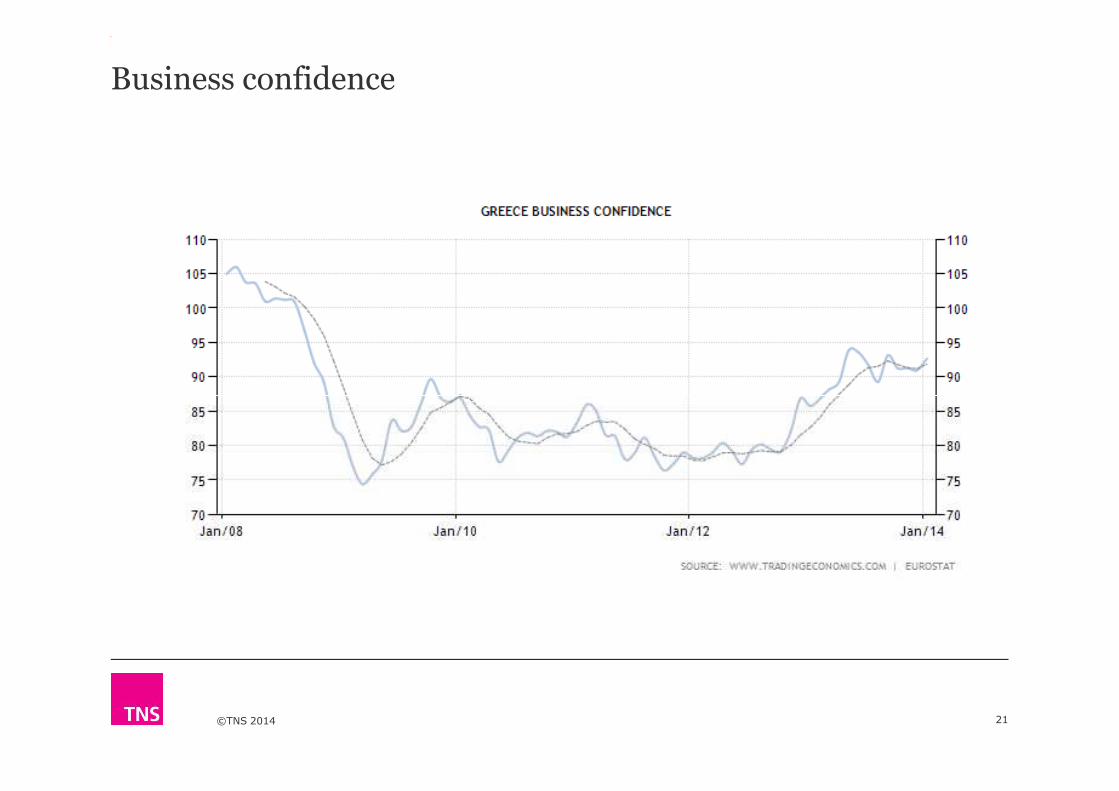
Business confidence
©TNS 2014 21
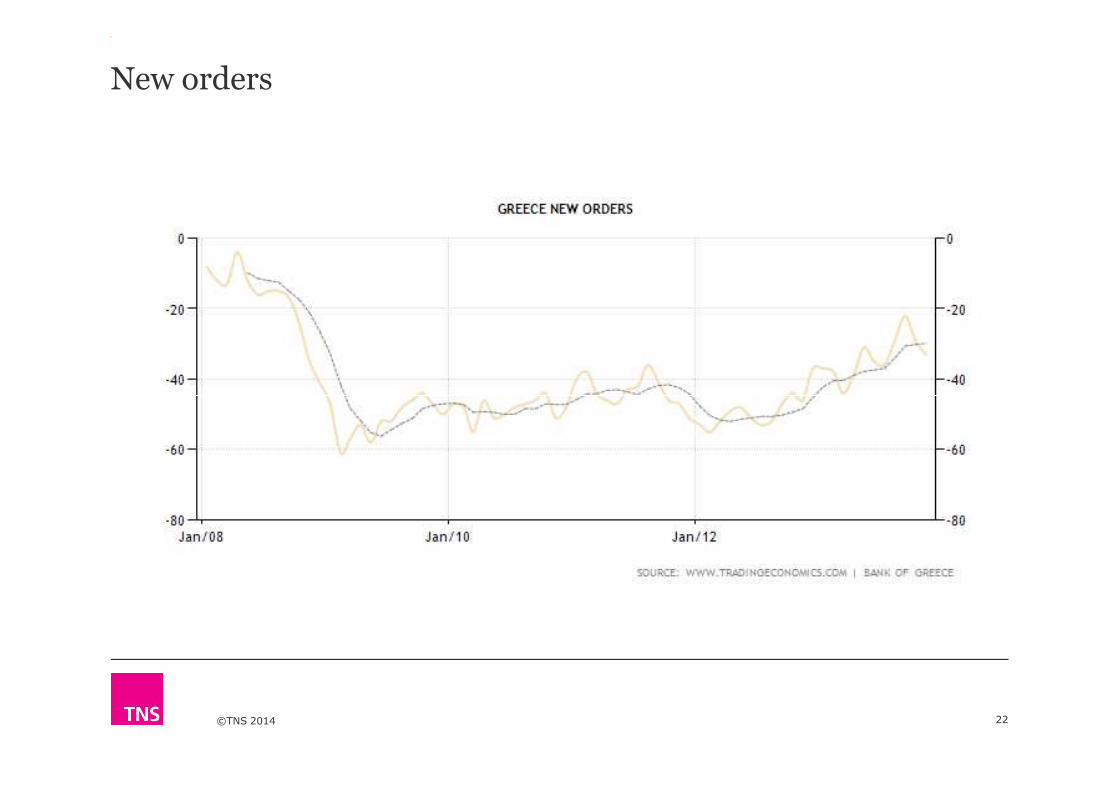
New orders
©TNS 2014 22

Manufacturing PMI
©TNS 2014 23

©TNS 2014 24
©TNS 2014 25
What has been the consumer reaction?
©TNS 2014 26

Need to have > Nice to have
©TNS 2014
Growing trend of categories decreasing in penetration
Source: TNS/Kantar Worldpanel
Consumers have spent less (vs 2012)
©TNS 2014 28
Source: TNS/Kantar Worldpanel
Consumers have bought less (vs 2012)
©TNS 2014 29
Source: TNS/Kantar Worldpanel
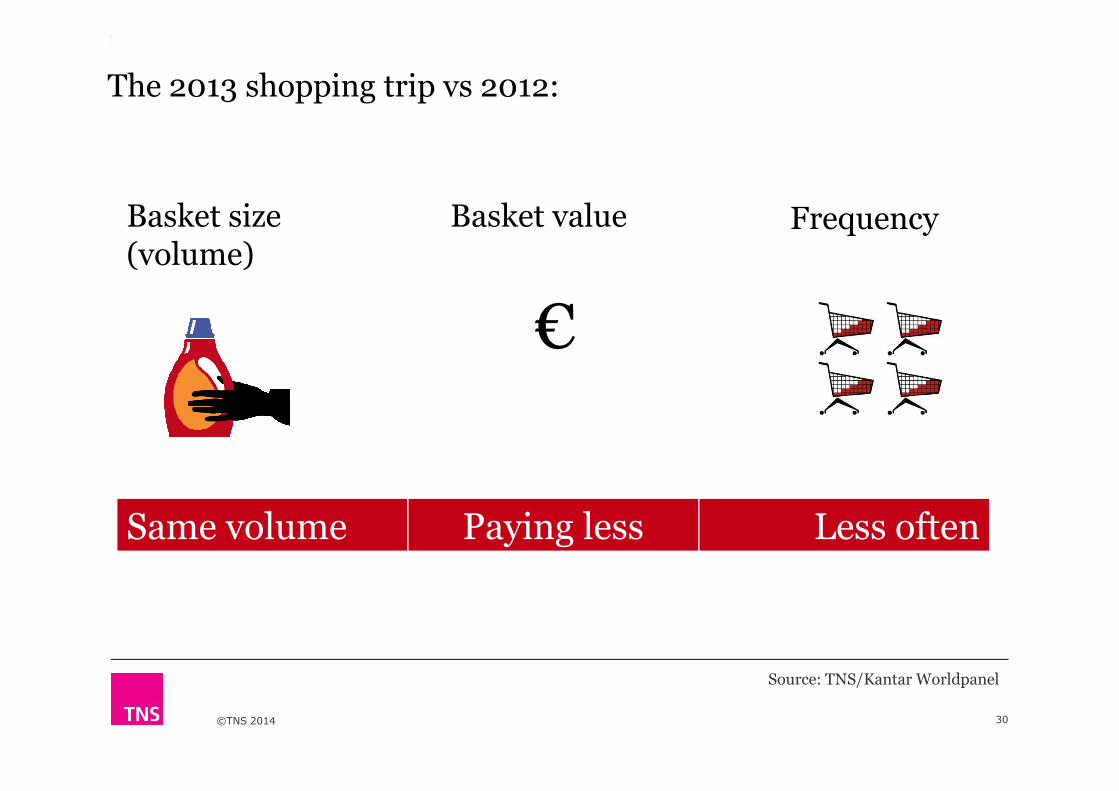
Basket value
€
Frequency
€
The 2013 shopping trip vs 2012:
Basket size(volume)
©TNS 2014 30
Same volume Paying less Less often
Source: TNS/Kantar Worldpanel
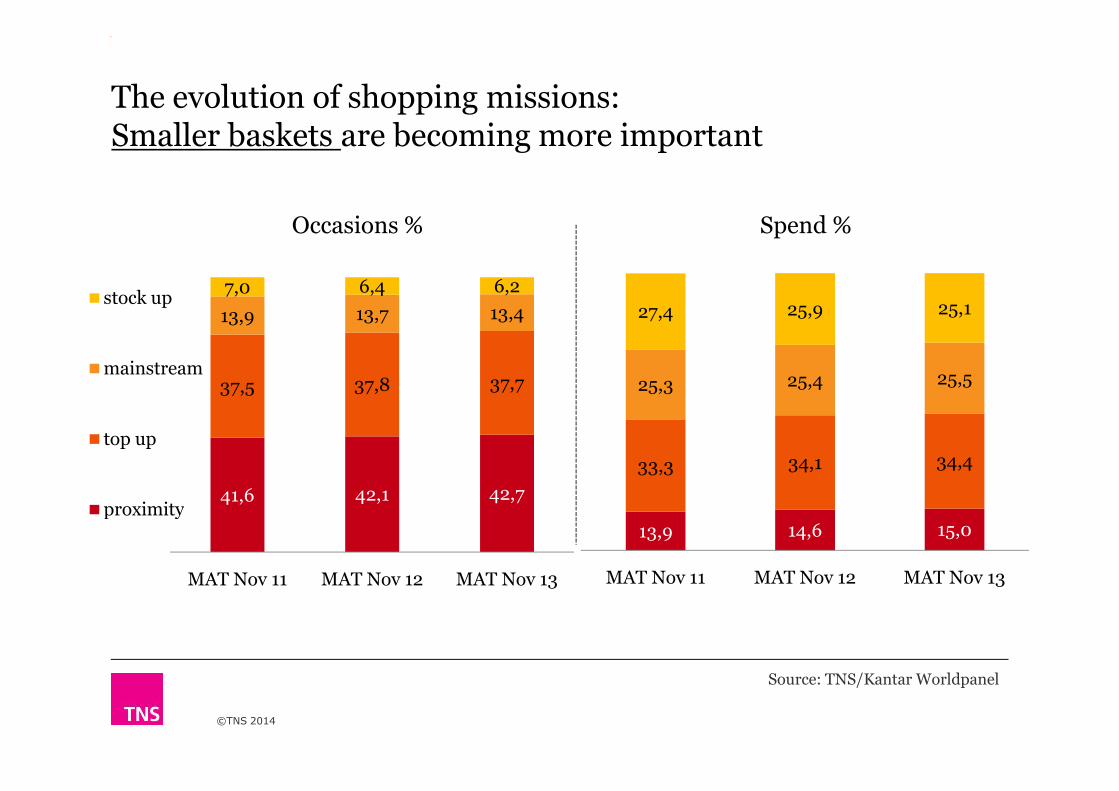
37,5 37,8 37,7
13,9 13,7 13,4
7,0 6,4 6,2stock up
mainstream25,3 25,4 25,5
27,4 25,9 25,1
Occasions % Spend %
The evolution of shopping missions:Smaller baskets are becoming more important
©TNS 2014
41,6 42,1 42,7
37,5
MAT Nov 11 MAT Nov 12 MAT Nov 13
top up
proximity13,9 14,6 15,0
33,3 34,1 34,4
MAT Nov 11 MAT Nov 12 MAT Nov 13
Source: TNS/Kantar Worldpanel

1. are the only shopping mission maintaining frequency
Smaller baskets …
2. have significant growth in packs/trip
3. are flat in spend/trip
©TNS 2014
Frequency Packs/trip Spend/trip
MATNov 11
MATNov 12
MATNov 13
MATNov 11
MATNov 12
MATNov 13
MATNov 11
MATNov 12
MATNov 13
38.7 39.4 39.5 3.69 3.7 3.81 6.24 6.19 6.18
Source: TNS/Kantar Worldpanel
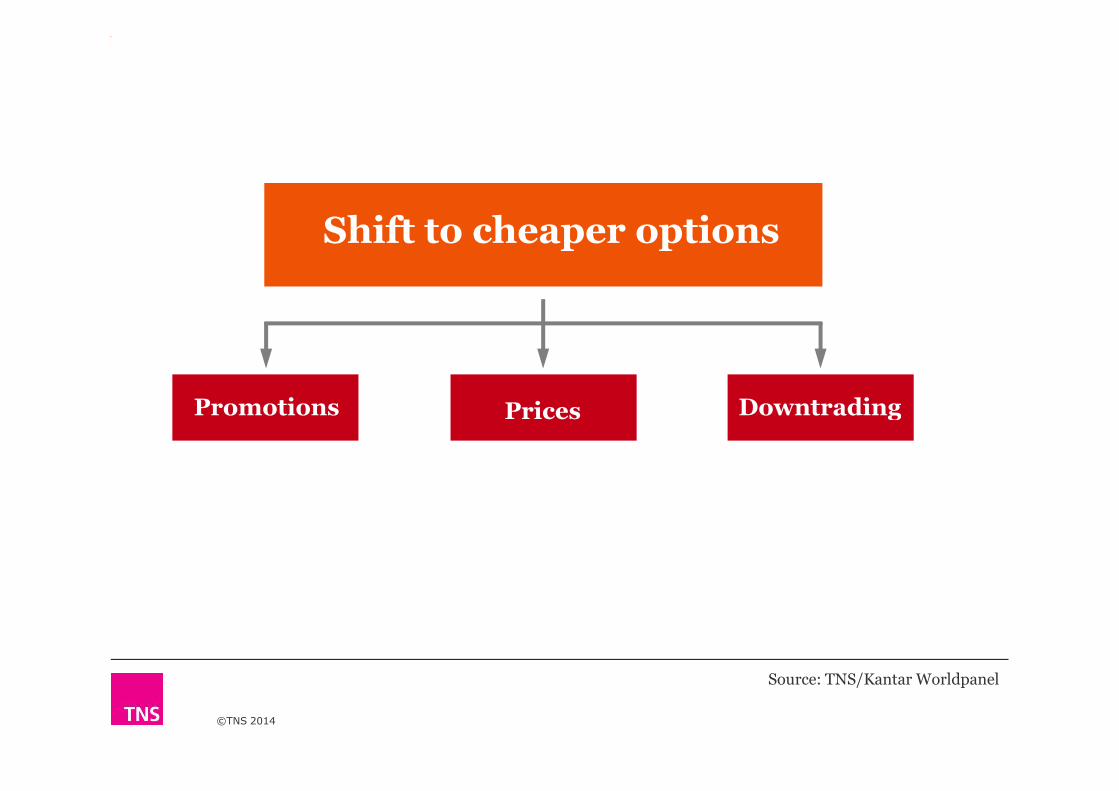
Shift to cheaper options
Promotions Downtrading
©TNS 2014
Promotions Prices Downtrading
Source: TNS/Kantar Worldpanel
The steady march of
private labels
©TNS 2014

You will find in every 6 out of ten baskets at least one private label product. And it’s a growing trend
61,3
63,5
64,4
©TNS 2014
61,3
MAT Nov 11 MAT Nov 12 MAT Nov 13
35
Source: TNS/Kantar Worldpanel
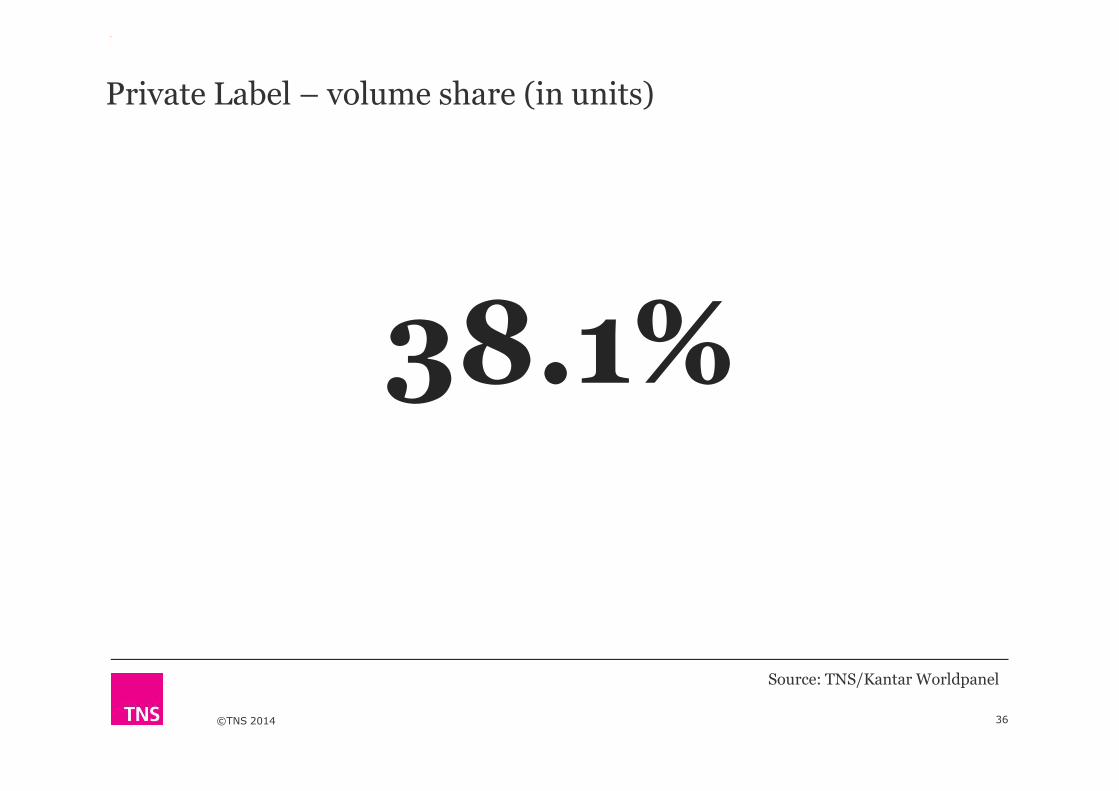
Private Label – volume share (in units)
38.1%
©TNS 2014 36
38.1%
Source: TNS/Kantar Worldpanel

27.4%
Private Label - value share
©TNS 2014 37
27.4%
Source: TNS/Kantar Worldpanel
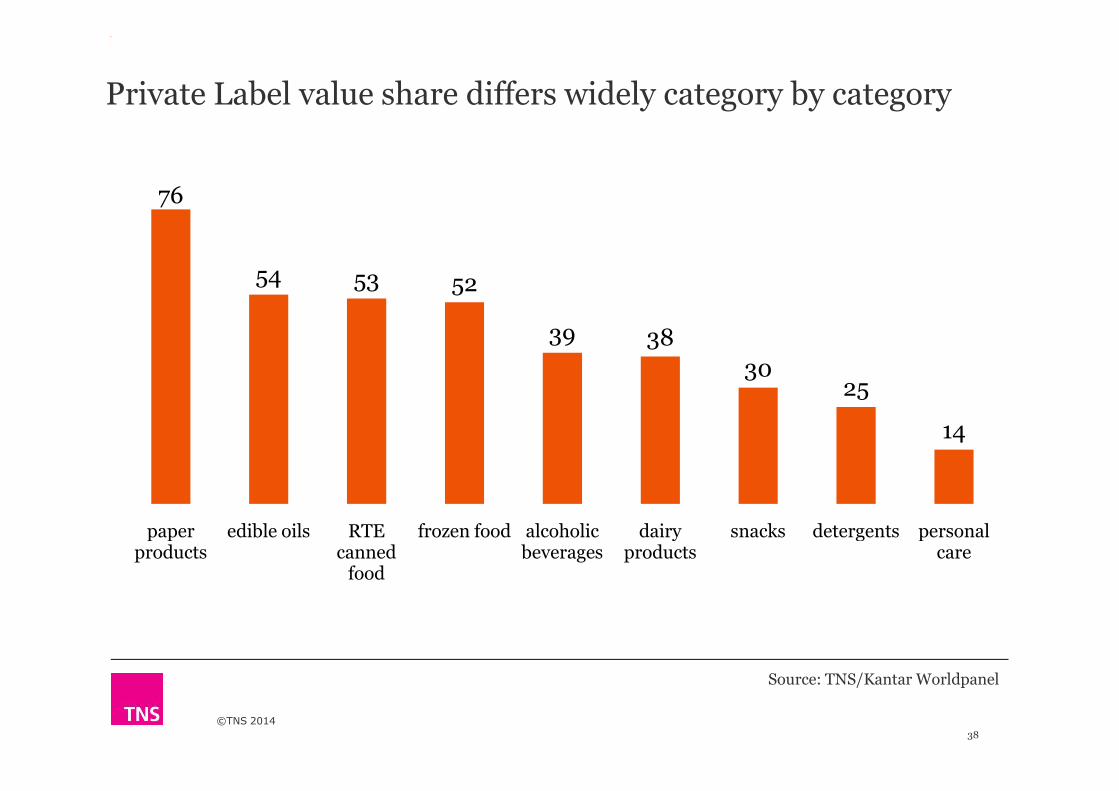
Private Label value share differs widely category by category
76
54 53 52
39 38
3025
©TNS 2014
38
25
14
paper products
edible oils RTE canned
food
frozen food alcoholic beverages
dairy products
snacks detergents personal care
Source: TNS/Kantar Worldpanel

Price is an issuethe
©TNS 2014 39
©TNS 2014
600
700
800
900
3.500
4.000
4.500
Vo
lum
e (0
00
litre
s) -
Ac
tua
lS
pe
nd
(€
00
0)
-A
ctu
al
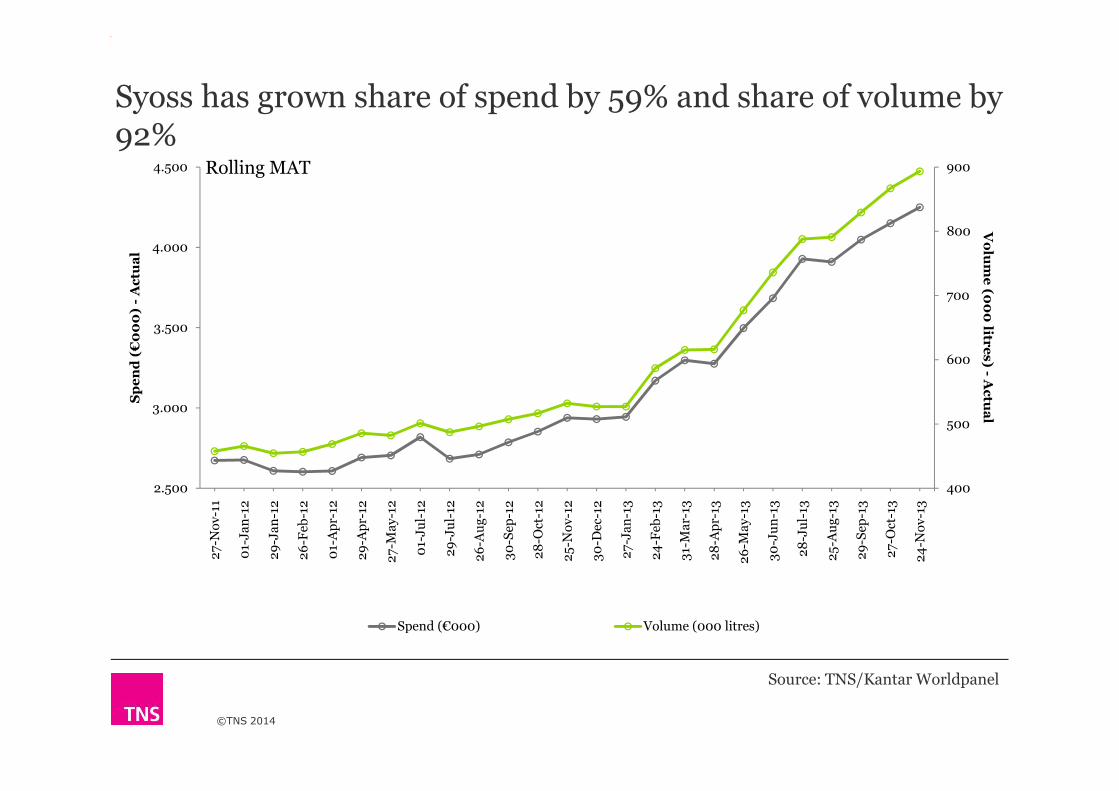
Rolling ΜΑΤ
Syoss has grown share of spend by 59% and share of volume by 92%
©TNS 2014
400
500
2.500
3.000
27
-No
v-1
1
01-
Ja
n-1
2
29
-Ja
n-1
2
26
-Feb
-12
01-
Ap
r-12
29
-Ap
r-12
27
-Ma
y-1
2
01-
Ju
l-12
29
-Ju
l-12
26
-Au
g-1
2
30
-Sep
-12
28
-Oct
-12
25
-No
v-1
2
30
-Dec
-12
27
-Ja
n-1
3
24
-Feb
-13
31-
Ma
r-13
28
-Ap
r-13
26
-Ma
y-1
3
30
-Ju
n-1
3
28
-Ju
l-13
25
-Au
g-1
3
29
-Sep
-13
27
-Oct
-13
24
-No
v-1
3
Ac
tua
lS
pe
nd
(
Spend (€000) Volume (000 litres)
Source: TNS/Kantar Worldpanel
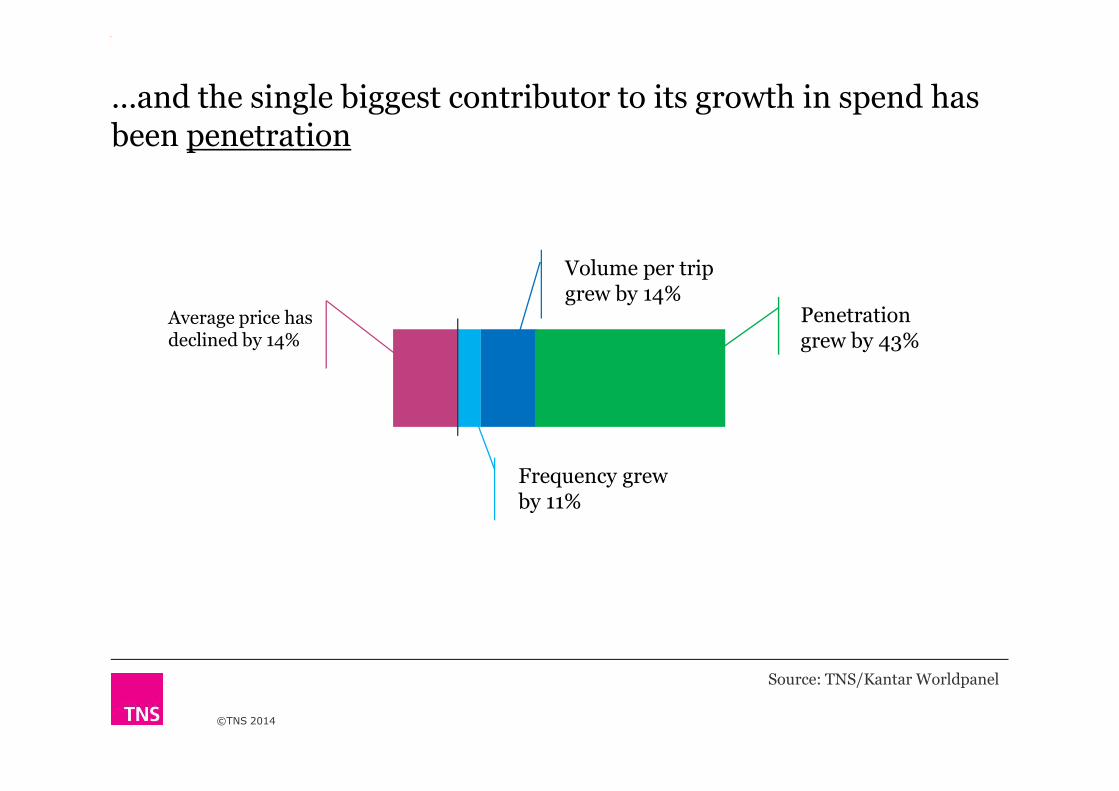
…and the single biggest contributor to its growth in spend has been penetration
Penetration grew by 43%
Volume per trip grew by 14%
Average price has declined by 14%
©TNS 2014
Frequency grew by 11%
Source: TNS/Kantar Worldpanel
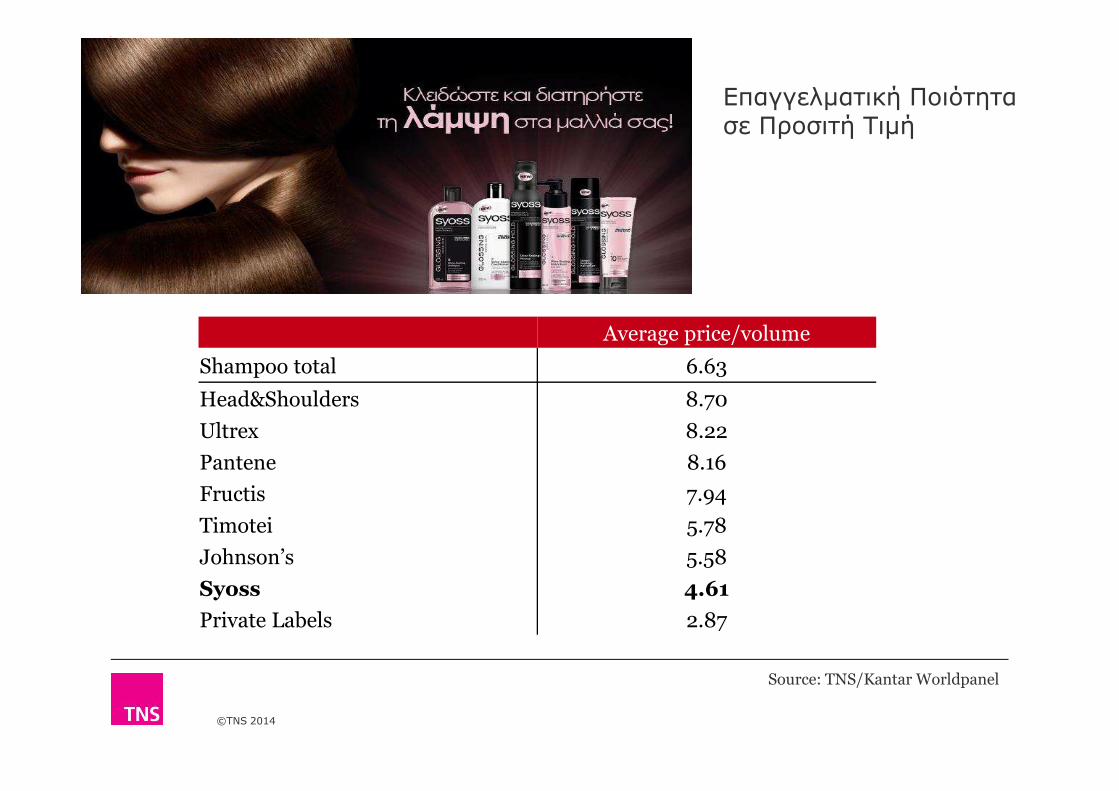
Επαγγελµατική Ποιότητα σε Προσιτή Τιµή
Average price/volume
Shampoo total 6.63
Head&Shoulders 8.70
©TNS 2014
Head&Shoulders 8.70
Ultrex 8.22
Pantene 8.16
Fructis 7.94
Timotei 5.78
Johnson’s 5.58
Syoss 4.61
Private Labels 2.87
Source: TNS/Kantar Worldpanel

©TNS 2014 44
How can a brand grow?
©TNS 2014 45

43 4552 52 56 63 67 69 72 73
Loyalty is very hard to come by (for brands)
…even for market leaders
Loyalty in spend - %
©TNS 2014 46
57 5548 48 44 37 33 31 28 27
Coca-Cola Colgate Nescafe Ariel Soupline Amita Pantene Fitness Papagalos Misko
Source: TNS/Kantar Worldpanel

What makes less of a difference is
avg. weight of purchaseie, loyalty, or how many times/how much buyers of a brand will
buy in a year
©TNS 2014
buy in a year
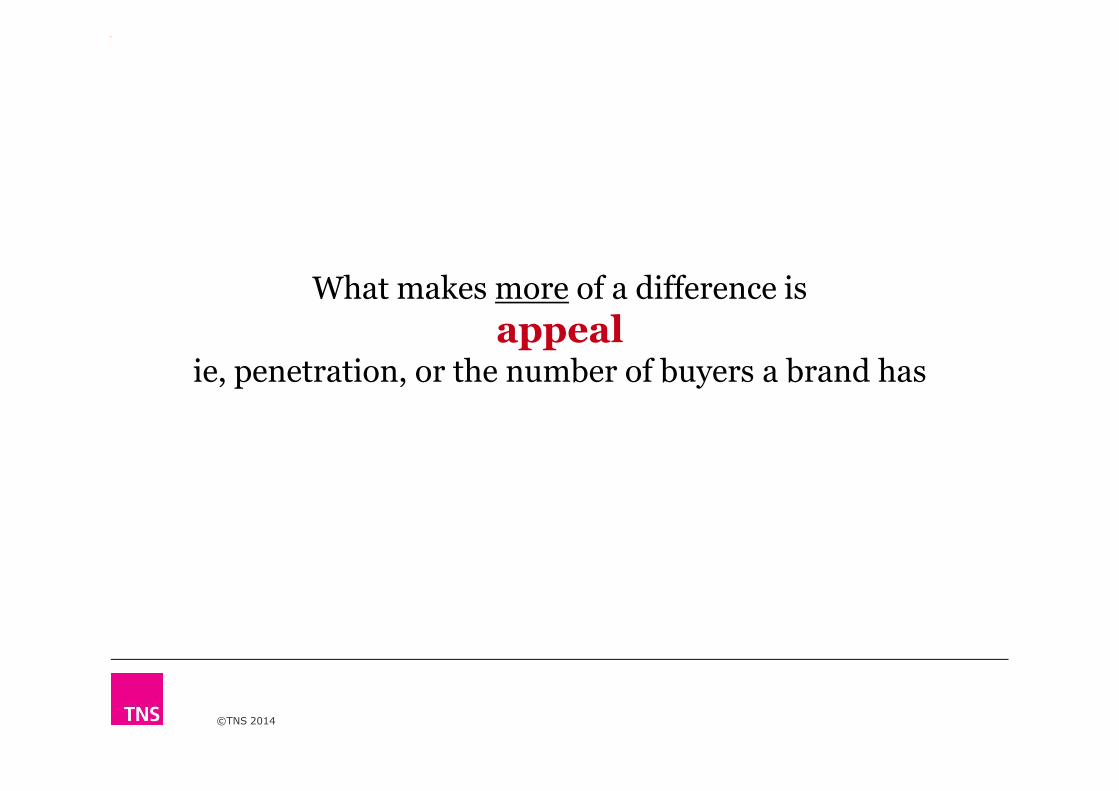
What makes more of a difference is
appealie, penetration, or the number of buyers a brand has
©TNS 2014
So, does that mean that making shoppers more loyal to my brand isn’t that important? Surely the most loyal shoppers are the most important?
©TNS 2014

Well…let’s take Coca-Cola as an example, the leading brand in terms of penetration
…and only 16% of them are heavy
buyers
©TNS 2014
of brand shoppers are 100% loyal…
Heavy Buyers
Medium Buyers
Light Buyers
15.8%
Source: TNS/Kantar Worldpanel
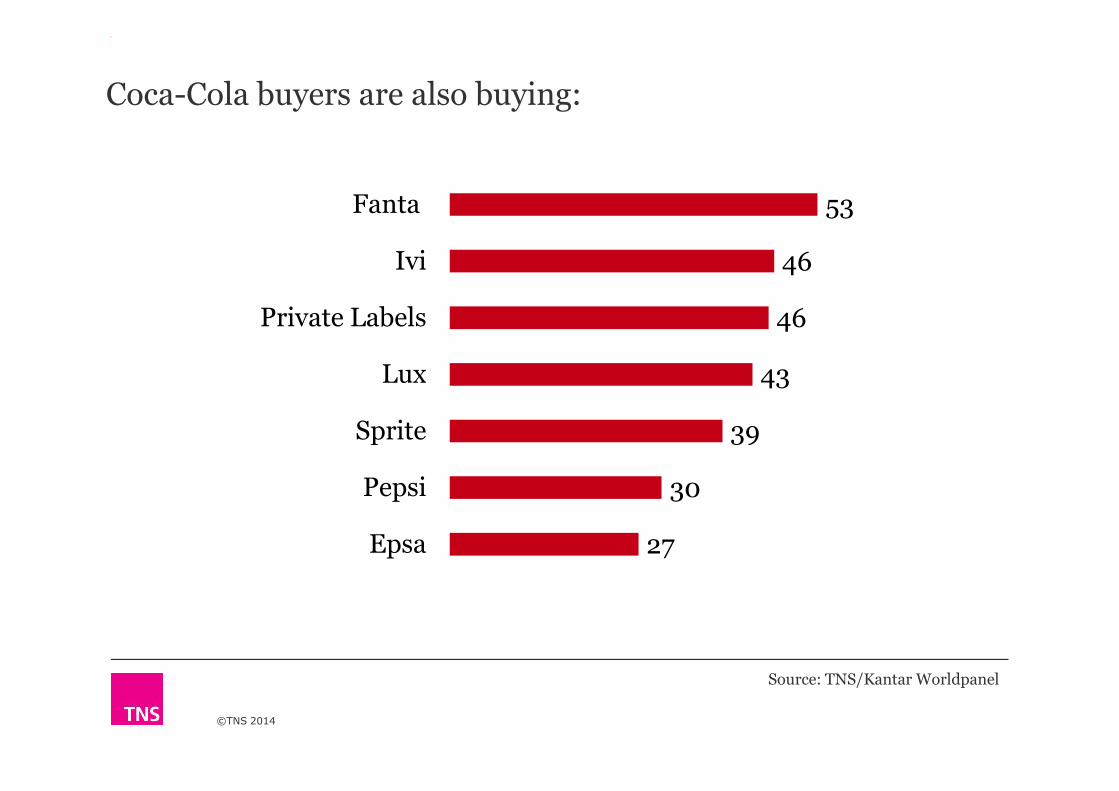
53
46
46
43
Fanta
Ivi
Private Labels
Lux
Coca-Cola buyers are also buying:
©TNS 2014
39
30
27
Sprite
Pepsi
Epsa
Source: TNS/Kantar Worldpanel
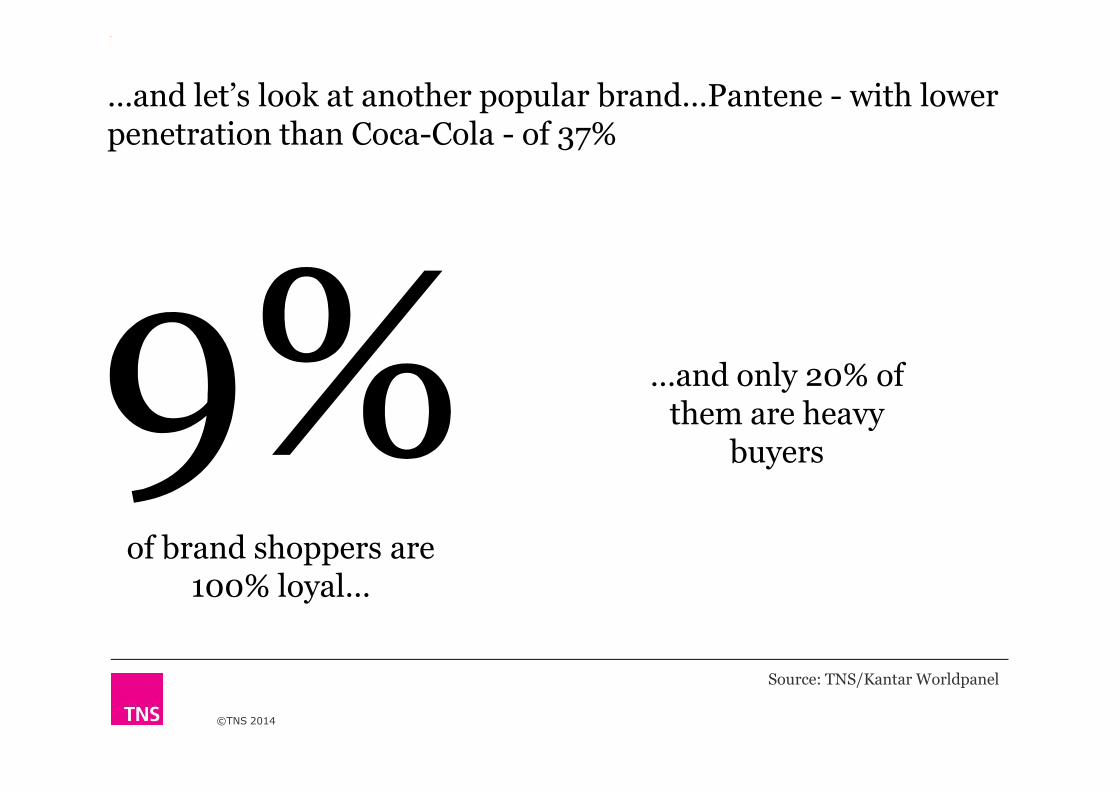
…and only 20% of them are heavy
…and let’s look at another popular brand…Pantene - with lower penetration than Coca-Cola - of 37%
©TNS 2014
of brand shoppers are 100% loyal…
them are heavy buyers
Source: TNS/Kantar Worldpanel

31
24
21
20
20
19
18
Syoss
Head&Shoulders
Ultrex
Sunsilk
Fructis
Elvive
Timotei
Pantene buyers are also buying:
©TNS 2014
18
18
16
14
13
13
11
Timotei
Private Labels
Beer
Wash&Go
Johnson's
Herbal Essences
Gliss
Source: TNS/Kantar Worldpanel
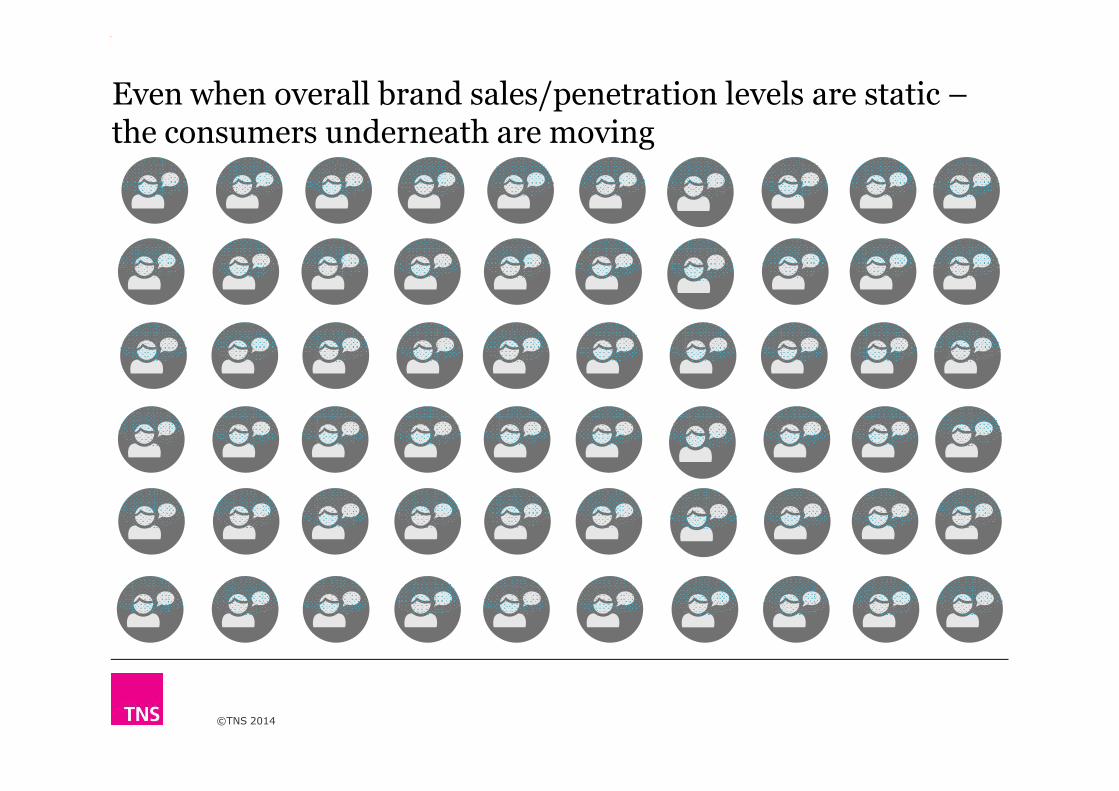
Even when overall brand sales/penetration levels are static –the consumers underneath are moving
©TNS 2014
©TNS 2014 55

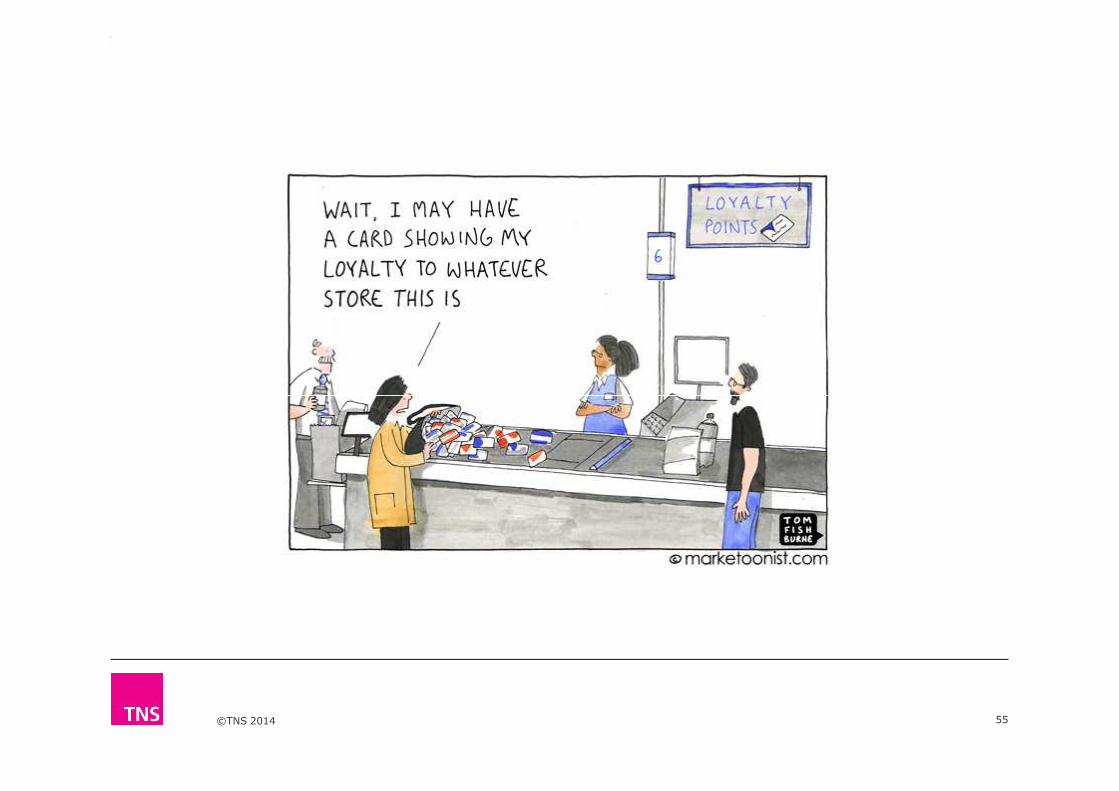
…with, on average, 5 retailers in their repertoire
Loyalty is very hard to come by (for retailers as well)
66 6977 80 85 85 86 88
Loyalty in spend - %
©TNS 2014
56
34 3123 20 15 15 14 12
Masoutis Sklavenitis Grp CRF AB Galaxias Lidl Veropoulos My Market
Source: TNS/Kantar Worldpanel

91
35
Retailer frequency
©TNS 2014
57
35
2218 15 14 14 13
Total Masoutis Sklavenitis Grp Carrefour
AB Galaxias Lidl Veropoulos
Source: TNS/Kantar Worldpanel

Your consumers are just
somebody else’s consumer who occasionally buy you
©TNS 2014
(this applies equally to light or to heavy buyers)

©TNS 2014
1. Understand the consumer
2. Understand the shopper
3. Do not slash marketing spend
4. Loyalty is out; penetration and frequency are in
5. Price ≠ Value
©TNS 2014
6. Innovate
7. The market demands a low-cost offering
8. Open innovation
9. Think technology

1. Understand the consumer
2. Understand the shopper
3. Do not slash marketing spend
4. Loyalty is out; penetration and frequency are in
5. Price ≠ Value
©TNS 2014
5. Price ≠ Value
6. Innovate
7. The market demands a low-cost offering
8. Open innovation
9. Think technology
1. Understand the consumer
2. Understand the shopper
3. Do not slash marketing spend
4. Loyalty is out; penetration and frequency are in
5. Price ≠ Value
©TNS 2014
5. Price ≠ Value
6. Innovate
7. The market demands a low-cost offering
8. Open innovation
9. Think technology
1. Understand the consumer
2. Understand the shopper
3. Do not slash marketing spend
4. Loyalty is out; penetration and frequency are in
5. Price ≠ Value
©TNS 2014
5. Price ≠ Value
6. Innovate
7. The market demands a low-cost offering
8. Open innovation
9. Think technology

1. Understand the consumer
2. Understand the shopper
3. Do not slash marketing spend
4. Loyalty is out; penetration and frequency are in
5. Price ≠ Value
©TNS 2014
6. Innovate
7. The market demands a low-cost offering
8. Open innovation
9. Think technology

1. Understand the consumer
2. Understand the shopper
3. Do not slash marketing spend
4. Loyalty is out; penetration and frequency are in
5. Price ≠ Value
©TNS 2014
6. Innovate
7. The market demands a low-cost offering
8. Open innovation
9. Think technology

1. Understand the consumer
2. Understand the shopper
3. Do not slash marketing spend
4. Loyalty is out; penetration and frequency are in
5. Price ≠ Value
©TNS 2014
6. Innovate
7. The market demands a low-cost offering
8. Open innovation
9. Think technology
1. Understand the consumer
2. Understand the shopper
3. Do not slash marketing spend
4. Loyalty is out; penetration and frequency are in
5. Price ≠ Value
©TNS 2014
6. Innovate
7. The market demands a low-cost offering
8. Open innovation
9. Think technology
1. Understand the consumer
2. Understand the shopper
3. Do not slash marketing spend
4. Loyalty is out; penetration and frequency are in
5. Price ≠ Value
©TNS 2014
6. Innovate
7. The market demands a low-cost offering
8. Open innovation
9. Think technology

Greece…
©TNS 2014 69