2015 Lectures Third Part, Methods and Techniques of Social Research II, EKPA

The Practice of StatisticsThird Edition
Chapter 2:Describing Location in a Distribution
Copyright © 2008 by W. H. Freeman & Company

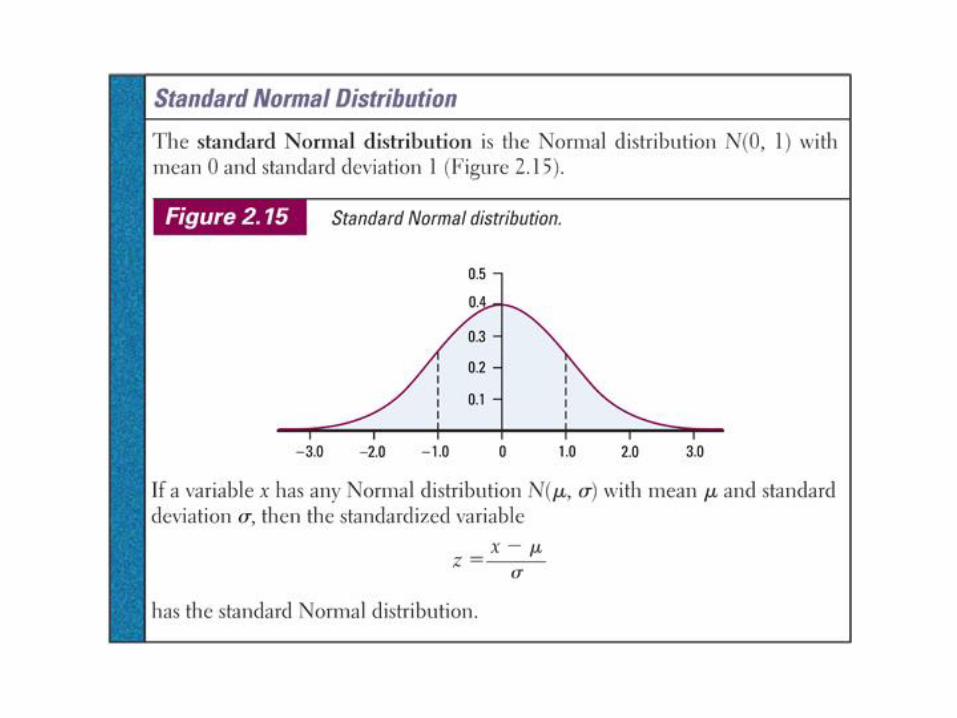
Empirical Rule
• All Normal distributions are the same if we
measure in units of size σ about the mean μ
as center (better known as converting to z-
scores).
• If the variable we standardize has a Normal
distribution, then so does the new variable z.
• This is a Linear Transformation (Ch 1).
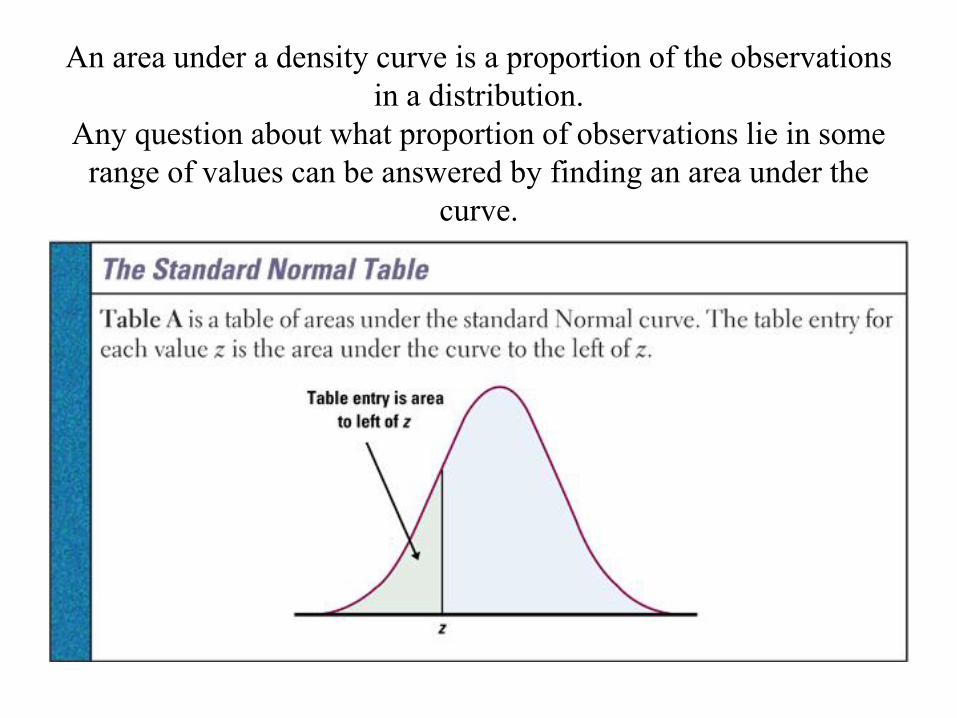
An area under a density curve is a proportion of the observations
in a distribution.
Any question about what proportion of observations lie in some
range of values can be answered by finding an area under the
curve.

• Say Hello to Table A.
• It shows the area under the curve to the
LEFT of z.
Try This
• Find Proportion of observations from a
standard Normal distribution that are less
than 2.22.
• Go to Table A
– Find 2.2 in left column.
– Find .02 in top row.
– What did you find?

The area under the curve to the left of z = 2.22 is .9868.
What does this mean in terms of Standard Deviations and total
area?

Another Example
• Find the proportion of observations from a
standard Normal distribution that are
GREATER than -2.15.
• Go to Table A.
– Find -2.1 in left column
– Find .05 in top row
– What do you find?

This means at .0158 of the observations are to the left of z = -2.15.
But we want GREATER (to the right). What do we do?
1 - .0158 = .9842 is greater than -2.15.

Be Careful. Make sure you know what is being asked.
Table A gives the proportion that is to the LEFT. Make
sure you understand the difference between Less and
Greater!!!!!


We can now answer any question about proportions of
observations in a Normal distribution by standardizing and using
Table A.
Just follow these 4 steps:

Cholesterol in Young Boys
• 14 year old boys cholesterol levels
• Levels above 240 mg/dl require medical
attention
• μ = 170 mg/dl
• σ = 30 mg/dl
• What proportion of 14 year old boys have
cholesterol above 240?

Step 1: State the problem. What is our variable x?
N(170,30)
Finding x > 240

Step 2: Standardize and draw a picture. What is our z-score?
z > 2.33
Step 3: Use Table A. What do you find for z = 2.33? What does
this mean?

Step 4: What do you Conclude?
• z = 2.33
• Table A gives .9901
– 99.01% of 14 year old boys have cholesterol
levels less than 240.
• So area to right is 1 - .9901 or .0099 or
about 1%.
• Only about 1% of 14 year old boys have
cholesterol levels above 240 mg/dl.

An Interval
• What percentage of 14 year old boys have
cholesterol levels between 170 and 240?
• Follow the 4 steps.
• State the problem: 170 ≤ x ≤ 240

Standardize and draw a picture.
0 ≤ z ≤ 2.33
Draw a Normal curve with what we know.
Use Table to find area between 0 and 2.33.
.9901 - .5 = .4901
Conclusion
• State your conclusion in context of the
problem.
• 49.01% of 14 year old boys have
cholesterol levels between 170 and 240
mg/dl.

Find a Value
• SAT verbal N(505, 110) distribution
• How high do you have to score to be in the
top 10%
• State problem & draw picture
– x has area to right of .1.
– What does that imply for area to the left?
• Use the table.
– What is different about this?
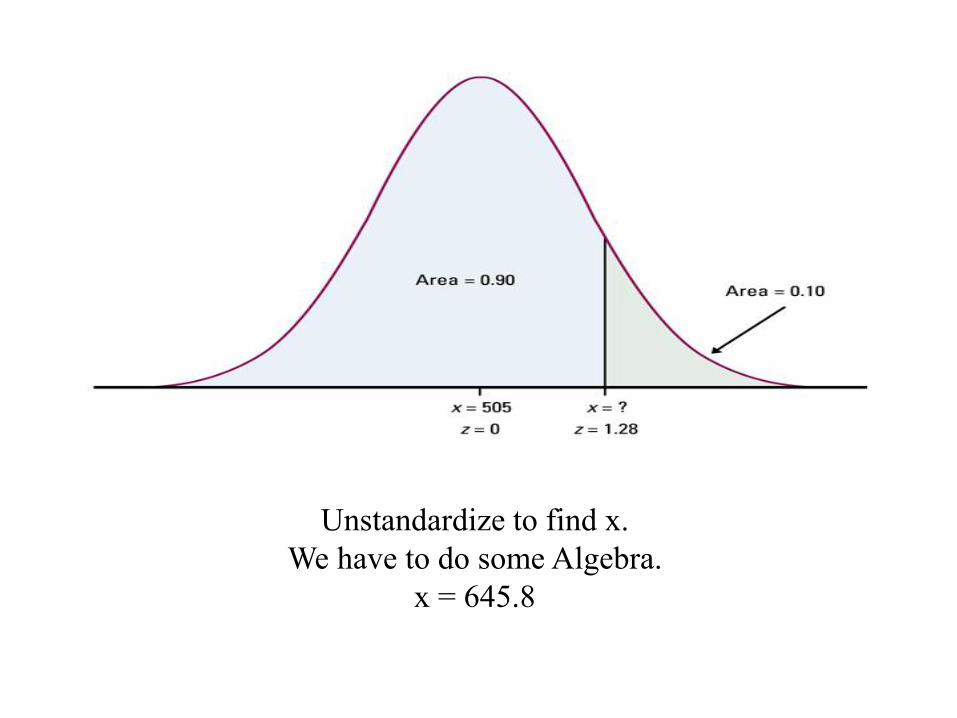
Unstandardize to find x.
We have to do some Algebra.
x = 645.8

Conclusion
• We got x = 645.8
• What does this mean?
• You must score 646 to be in the top 10% on
the SAT Verbal.

Assignment
• Exercises 2.18 (b, c, d), 2.30, 2.32, 2.33
• Read pages 148 – 152
• Watch: www.youtube.com/watch?v=bo5STaOUOgI&index=11&l
ist=PLC8478000586FA6F9
• Watch: www.youtube.com/watch?v=_86q-hn_3DQ