Thickness and Slope Measurements of Thin Liquid Film To an ...
14
Copyright 1999 by PSFVIP-2 1 Proceedings of PSFVIP-2 May 16-19, 1999, Honolulu, USA PF109 Thickness and Slope Measurements of Thin Liquid Film To an Accuracy of λ/4 Using Fizeau Interferometry Kenneth D. Kihm Department of Mechanical Engineering Texas A&M University, College Station, Texas 77843-3123, USA E-mail: [email protected] David M. Pratt Wright-Patterson Air Force Laboratory Dayton, Ohio 45433-7542, USA This paper presents a new optical technique to measure thin liquid film thickness and slope based on the principle of Fizeau interferometry. The interferometric fringes, constructed by the two reflected rays respectively from the solid-liquid and liquid-vapor interfaces, allow measurement of the thin film thickness at an accuracy of λ/4 when a monochromatic light source (λ = 520 nm) is used. When a white light source is used, colored interferometric fringes are formed and their color spectrum is constructed in different orders depending on the slope of film thickness, i.e., the spectrum order in R-Y-G-B indicates a negative slope of the film thickness and the order in R-B-G-Y indicates a positive slope of the thickness. Also, a micro-scale extension and movement control of the thin film region, using an electrohydrodynamic (EHD) phoresis, is first demonstrated and visualized. INTRODUCTION Some commercial and military applications in terrestrial and space thermal management systems require heat transport and dissipation capabilities in the hundreds of watts per square centimeter level. Of the heat transport devices presently under consideration in this regime, most utilize liquid-vapor phase change due to its superior heat transfer characteristics which can translate to a system with a reduced mass and at a near constant temperature. Additionally, if the phase change device is capillary-driven, the device will be passive, requiring no mechanical circulator for the working fluid. The broad category of capillary-driven heat transfer devices includes capillary pumped loops (CPL). Figure 1 shows a simple CPL that is composed of a single pore evaporator and a single pore condenser. In this figure, Q e and Q c are the heat transferred into and out of the CPL, respectively. Heat addition to the evaporator section of CPL results in evaporation from the thin film region of the meniscus. The vapor flows to the condenser section where the removal of heat causes the vapor to condense. The liquid is driven back to the evaporator through the capillary pressure differential between the pores of different diameters. When evaporation exceeds the rate of liquid re-supply, the device is said to reach its capillary limit and fails. Thus, the capillary limit has been typically used to define the maximum heat transfer capability of CPL. In practice, the maximum heat transfer capability associated with
Transcript of Thickness and Slope Measurements of Thin Liquid Film To an ...
Copyright 1999 by PSFVIP-21
Proceedings of PSFVIP-2May 16-19, 1999, Honolulu, USA
PF109
Thickness and Slope Measurements of Thin Liquid FilmTo an Accuracy of λλλλ/4 Using Fizeau Interferometry
Kenneth D. KihmDepartment of Mechanical EngineeringTexas A&M University, College Station, Texas 77843-3123, USAE-mail: [email protected] M. PrattWright-Patterson Air Force LaboratoryDayton, Ohio 45433-7542, USA
This paper presents a new optical technique to measure thin liquid film thicknessand slope based on the principle of Fizeau interferometry. The interferometricfringes, constructed by the two reflected rays respectively from the solid-liquidand liquid-vapor interfaces, allow measurement of the thin film thickness at anaccuracy of λ/4 when a monochromatic light source (λ = 520 nm) is used. When awhite light source is used, colored interferometric fringes are formed and theircolor spectrum is constructed in different orders depending on the slope of filmthickness, i.e., the spectrum order in R-Y-G-B indicates a negative slope of thefilm thickness and the order in R-B-G-Y indicates a positive slope of the thickness.Also, a micro-scale extension and movement control of the thin film region, usingan electrohydrodynamic (EHD) phoresis, is first demonstrated and visualized.
INTRODUCTION
Some commercial and military applications in terrestrial and space thermal managementsystems require heat transport and dissipation capabilities in the hundreds of watts per squarecentimeter level. Of the heat transport devices presently under consideration in this regime,most utilize liquid-vapor phase change due to its superior heat transfer characteristics which cantranslate to a system with a reduced mass and at a near constant temperature. Additionally, ifthe phase change device is capillary-driven, the device will be passive, requiring no mechanicalcirculator for the working fluid.
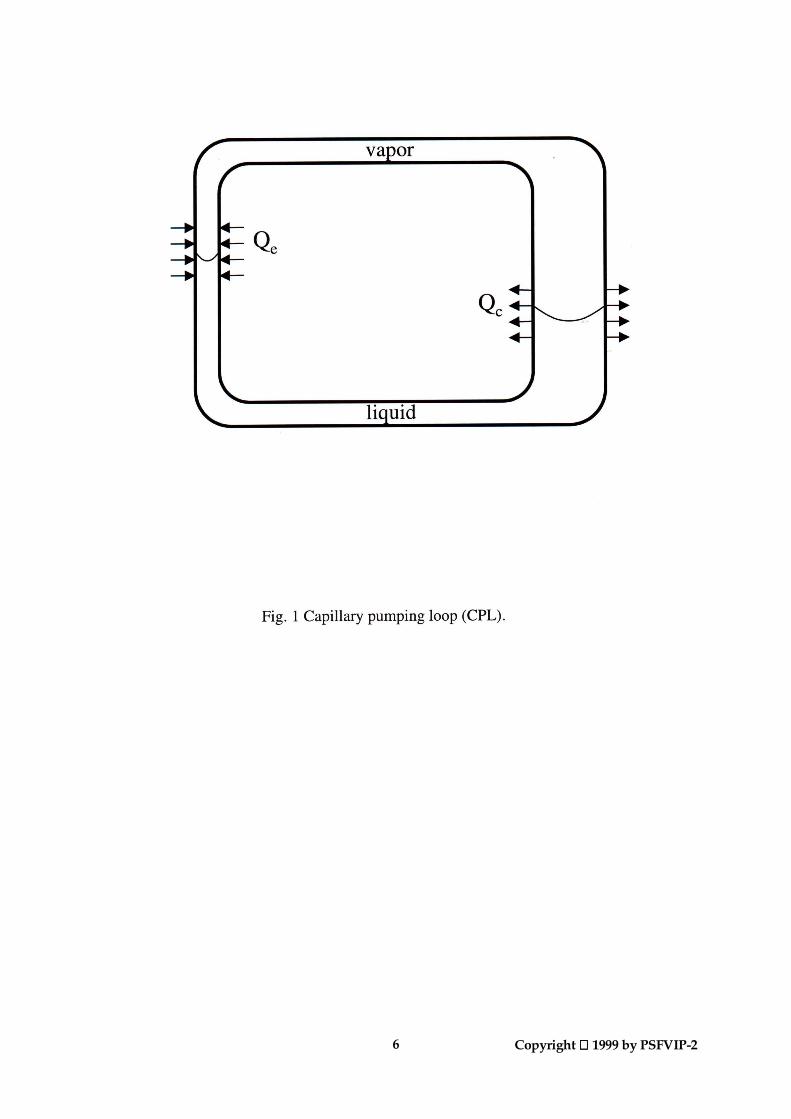
The broad category of capillary-driven heat transfer devices includes capillary pumpedloops (CPL). Figure 1 shows a simple CPL that is composed of a single pore evaporator anda single pore condenser. In this figure, Qe and Qc are the heat transferred into and out of theCPL, respectively. Heat addition to the evaporator section of CPL results in evaporation fromthe thin film region of the meniscus. The vapor flows to the condenser section where theremoval of heat causes the vapor to condense. The liquid is driven back to the evaporatorthrough the capillary pressure differential between the pores of different diameters. Whenevaporation exceeds the rate of liquid re-supply, the device is said to reach its capillary limitand fails. Thus, the capillary limit has been typically used to define the maximum heattransfer capability of CPL. In practice, the maximum heat transfer capability associated with
&RS\ULJKWýýìäääýE\ý36)9,3ðëë
the capillary limit is rarely achieved [1]. The basic mechanisms describing evaporatingmenisci in CPL at the capillary limit are not fully understood to date.
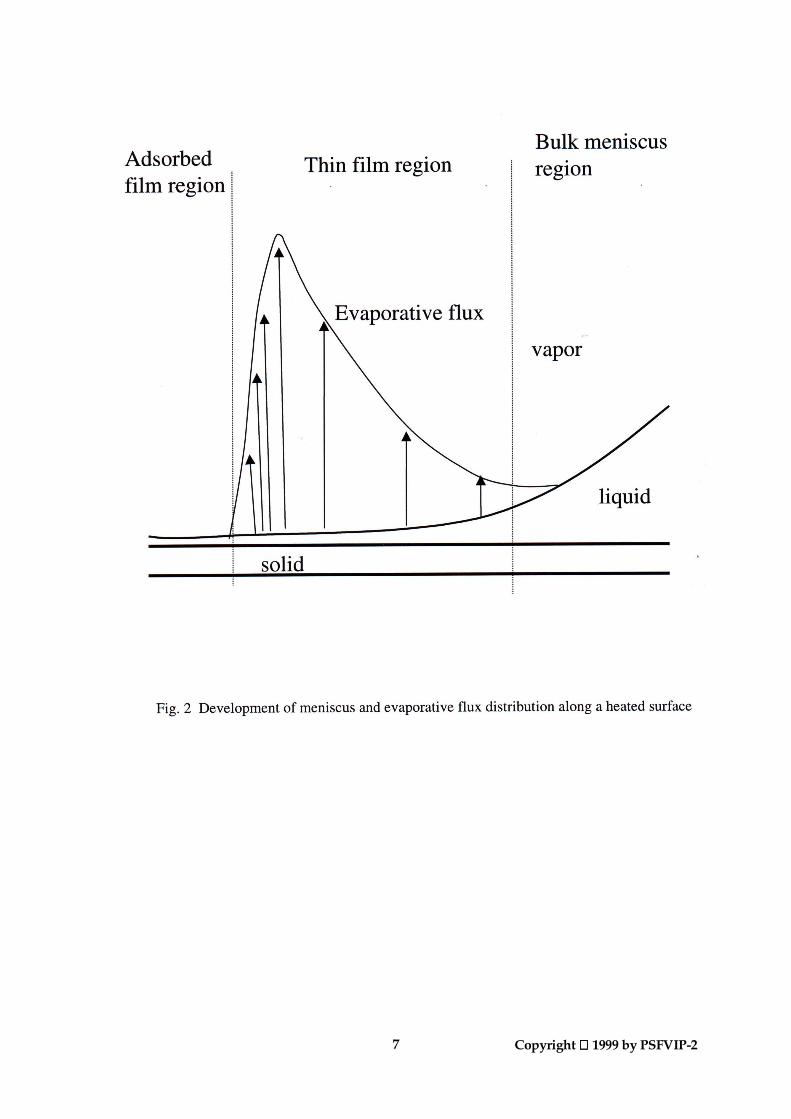
Although the capillary pore dimensions are generally in macroscopic order of onemillimeter, the most of energy and mass transport of CPL is known to occur within themicroscale region of the liquid meniscus near the three phase contact point [2]. The liquidmeniscus extends to the molecular level of an order of sub-nanometer thickness along a cleansolid surface (Fig. 2). In this adsorbed film layer, the strong Van-der-Waals attractionsprohibit any evaporative flux of liquid molecules. When the layer thickness exceeds a certainlimit, called a bulk meniscus region, the evaporative flux is again negligible since themeniscus surface temperature is not high enough for active evaporation. In between, called athin film region, most evaporation occurs and its peak has been predicted to be closely locatedto the boundary of the adsorbed film region [3,4].
The essential characteristics of the evaporating meniscus are sub-micron scalephenomena and the most energy and mass transport occurs within the thin film region of afew micron length with a submicron thickness [2-4]. Because of the experimental difficultiesassociated with the extremely small scale of the region of our interest, majority of theprevious studies has been done analytically and numerically. Dynamics associated with themicro-scale fluid motion and concentrated heat transport in the vicinity of the evaporatingmeniscus front can crucially affect the driving capillary potential by altering the wettingability of the working fluid [5]. The change in wettability results in changes of the thin filmthickness and slope, and in turn, the micro-scale dynamics are significantly governed by themicro-scale characteristics of the thin film region where most energy and mass transportoccurs in CPL.
Therefore, a precise determination of the thickness variations of thin liquid film nearthe meniscus front is necessary to consider augmentation of the heat transfer efficiency ofCPL. Also, the microscale extension and movement control of the thin film region, if evernonintrusively possible, will be very beneficial to enhance the energy and mass transfer ofCPL. An electrohydrodynamic (EHD) phoresis shows a potential of the micro-scale controlof the thin film behavior. A successful implementation of the nonintrusive control of the thinfilm region movement can counter-balance the meniscus instability and prevent theevaporator dryout from occurring at high energy and mass transport conditions of CPL.
EXPERIMENTAL METHODOLOGY
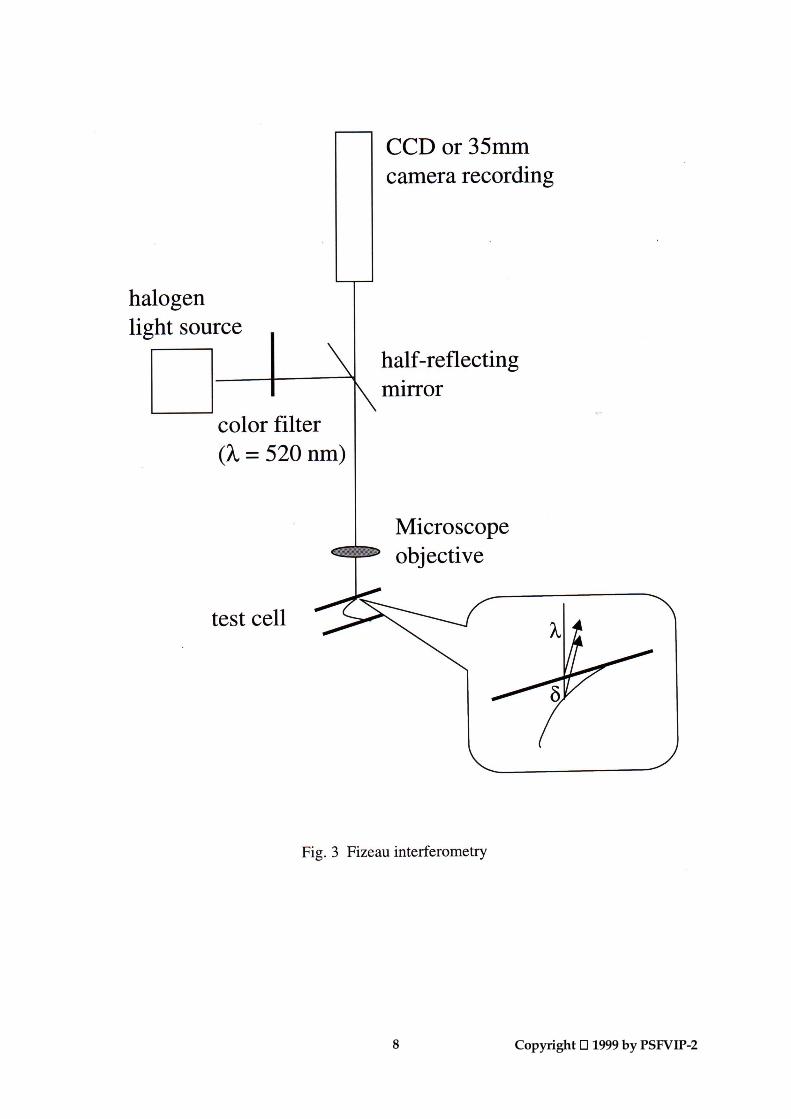
Figure 3 illustrates the Fizeau interferometry [6] for micro-scale measurements thatbasically consists of a microscopic imaging system with a monochromatic light source. Thetop surface of the test cell is made of a thin and flat glass plate. The monochromatic light raypartially reflects from the inner surface of the top glass plate and partially reflects from theliquid-vapor interface, as shown in the inset drawing. These two reflected rays create anoptical path length differential, 2δ, equivalent to two times the meniscus thickness. When theoptical path length differential, 2δ is equivalent to mλ (m = 1, 2, 3,...), the two rays interfereconstructively and the resulting light intensity is the highest. When the optical path lengthdifferential 2δ is equivalent to (m+1/2)λ, the two rays interfere destructively and the darkestintensity is resulted. The resulting sinusoidal intensity patterns construct optical fringes.Thus, the successive brightest and darkest locations on the fringes represent thicknessdifferentials of one-quarter of the wavelength, λ/4 = 95.8 nm. Note that λ represents theliquid medium wave length, i.e., λ = λo/n where the incident light wave length in vacuum, λo
= 520 nm, and the refractive index of the tested liquid pentane (C5H12) is taken for n = 1.357at 20°C.
&RS\ULJKWýýìäääýE\ý36)9,3ðëê
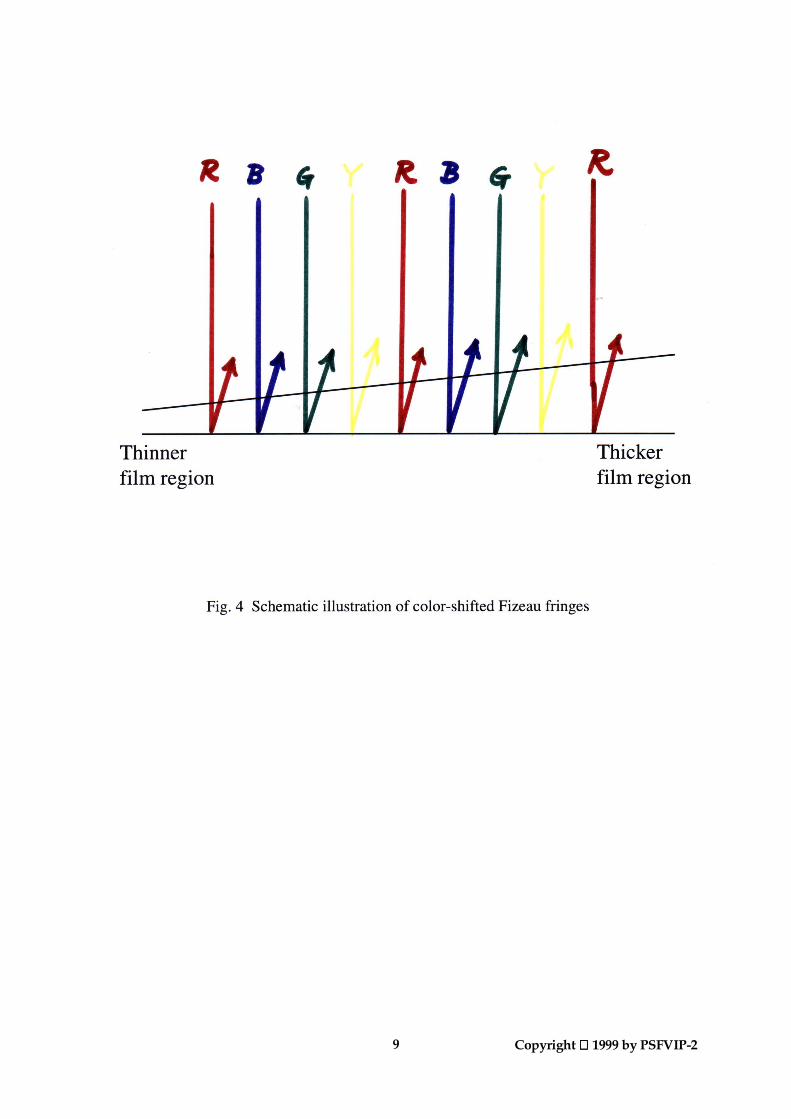
Additional noble feature of the experiment innovates an idea of using unfiltered whitelight source to determine the thickness gradient of thin film. The visible light spectrumranges from 400 nm to near 700 nm consisting colors ranging from purple, blue, green,yellow, orange to red. Also, the Fizeau fringes are broadened by the color spectrum and theorder of the spectrum depends on the film thickness gradient, i.e., red-shifted for relativelythicker film regions and blue-shifted for relatively thinner film regions (Fig. 4). Therefore,when the film thickness decreases along a certain direction, the order of color fringes alongthe same direction will be red, yellow, green, blue, red, yellow, green, blue, red, .... repeatingthe cycles. On the other hand, when the film thickness increases, the order will be reversed,i.e., red, blue, green, yellow, red, and so on. Therefore, by carefully analyzing the fringecolor orders, the film thickness contour mapping can be completed including the thicknessslope.
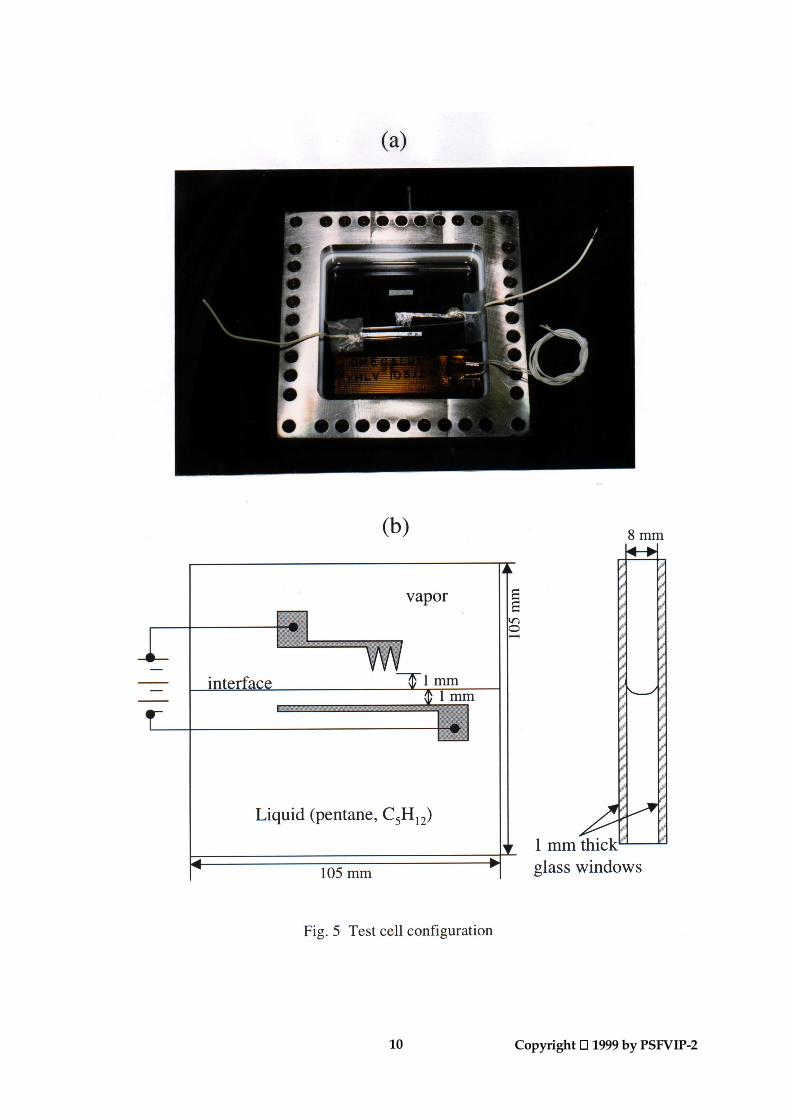
The rectangular test cell (Fig. 5-a) is made of two 105 mm square, 1 mm thick flatglass plates spaced 8 mm apart. Figure 5-b shows the electrode configuration, attached to thetop glass surface of the test cell, to examine the feasibility of electrohydrodynamic (EHD)phoresis moving and extending the thin film region of the meniscus. The net force that arisesdue to the action of the electric field can be shown to be [7]
κ∇+∇+= 22
21 EConstEConstqEFe (1)
where q is the electric field space charge density, E is the applied electric field strength, κ isthe dielectric constant, and Const1 and Const2 are given by the electric properties of testedfluid. The first term on the right side of Eq. (1) presents Coulomb force for ionizedmolecules. In highly dielectric fluids with low dielectric permittivity, such as pentane, theEHD current discharge is negligible and therefore the first term is insignificant. The secondand third terms present forces resulting because of nonuniformity of the electric field andnonuniformity in the dielectric permittivity of the fluid, respectively. If there is no spatialvariation in the dielectric constant, where 0=∇κ and the third term is negligible, the EHDforce will be solely determined by the nonuniformity in the electric field. Since the netelectric force Fe is proportional to the gradient of the scalar amount of E2, the fluid moleculeswill always move toward the electrode of the higher electric field, regardless of its polarity.This phenomenon is called dielectrophoresis. The saw teeth shape electrode is located abovethe meniscus so that the thin film is always attracted by its highly stressed and nonuniformelectric field (Fig. 5-b).
RESULTS AND DISCUSSION
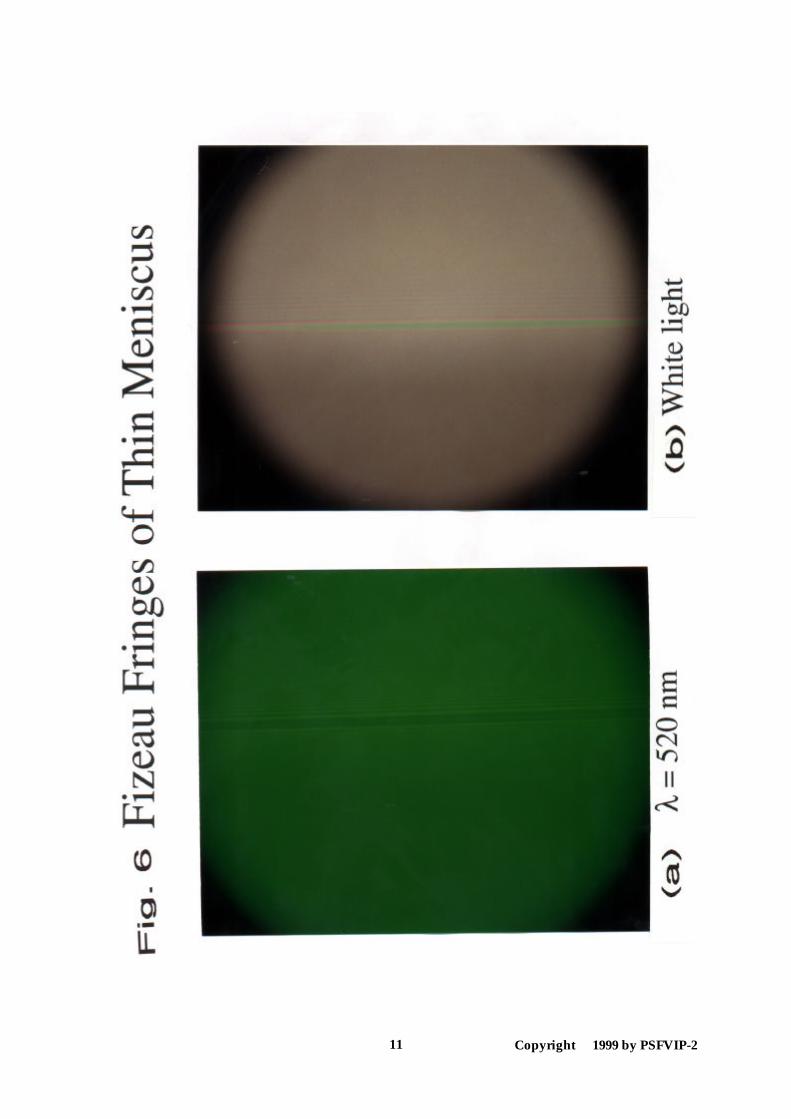
Typical Fizeau fringes for the thin film region of Pentane (σ = 15.5 dyne/cm, κ = 1.84,ρ = 621.4 kg/m3, M (molar mass) = 72.15 kg/mole, Tboiling = 309 K or 36°C), under no surfaceheating, are shown for monochromatic light illumination (λ = 520 nm) in Fig. 6-a, and for whitelight illumination (400nm < λ < 700 nm) in Fig. 6-b. The bulk meniscus region is located to theleft of the image field. The entire fringes in the right region of the center wider one willdisappear once the surface is heated by a foil heater and the thin film evaporation is established.Therefore, we believe that these fringes represent the condensed liquid layer under a subcooledenvironment provided by the cooler glass surface. The center wider fringe will turn into theevaporating meniscus front of the three phase contact point after the surface heater evaporatesoff the condensed surface layer in the right hand side region.
&RS\ULJKWýýìäääýE\ý36)9,3ðëé
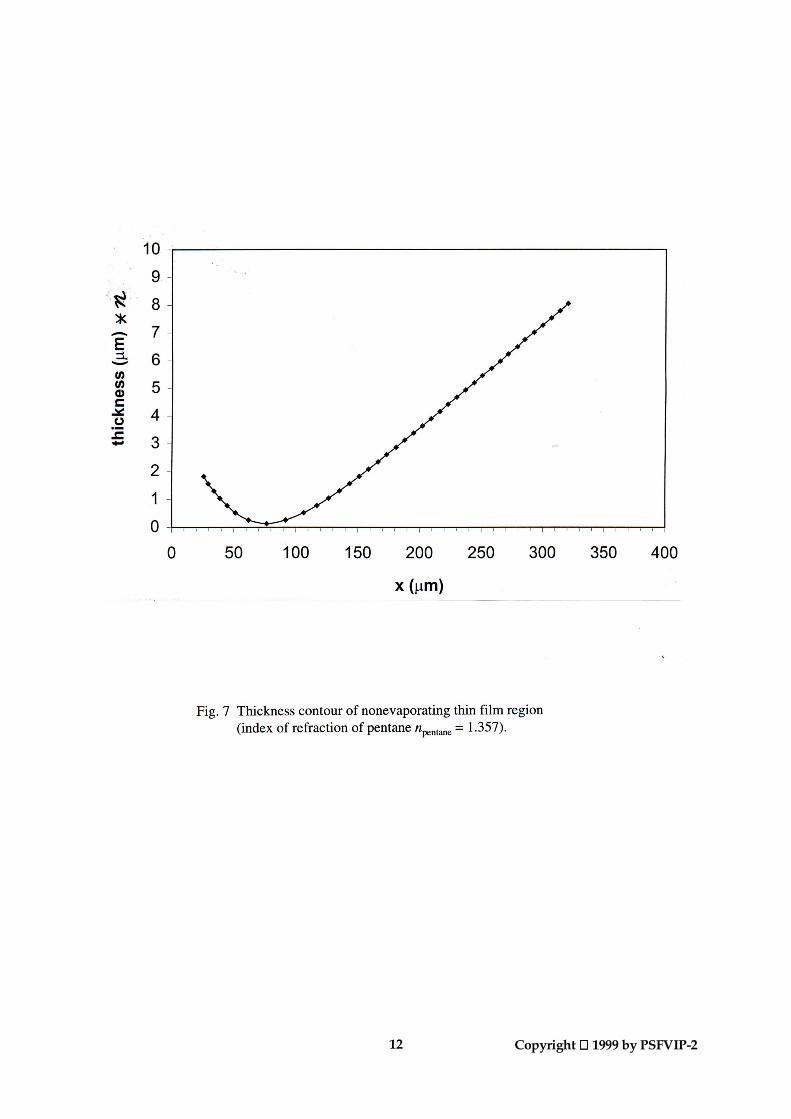
Figure 6-a was digitized and scanned for the pixel gray levels along a specifieddirection, for example, in perpendicular to the fringe orientation. The peaks and valleys of theresulting sinusoidal intensity profiles correspond to the locations of λ/4 thickness differential.Figure 6-b provides an information on the thickness slope variation. For example, the fringecolors, from left to right with respect to the green on at the center, change in order of R-Y-G-Y-R. Indexing to the color code shown in Fig. 4, we can determine that the center green fringecorresponds to the thinnest valley location and the film thickness increases in both directionsaway from the center. Figure 7 shows the quantitative result of the fringe analysis for the filmthickness versus the x-location measured from left to right. Note that the apparent film thicknessin the coordinate is multiplied by the liquid index of refraction, presently n = 1.357 for pentane,and the actual film thickness must be thinner by the factor of n than the apparent thickness.
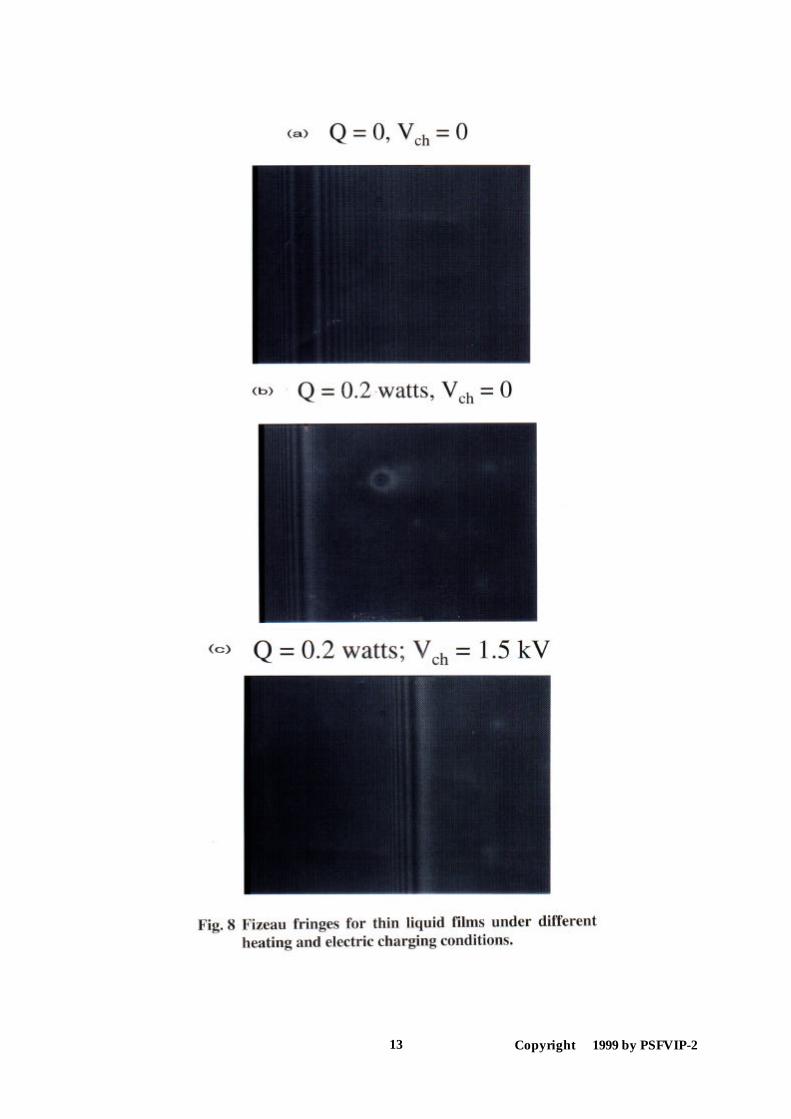
Figure 8 compares three different CCD images taken for menisci formed under differentheating and electric charging conditions. The full-view fringes shown in Fig. 8-a, under zeroheating, Q = 0, and zero charging voltage, Vch = 0, are divided by the center wider fringe, theleft of which shows the thin film region and the right of which shows the subcooled condensedlayer. When the condensed film is dried off by the surface heating at Q = 0.2 W (Fig. 8-b), theright side fringes disappear and only the left side fringes, representing the thin evaporating filmregion, remain. The location of the wider center fringe in Fig. 8-a now recedes to theevaporating meniscus front in Fig. 8-b. In addition to the surface heating, when the pentane ischarged by the surface electrodes at Vch = 1.5 kV, the EHD phoresis moves the meniscus frontto the right toward the serrated electrode that creates highly nonuniform electric field gradient.
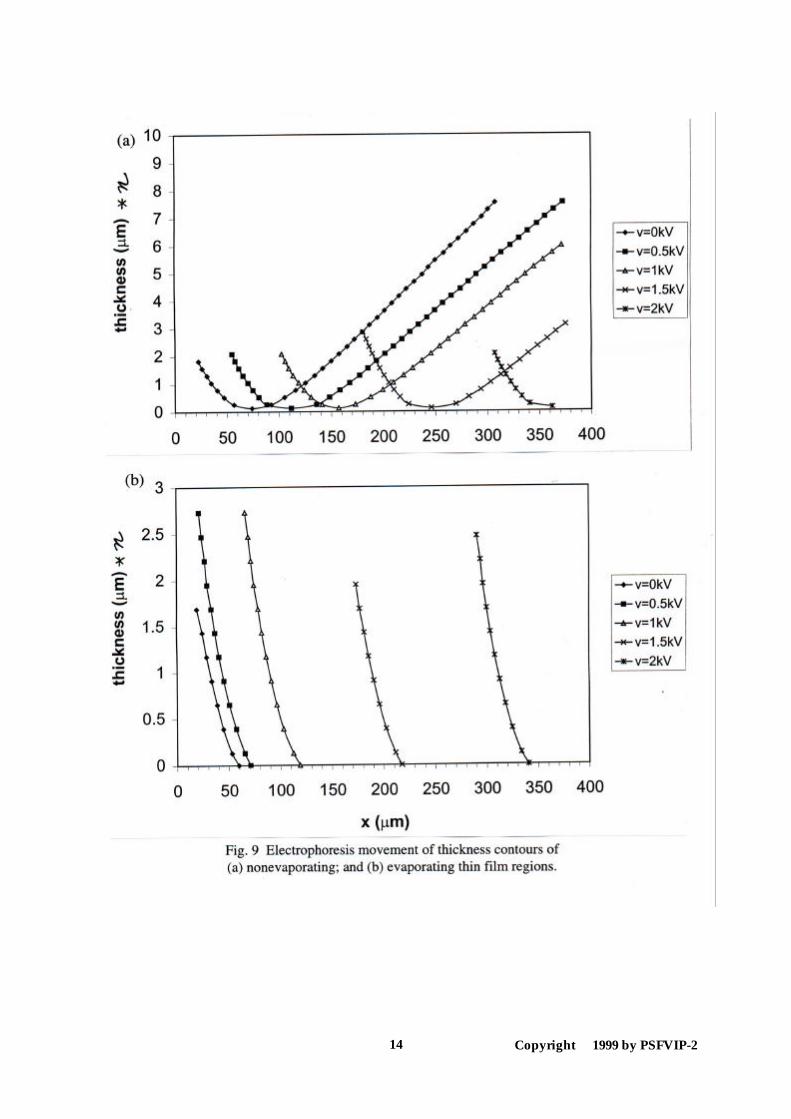
The beginning of the first dark fringe, either in Fig. 8-b or c, is taken as the evaporatingmeniscus front of zero thickness. The center of the first dark fringe indicates the location of thefilm thickness, δ = λ/4 or 95.8 nm, and the center of the first bright fringe indicates δ = λ/2 or191.6 nm. The centers of the second dark and bright bands are equivalent to δ = 287.4 nm and383.2 nm, respectively, and so on. Since the neighboring (dark or bright) fringes get narroweras we go to the left, the meniscus slope shows a gradual increase toward the bulk meniscusregion. The results of the fringe analysis for the film thickness profiles are shown for differentcharging voltages under no heating in Fig. 9-a and under a constant surface heating of 0.2 W inFig. 9-b. The amount of electrophoresis increases with increasing charging voltage regardlessof the surface heating.
CONCLUSION
Capillary pumping loop (CPL) heat exchanger device is known to have its most energyand mass transport occur through the thin film region of an order of 1 µm length and sub-micron thickness within its evaporating meniscus front. Noble diagnostic methods have beendeveloped and used to determine the complete contours of thin film thickness variations of bothevaporating and nonevaporating pentane menisci. Also, the developed visualization techniquehas evidenced the electrophoresis of the thin film and first demonstrated the potential for thenonintrusive and micro-scale control of the thin film, which can contribute to devise quenchingthe meniscus instability growth occurring at high heating rates.
Primary conclusions reached from the present study are:1. Monochromatic light Fizeau interferometry system has been successfully developed to
measure the thickness of thin liquid film to the resolution of λ/4.2. White light Fizeau interferometry system has been first devised to determine the thin
film thickness gradient to complete the contour mapping of the film thickness variation.
&RS\ULJKWýýìäääýE\ý36)9,3ðëè
3. Active control of the meniscus front and extension of the thin film region have been firstachieved and visualized by the use of electrohydrodynamic (EHD) phoresis withspecially designed electrodes.
REFERENCES
1. R. Richter and J. M. Gottschlich, Thermodynamic Aspects of Heat Pipe Operation,Journal of Thermophysics and Heat Transfer, vol. 8, no. 2, pp. 334-340, 1994.
2. M. Potash and P. C. Wayner, Evaporation from a Two-Dimensional Extended Meniscus,Int. J. Heat Mass Transfer, vol. 15, pp. 1851-1863, 1972.
3. A. Mirzamoghadam and I. Catton, A Physical Model of the Evaporating Meniscus, J.Heat Transfer, vol. 110, pp. 201-207, 1988.
4. F. J. Renk and P. C. Wayner, An Evaporating Ethanol Meniscus, Part II: AnalyticalStudies, J. Heat Transfer, vol. 101, pp. 59-62, 1979.
5. D. M. Pratt and K. P. Hallinan, Thermocapillary Effects on the Wetting Characteristics ofa Heated Curved Meniscus, Journal of Thermophysics and Heat Transfer, vol. 11, no. 4,pp. 519-525, 1997.
6. E. Hecht, Optics, Addison-Wesley, New York, 1987.7. A. Singh, , Eletrohydrodynamic (EHD) Enhancement of In-Tube Boiling and
Condensation of Alternate (Non-CFC) Refrigerants, Ph.D. Dissertation, University ofMaryland, College Park, MD, 1995.
&RS\ULJKWýýìäääýE\ý36)9,3ðëç
&RS\ULJKWýýìäääýE\ý36)9,3ðëæ
&RS\ULJKWýýìäääýE\ý36)9,3ðëå
&RS\ULJKWýýìäääýE\ý36)9,3ðëä
&RS\ULJKWýýìäääýE\ý36)9,3ðëìí
Copyright 1999 by PSFVIP-211
&RS\ULJKWýýìäääýE\ý36)9,3ðëìë
Copyright 1999 by PSFVIP-213
Copyright 1999 by PSFVIP-214