Thermodynamic Effect of Platinum Addition to β … Copland Case Western Reserve University,...
36
Evan Copland Case Western Reserve University, Cleveland, Ohio Thermodynamic Effect of Platinum Addition to β-NiAl: An Initial Investigation NASA/CR—2005-213330 January 2005 https://ntrs.nasa.gov/search.jsp?R=20050080681 2018-06-25T00:52:59+00:00Z
Transcript of Thermodynamic Effect of Platinum Addition to β … Copland Case Western Reserve University,...
Evan CoplandCase Western Reserve University, Cleveland, Ohio
Thermodynamic Effect of Platinum Additionto β-NiAl: An Initial Investigation
NASA/CR—2005-213330
January 2005
https://ntrs.nasa.gov/search.jsp?R=20050080681 2018-06-25T00:52:59+00:00Z

The NASA STI Program Office . . . in Profile
Since its founding, NASA has been dedicated tothe advancement of aeronautics and spacescience. The NASA Scientific and TechnicalInformation (STI) Program Office plays a key partin helping NASA maintain this important role.
The NASA STI Program Office is operated byLangley Research Center, the Lead Center forNASA’s scientific and technical information. TheNASA STI Program Office provides access to theNASA STI Database, the largest collection ofaeronautical and space science STI in the world.The Program Office is also NASA’s institutionalmechanism for disseminating the results of itsresearch and development activities. These resultsare published by NASA in the NASA STI ReportSeries, which includes the following report types:
• TECHNICAL PUBLICATION. Reports ofcompleted research or a major significantphase of research that present the results ofNASA programs and include extensive dataor theoretical analysis. Includes compilationsof significant scientific and technical data andinformation deemed to be of continuingreference value. NASA’s counterpart of peer-reviewed formal professional papers buthas less stringent limitations on manuscriptlength and extent of graphic presentations.
• TECHNICAL MEMORANDUM. Scientificand technical findings that are preliminary orof specialized interest, e.g., quick releasereports, working papers, and bibliographiesthat contain minimal annotation. Does notcontain extensive analysis.
• CONTRACTOR REPORT. Scientific andtechnical findings by NASA-sponsoredcontractors and grantees.
• CONFERENCE PUBLICATION. Collectedpapers from scientific and technicalconferences, symposia, seminars, or othermeetings sponsored or cosponsored byNASA.
• SPECIAL PUBLICATION. Scientific,technical, or historical information fromNASA programs, projects, and missions,often concerned with subjects havingsubstantial public interest.
• TECHNICAL TRANSLATION. English-language translations of foreign scientificand technical material pertinent to NASA’smission.
Specialized services that complement the STIProgram Office’s diverse offerings includecreating custom thesauri, building customizeddatabases, organizing and publishing researchresults . . . even providing videos.
For more information about the NASA STIProgram Office, see the following:
• Access the NASA STI Program Home Pageat http://www.sti.nasa.gov
• E-mail your question via the Internet [email protected]
• Fax your question to the NASA AccessHelp Desk at 301–621–0134
• Telephone the NASA Access Help Desk at301–621–0390
• Write to: NASA Access Help Desk NASA Center for AeroSpace Information 7121 Standard Drive Hanover, MD 21076
Evan CoplandCase Western Reserve University, Cleveland, Ohio
Thermodynamic Effect of Platinum Additionto β-NiAl: An Initial Investigation
NASA/CR—2005-213330
January 2005
National Aeronautics andSpace Administration
Glenn Research Center
Prepared under Cooperative Agreement NCC3–850
Acknowledgments
NASA Glenn Research Center for the development and use of multi-cell configured KEMS and funding from LowEmission Alternative Power Project. Dr. Brian Gleeson (Iowa State University, Ames, USA) for providing the alloy
samples, instigating this study, reviewing the work, and providing numerous helpful discussions. Furtherhelpful discussions were provided by Prof. David Young (University of New South Wales, Sydney, Australia),
Christian Chatillon (Laboratoire de Thermodynamique et Physico-Chimie Métallurgiques, Saint Martin d’Hères, France),and Claude Lupis (MIT, Boston, USA).
Available from
NASA Center for Aerospace Information7121 Standard DriveHanover, MD 21076
National Technical Information Service5285 Port Royal RoadSpringfield, VA 22100
This report is a formal draft or workingpaper, intended to solicit comments and
ideas from a technical peer group.
This report contains preliminaryfindings, subject to revision as
analysis proceeds.
Available electronically at http://gltrs.grc.nasa.gov
NASA/CR—2005-213330 1
Thermodynamic Effect of Platinum Addition to β-NiAl: An Initial Investigation
Evan Copland
Case Western Reserve University Cleveland, Ohio 44106
Summary
An initial investigation was conducted to determine the effect of platinum addition on the activities of aluminum and nickel in β-NiAl(Pt) over the temperature range 1354 to 1692 K. These measurements were made with a multiple effusion-cell configured mass spectrometer (multi-cell KEMS). The results of this study show that Pt additions act to decreased a(Al) and increased the a(Ni) in β-NiAl(Pt) for constant XNi/XAl ≈ 1.13, while at constant XAl the affect of Pt on Al is greatly reduced. The measured partial enthalpies of mixing indicate Al-atoms have a strong self interaction while Ni- and Pt-atoms have similar interactions with Al-atoms. Conversely the binding of Ni-atoms in β-NiAl decreases with Pt addition independent of Al concentration. These initial results prove the technique can be applied to the Ni-Al-Pt system but more activity measurements are required to fully understand the thermodynamics of this system and how Pt additions improved the scaling behavior of nickel-based superalloys. In addition, with the choice of a suitable oxide material for the effusion-cell, the “closed” isothermal nature of the effusion-cell allows the direct investigation of an alloy-oxide equilibrium which resembles the “local-equilibrium” description of the metal-scale interface observed during high temperature oxidation. It is proposed that with an Al(l) + Al2O3(s) experimental reference state together with the route measurement of the relative partial-pressures of Al(g) and Al2O(g) allows the activities of O and Al2O3 to be determined along with the activities of Ni and Al. These measurements provide a direct method of investigating the thermodynamics of the metal-scale interface of a TGO-scale.
Introduction
The successful application of thermal barrier coating (TBC) systems on nickel-based superalloys requires that the ceramic topcoat remains stable and adherent to a protective thermally grown oxide (TGO) scale. The growth of a suitable, non-porous α-Al2O3-rich, TGO scale typically requires the application of an aluminum-enriched bond-coat to the superalloy.1 A typical bond-coat process involves depositing a thin platinum layer prior to pack-cementation or chemical vapor deposition (CVD) of aluminum. The deposited platinum and aluminum interdiffuse with the bulk alloy to form a Pt-modified β-NiAl layer that changes in thickness and composition with time at temperature. The presence of platinum in the bond coat is generally accepted to have beneficial effects on the formation of a protective TGO scale and TBC adhesion, but little is understood about the reasons for these observed benefits.2 The dissolution of platinum can affect the activity of aluminum and nickel in the β-NiAl bond coat, and may also affect their extents of diffusion and even properties of the TGO scale. Interdiffusion studies ascertain combined thermodynamic and kinetic affects, but give little indication of their relative contribution.3 To this end, a preliminary investigation was made to measure the activity of aluminum and nickel as a function of platinum concentration in four β-NiAl(Pt) alloys. This was achieved by the vapor-pressure method with a multiple effusion-cell configured mass spectrometer (multi-cell KEMS). In addition to the measured activities of Al and Ni the activity of O and Al2O3 in an oxide-compound in equilibrium with the alloy sample were also measured. The oxide-compound was either a thin surface-layer (~10 to 50 nm) on the alloy samples or the inner-surface of the oxide effusion-cell. Thus, this report will discuss an initial
NASA/CR—2005-213330 2
interpretation of (1) the effect of Pt addition on the activities of Al and Ni in β-NiAl and (2) the significance of measuring thermodynamic properties of the alloy-oxide equilibrium.
Background to Multi-Cell KEMS Activity Measurements
Thermodynamic activities, a(A), provide a measure of the reactivity of a component, A, in a solution phase, defined here as γ, relative to a reference state indicated by the superscript º. Activity is defined as the ratio of a component’s fugacity5 in the solution and reference state and also in terms of the change in Gibbs free energy for a mixing or solution reaction which provides relative chemical potentials, o
AA µ−µγ , as shown in equation (1). Activities or relative chemical potentials are therefore fundamental to understanding the thermodynamics of multi-component systems.4–6 At high temperatures and low pressures the vapor in equilibrium with the solution phase and reference state approach ideal behavior and the fugacity of a component can be determined by measuring the partial pressure of a characteristic vapor species, pA. Thus the activity of component A in a solution phase can be determined directly at a given temperature by comparing the partial pressure of the characteristic vapor species in equilibrium with the solution, pA, to the reference state, o
Ap , as shown in equation (2).
)A(lnln aRTffRT o
oAA ==µ−µγ (1)
oA
A
ppa =)A( (2)
As indicated by equations (1) and (2), the value of the activity depends on the reference state, which
must be clearly defined.5,6 A typical and convenient experimental reference state is the stable defect-free phase of the pure-element at the temperature of interest (Raoultian reference state). The mixing or solution reactions which define the activity of components A and B in the solution phase, γ
yx BA , are shown in equations (3a) and (3b).7 In this case reference states are pure A as the α-phase and pure B as the β-phase. For this reaction the amounts of either A or B that are added are small relative to the amount of
γyx BA and the composition of the solution does not change significantly.
γ
+γα =+ yxyx BABAA 1 ( )AaRTG AAA lnmix =µ−µ=∆ αγγ (3a)
γ
+γβ =+ 1yxyx BABAB )(lnmix BaRTG BBB =µ−µ=∆ βγγ (3a)
In the method used in this study the mixing reaction is determined by comparing the sublimation
behavior of a characteristic vapor species (for example A(g) for component A) from the reference material and the solution phase. Provided the vapor in equilibrium with the condensed sample behaves ideally, the sublimation reaction can be studied by measuring the partial pressure, pA, as a function of temperature. The sublimation reactions for component A are shown in equations (4a) and (4b). For pure-A as the α-phase (the reference state) a(A) = 1 and o
AA pp = by definition. A(g)A =α o
ApRTG lnsub −=∆ α (4a)
NASA/CR—2005-213330 3
A(g)BABA yxy1x += γγ+ AA pRTG lnsub −=∆ γ (4b)
The mixing reaction, equation (3a), is obtained by subtracting the sublimation reaction for the
solution phase from the reference state, equation (4a) – (4b) and as shown in equation (2) the activity of component A in γ
yx BA can be determined directly at a given temperature by comparing the partial pressure of a characteristic vapor species in equilibrium with the alloy, pA, to its pressure in equilibrium with the reference state, o
Ap . The procedure then is to determine component activities by measuring this pressure ratio as a function of absolute temperature, T, and alloy composition.
A mass spectrometer coupled to a Knudsen effusion-cell vapor source (KEMS) allows the simultaneous determination of the identity and relative pressure of the vapor species in equilibrium with a condensed sample as a function of temperature.8 The partial pressure of a species is determined indirectly by sampling its flux in a molecular beam (selected from the distribution of effusing molecules) by electron bombardment and the formation of a representative ion beam that is sorted according to mass-to-charge ratio by common mass spectrometric techniques. The partial pressure, pA, in the effusion-cell is related to the measured intensity of ion K+ formed from species A, IAK, and T by the well known relationship
AK
AKA
STIp = (5)
where SAK is the instrument sensitivity factor (and is species specific). The indirect nature of the measurement means IAK is affected by a range of factors unrelated to sample composition and temperature, as shown with expansion of SAK AKKAKKAK fEzyxgS γτσε= )(),,( (6) where, g, is the “geometry factor”, εK(x,y,z), the ion extraction efficiency, σAK(E), the ionization cross-section, τK, the transmission probability of the mass analyzer, γK, the detection coefficient and, fA, is the isotopic abundance. The first three terms describe the interaction between the molecular- and electron-beams and are important for the successful implementation of the multiple effusion-cell configuration. The measurement of absolute partial pressure requires the determination of SAK, which can be difficult, particularly for systems with a vapor phase that contains many vapor species. Thus, the traditional approach in KEMS is to assume SAK is constant and only consider relative partial pressures (i.e., TIp AKA ∝ ). This is seen with the “second-law” determination of enthalpies of sublimation by the Clausius-Clapeyron (or van’t Hoff) equation; where equation (5) is substituted into energetic expression, equation (4a) (or equation (4b)).
AK
oAsub
oAsubo
AK SR
STR
HTI ln1ln +∆
+∆
−=
RH
TdTId
Tdpd o
AsuboAK
oA ∆
−==)1(
ln)1(
ln (7)
The ideal approach to measuring component activities with KEMS is to maintain this relative nature.
This is achieved by including multiple effusion cells in the isothermal zone of a furnace and directly comparing the partial pressure of characteristic vapor species in equilibrium with the alloy (alloy, pA, IAK) and experimental reference state (ref, o
Ap , oAKI ) at one temperature.9–12
NASA/CR—2005-213330 4
)(
)()(
)()(alloygrefg
II
alloySrefS
TITI
ppAa o
AK
AK
AK
AKoAK
AKoA
A ⋅=⋅⋅⋅
== (8)
This is a direct measurement of activity based on the definition of equation (2) and requires no
comparison to the tabulated thermodynamic data. All factors in SAK related to ionization and mass spectra analyses are identical for the effusion-cell containing the alloy (alloy) and reference (ref) and therefore cancel. However, the geometric relation between the molecular- and electron-beam remain and is represented by, g(ref)/g(alloy), the “geometry factor ratio” (GFR). Provided the cells are isothermal and the ionization volume remains constant, the GFR is only a function of relative orifice shape.13 The GFR for each pair of cells is measured in a complementary experiment with the same reference material in all effusion cells.
Unfortunately the high vapor pressure and reactivity of pure aluminum prohibit use of the procedure identified by equation (8) for a range of important systems. These systems require the use of a secondary reference (pure gold is ideal) in a method similar to that used with a single-cell configured KEMS, but with the advantages offered with the multiple-cell configuration. In this method component activities are determined at each temperature, T, by comparing the measured pressure ratio (of the characteristic vapor
species in equilibrium with the alloy, A(g), and secondary reference, Au(g)), oAu
A
pp , to the ratio of the
secondary reference over the pure-element reference, )()(
TpTp
oAl
oAu , from the tabulated thermodynamic data
(or a previous experimental measurement with pure Al and Au in adjacent effusion cells).
)()(
)(TpTp
ppAa o
A
oAu
oAu
A ⋅= (9)
The comparison between measured and tabulated data is made at specific temperatures, making
temperature measurement a critical issue. As different vapor species are compared, many factors in the instrument sensitivity factor for each of those species remain and equation (9) expands to the following
)()(
)()(
)()()(
TpTp
ff
alloygrefg
EE
IIAa o
A
oAu
A
Au
KAK
AuAuoAu
AK ⋅⋅⋅γσγσ
⋅= (9b)
This method requires both ionization cross-section ratios for the different vapor species and measured
GFR for the different effusion cells. A major advantage of a well designed multi-cell KEMS system is that no assumptions need to be made about ionization cross-section ratios.13 The required ionization cross-section ratios are measured in a separate experiment with the secondary reference (pure Au) and reference state (pure A) in adjacent effusion cells where the measured ion intensity ratios are compared to the tabulated thermodynamic data.
)()(
TpTp
pp
oAu
oA
oAu
oA =
expanding
)()(
)()()()(
TpTp
fEAgfEAug
TITI
oAu
oA
AAA
AuAuAuoAu
oA =
γσγσ
⋅
NASA/CR—2005-213330 5
rearranging
)()(
)()(
)()(
TpTp
ff
AugAg
II
EE
oAu
oA
Au
AoA
oAu
AA
AuAu ⋅⋅⋅=γσγσ (10)
An ionization cross-section ratio measurement is the most difficult experiment as there has to be good
agreement with the tabulated data, however, the measured ratios should be regarded as instrument specific.14 Also due to different shape of the ionization efficiency curve for each species, care must be taken to ensure a consistent electron energy is used for all calibration and activity measurements.
Despite the theoretical simplicity of the multiple-cell configuration, a range of challenging experimental conditions need to be achieved before meaningful activity measurements are obtained. These include: 1) isothermal effusion cells, 2) accurate absolute T measurements, 3) sampling from all effusion cells at a uniform temperature, 4) molecular beam sampling that is independent of vapor source, 5) selection of a consistent portion of the effusate distribution from each cell, 6) quantify variations in the effusate distribution due to variation in cell orifice shape. These requirements are met and a detailed discussion of the instrument, theory and measurement procedure will be available in reference 13. In reference 13 the two methods of measuring activity (i.e., using equations (8) and (9b)) are compared. Both methods give consistent results and the secondary reference method equation (9b) was used in this study.
Experimental Procedures
Alloy Preparation
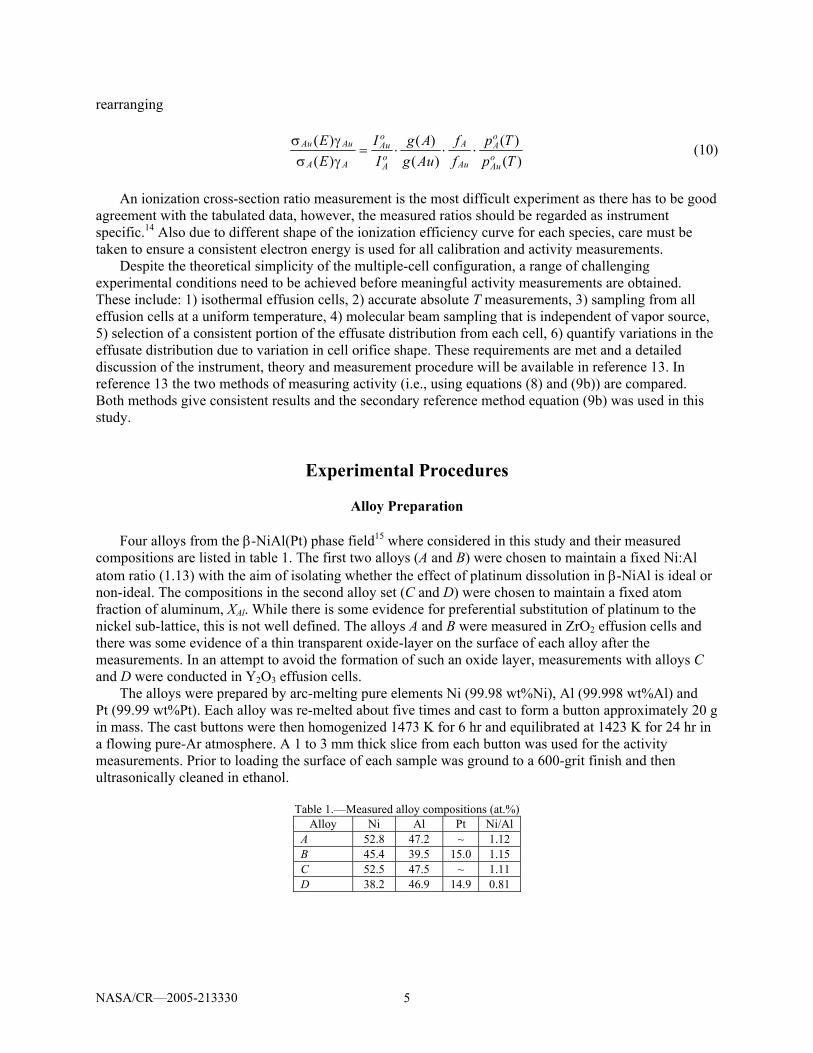
Four alloys from the β-NiAl(Pt) phase field15 where considered in this study and their measured compositions are listed in table 1. The first two alloys (A and B) were chosen to maintain a fixed Ni:Al atom ratio (1.13) with the aim of isolating whether the effect of platinum dissolution in β-NiAl is ideal or non-ideal. The compositions in the second alloy set (C and D) were chosen to maintain a fixed atom fraction of aluminum, XAl. While there is some evidence for preferential substitution of platinum to the nickel sub-lattice, this is not well defined. The alloys A and B were measured in ZrO2 effusion cells and there was some evidence of a thin transparent oxide-layer on the surface of each alloy after the measurements. In an attempt to avoid the formation of such an oxide layer, measurements with alloys C and D were conducted in Y2O3 effusion cells.
The alloys were prepared by arc-melting pure elements Ni (99.98 wt%Ni), Al (99.998 wt%Al) and Pt (99.99 wt%Pt). Each alloy was re-melted about five times and cast to form a button approximately 20 g in mass. The cast buttons were then homogenized 1473 K for 6 hr and equilibrated at 1423 K for 24 hr in a flowing pure-Ar atmosphere. A 1 to 3 mm thick slice from each button was used for the activity measurements. Prior to loading the surface of each sample was ground to a 600-grit finish and then ultrasonically cleaned in ethanol.
Table 1.—Measured alloy compositions (at.%) Alloy Ni Al Pt Ni/Al
A 52.8 47.2 ~ 1.12 B 45.4 39.5 15.0 1.15 C 52.5 47.5 ~ 1.11 D 38.2 46.9 14.9 0.81
NASA/CR—2005-213330 6
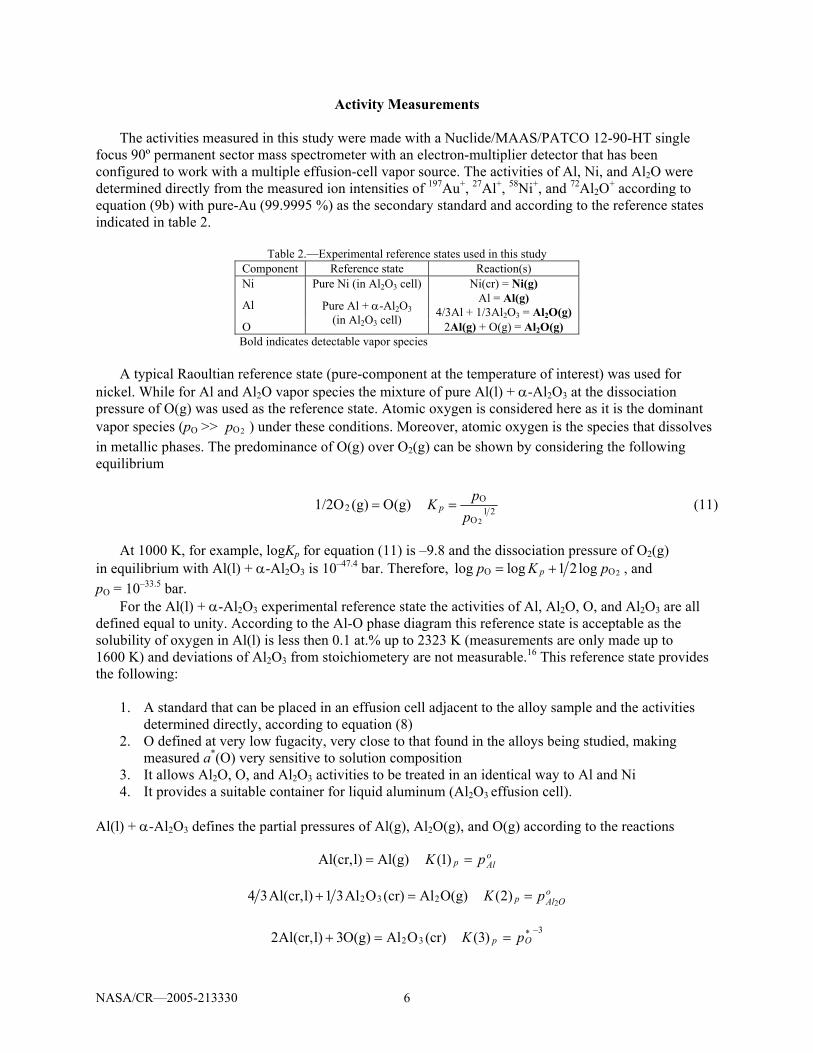
Activity Measurements The activities measured in this study were made with a Nuclide/MAAS/PATCO 12-90-HT single
focus 90º permanent sector mass spectrometer with an electron-multiplier detector that has been configured to work with a multiple effusion-cell vapor source. The activities of Al, Ni, and Al2O were determined directly from the measured ion intensities of 197Au+, 27Al+, 58Ni+, and 72Al2O+ according to equation (9b) with pure-Au (99.9995 %) as the secondary standard and according to the reference states indicated in table 2.
Table 2.—Experimental reference states used in this study Component Reference state Reaction(s) Ni Pure Ni (in Al2O3 cell) Ni(cr) = Ni(g)
Al Al = Al(g) 4/3Al + 1/3Al2O3 = Al2O(g)
O
Pure Al + α-Al2O3 (in Al2O3 cell) 2Al(g) + O(g) = Al2O(g)
Bold indicates detectable vapor species
A typical Raoultian reference state (pure-component at the temperature of interest) was used for nickel. While for Al and Al2O vapor species the mixture of pure Al(l) + α-Al2O3 at the dissociation pressure of O(g) was used as the reference state. Atomic oxygen is considered here as it is the dominant vapor species (pO >> 2Op ) under these conditions. Moreover, atomic oxygen is the species that dissolves in metallic phases. The predominance of O(g) over O2(g) can be shown by considering the following equilibrium
(g)O(g)1/2O2 = 21O
O
2ppK p = (11)
At 1000 K, for example, logKp for equation (11) is –9.8 and the dissociation pressure of O2(g)
in equilibrium with Al(l) + α-Al2O3 is 10–47.4 bar. Therefore, 2OO log21loglog pKp p += , and pO = 10–33.5 bar.
For the Al(l) + α-Al2O3 experimental reference state the activities of Al, Al2O, O, and Al2O3 are all defined equal to unity. According to the Al-O phase diagram this reference state is acceptable as the solubility of oxygen in Al(l) is less then 0.1 at.% up to 2323 K (measurements are only made up to 1600 K) and deviations of Al2O3 from stoichiometery are not measurable.16 This reference state provides the following:
1. A standard that can be placed in an effusion cell adjacent to the alloy sample and the activities
determined directly, according to equation (8) 2. O defined at very low fugacity, very close to that found in the alloys being studied, making
measured a*(O) very sensitive to solution composition 3. It allows Al2O, O, and Al2O3 activities to be treated in an identical way to Al and Ni 4. It provides a suitable container for liquid aluminum (Al2O3 effusion cell).
Al(l) + α-Al2O3 defines the partial pressures of Al(g), Al2O(g), and O(g) according to the reactions Al(g)l)Al(cr, = o
Alp pK =)1( O(g)Al(cr)OAl31l)Al(cr,34 232 =+ o
OAlp pK 2)2( =
(cr)OAlO(g)3l)Al(cr,2 32=+ 3*)3( −= Op pK
NASA/CR—2005-213330 7
These partial pressures are a “Raoultian-based” reference state for Al(g), Al2O(g), and O(g). It is
important to identify the definition of the chemical potential of the compounds Al2O and Al2O3.6 In this study these are defined in terms of the chemical potentials of Al and O according to OAlOAl 22 µ=µ+µ (12a) 32OAlOAl 32 µ=µ+µ (12b)
Under the reducing conditions of the reference state and alloy sample, Al(g) and Al2O(g) are the dominant vapor species and only a(Al) and a(Al2O) can be measured directly by KEMS. However, additional independent reactions in the Al-O system allow a*(O) and a(Al2O3) to be determined indirectly from the measured Al and Al2O activities according to:
2Al(g) + O = Al2O(g) 22*
)Al()OAl()O(
aaa = (13)
4Al(g) + Al2O3 = 3Al2O(g) 4
32
32)Al(
)OAl()OAl(a
aa = (14)
The dissociation pressure of O(g) in equilibrium with Al(l) + α-Al2O3 defines a very stable (low
Gibbs free energy) reference state for oxygen (and also Al2O3). Therefore according to the definition of activity, equation (1), it is not uncommon to observe experimental oxygen activities significantly greater then unity. An a*(O) > 1 simply means the density of O atoms in the vapor in equilibrium with an alloy is greater then that in equilibrium with the reference state: ** )O( OO pap = . These experimental activities can be converted to more conventional values by changing the reference state of oxygen to an ideal gas, O2(g), with a partial pressure of 1 bar (i.e., 3/22*
2 )3()()O( −⋅= pKOaa ). This is discussed in more detail in the Appendix.
The measured ionization cross-section ratios used in these calculations were determined in separate experiments: σAuγAu /σAlγAl = 0.49±0.02, σAuγAu /σAl2OγAl2O = 0.55±0.03 and σAuγAu /σNiγNi = 0.77±0.02.13 These measurements were made with an electron-energy of 24.7 eV, which was maintained in all subsequent experiments by calibration with ionization potential measurements of Au+ and Al+. The thermodynamic data for the pure-standards was obtained from a combination of sources17–19 and were checked for consistency. The thermodynamic data of the reference state and the secondary standard (pure Au) were employed in terms of Gibbs free energy functions, FEF298, and any “second-law” measurements of enthalpies of sublimation of pure-substances were treated with the “third-law” method (i.e., in terms of ∆FEF298 = FEF298(products) − FEF298(reactants) and the enthalpy of reaction ∆RHº(298)).5,19–21 This type of treatment provides the thermodynamic data at the experimental temperatures and gives a systematic calculation method that helps determine data accuracy and identify any systematic errors.
T
HTGTFEFoo )15.298()()(298
−=
and
T
HSRTIRFEF
osub
AKoAK
)15.298(lnln)( 298
∆+−=−−∆ (15)
NASA/CR—2005-213330 8
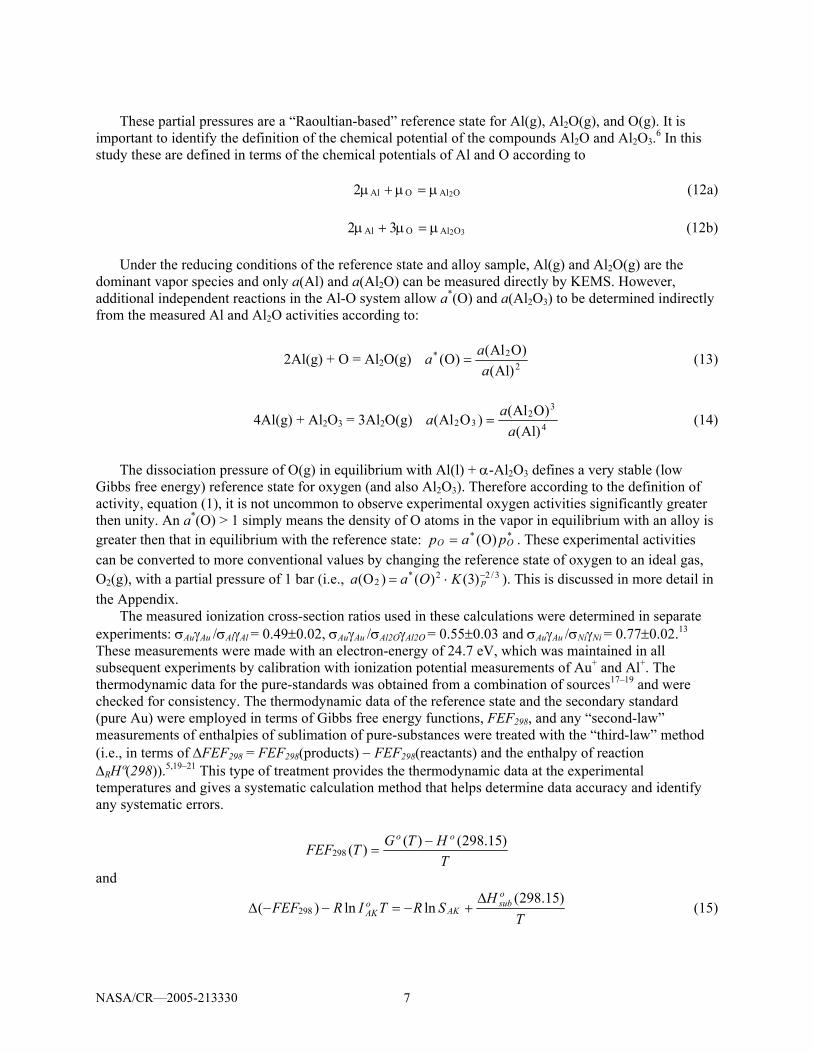
A schematic of the effusion cells used in this study is shown in figure 1. The gold-reference was placed in a thin graphite cup inside the effusion cell. The geometry factor ratios were not measured for the ZrO2-cells but no significant variation in orifice shape was observed. From experience the error introduced from variations in effusate distribution was expected to be less then 3 to 5 percent.
Consistent vapor pressure sampling is obtained with the inclusion of two fixed apertures (field φ 1 mm and source φ 2 mm) between the effusion cell and ion source.13,11 These apertures define an ionization volume that is independent of the vapor source. The alignment of all effusion orifices is monitored visually with a video camera mounted above the ion source chamber which sights through the fixed apertures.13 A typical vapor pressure measurement cycle involves adjusting the voltage of the furnace and allowing the system to stabilize for ~1 hour followed by (in this sequence): 1) moving to cell 1, measuring temperature and all ion intensities six times; 2) moving to cell 2, measuring all ion intensities six times; and 3) moving to cell 3, measuring all ion intensities six times. Steps 1 to 3 were repeated about 30 to 45 minutes apart. The typical variations in measured temperature and ion intensity between the two measurement cycles were ∆T < 0.5 K and ∆I+ < 1 percent, respectively. This is an excellent real-time check of the system stability and data quality. Measurements were taken over a range of temperatures in a predetermined “random” order to remove systematic errors. The reported measurements were made over three days.
The temperature of the effusion cells were measured with a photoelectric detector (Mikron M190V-TS, λ = 650 nm) pyrometer sighting a black-body source (φ 2.5 by 13.5 mm) machined into the bottom of the effusion-cell and Mo-cell holder. The target size ~1.7 mm diameter at 500 mm was fully within the black-body source and was aligned visually through the pyrometer’s optics. The pyrometer calibration was checked in every experimental run by measuring the melting point of Au (1337.5 K). In addition the enthalpy of sublimation of Au (equations (3a) and (4a)) was measured according to equation (15) and was used as a general check of temperature and pressure measurement over the experimental temperature range.
Prior to starting activity measurements, the first pair of alloy samples were inadvertently equilibrated at 1574 K for 60 hr. Initially this was of concern but subsequent checks made during the experiment gave no evidence to suggest that this adversely affected the samples or measured activities. Following the activity measurements the surface of the alloy samples were analyzed for the presence of any oxide-layers by XRD, Laue photographs, optical microscopy, SEM and XPS.
Results
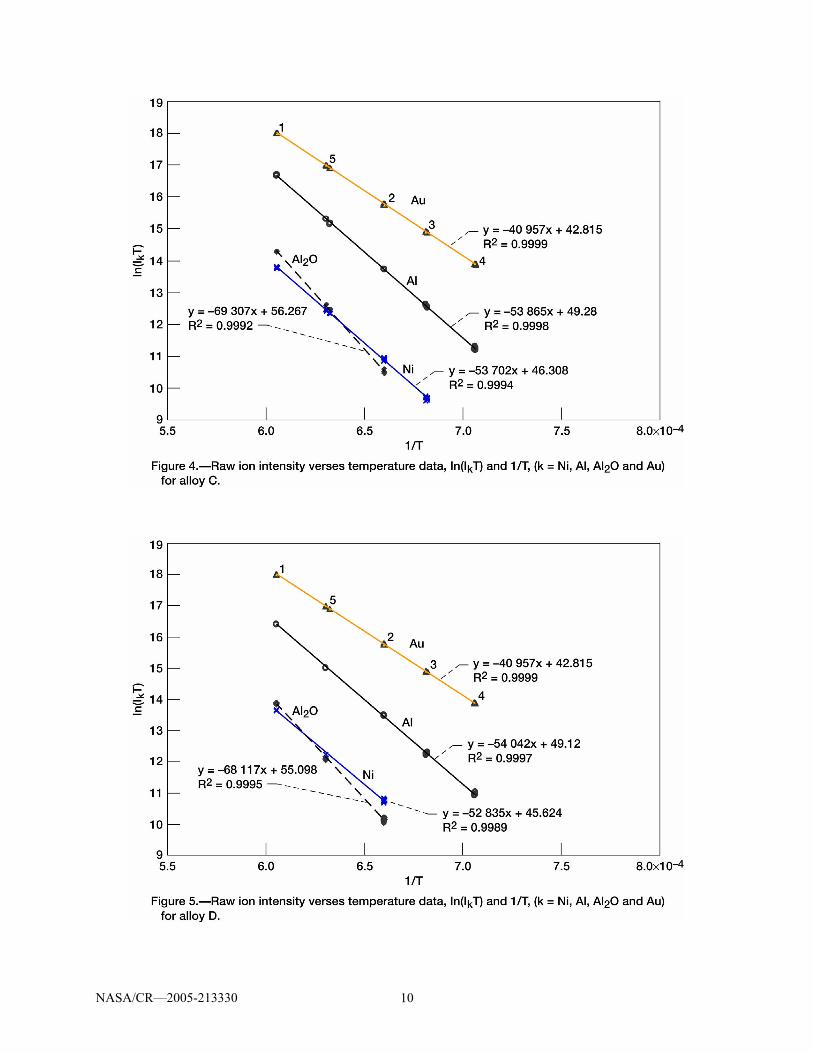
Figures 2 to 5 show the raw data for alloys A to D, in terms of ln(IAKT) and 1/T in accordance with a “second-law” treatment, equation (7). In all figures the numbers on the Au curve indicate the measurement sequence. The excellent linear correlations of all data indicate consistent vapor pressure sampling and temperature measurement throughout the experimental runs. The melting point of Au was measured as 1336.5 K (~1 K low) during the first experiment with alloys A and B. The “second-law” determination of the heat of sublimation of Au was measured as 360.0±1.4 kJ/mol (with 22 data-points) and 362.6±1.4 kJ/mol (10 data-points) in the experimental runs for alloys, A and B, and alloys, C and D, respectively. These values are a little lower then the expected value of 367.04±0.9 kJ/mol19, but are acceptable and indicate good-quality data.
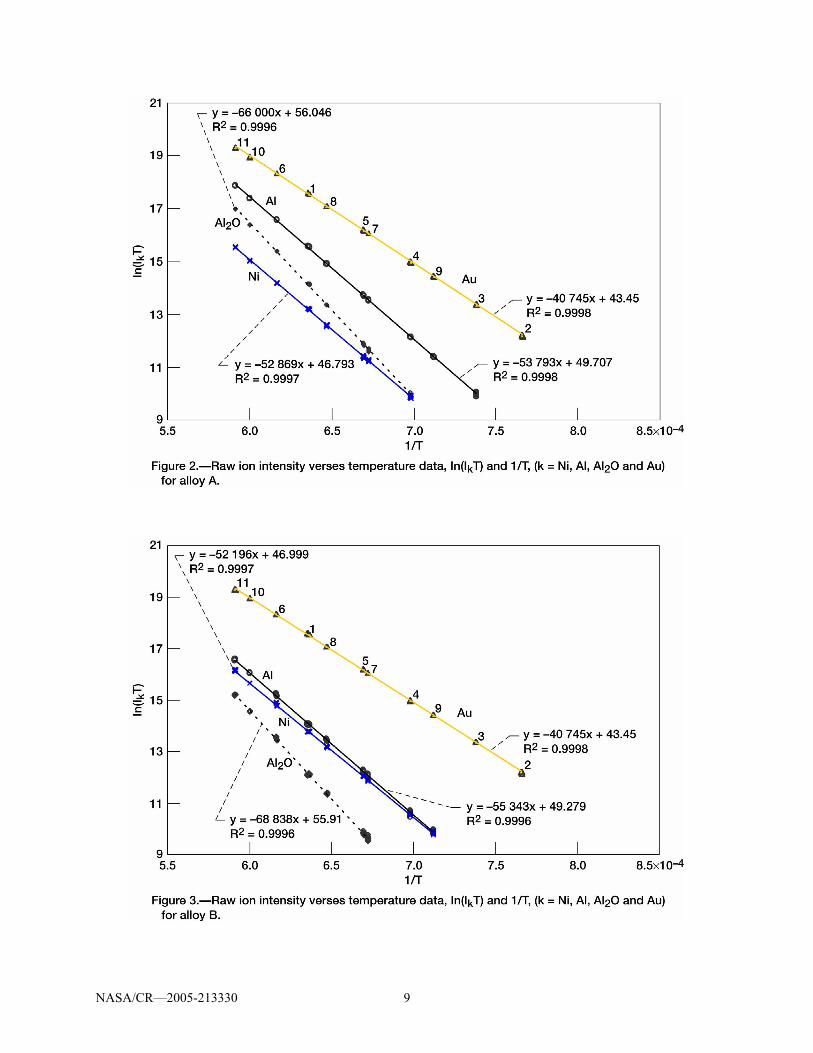
NASA/CR—2005-213330 9
NASA/CR—2005-213330 10
NASA/CR—2005-213330 11
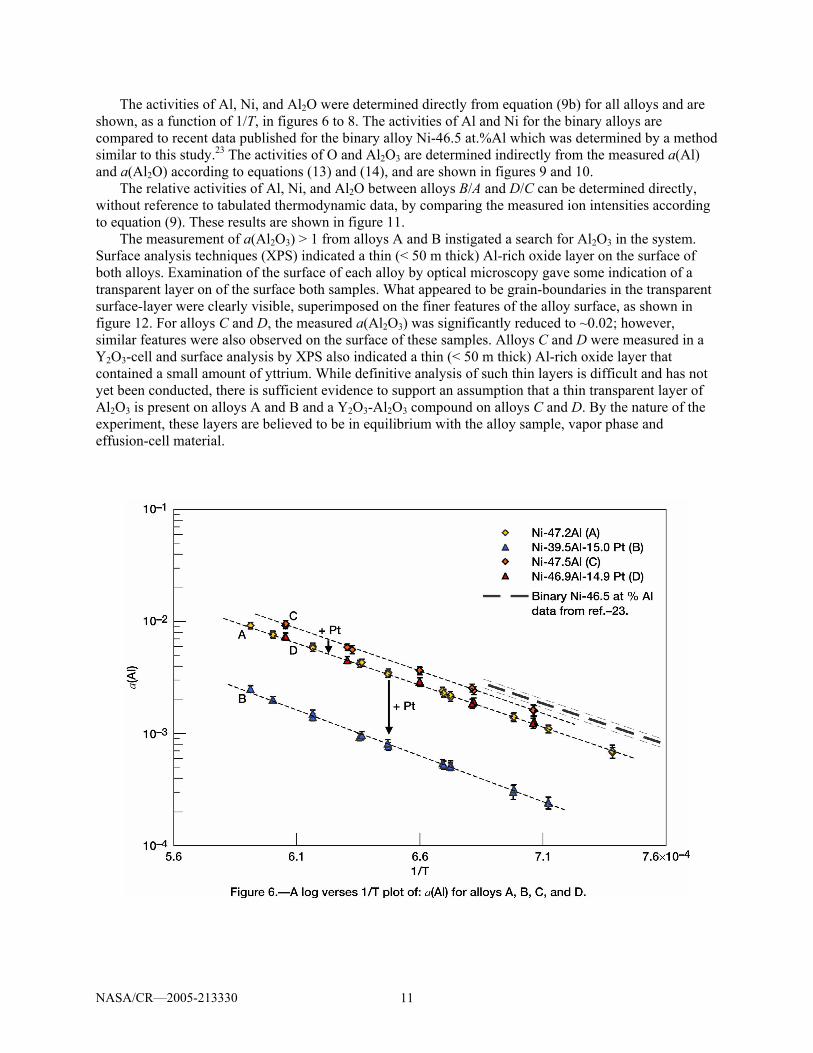
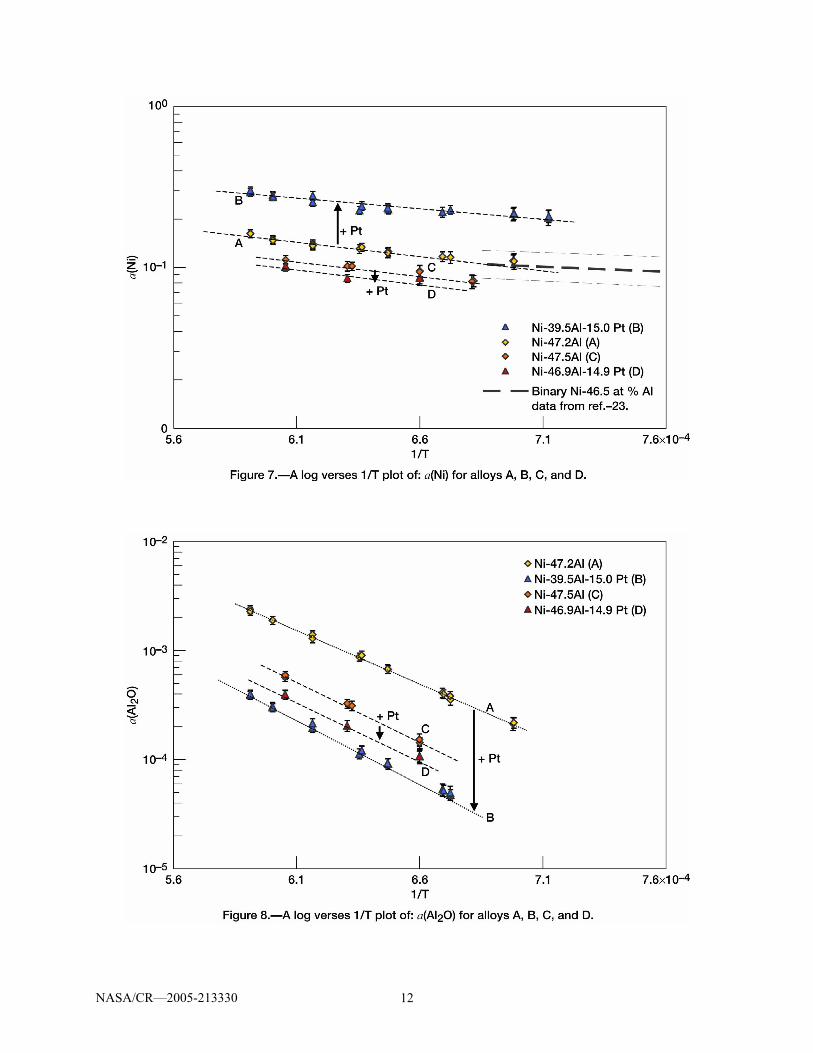
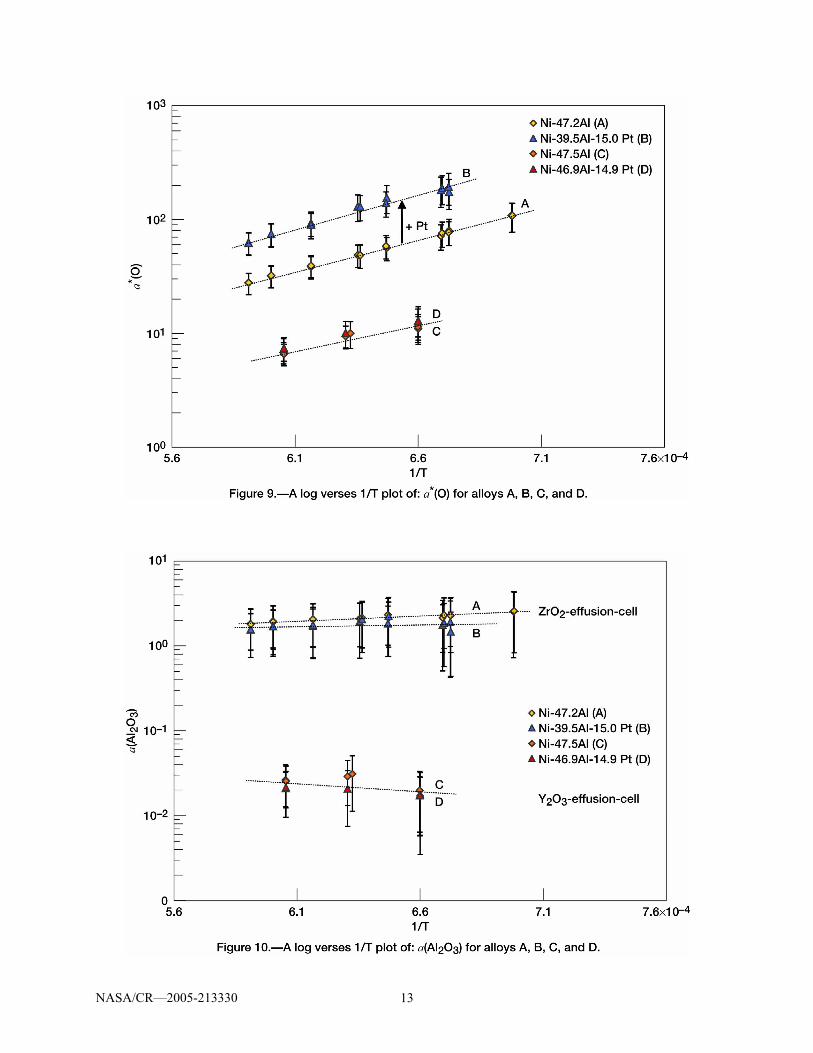
The activities of Al, Ni, and Al2O were determined directly from equation (9b) for all alloys and are shown, as a function of 1/T, in figures 6 to 8. The activities of Al and Ni for the binary alloys are compared to recent data published for the binary alloy Ni-46.5 at.%Al which was determined by a method similar to this study.23 The activities of O and Al2O3 are determined indirectly from the measured a(Al) and a(Al2O) according to equations (13) and (14), and are shown in figures 9 and 10.
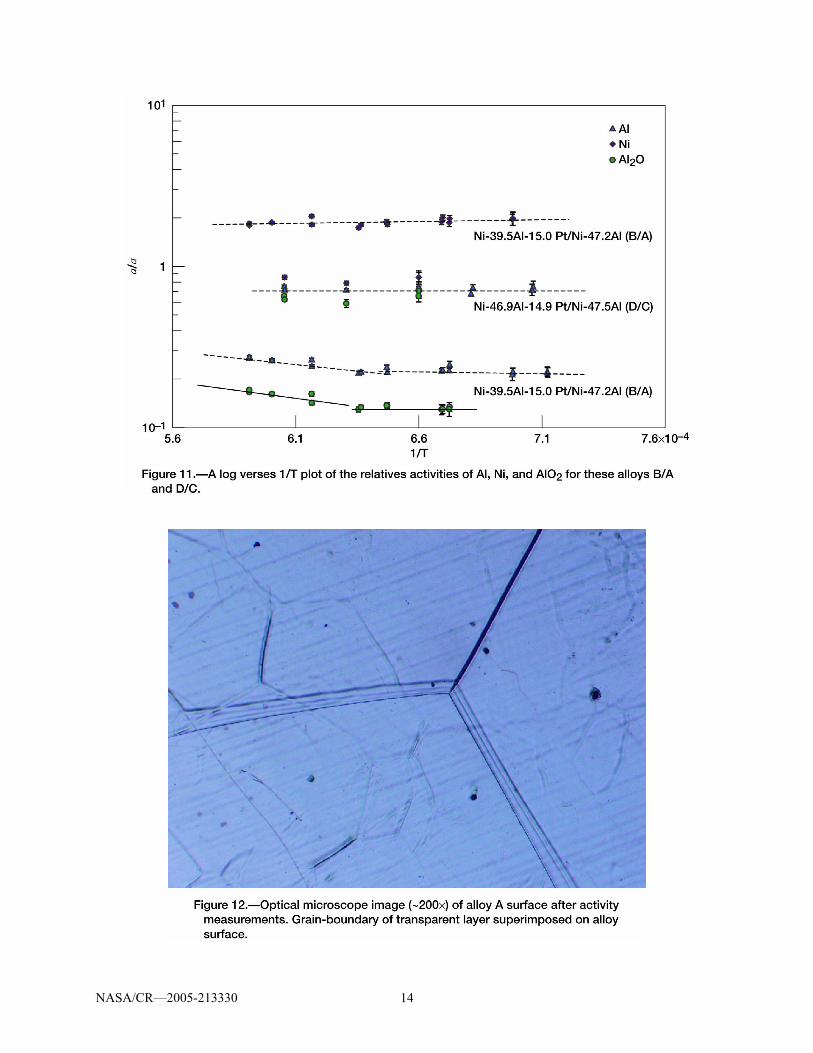
The relative activities of Al, Ni, and Al2O between alloys B/A and D/C can be determined directly, without reference to tabulated thermodynamic data, by comparing the measured ion intensities according to equation (9). These results are shown in figure 11.
The measurement of a(Al2O3) > 1 from alloys A and B instigated a search for Al2O3 in the system. Surface analysis techniques (XPS) indicated a thin (< 50 m thick) Al-rich oxide layer on the surface of both alloys. Examination of the surface of each alloy by optical microscopy gave some indication of a transparent layer on of the surface both samples. What appeared to be grain-boundaries in the transparent surface-layer were clearly visible, superimposed on the finer features of the alloy surface, as shown in figure 12. For alloys C and D, the measured a(Al2O3) was significantly reduced to ~0.02; however, similar features were also observed on the surface of these samples. Alloys C and D were measured in a Y2O3-cell and surface analysis by XPS also indicated a thin (< 50 m thick) Al-rich oxide layer that contained a small amount of yttrium. While definitive analysis of such thin layers is difficult and has not yet been conducted, there is sufficient evidence to support an assumption that a thin transparent layer of Al2O3 is present on alloys A and B and a Y2O3-Al2O3 compound on alloys C and D. By the nature of the experiment, these layers are believed to be in equilibrium with the alloy sample, vapor phase and effusion-cell material.
NASA/CR—2005-213330 12
NASA/CR—2005-213330 13
NASA/CR—2005-213330 14
NASA/CR—2005-213330 15
Discussion: Effect of Transparent Oxide Layers on the Measured Activities
The measurements made in this study differ from those typically made by this technique in that the Al(l) + α-Al2O3 experimental reference state was used together with systematic measurements of I+
Al2O and I+
Al. This allows the routine determination of a(Al), a(Al2O), a*(O) and a(Al2O3) for a system that contains significant aluminum and some oxygen. Prior to starting these experiments, any Al2O(g) observed was expected to be due to the reaction, 2Al(g) + O =Al2O(g), with pAl defined by the alloy sample and the oxygen activity defined by the effusion-cell (ZrO2 or Y2O3) under reducing conditions. In this case a*(O) would be expected to be ≤ 1 and independent of alloy sample. However, from figure 9, a*(O) is significantly greater than unity for all alloys and for the ZrO2 effusion cells is dependent on the alloy composition. In addition, for alloys A and B an a(Al2O3) value of 1 to 2 was measured. These results strongly suggest the effusion cell material was not controlling a*(O) and α-Al2O3 was present in the ZrO2 effusion cell. Indeed a transparent oxide layer appeared to exist on the surface of these samples after the activity measurements. For the measurements made in the Y2O3-cells a significant decrease in a(Al2O), a*(O) and a(Al2O3) was observed and a*(O) and a(Al2O3) appeared independent of the alloy sample. However, it should be noted that for alloys C and D little change was observed in a(Al), a(Ni) and a(Al2O), so there should have been no change in a*(O) or a(Al2O3). Based on the measured a(Al2O3) the oxide-layer observed on the samples in the Y2O3-cells was different from that measured in the ZrO2-cell.
An initial concern was whether an oxide-layer on the surface could affect the measured activities. The basis of the Knudsen effusion technique is the containment of the vapor in an isothermal finite volume. This “closed system” allows the state of equilibrium between the condensed and vapor phases to be approached as close as possible (≈equilibrium) while continuously sampling the vapor. Therefore the alloy sample, oxide-layer, inner surface of the effusion-cell (ZrO2 or Y2O3) and the vapor phase are all in equilibrium and the component activities are identical in all phases. However, an oxide-layer could affect the accuracy of vapor pressure sampling at the effusion orifice if the vaporization coefficient, αv, of the oxide-layer is significantly less than unity (where each vapor species can have a different αv). This is an issue of effusion-cell design, where the aim is to ensure the number of atoms involved in vaporization/condensation at the sample surface is much greater than the number of atoms effusing from the orifice while maintaining a high transport probability from the sample surface to the orifice. This is typically considered according to the analysis of Whitman 24 and Motzfeldt,25 which is summarized by the equation 26,27
⎥⎦
⎤⎢⎣
⎡⎥⎦⎤
⎢⎣⎡ −+α
+= 2111cvs
oome
WAAWpp (16)
where pe is the equilibrium partial pressure at the sample surface (see fig. 1), pm is the measured pressure at the effusion orifice (see fig. 1), Wo is the orifice Clausing-factor, Ao is the orifice area , Wc is the cell-body Clausing-factor and As is the sample surface area. The ZrO2 and Y2O3 effusion cells used in this study had different shaped orifices (ZrO2: φ 1.5 by 4.0 mm, Y2O3: φ 1.0 by 3.0 mm) resulting in the following variables in equation (16): Wo ~0.29 (ZrO2 and Y2O3), Ao 1.76 mm2 (ZrO2) and 0.78 mm2 (Y2O3), Wc ~0.67 (ZrO2) and ~0.61 (Y2O3), As 78.5 mm2 (ZrO2 and Y2O3). The measured range of αv for α-Al2O3, under reducing conditions, is 1 to 0.1 with an accepted value of ~0.3.28 Thus, for the effusion cells used in this study the ratio pm / pe determined from equation (16) for αv = 0.3 is 0.981 (ZrO2-cells) and 0.992 (Y2O3-cells). Provided αv is not less then 0.1 the presence of the oxide layer will not significantly affect the activity measurements compared to other sources of error.
The small increase in the measured activities observed for alloy C relative to alloy A could be due to the improved vapor sampling of the Y2O3-cells but must also be related to different vaporization coefficients (due to a different oxide-layer) and the fact that geometry factor ratios were not measured for the ZrO2-cells. The good agreement with published binary data (shown in figs. 6 and 7) also suggest these
NASA/CR—2005-213330 16
oxide-layers are not affecting the current measurements (or a similar unobserved oxide-layer was present in the other studies). While it is concluded here that these oxide-layers are not affecting the measured activities, more detailed studies are required to determine αv for Ni(g), Al(g) and Al2O(g) from these oxide-layers.
Effect of Pt on a(Al) and a(Ni) in β-NiAl
The activities measured for these alloys, figures 6, 7, and 11, appear to indicate that the addition of Pt to binary β-NiAl decreases a(Al) and increases a(Ni) over the temperature range 1354 to 1692 K. In addition, the temperature dependence of the activities observed in figures 6, 7, and 9 provide partial molar enthalpies and entropies of mixing of Al and Ni as a function of alloy composition according to
R
STR
Hia imiximix ∆−
∆=
1)(ln (17)
The linear regression of lnai verses 1/T for the Al and Ni activities in alloys A, B, and D are
summarized in table 3. A decrease in AlHmix∆ of ~12 kJ/mol (8 % decrease) is observed between alloys A and B indicates Al-atoms are more tightly bound in alloy B. This agrees with the observed decrease in a(Al) but the decrease in activity is also due to a decrease in Al concentration of about 16 percent. Identical mixing behavior, however, is seen for alloys A and D which suggests a strong self interaction for Al while Ni and Pt have similar interactions with Al in β-NiAl(Pt). Conversely an increase in NiHmix∆ of ~6 kJ/mol (20 % increase) indicates a decrease in binding energy of Ni atoms in β-NiAl with the addition of Pt. The change in binding energy for Ni appears to be independent of the Al concentration. This corresponds to the observed increase in a(Ni) with Pt addition despite the decrease in Ni concentration (of about 14 % for A→B and 27 % for A→D) and suggests a positive interaction between Ni and Pt in β-NiAl(Pt).
Table 3.—Partial enthalpies and entropies of mixing Ni-47Al (A) Ni-40Al-15Pt (B) Ni-47Al-15Pt (D)
AlHmix∆ –146.2±0.8 kJ/mol –158.6±1.9 kJ/mol –145.5±2.4 kJ/mol
AlSmix∆ –47.4±0.5 J/mol K –43.5±1.2 J/mol K –47.2±1.6 J/mol K
NiHmix∆ –29.1±1.8 kJ/mol –23.2±2.2 kJ/mol –23.8±7.5 kJ/mol
NiSmix∆ –1.7±1.1 J/mol K –3.2±1.5 J/mol K 4.8±4.7 J/mol K
OHmix∆ 104.6±1.1 kJ/mol 112.0±4.6 kJ/mol ---
OSmix∆ 34.0±0.7 J/mol K 31.4±2.9 J/mol K ---
Mean T ≈ 1527 K
Similar analysis of the temperature dependence of the activities of Al2O, O and Al2O3 (figs. 8, 9, and 10) can be made but it is less-clear how to interpret the data for Al2O and Al2O3. The positive temperature dependence observed for a*(O) is interesting and straightforward. Specifically, since a negative iHmix∆ indicates that dissolution is energetically favorable, a positive value indicates O is more likely to exist as Al2O3 in equilibrium with an Al-containing alloy rather than dissolved in the alloy (or an oxide-layer). This analysis shows an advantage of using the Al(l) + Al2O3 reference state, as these subtle affects would not be observable if O(g) or O2(g) at 1 bar was used.
The described measurements clearly determine the partial properties of Al and Ni at the composition of each alloy but provide no information about the effect Pt has on a(Al) and a(Ni) in β-NiAl, which was the goal of this study. Before the effect of Pt can be identified the contributions of Al and Ni need to be
NASA/CR—2005-213330 17
understood and accounted for. How this is done is completely arbitrary and is due to the model used to describe the relationship between composition and Gibbs energy, Gβ, of the β-NiAl phase. At constant T and P, with composition defined in terms of mole fraction Xi; the Gβ is the weighted sum of the partial molar Gibbs energies (chemical potentials) of the components.4 ∑ ββ µ=
iii XG (18)
For the mixing reaction, equation (3), β∆ Gmix is expressed in terms of component activities, i.e., ( )∑ ∑=µ−µ=∆ ββ
i iii
oii iaXRTXG )(lnmix (19)
The mixing reaction to form a solution can be divided into: ideal mixing, id
mixG∆ , and excess mixing, ex
mixG∆ , which correspond to the definition of the activity coefficient, ii Xia )(γ = : where
ii XRTG lnidmix =∆ and ii RTG γ=∆ lnex
mix . Therefore exmixG∆ can be expressed in terms of the
activity coefficients, according to equation (20):
ex
mixid
mixmix GGG ∆+∆=∆ β ∑ γ=∆
iiiXRTG lnex
mix (20)
Therefore the representation of the composition dependence of Gβ only requires a suitable expression
for exmixG∆ as a function of composition. From the expression of ex
mixG∆ the corresponding functions for lnγi are determined according to general thermodynamic relation, equation (21), which is defined for the ternary (1-2-3) for each component for constant, X2/X3, X1/X3, and X1/X2, respectively.32
( )
32 /
1
exmix
1
exmix
1 1ln
XX
dXRT
GdX
RTG
⎟⎟⎟⎟⎟
⎠
⎞
⎜⎜⎜⎜⎜
⎝
⎛⎟⎟⎠
⎞⎜⎜⎝
⎛ ∆
−+∆
=γ (21)
The complexity of the model comes from the system studied and the amount of experimental data.
The simplest, thermodynamically consistent, expression for a non-regular Ni-Al-Pt solution that can represent finite compositions is the ‘quadratic’ equation developed by Darken and is shown in equation 22 with Ni taken as the solvent.33,34 The corresponding expressions for the logarithm of the activity coefficients of Ni, Al, and Pt are given in equations (23a) to (23c), respectively. If NiAlAlln α=γo and NiPtPtln α=γo then equation (22) reduces to the ternary regular solution model.
( ) PtAlAlPtNiPtNiAl2PtNiPt
2AlNiAlPt3AlAl
exmix lnln XXXXXXRT
G oo α−α+α−α+α+γ+γ=∆ (22)
( ) PtAlAlPtNiPtNiAl
2PtNiPt
2AlNiAlNiln XXXX α−α+α+α+α=γ (23a)
NASA/CR—2005-213330 18
[ ] ( ) NiPtNiPtNiAlAlPtAlNiAlAlAl ln2ln γ+α−α−α+α−=γγ XXo (23b) [ ] ( ) NiAlNiPtNiAlAlPtPtNiPtPtPt ln2ln γ+α−α−α+α−=γγ XXo (23c)
This model involves 5 parameters or coefficients (αNiAl, αNiPt, αAlPt, oAlγ and o
Ptγ ) that are determined from experimental data. The alpha coefficients (αNiAl, αNiPt and αAlPt) have no physical meaning but represent the interaction between Ni-Al, Ni-Pt, and Al-Pt in a Ni-based solution while and o
Alγ and oPtγ
represent the activity coefficients of the solutes at infinite dilution in β-NiAl.34–36,6 The alpha coefficients can be related to the ‘first-order interaction parameters’ of a Taylor series expansion of the logarithm of the activity coefficient (when XNi → 1), as shown below.34–36,6
NiAl0Al
AlAlAl 2ln
Al
α−=∂
γ∂=ε
→XX, NiPt
0Pt
PtPtPt 2ln
Pt
α−=∂
γ∂=ε
→XX,
NiPtNiAlAlPt0Pt
AlAlPt
Pt
lnα−α−α=
∂γ∂
=ε→XX
(24)
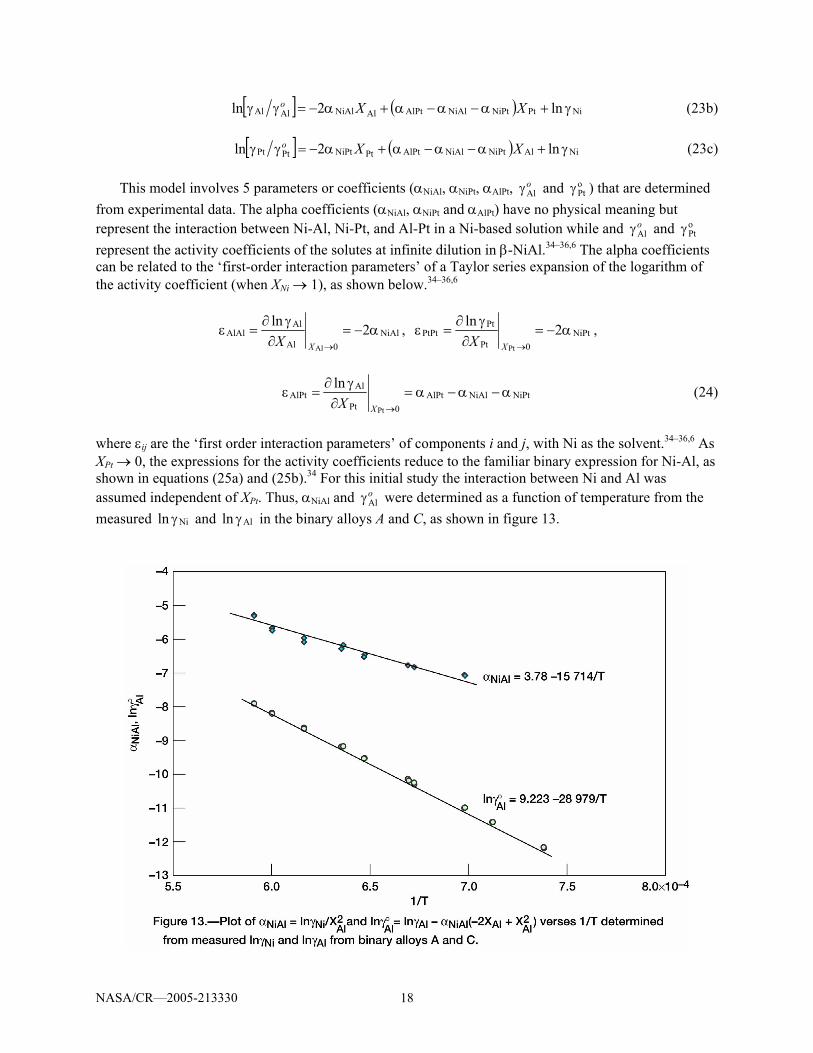
where εij are the ‘first order interaction parameters’ of components i and j, with Ni as the solvent.34–36,6 As XPt → 0, the expressions for the activity coefficients reduce to the familiar binary expression for Ni-Al, as shown in equations (25a) and (25b).34 For this initial study the interaction between Ni and Al was assumed independent of XPt. Thus, αNiAl and o
Alγ were determined as a function of temperature from the measured Niln γ and Alln γ in the binary alloys A and C, as shown in figure 13.
NASA/CR—2005-213330 19
2AlNiAlNiln Xα=γ (25a)
[ ] ( )2
AlAlNiAlAlAl 2ln XXo +−α=γγ (25b)
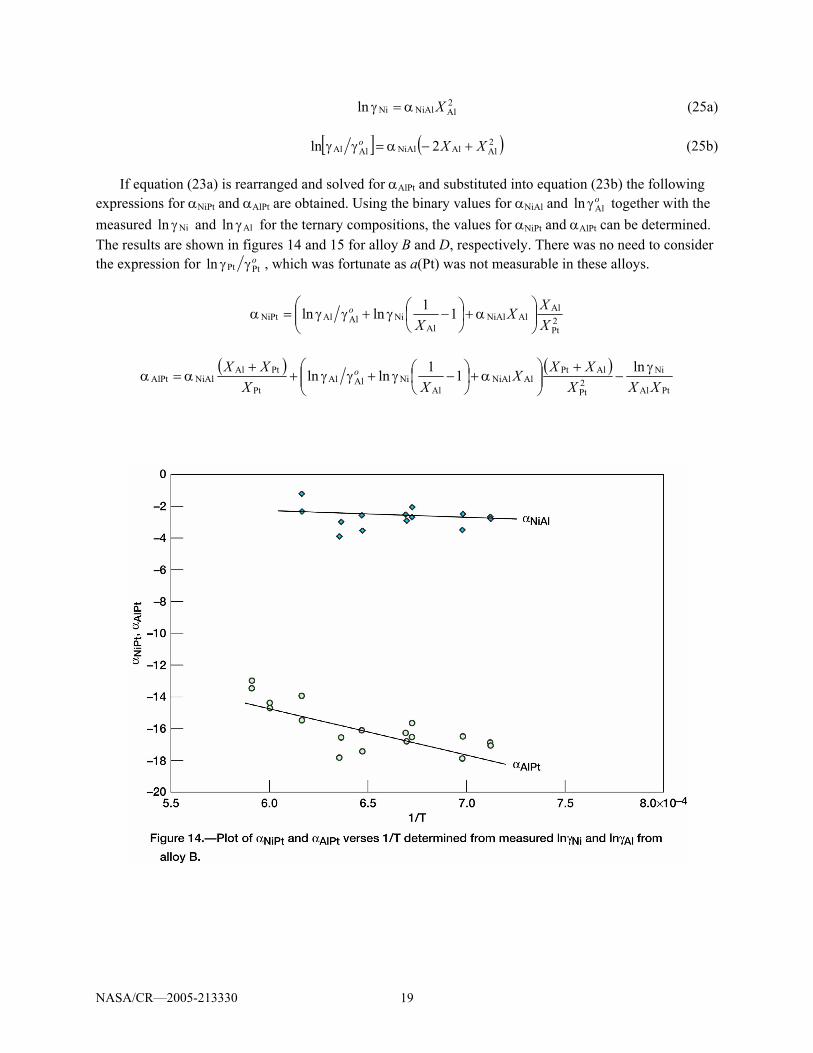
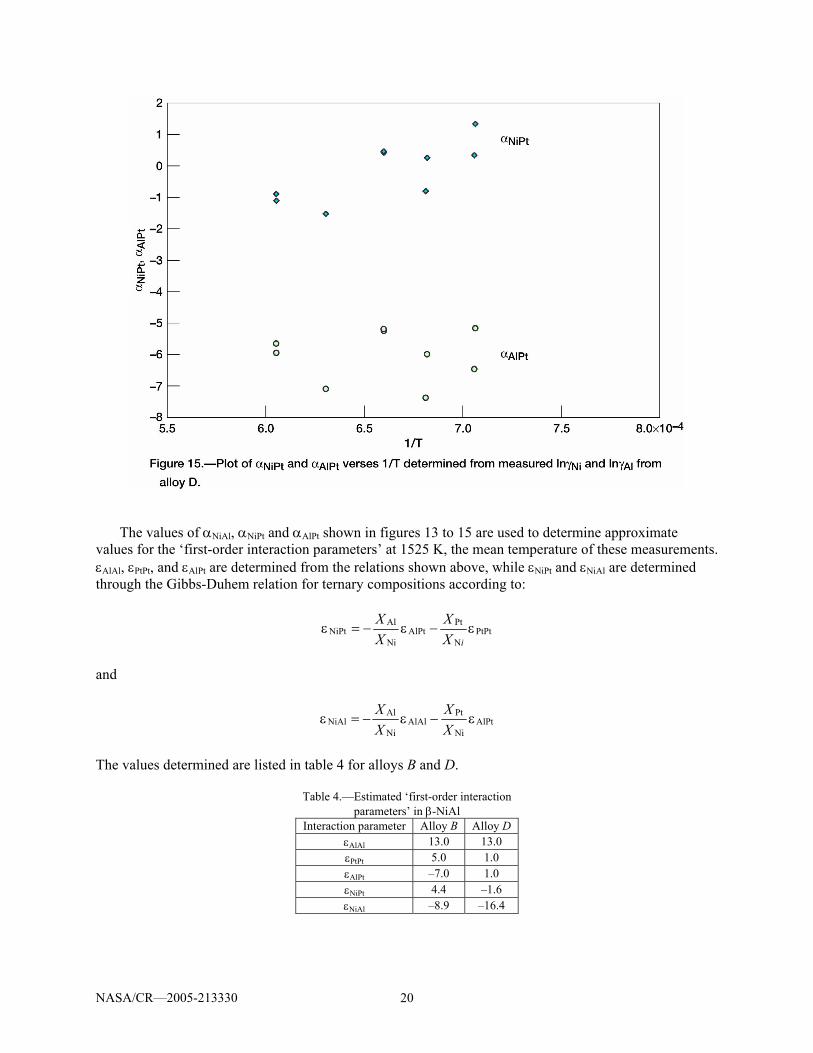
If equation (23a) is rearranged and solved for αAlPt and substituted into equation (23b) the following expressions for αNiPt and αAlPt are obtained. Using the binary values for αNiAl and o
Alln γ together with the measured Niln γ and Alln γ for the ternary compositions, the values for αNiPt and αAlPt can be determined. The results are shown in figures 14 and 15 for alloy B and D, respectively. There was no need to consider the expression for o
PtPtln γγ , which was fortunate as a(Pt) was not measurable in these alloys.
2Pt
AlAlNiAl
AlNiAlAlNiPt 11lnln
XXX
Xo
⎟⎟⎠
⎞⎜⎜⎝
⎛α+⎟
⎠⎞
⎜⎝⎛ −γ+γγ=α
( ) ( )PtAl
Ni2Pt
AlPtAlNiAl
AlNiAlAl
Pt
PtAlNiAlAlPt
ln11lnlnXXX
XXXXX
XX o γ−
+⎟⎟⎠
⎞⎜⎜⎝
⎛α+⎟
⎠⎞
⎜⎝⎛ −γ+γγ+
+α=α
NASA/CR—2005-213330 20
The values of αNiAl, αNiPt and αAlPt shown in figures 13 to 15 are used to determine approximate values for the ‘first-order interaction parameters’ at 1525 K, the mean temperature of these measurements. εAlAl, εPtPt, and εAlPt are determined from the relations shown above, while εNiPt and εNiAl are determined through the Gibbs-Duhem relation for ternary compositions according to:
PtPtN
PtAlPt
Ni
AlNiPt ε−ε−=ε
iXX
XX
and
AlPtNi
PtAlAl
Ni
AlNiAl ε−ε−=ε
XX
XX
The values determined are listed in table 4 for alloys B and D.
Table 4.—Estimated ‘first-order interaction parameters’ in β-NiAl
Interaction parameter Alloy B Alloy D εAlAl 13.0 13.0 εPtPt 5.0 1.0 εAlPt –7.0 1.0 εNiPt 4.4 –1.6 εNiAl –8.9 –16.4
NASA/CR—2005-213330 21
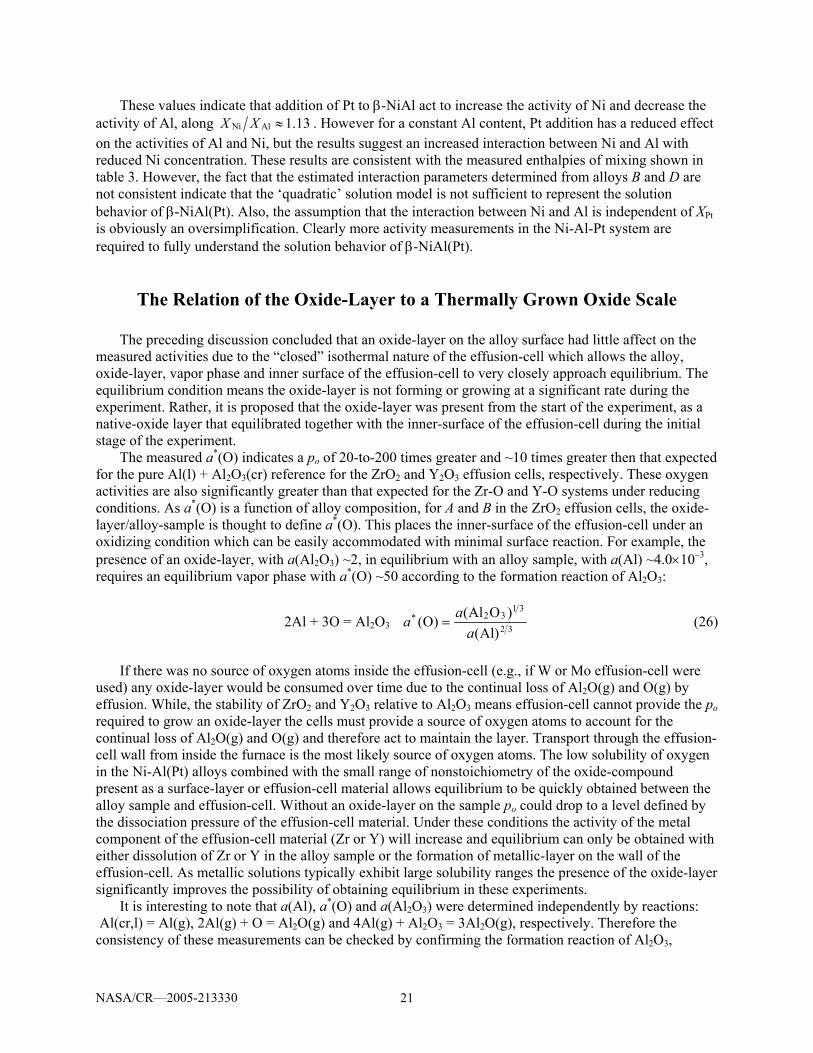
These values indicate that addition of Pt to β-NiAl act to increase the activity of Ni and decrease the activity of Al, along 13.1AlNi ≈XX . However for a constant Al content, Pt addition has a reduced effect on the activities of Al and Ni, but the results suggest an increased interaction between Ni and Al with reduced Ni concentration. These results are consistent with the measured enthalpies of mixing shown in table 3. However, the fact that the estimated interaction parameters determined from alloys B and D are not consistent indicate that the ‘quadratic’ solution model is not sufficient to represent the solution behavior of β-NiAl(Pt). Also, the assumption that the interaction between Ni and Al is independent of XPt is obviously an oversimplification. Clearly more activity measurements in the Ni-Al-Pt system are required to fully understand the solution behavior of β-NiAl(Pt).
The Relation of the Oxide-Layer to a Thermally Grown Oxide Scale
The preceding discussion concluded that an oxide-layer on the alloy surface had little affect on the measured activities due to the “closed” isothermal nature of the effusion-cell which allows the alloy, oxide-layer, vapor phase and inner surface of the effusion-cell to very closely approach equilibrium. The equilibrium condition means the oxide-layer is not forming or growing at a significant rate during the experiment. Rather, it is proposed that the oxide-layer was present from the start of the experiment, as a native-oxide layer that equilibrated together with the inner-surface of the effusion-cell during the initial stage of the experiment.
The measured a*(O) indicates a po of 20-to-200 times greater and ~10 times greater then that expected for the pure Al(l) + Al2O3(cr) reference for the ZrO2 and Y2O3 effusion cells, respectively. These oxygen activities are also significantly greater than that expected for the Zr-O and Y-O systems under reducing conditions. As a*(O) is a function of alloy composition, for A and B in the ZrO2 effusion cells, the oxide-layer/alloy-sample is thought to define a*(O). This places the inner-surface of the effusion-cell under an oxidizing condition which can be easily accommodated with minimal surface reaction. For example, the presence of an oxide-layer, with a(Al2O3) ~2, in equilibrium with an alloy sample, with a(Al) ~4.0×10⁻³, requires an equilibrium vapor phase with a*(O) ~50 according to the formation reaction of Al2O3:
2Al + 3O = Al2O3 32
3132*
)Al()OAl()O(
aaa = (26)
If there was no source of oxygen atoms inside the effusion-cell (e.g., if W or Mo effusion-cell were
used) any oxide-layer would be consumed over time due to the continual loss of Al2O(g) and O(g) by effusion. While, the stability of ZrO2 and Y2O3 relative to Al2O3 means effusion-cell cannot provide the po required to grow an oxide-layer the cells must provide a source of oxygen atoms to account for the continual loss of Al2O(g) and O(g) and therefore act to maintain the layer. Transport through the effusion-cell wall from inside the furnace is the most likely source of oxygen atoms. The low solubility of oxygen in the Ni-Al(Pt) alloys combined with the small range of nonstoichiometry of the oxide-compound present as a surface-layer or effusion-cell material allows equilibrium to be quickly obtained between the alloy sample and effusion-cell. Without an oxide-layer on the sample po could drop to a level defined by the dissociation pressure of the effusion-cell material. Under these conditions the activity of the metal component of the effusion-cell material (Zr or Y) will increase and equilibrium can only be obtained with either dissolution of Zr or Y in the alloy sample or the formation of metallic-layer on the wall of the effusion-cell. As metallic solutions typically exhibit large solubility ranges the presence of the oxide-layer significantly improves the possibility of obtaining equilibrium in these experiments.
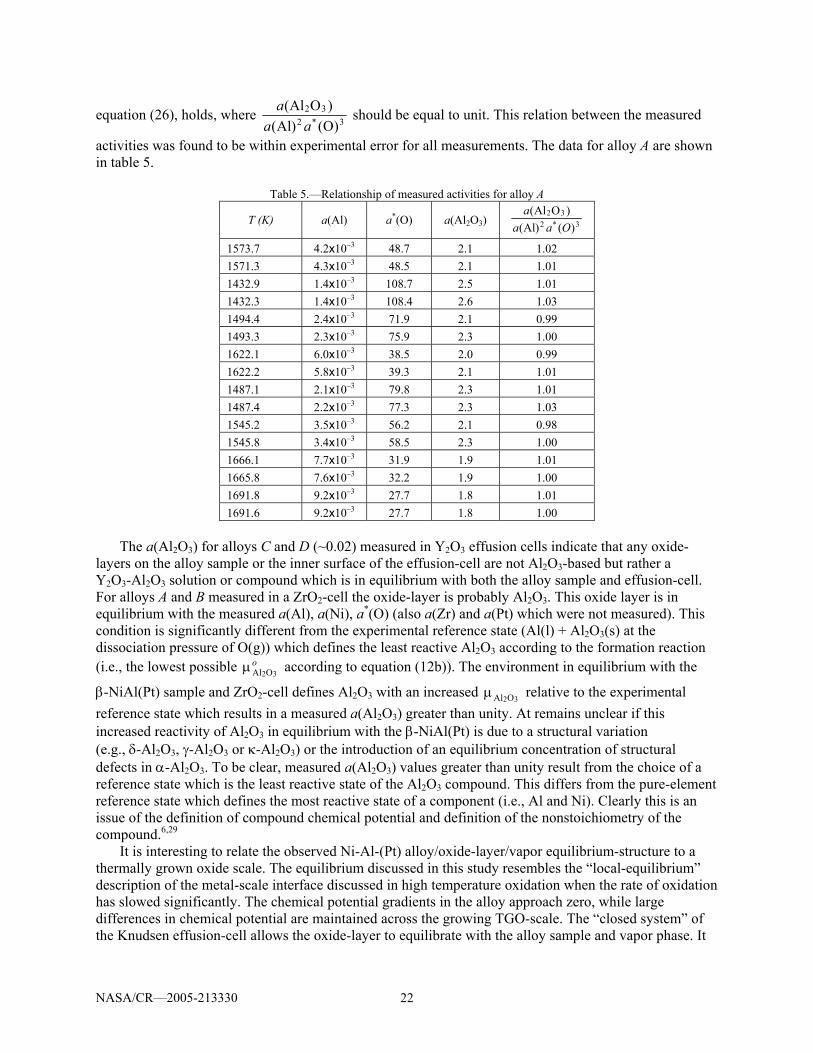
It is interesting to note that a(Al), a*(O) and a(Al2O3) were determined independently by reactions: Al(cr,l) = Al(g), 2Al(g) + O = Al2O(g) and 4Al(g) + Al2O3 = 3Al2O(g), respectively. Therefore the consistency of these measurements can be checked by confirming the formation reaction of Al2O3,
NASA/CR—2005-213330 22
equation (26), holds, where 3*232
)O()Al()OAl(
aaa should be equal to unit. This relation between the measured
activities was found to be within experimental error for all measurements. The data for alloy A are shown in table 5.
Table 5.—Relationship of measured activities for alloy A
T (K) a(Al) a*(O) a(Al2O3) 3*232
)()Al()OAl(
Oaaa
1573.7 4.2x10⁻³ 48.7 2.1 1.02 1571.3 4.3x10⁻³ 48.5 2.1 1.01 1432.9 1.4x10⁻³ 108.7 2.5 1.01 1432.3 1.4x10⁻³ 108.4 2.6 1.03 1494.4 2.4x10⁻³ 71.9 2.1 0.99 1493.3 2.3x10⁻³ 75.9 2.3 1.00 1622.1 6.0x10⁻³ 38.5 2.0 0.99 1622.2 5.8x10⁻³ 39.3 2.1 1.01 1487.1 2.1x10⁻³ 79.8 2.3 1.01 1487.4 2.2x10⁻³ 77.3 2.3 1.03 1545.2 3.5x10⁻³ 56.2 2.1 0.98 1545.8 3.4x10⁻³ 58.5 2.3 1.00 1666.1 7.7x10⁻³ 31.9 1.9 1.01 1665.8 7.6x10⁻³ 32.2 1.9 1.00 1691.8 9.2x10⁻³ 27.7 1.8 1.01 1691.6 9.2x10⁻³ 27.7 1.8 1.00
The a(Al2O3) for alloys C and D (~0.02) measured in Y2O3 effusion cells indicate that any oxide-
layers on the alloy sample or the inner surface of the effusion-cell are not Al2O3-based but rather a Y2O3-Al2O3 solution or compound which is in equilibrium with both the alloy sample and effusion-cell. For alloys A and B measured in a ZrO2-cell the oxide-layer is probably Al2O3. This oxide layer is in equilibrium with the measured a(Al), a(Ni), a*(O) (also a(Zr) and a(Pt) which were not measured). This condition is significantly different from the experimental reference state (Al(l) + Al2O3(s) at the dissociation pressure of O(g)) which defines the least reactive Al2O3 according to the formation reaction (i.e., the lowest possible o
32OAlµ according to equation (12b)). The environment in equilibrium with the
β-NiAl(Pt) sample and ZrO2-cell defines Al2O3 with an increased 32OAlµ relative to the experimental
reference state which results in a measured a(Al2O3) greater than unity. At remains unclear if this increased reactivity of Al2O3 in equilibrium with the β-NiAl(Pt) is due to a structural variation (e.g., δ-Al2O3, γ-Al2O3 or κ-Al2O3) or the introduction of an equilibrium concentration of structural defects in α-Al2O3. To be clear, measured a(Al2O3) values greater than unity result from the choice of a reference state which is the least reactive state of the Al2O3 compound. This differs from the pure-element reference state which defines the most reactive state of a component (i.e., Al and Ni). Clearly this is an issue of the definition of compound chemical potential and definition of the nonstoichiometry of the compound.6,29
It is interesting to relate the observed Ni-Al-(Pt) alloy/oxide-layer/vapor equilibrium-structure to a thermally grown oxide scale. The equilibrium discussed in this study resembles the “local-equilibrium” description of the metal-scale interface discussed in high temperature oxidation when the rate of oxidation has slowed significantly. The chemical potential gradients in the alloy approach zero, while large differences in chemical potential are maintained across the growing TGO-scale. The “closed system” of the Knudsen effusion-cell allows the oxide-layer to equilibrate with the alloy sample and vapor phase. It
NASA/CR—2005-213330 23
is proposed that this can be thought of as corresponding to an expansion of the metal-scale interface to include the whole alloy sample, oxide-layer, vapor phase and inner surface of the effusion-cell. Therefore in addition to measuring the affect of platinum on a(Al) and a(Ni) in β-NiAl this study measured the activities of O and Al2O3 in the oxide-layer in equilibrium with the alloy and effusion-cell. These measurements appear to provide a direct method of investigating the thermodynamics of the metal-scale interface of a TGO-scale. Clearly a systematic study of this type with alloy compositions that more closely resemble those observed at typical metal-scale interfaces, together with a well characterized pre-oxidation process, could be important to better understanding how alloy additions affect TGO-scale behavior.
Conclusions
An initial investigation has been made to determine the affect of platinum addition on the activities of aluminum and nickel in β-NiAl. These measurements were made with a multiple effusion-cell configured KEMS. The results reported in this study show that, over the temperature range 1354 to 1692 K, Pt additions acted to decrease a(Al) and increase the a(Ni) in β-NiAl(Pt) for a constant XNi/XAl ≈ 1.13. While for constant XAl, the affect of Pt on Al is greatly reduced. The measured enthalpies of mixing are consistent with the measured activities. They indicate Al-atoms are more tightly bound in alloy B (relative to alloy A) and Al has a strong self interaction while Ni- and Pt-atoms have similar interactions with Al-atoms. Conversely the binding of Ni-atoms in β-NiAl decreases with Pt addition and this appears independent of the Al concentration. The solution model used to interpret this data was too simple to represent the solution behavior of β-NiAl(Pt). Also assuming the interaction between Ni and Al is independent of XPt is obviously an over simplification. More activity measurements in the Ni-Al-Pt system are required to fully understand the solution behavior of β-NiAl(Pt).
A thin transparent oxide-layer appeared to be on the surface of all samples in this study. The “closed” isothermal nature of the effusion-cell means this oxide-layer is in equilibrium with the alloy sample, vapor phase and inner surface of the effusion-cell. It is proposed that the oxide-layer did not form or grow during the experiment but rather it was present from the start of the experiment, as a non-equilibrium native-oxide layer that equilibrated together with the inner-surface of the effusion-cell during the initial stage of the experiment. While analyses are difficult, the oxide-layer is probably Al2O3 for the ZrO2-cells and a Y2O3-Al2O3 solution or compound for the Y2O3-cells. The reduced vaporization coefficients of the oxide-layers are not expected to have significantly affected the measured activities. The observed Ni-Al-(Pt) alloy/oxide-layer/vapor equilibrium-structure appears to resemble the “local-equilibrium” description of the metal-scale interface discussed in high temperature oxidation. It is proposed that these measurements provide a direct method of investigating the thermodynamics of the metal-scale interface of a TGO-scale. A systematic investigation of this type with more realistic alloy compositions and a well characterized pre-oxidation process could be an important tool to better understand how many alloy additions affect TGO-scaling behavior.

NASA/CR—2005-213330 25
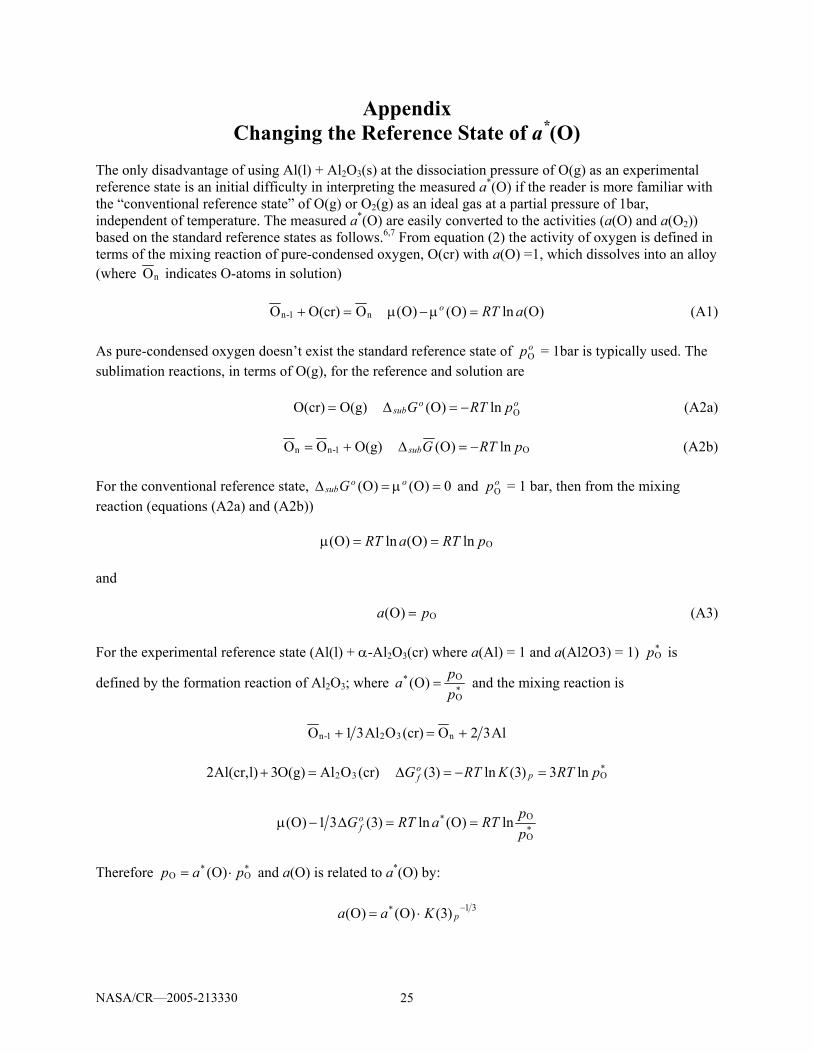
Appendix Changing the Reference State of a*(O)
The only disadvantage of using Al(l) + Al2O3(s) at the dissociation pressure of O(g) as an experimental reference state is an initial difficulty in interpreting the measured a*(O) if the reader is more familiar with the “conventional reference state” of O(g) or O2(g) as an ideal gas at a partial pressure of 1bar, independent of temperature. The measured a*(O) are easily converted to the activities (a(O) and a(O2)) based on the standard reference states as follows.6,7 From equation (2) the activity of oxygen is defined in terms of the mixing reaction of pure-condensed oxygen, O(cr) with a(O) =1, which dissolves into an alloy (where nO indicates O-atoms in solution) n1-n OO(cr)O =+ )O(ln)O()O( aRTo =µ−µ (A1) As pure-condensed oxygen doesn’t exist the standard reference state of opO = 1bar is typically used. The sublimation reactions, in terms of O(g), for the reference and solution are O(g)O(cr) = oo
sub pRTG Oln)O( −=∆ (A2a) O(g)OO 1-nn += Oln)O( pRTGsub −=∆ (A2b) For the conventional reference state, 0)O()O( =µ=∆ oo
subG and opO = 1 bar, then from the mixing reaction (equations (A2a) and (A2b)) Oln)O(ln)O( pRTaRT ==µ and O)O( pa = (A3) For the experimental reference state (Al(l) + α-Al2O3(cr) where a(Al) = 1 and a(Al2O3) = 1) *
Op is
defined by the formation reaction of Al2O3; where *O
O* )O(ppa = and the mixing reaction is
Al32O(cr)OAl31O n321-n +=+
(cr)OAlO(g)3l)Al(cr,2 32=+ *
Oln3)3(ln)3( pRTKRTG pof =−=∆
*O
O* ln)O(ln)3(31)O(ppRTaRTGo
f ==∆−µ
Therefore *
O*
O )O( pap ⋅= and a(O) is related to a*(O) by:
31* )3()O()O( −⋅= pKaa
NASA/CR—2005-213330 26
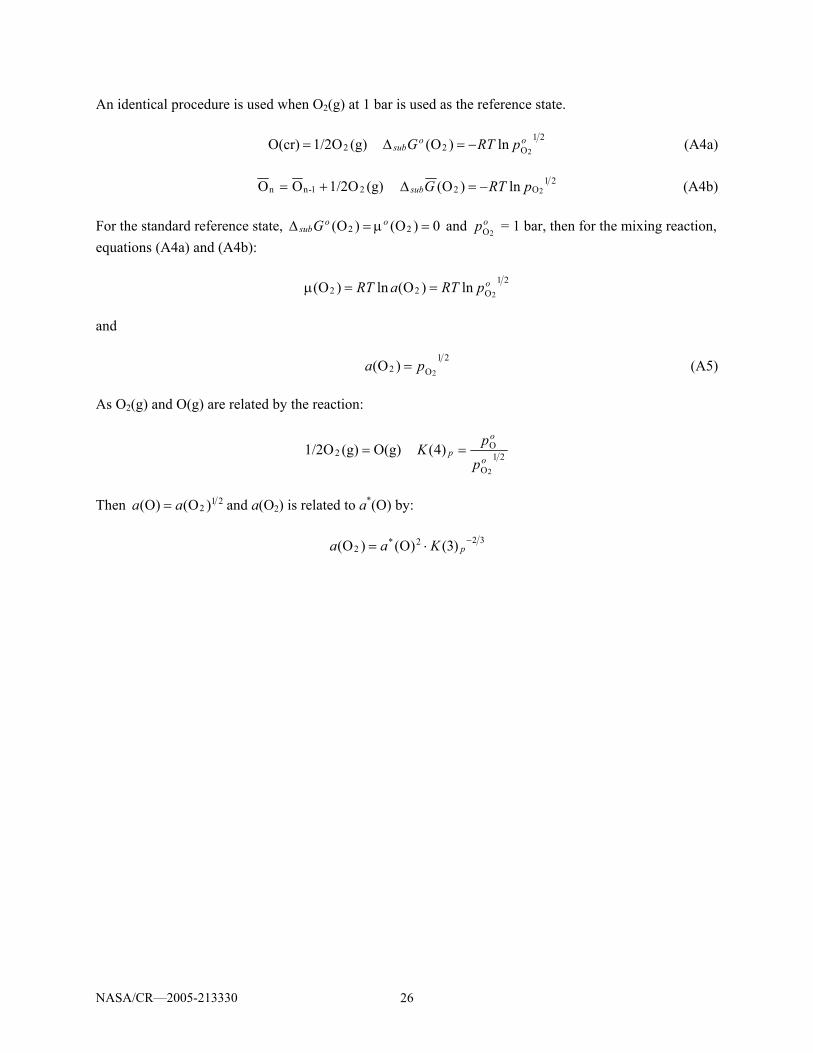
An identical procedure is used when O2(g) at 1 bar is used as the reference state. (g)1/2OO(cr) 2= 21
O2 2ln)O( oosub pRTG −=∆ (A4a)
(g)1/2OOO 21-nn += 21
O2 2ln)O( pRTGsub −=∆ (A4b) For the standard reference state, 0)O()O( 22 =µ=∆ oo
subG and op 2O = 1 bar, then for the mixing reaction, equations (A4a) and (A4b):
21O22 2ln)O(ln)O( opRTaRT ==µ
and
21O2 2)O( pa = (A5)
As O2(g) and O(g) are related by the reaction:
O(g)(g)1/2O2 = 21O
O
2
)4(o
o
pp
pK =
Then 21
2 )O()O( aa = and a(O2) is related to a*(O) by:
322*2 )3()O()O( −⋅= pKaa
NASA/CR—2005-213330 27
References 1. J.R. Nicholls, MRS Bulletin, vol. 28, no. 9, p. 659, 2003. 2. Y. Zhang, J.H. Haynes, W.Y. Lee, I.G. Wright, B.A. Pint, K.M. Cooley, and P.K. Liaw, Metallur.
Mater. Trans. A, vol. 32A, p. 1727, 2001. 3. R. Bouchet, and R. Mevrel, Computer Coupling of Phase Diagrams and Thermochemistry, vol. 27,
p. 295, 2003. 4. J.W. Gibbs, Trans. Conn. Acad. Sci., vol. 3, p. 228, 1876. 5. G.N. Lewis, and M. Randall, Thermodynamics (revised by K.S. Pitzer and L. Brewer) McGraw-
Hill, New York, 1961. 6. C.H.P. Lupis, Chemical Thermodynamics of Materials, North Holland, New York, 1983. 7. O. Kubaschewski, and C.B. Alcock, Metallurgical Thermochemisty, (6th Edition) Pergamon Press,
Oxford, 1979. 8. M. Inghram, and J. Drowart, “Mass Spectrometry Applied to High Temperature Chemistry” in High
Temperature Technology, Oct. 6–9, 1959, p. 338. 9. A. Büchler, and J. Stauffer, in Thermodynamics (IAEA Vienna, 1966) vol. 1, p. 271. 10. C. Chatillion, C. Senillou, M. Allibert, and A. Pattoret, Rev. Sci. Instrum. vol. 47, 3, p. 334, (1976). 11. P. Morland, C. Chatillion, P. Rocabois, High Temp. and Materials Sci. vol. 37, p. 167, (1997). 12. C. Chatillion, L. Malheiros, P. Rocabois, M. Jeymond, High Temp. High Pressures, vol. 34, p. 213,
(2002). 13. E. Copland, and N. Jacobson, The Glenn Research Centre Knudsen Effusion Cell Mass
Spectrometer: Background and Practical Aspects of Operation, NASA TM, to be published, (2005).
14. L.J. Kieffer, and G. Dunn, Joint Institute Laboratory Astrophysics Report No. 51, University of Colorado, Oct. 11, (1965).
15. B. Gleeson, Phase-Diagram for Ni-Al-Pt, private communication. 16. H. Wriedt, Bull. Alloy Phase Diagrams, 6(6), (1985). 17. L.V. Gurvich, I.V. Veyts, C.B. Alcock, Thermodynamic Properties of Individual Substances,
English Version, Begell House, (1996). 18. M.W. Chase, NIST-JANAF Thermochemical Tables, 4th Ed., American Chemical Society, (1998). 19. R.C. Paule, and J. Mandel, Analysis of Interlaboratory Measurements on the Vapor Pressure of
Gold, SRM 745, National Bureau of Standards Special Publication 260–19, (1970). Also published in Pure and Applied Chem. vol. 31, p. 371, (1972).
20. D. Cubicciotti, The Journal of Physical Chemistry, vol. 70(7), p. 2410, (1966). 21. W.S. Horton, J or Research of the National Bureau of Standards –A Physics and Chemistry,
vol. 70(6) p. 533, (1966). 22. M.L. McGlashan, J. Chem. Thermodynamics, vol. 22, p. 653, (1990). 23. D. Raj, L. Bencze, D. Kath, W. Oates, J. Herrmann, L. Singheiser, and K. Hillpert, Intermetallics,
vol. 11, p. 1119, (2003). 24. C.I. Whitman, Journal of Chemical Physics, vol. 20(1), p. 161, (1951). 25. K. Moltzfeldt, Journal of Phys. Chem. vol. 59, p. 139, (1955). 26. G.M. Rosenblatt, Journal of the Electrochemical Society, vol. 110(6) p. 563, (1963). 27. P. Clausing, Ann. Physik, vol. 5(12), p. 961, (1932). English translation: The Journal of Vacuum
Science and Technology, vol. 8(5) p. 636, (1971). 28. V.L. Stolyarova, and G.A. Semenov, Mass Spectrometric Study of the Vaporization of Oxide
Systems, John Wiley and Sons, Chichester, (1994). 29. D.J. Young, and F. Gesmundo, High Temperatures - High Pressures, vol. 20, p. 1, (1988).

NASA/CR—2005-213330 28
30. P. Nash, and O. Kleppa, Journal of Alloys and Compounds, 321 pp. 228–231, (2001). 31. L. Perring, J. Kuntz, F. Bussy, and J. Gachon, Intermetallics, 7, pp. 1235–1239, (1999). 32. L. Darken, and R. Curry, Physical Chemistry of Metals, McGraw-Hill, New York, (1953). 33. L. Darken, Trans. Met. Soc. AIME, 239, p. 80–89, (1967). 34. L. Darken, Trans. Met. Soc. AIME, 239, p. 90–96, (1967). 35. A. Pelton, and C. Bale, Metallurgical Trans. A, 17A, p. 1211–15, (1986). 36. C. Wagner, Thermodynamics of Alloys, Addison-Wesley, Reading, MA, (1952).

This publication is available from the NASA Center for AeroSpace Information, 301–621–0390.
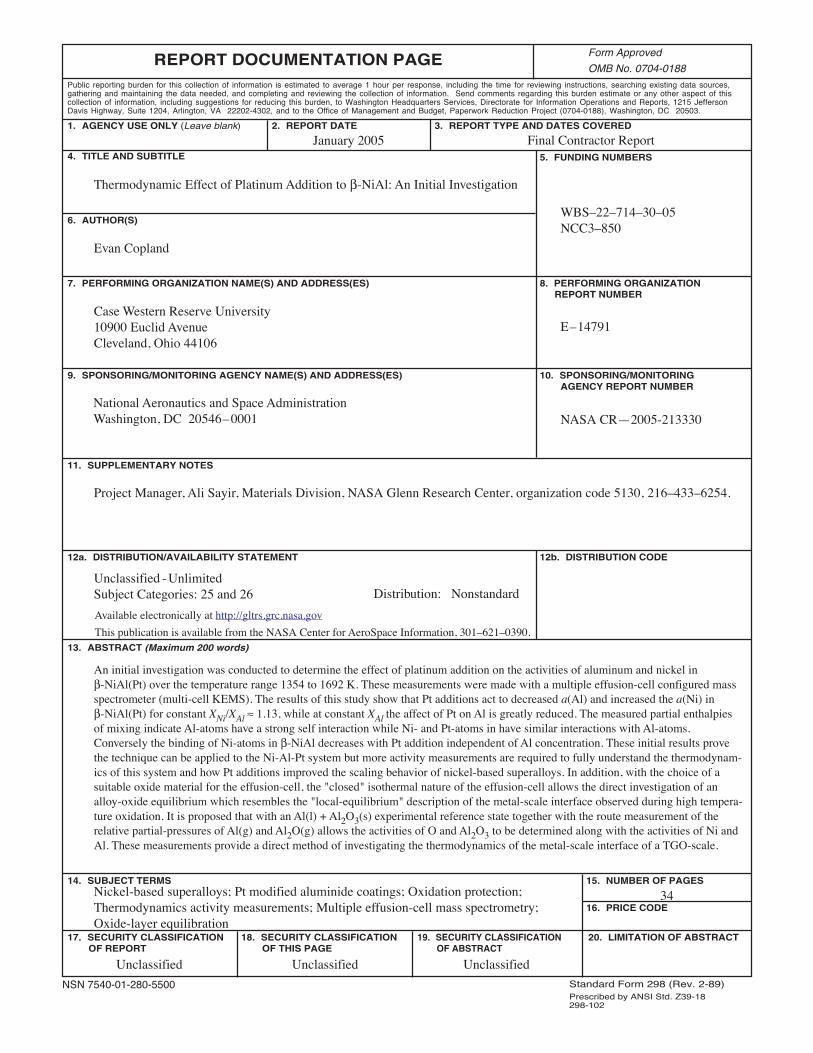
REPORT DOCUMENTATION PAGE
2. REPORT DATE
19. SECURITY CLASSIFICATION OF ABSTRACT
18. SECURITY CLASSIFICATION OF THIS PAGE
Public reporting burden for this collection of information is estimated to average 1 hour per response, including the time for reviewing instructions, searching existing data sources,gathering and maintaining the data needed, and completing and reviewing the collection of information. Send comments regarding this burden estimate or any other aspect of thiscollection of information, including suggestions for reducing this burden, to Washington Headquarters Services, Directorate for Information Operations and Reports, 1215 JeffersonDavis Highway, Suite 1204, Arlington, VA 22202-4302, and to the Office of Management and Budget, Paperwork Reduction Project (0704-0188), Washington, DC 20503.
NSN 7540-01-280-5500 Standard Form 298 (Rev. 2-89)Prescribed by ANSI Std. Z39-18298-102
Form Approved
OMB No. 0704-0188
12b. DISTRIBUTION CODE
8. PERFORMING ORGANIZATION REPORT NUMBER
5. FUNDING NUMBERS
3. REPORT TYPE AND DATES COVERED
4. TITLE AND SUBTITLE
6. AUTHOR(S)
7. PERFORMING ORGANIZATION NAME(S) AND ADDRESS(ES)
11. SUPPLEMENTARY NOTES
12a. DISTRIBUTION/AVAILABILITY STATEMENT
13. ABSTRACT (Maximum 200 words)
14. SUBJECT TERMS
17. SECURITY CLASSIFICATION OF REPORT
16. PRICE CODE
15. NUMBER OF PAGES
20. LIMITATION OF ABSTRACT
Unclassified Unclassified
Final Contractor Report
Unclassified
1. AGENCY USE ONLY (Leave blank)
10. SPONSORING/MONITORING AGENCY REPORT NUMBER
9. SPONSORING/MONITORING AGENCY NAME(S) AND ADDRESS(ES)
National Aeronautics and Space AdministrationWashington, DC 20546–0001
Available electronically at http://gltrs.grc.nasa.gov
January 2005
NASA CR—2005-213330
E–14791
WBS–22–714–30–05NCC3–850
34
Thermodynamic Effect of Platinum Addition to β-NiAl: An Initial Investigation
Evan Copland
Nickel-based superalloys; Pt modified aluminide coatings; Oxidation protection;Thermodynamics activity measurements; Multiple effusion-cell mass spectrometry;Oxide-layer equilibration
Unclassified -UnlimitedSubject Categories: 25 and 26 Distribution: Nonstandard
Case Western Reserve University10900 Euclid AvenueCleveland, Ohio 44106
Project Manager, Ali Sayir, Materials Division, NASA Glenn Research Center, organization code 5130, 216–433–6254.
An initial investigation was conducted to determine the effect of platinum addition on the activities of aluminum and nickel inβ-NiAl(Pt) over the temperature range 1354 to 1692 K. These measurements were made with a multiple effusion-cell configured massspectrometer (multi-cell KEMS). The results of this study show that Pt additions act to decreased a(Al) and increased the a(Ni) inβ-NiAl(Pt) for constant XNi/XAl ≈ 1.13, while at constant XAl the affect of Pt on Al is greatly reduced. The measured partial enthalpiesof mixing indicate Al-atoms have a strong self interaction while Ni- and Pt-atoms in have similar interactions with Al-atoms.Conversely the binding of Ni-atoms in β-NiAl decreases with Pt addition independent of Al concentration. These initial results provethe technique can be applied to the Ni-Al-Pt system but more activity measurements are required to fully understand the thermodynam-ics of this system and how Pt additions improved the scaling behavior of nickel-based superalloys. In addition, with the choice of asuitable oxide material for the effusion-cell, the "closed" isothermal nature of the effusion-cell allows the direct investigation of analloy-oxide equilibrium which resembles the "local-equilibrium" description of the metal-scale interface observed during high tempera-ture oxidation. It is proposed that with an Al(l) + Al2O3(s) experimental reference state together with the route measurement of therelative partial-pressures of Al(g) and Al2O(g) allows the activities of O and Al2O3 to be determined along with the activities of Ni andAl. These measurements provide a direct method of investigating the thermodynamics of the metal-scale interface of a TGO-scale.