The tikz-3dplot Package - BaKoMa TeX · 2010-03-22 · Chapter 1 Introduction 1.1 Overview of the...
42
The tikz-3dplot Package Jeff Hein January 24, 2010 x y z φ θ x 0 y 0 z 0 φ 0 θ 0 z x x y y x y z x 0 y 0 z 0 γ x y z x 0 y 0 z 0 β x y z x 0 y 0 z 0 α i
Transcript of The tikz-3dplot Package - BaKoMa TeX · 2010-03-22 · Chapter 1 Introduction 1.1 Overview of the...
The tikz-3dplot Package
Jeff Hein
January 24, 2010
x
y
z
φ
θ
x′
y′
z′
φ′
θ′
z
xx yy
x y
z
x′
y′
z′
γ x y
z
x′
y′
z′ β
x y
z
x′
y′
z′
α
i
Document Version History
2009-11-09 Initial release
2009-11-21 Added spherical polar parametric surface plotting functionalitywith the \tdplotsphericalsurfaceplot command.
2009-12-04 Touched up on a few drawing issues in \tdplotsphericalsurfaceplot,and added the \tdplotshowargcolorguide command.
2010-01-17 Changed package name from 3dplot to tikz-3dplot, and up-dated document accordingly.
2010-01-20 Added the following commands: \tdplotgetpolarcoords, \tdplotcrossprod,\tdplotcalctransformrotmain, \tdplotcalctransformmainrot, \tdplottransformrotmain,\tdplottransformmainrot, and \tdplotdrawpolytopearc.
2010-01-24 Added the ability to hue 3d polar plots based on radius using the\tdplotr macro.
Copyright 2010 Jeff Hein
Permission is granted to distribute and/or modify both the documentation andthe code under the conditions of the LaTeX Project Public License, eitherversion 1.3 of this license or (at your option) any later version. The latestversion of this license is in http://www.latex-project.org/lppl.txt
Contents
Contents i
1 Introduction 11.1 Overview of the tikz-3dplot Package . . . . . . . . . . . . . . 1
1.1.1 What tikz-3dplot is . . . . . . . . . . . . . . . . . . . 11.1.2 What tikz-3dplot is not . . . . . . . . . . . . . . . . . 21.1.3 Similar Work . . . . . . . . . . . . . . . . . . . . . . . . 2
1.2 Installing the tikz-3dplot Package . . . . . . . . . . . . . . . 41.2.1 tikz-3dplot Requirements . . . . . . . . . . . . . . . . 41.2.2 tikz-3dplot Package Options . . . . . . . . . . . . . . 4
1.3 Using the tikz-3dplot Package . . . . . . . . . . . . . . . . . 4
2 Overview of 3d in tikz-3dplot 52.1 TikZ 3d Plotting . . . . . . . . . . . . . . . . . . . . . . . . . . 52.2 The tikz-3dplot Main Coordinate System . . . . . . . . . . . 52.3 The tikz-3dplot Rotated Coordinate System . . . . . . . . . 72.4 Arcs in 3d, and the “Theta Plane” . . . . . . . . . . . . . . . . 8
3 Using the tikz-3dplot Package 103.1 The tikz-3dplot TikZ Styles . . . . . . . . . . . . . . . . . . . 10
3.1.1 tdplot main coords . . . . . . . . . . . . . . . . . . . . 103.1.2 tdplot rotated coords . . . . . . . . . . . . . . . . . . 103.1.3 tdplot screen coords . . . . . . . . . . . . . . . . . . 10
3.2 The tikz-3dplot Commands . . . . . . . . . . . . . . . . . . . 113.3 Coordinate Configuration Commands . . . . . . . . . . . . . . 11
3.3.1 tdplotsetmaincoords . . . . . . . . . . . . . . . . . . . 113.3.2 tdplotsetrotatedcoords . . . . . . . . . . . . . . . . . 113.3.3 tdplotsetrotatedcoordsorigin . . . . . . . . . . . . . 123.3.4 tdplotresetrotatedcoordsorigin . . . . . . . . . . . 133.3.5 tdplotsetthetaplanecoords . . . . . . . . . . . . . . . 133.3.6 tdplotsetrotatedthetaplanecoords . . . . . . . . . . 143.3.7 tdplotcalctransformmainrot . . . . . . . . . . . . . . 163.3.8 tdplotcalctransformrotmain . . . . . . . . . . . . . . 16
3.4 Point Calculation Commands . . . . . . . . . . . . . . . . . . . 163.4.1 tdplotsetcoord . . . . . . . . . . . . . . . . . . . . . . 16
i
3.4.2 tdplottransformmainrot . . . . . . . . . . . . . . . . . 173.4.3 tdplottransformrotmain . . . . . . . . . . . . . . . . . 193.4.4 tdplotgetpolarcoords . . . . . . . . . . . . . . . . . . 203.4.5 tdplotcrossprod . . . . . . . . . . . . . . . . . . . . . 213.4.6 tdplotdefinepoints . . . . . . . . . . . . . . . . . . . 23
3.5 Drawing Commands . . . . . . . . . . . . . . . . . . . . . . . . 243.5.1 tdplotdrawarc . . . . . . . . . . . . . . . . . . . . . . . 243.5.2 tdplotdrawpolytopearc . . . . . . . . . . . . . . . . . 26
3.6 The tdplotsphericalsurfaceplot Command . . . . . . . . . 283.6.1 How tdplotsphericalsurfaceplot Works . . . . . . . 283.6.2 Using tdplotsphericalsurfaceplot . . . . . . . . . . 283.6.3 The tdplotsetpolarplotrange Command . . . . . . . 303.6.4 The tdplotresetpolarplotrange Command . . . . . . 313.6.5 The tdplotshowargcolorguide Command . . . . . . . 31
3.7 Miscellaneous Math Commands . . . . . . . . . . . . . . . . . . 323.7.1 tdplotsinandcos . . . . . . . . . . . . . . . . . . . . . 323.7.2 tdplotmult . . . . . . . . . . . . . . . . . . . . . . . . . 333.7.3 tdplotdiv . . . . . . . . . . . . . . . . . . . . . . . . . 33
4 Known Issues 344.1 Predefined Points Don’t Work in Rotated Frame . . . . . . . . 344.2 node Command and shift=(P) Issues . . . . . . . . . . . . . . 354.3 PGF xyz spherical Coordinate System . . . . . . . . . . . . . 37
5 TODO list 38
Chapter 1
Introduction
1.1 Overview of the tikz-3dplot Package
The tikz-3dplot package offers commands and coordinate tranformation stylesfor TikZ, providing relatively straightforward tools to draw three-dimensionalcoordinate systems and simple three-dimensional diagrams. The package iscurrently in its infancy, and is subject to change. Comments or suggetions areencouraged.
This document describes the basics of the tikz-3dplot package and pro-vides information about the various available commands. Examples are givenwhere possible.
1.1.1 What tikz-3dplot is
tikz-3dplot provides commands to easily specify coordinate transformationsfor TikZ, allowing for relatively easy plotting. I needed to draw accurate 3dvector images for a physics thesis, and this package was developed to meet thisneed.
Various plotting commands are used to itentify coordinate locations usingspherical polar or cartesian coordinates. Coordinate transformation commandsallow for the calculation of a coordinate in one frame based on its values inanother frame. Some drawing commands have been developed to assist inthe rendering of arcs. These commands do the number crunching required toposition and render the arcs. These commands are discussed in Section 3.2.
In addition, the \tdplotsphericalsurfaceplot was developed to render three-dimensional surfaces in spherical polar coordinates, where the radius is ex-pressed in terms of a user-defined function of θ and φ. With this function, thesurface hue can be given explicitly, or expressed as a user-defined function ofr, θ, and φ. This command is discussed in Section 3.6.
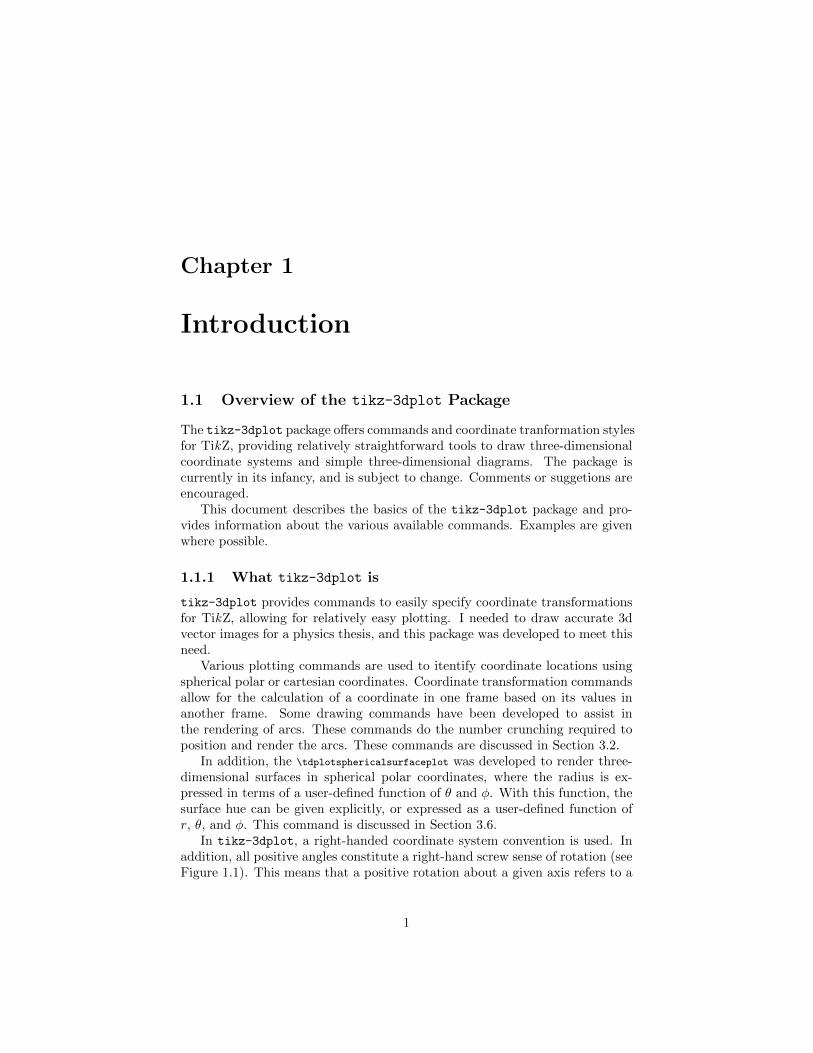
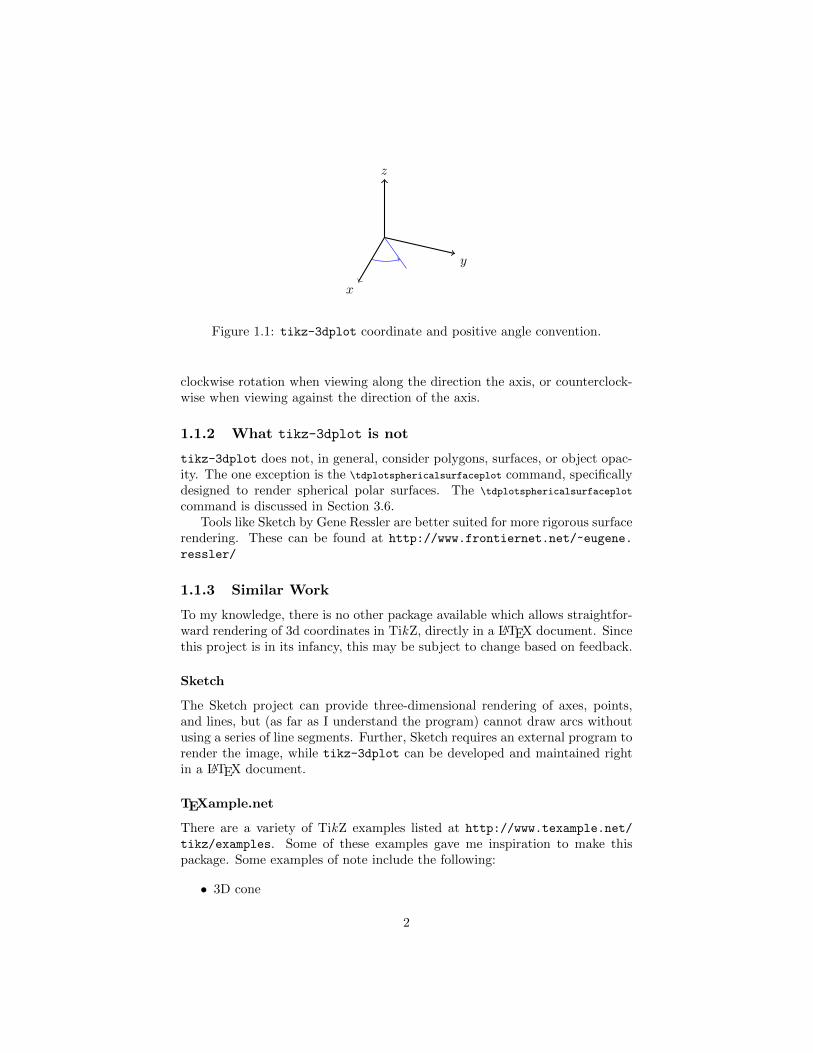
In tikz-3dplot, a right-handed coordinate system convention is used. Inaddition, all positive angles constitute a right-hand screw sense of rotation (seeFigure 1.1). This means that a positive rotation about a given axis refers to a
1
x
y
z
Figure 1.1: tikz-3dplot coordinate and positive angle convention.
clockwise rotation when viewing along the direction the axis, or counterclock-wise when viewing against the direction of the axis.
1.1.2 What tikz-3dplot is not
tikz-3dplot does not, in general, consider polygons, surfaces, or object opac-ity. The one exception is the \tdplotsphericalsurfaceplot command, specificallydesigned to render spherical polar surfaces. The \tdplotsphericalsurfaceplot
command is discussed in Section 3.6.Tools like Sketch by Gene Ressler are better suited for more rigorous surface
rendering. These can be found at http://www.frontiernet.net/~eugene.
ressler/
1.1.3 Similar Work
To my knowledge, there is no other package available which allows straightfor-ward rendering of 3d coordinates in TikZ, directly in a LATEX document. Sincethis project is in its infancy, this may be subject to change based on feedback.
Sketch
The Sketch project can provide three-dimensional rendering of axes, points,and lines, but (as far as I understand the program) cannot draw arcs withoutusing a series of line segments. Further, Sketch requires an external program torender the image, while tikz-3dplot can be developed and maintained rightin a LATEX document.
TEXample.net
There are a variety of TikZ examples listed at http://www.texample.net/
tikz/examples. Some of these examples gave me inspiration to make thispackage. Some examples of note include the following:
• 3D cone
2
Author: Eugene Ressler
url: http://www.texample.net/tikz/examples/3d-cone/
Notes: This demonstrates the use of Sketch in TikZ figures.
• Annotated 3D box
Author Alain Matthes
url http://www.texample.net/tikz/examples/annotated-3d-box/
Notes This example demonstrates the direct use of coordinate transfor-mations, as well as performing math directly within coordinates.
• Cluster of atoms
Author Agustin E. Bolzan
url http://www.texample.net/tikz/examples/clusters-of-atoms/
Notes This uses shifts and slants rather than rotations to render anisometric look.
• Plane partition
Author Jang Soo Kim
url http://www.texample.net/tikz/examples/plane-partition/
Notes This example draws solid surfaces with coordinate axes definedby rotations around the TikZ standard coordinate frame.
• Spherical and cartesian grids
Author Marco Miani
url http://www.texample.net/tikz/examples/spherical-and-cartesian-grids/
Notes This example renders arcs and lines in three dimensions using ex-plicit calculations. It takes into account the opacity of the sphericalexample, by showing hidden lines behind the sphere as dashed lines.
• Stereographic and cylindrical map projections
Author Thomas M. Trzeciak
url http://www.texample.net/tikz/examples/map-projections/
Notes This example illustrates the use of coordinate transformations todraw planes and arcs for spherical coordinates.
3
1.2 Installing the tikz-3dplot Package
Get a copy of tikz-3dplot from http://www.ctan.org. Place the style file inthe same directory as your LATEX project. In your preamble, add the followingline:
\include{tikz-3dplot}
Make sure this line is written after all other required packages.
1.2.1 tikz-3dplot Requirements
To use this package, the following other packages must be loaded in the pream-ble first:
• TikZ
• ifthen (for the tdplotsphericalsurfaceplot command)
1.2.2 tikz-3dplot Package Options
Currently there are no options available for the tikz-3dplot package.
1.3 Using the tikz-3dplot Package
tikz-3dplot provides styles and commands which are useful in a tikzpicture
environment. These commands and styles are described in Chapter 3.
4
Chapter 2
Overview of 3d in tikz-3dplot
2.1 TikZ 3d Plotting
When setting up a tikzpicture or a drawing style, the x, y, and z axes canbe specified directly in terms of the original coordinate system. The follow-ing example shows how a tikzpicture environment can be configured to usecustomized axes.
\begin{tikzpicture}[%
x={(\raarot cm,\rbarot cm)},%
y={(\rabrot cm, \rbbrot cm)},%
z={(\racrot, \rbcrot cm)}]
In this example, the terms \raarot and so on specify how the coordinatesare represented in the original TikZ coordinate system, and are calculatedby the tikz-3dplot package. Note that units are explicitly required so TikZunderstands that these are absolute coordinates, not scales on the existing axis.See the PGF manual Version 2.00, section 21.2 on pages 217-218 for details onTikZ coordinate transformations.
2.2 The tikz-3dplot Main Coordinate System
tikz-3dplot offers two coordinate systems, namely the main coordinate sys-tem (x, y, z), and the rotated coordinate system (x′, y′, z′). The latter systemis described in Section 2.3.
As the name suggests, the main coordinate system provides a user-specifiedtransformation to render 3d points in a tikzpicture environment. The orien-tation of the main coordinate system is defined by the angles θd and φd. In theunrotated (θd = φd = 0) position, the xy plane of the main coordinate systemcoincides with the default orientation for a tikzpicture environment, while z
5
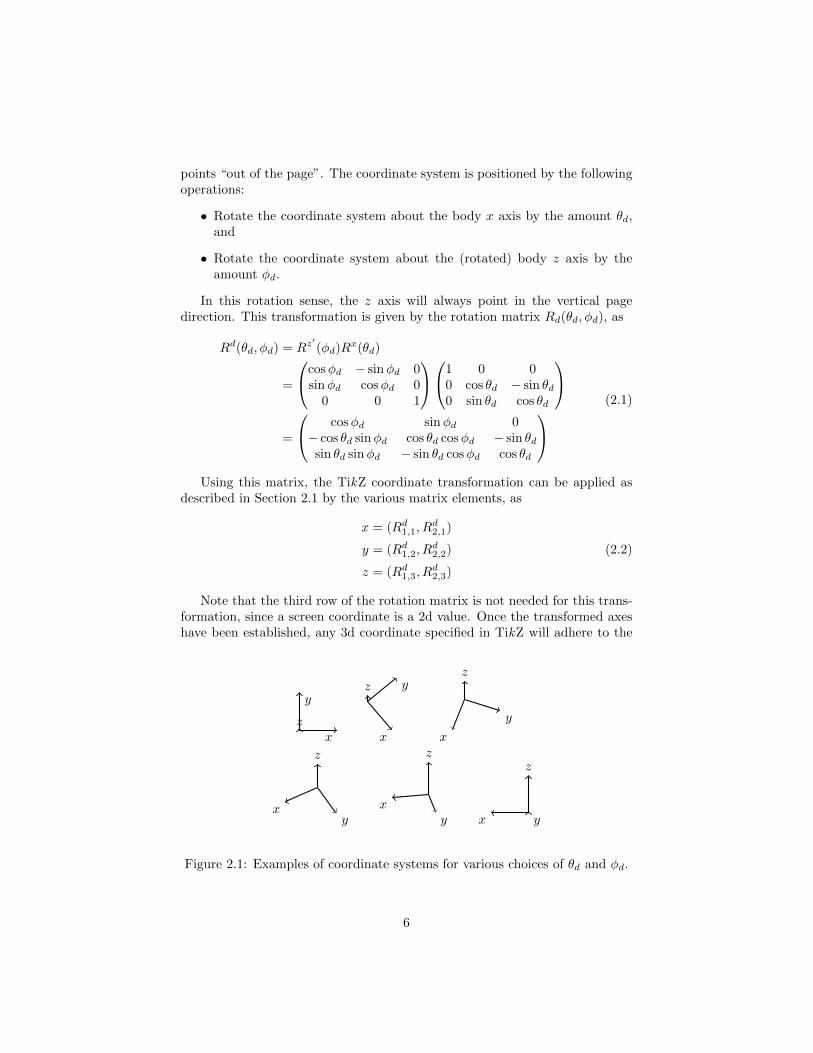
points “out of the page”. The coordinate system is positioned by the followingoperations:
• Rotate the coordinate system about the body x axis by the amount θd,and
• Rotate the coordinate system about the (rotated) body z axis by theamount φd.
In this rotation sense, the z axis will always point in the vertical pagedirection. This transformation is given by the rotation matrix Rd(θd, φd), as
Rd(θd, φd) = Rz′(φd)Rx(θd)
=
cosφd − sinφd 0sinφd cosφd 0
0 0 1
1 0 00 cos θd − sin θd0 sin θd cos θd
=
cosφd sinφd 0− cos θd sinφd cos θd cosφd − sin θdsin θd sinφd − sin θd cosφd cos θd
(2.1)
Using this matrix, the TikZ coordinate transformation can be applied asdescribed in Section 2.1 by the various matrix elements, as
x = (Rd1,1, R
d2,1)
y = (Rd1,2, R
d2,2)
z = (Rd1,3, R
d2,3)
(2.2)
Note that the third row of the rotation matrix is not needed for this trans-formation, since a screen coordinate is a 2d value. Once the transformed axeshave been established, any 3d coordinate specified in TikZ will adhere to the
x
y
zx
yz
x
y
z
xy
z
xy
z
x y
z
Figure 2.1: Examples of coordinate systems for various choices of θd and φd.
6
transformation, yeilding a 3d representation. Lines and nodes can readily bedrawn by using these 3d coordinates.
This coordinate transformation is accessible through tikz-3dplot usingthe command tdplotsetmaincoords, as described in Chapter 3.
2.3 The tikz-3dplot Rotated Coordinate System
Along with the main coordinate system, described in Section 2.2, tikz-3dplotoffers a rotated coordinate system that is defined with respect to the maincoordinate system. This system can be rotated to any position using Eulerrotations, and can be translated so the origin of the rotated coordinate systemsits on an arbitrary point in the main coordinate system.
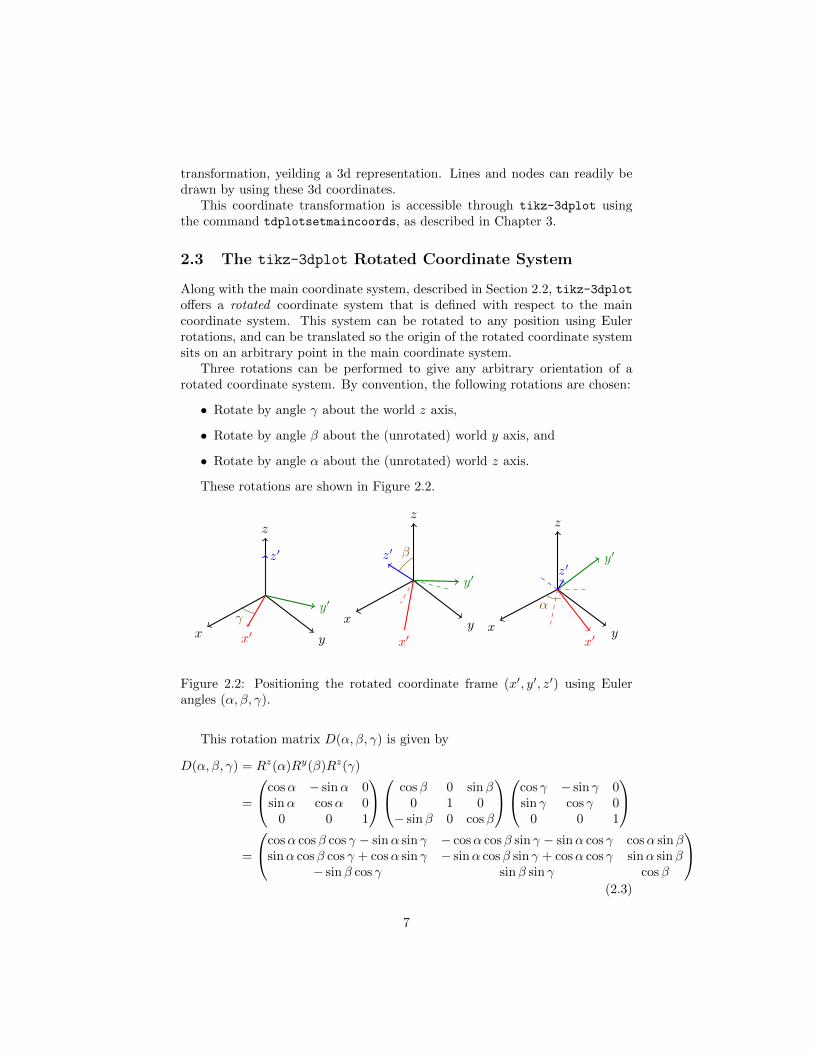
Three rotations can be performed to give any arbitrary orientation of arotated coordinate system. By convention, the following rotations are chosen:
• Rotate by angle γ about the world z axis,
• Rotate by angle β about the (unrotated) world y axis, and
• Rotate by angle α about the (unrotated) world z axis.
These rotations are shown in Figure 2.2.
x y
z
x′
y′
z′
γ x y
z
x′
y′
z′ β
x y
z
x′
y′
z′
α
Figure 2.2: Positioning the rotated coordinate frame (x′, y′, z′) using Eulerangles (α, β, γ).
This rotation matrix D(α, β, γ) is given by
D(α, β, γ) = Rz(α)Ry(β)Rz(γ)
=
cosα − sinα 0sinα cosα 0
0 0 1
cosβ 0 sinβ0 1 0
− sinβ 0 cosβ
cos γ − sin γ 0sin γ cos γ 0
0 0 1
=
cosα cosβ cos γ − sinα sin γ − cosα cosβ sin γ − sinα cos γ cosα sinβsinα cosβ cos γ + cosα sin γ − sinα cosβ sin γ + cosα cos γ sinα sinβ
− sinβ cos γ sinβ sin γ cosβ
(2.3)
7
To define the rotated coordinate frame, this rotation matrix is applied afterrotation matrix Rd(θd, φd) used to define the main coordinate frame. The fulltransformation for the rotated coordinate frame is then given by
R′d(θd, φd, α, β, γ) = D(α, β, γ)Rd(θd, φd) (2.4)
Using this matrix, the TikZ coordinate transformation can be applied asdescribed in Section 2.1 by the various matrix elements, as
x′ = (R′d1,1, R
′d2,1)
y′ = (R′d1,2, R
′d2,2)
z′ = (R′d1,3, R
′d2,3)
(2.5)
This coordinate transformation is accessible through tikz-3dplot usingthe command tdplotsetrotatedcoords, as described in Chapter 3.
xy
z
x′
y′
z′
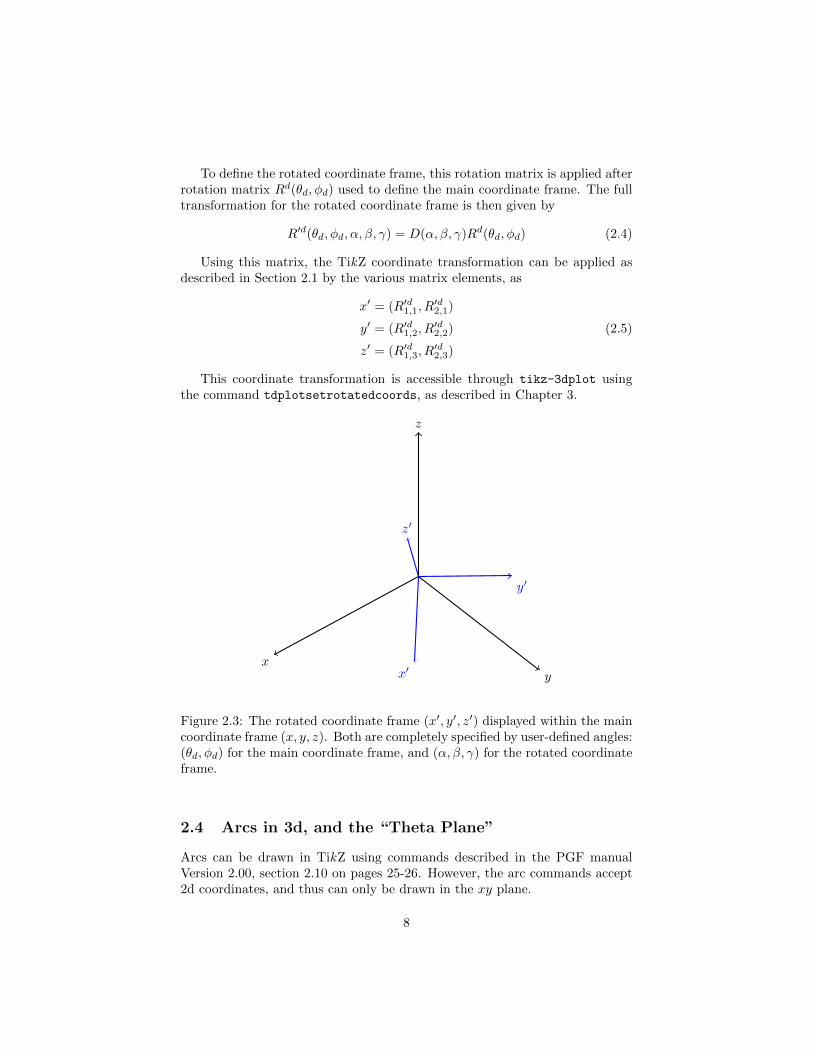
Figure 2.3: The rotated coordinate frame (x′, y′, z′) displayed within the maincoordinate frame (x, y, z). Both are completely specified by user-defined angles:(θd, φd) for the main coordinate frame, and (α, β, γ) for the rotated coordinateframe.
2.4 Arcs in 3d, and the “Theta Plane”
Arcs can be drawn in TikZ using commands described in the PGF manualVersion 2.00, section 2.10 on pages 25-26. However, the arc commands accept2d coordinates, and thus can only be drawn in the xy plane.
8
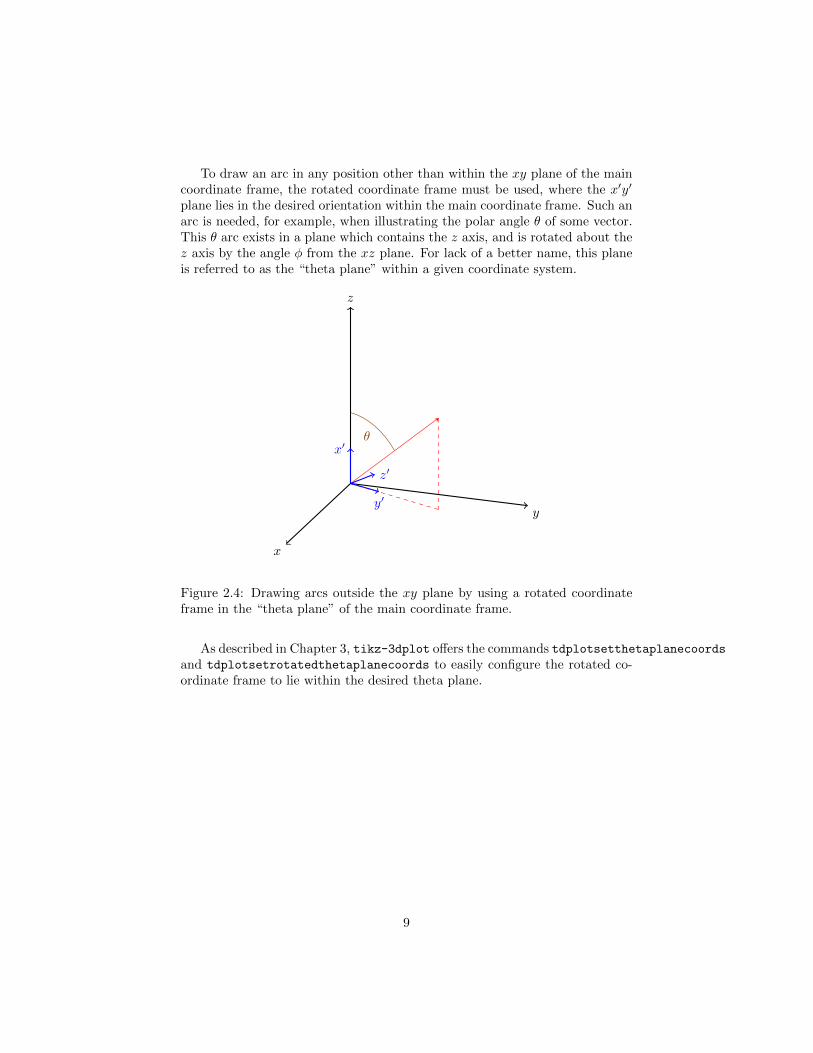
To draw an arc in any position other than within the xy plane of the maincoordinate frame, the rotated coordinate frame must be used, where the x′y′
plane lies in the desired orientation within the main coordinate frame. Such anarc is needed, for example, when illustrating the polar angle θ of some vector.This θ arc exists in a plane which contains the z axis, and is rotated about thez axis by the angle φ from the xz plane. For lack of a better name, this planeis referred to as the “theta plane” within a given coordinate system.
x
y
z
x′
y′
z′
θ
Figure 2.4: Drawing arcs outside the xy plane by using a rotated coordinateframe in the “theta plane” of the main coordinate frame.
As described in Chapter 3, tikz-3dplot offers the commands tdplotsetthetaplanecoordsand tdplotsetrotatedthetaplanecoords to easily configure the rotated co-ordinate frame to lie within the desired theta plane.
9
Chapter 3
Using the tikz-3dplot Package
The tikz-3dplot package was developed to handle the number crunching de-scribed in Chapter 2, and provide a relatively simple and straightforward fron-tend for users.
The main and rotated coordinate frames are configured by using commandsdescribed in Section 3.2. These commands generate TikZ styles which can beused either in defining the tikzpicture environment, or directly in any TikZcommand. The styles are described further in Section 3.1.
3.1 The tikz-3dplot TikZ Styles
3.1.1 tdplot main coords
The tdplot_main_coords style stores the coordinate transformation required togenerate the main coordinate system. This style can either be used whenthe tikzpicture environment is started, or when an individual TikZ plottingcommand is used.
3.1.2 tdplot rotated coords
The tdplot_rotated_coords style stores the coordinate transformation (transla-tion and rotation) required to generate the rotated coordinate system withinthe main coordinate system. This style can either be used when the tikzpictureenvironment is started, or when an individual TikZ plotting command is used.
3.1.3 tdplot screen coords
The tdplot_screen_coords style provides the standard, unrotated TikZ coordi-nate frame. This is useful to escape out of the user-defined 3d coordinates usedat the beginning of the tikzpicture environment, and place something on anabsolute scale in the figure. Tables, legends, and captions contained within thesame figure as a 3d plot can make use of this style.
10
3.2 The tikz-3dplot Commands
This section lists the various commands provided by the tikz-3dplot package.Examples are provided where it is useful.
3.3 Coordinate Configuration Commands
3.3.1 tdplotsetmaincoords
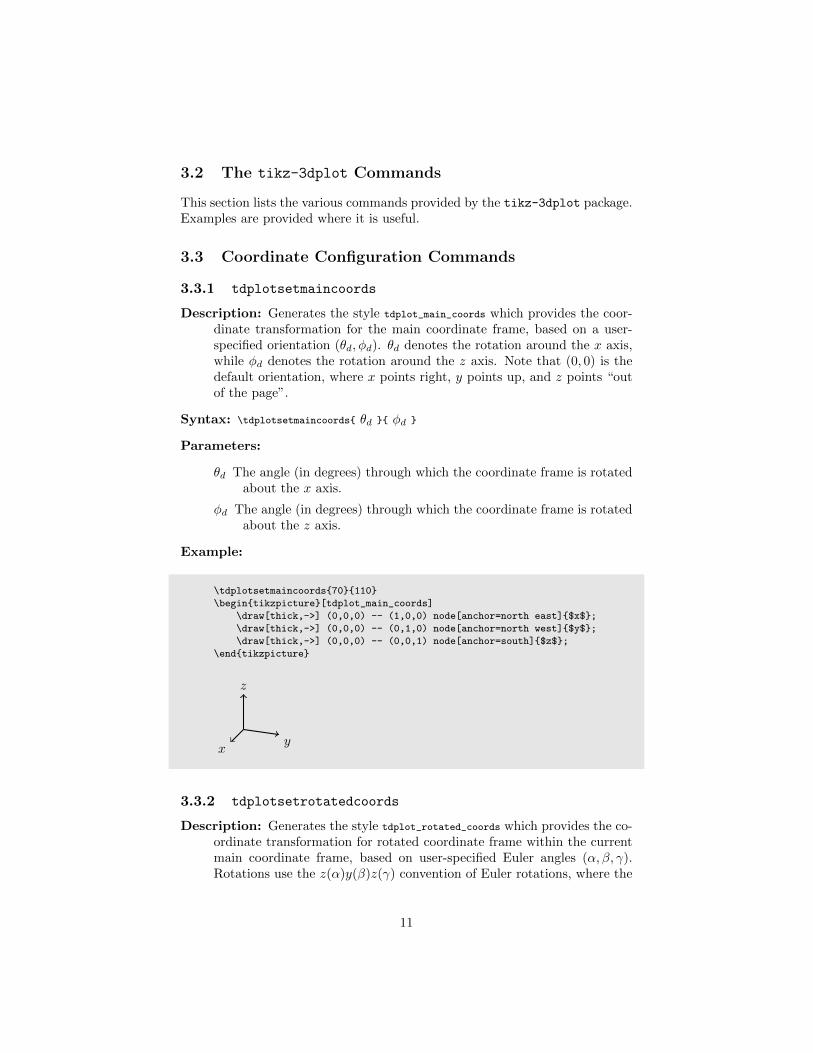
Description: Generates the style tdplot_main_coords which provides the coor-dinate transformation for the main coordinate frame, based on a user-specified orientation (θd, φd). θd denotes the rotation around the x axis,while φd denotes the rotation around the z axis. Note that (0, 0) is thedefault orientation, where x points right, y points up, and z points “outof the page”.
Syntax: \tdplotsetmaincoords{ θd }{ φd }
Parameters:
θd The angle (in degrees) through which the coordinate frame is rotatedabout the x axis.
φd The angle (in degrees) through which the coordinate frame is rotatedabout the z axis.
Example:
\tdplotsetmaincoords{70}{110}
\begin{tikzpicture}[tdplot_main_coords]
\draw[thick,->] (0,0,0) -- (1,0,0) node[anchor=north east]{$x$};
\draw[thick,->] (0,0,0) -- (0,1,0) node[anchor=north west]{$y$};
\draw[thick,->] (0,0,0) -- (0,0,1) node[anchor=south]{$z$};
\end{tikzpicture}
xy
z
3.3.2 tdplotsetrotatedcoords
Description: Generates the style tdplot_rotated_coords which provides the co-ordinate transformation for rotated coordinate frame within the currentmain coordinate frame, based on user-specified Euler angles (α, β, γ).Rotations use the z(α)y(β)z(γ) convention of Euler rotations, where the
11
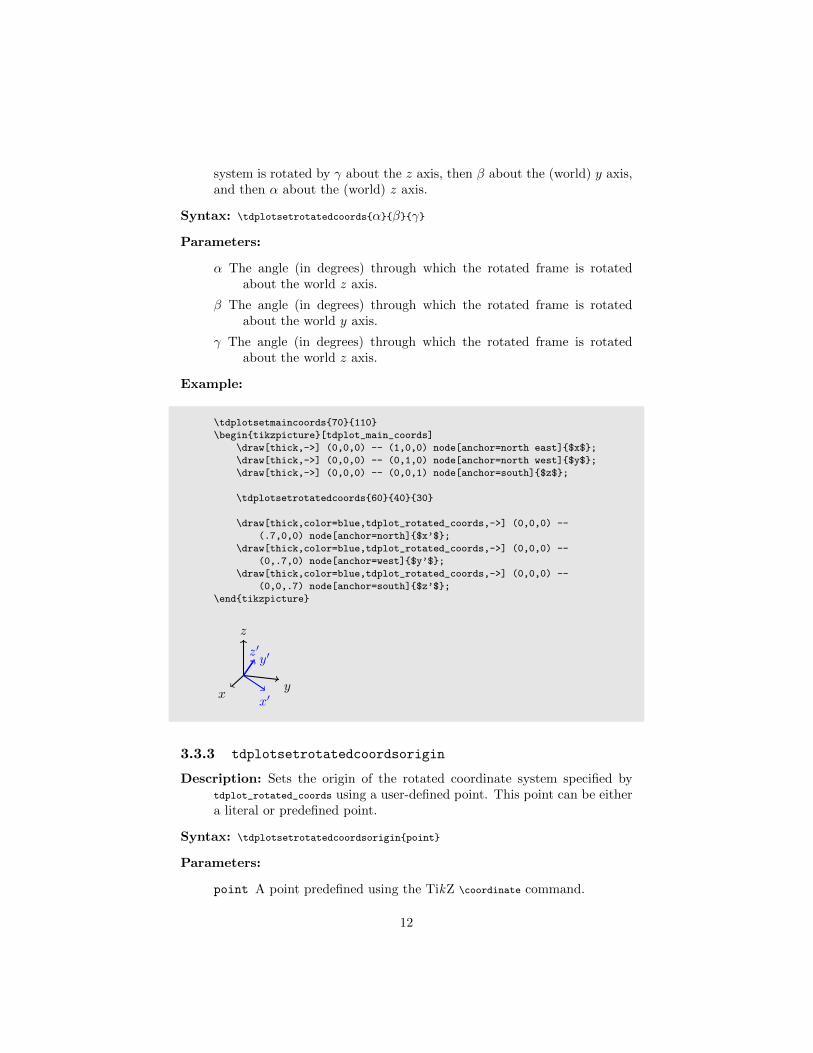
system is rotated by γ about the z axis, then β about the (world) y axis,and then α about the (world) z axis.
Syntax: \tdplotsetrotatedcoords{α}{β}{γ}
Parameters:
α The angle (in degrees) through which the rotated frame is rotatedabout the world z axis.
β The angle (in degrees) through which the rotated frame is rotatedabout the world y axis.
γ The angle (in degrees) through which the rotated frame is rotatedabout the world z axis.
Example:
\tdplotsetmaincoords{70}{110}
\begin{tikzpicture}[tdplot_main_coords]
\draw[thick,->] (0,0,0) -- (1,0,0) node[anchor=north east]{$x$};
\draw[thick,->] (0,0,0) -- (0,1,0) node[anchor=north west]{$y$};
\draw[thick,->] (0,0,0) -- (0,0,1) node[anchor=south]{$z$};
\tdplotsetrotatedcoords{60}{40}{30}
\draw[thick,color=blue,tdplot_rotated_coords,->] (0,0,0) --
(.7,0,0) node[anchor=north]{$x’$};
\draw[thick,color=blue,tdplot_rotated_coords,->] (0,0,0) --
(0,.7,0) node[anchor=west]{$y’$};
\draw[thick,color=blue,tdplot_rotated_coords,->] (0,0,0) --
(0,0,.7) node[anchor=south]{$z’$};
\end{tikzpicture}
xy
z
x′
y′z′
3.3.3 tdplotsetrotatedcoordsorigin
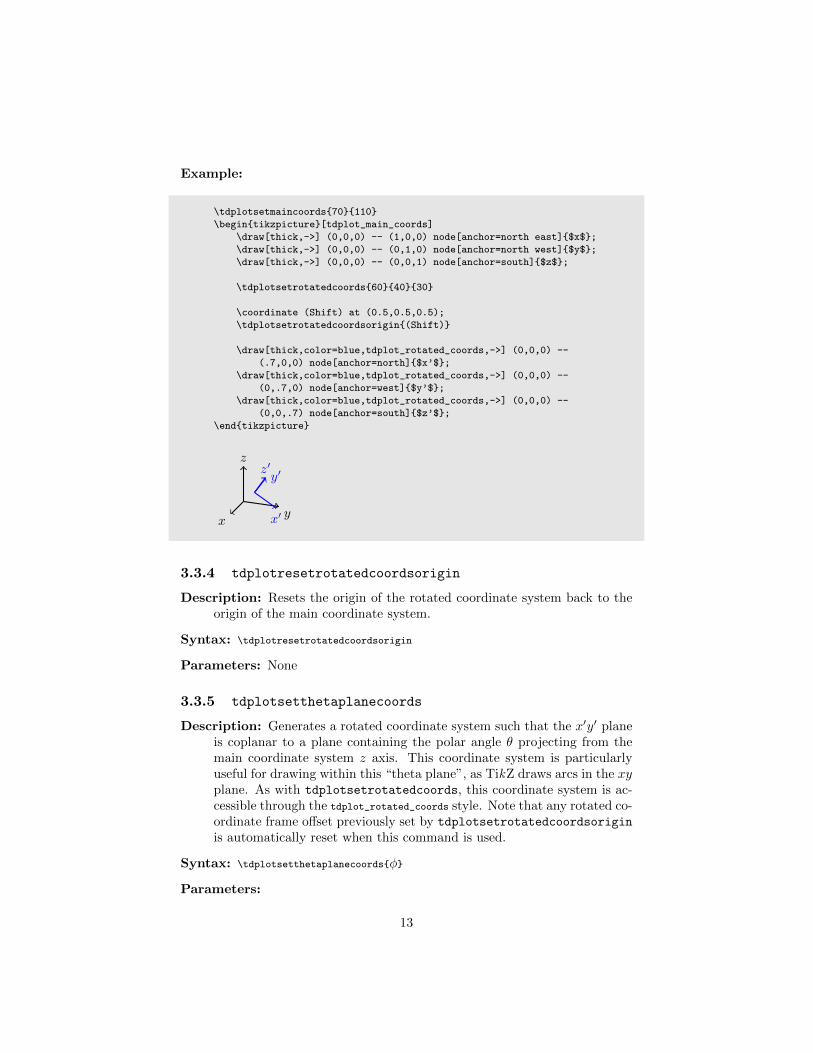
Description: Sets the origin of the rotated coordinate system specified bytdplot_rotated_coords using a user-defined point. This point can be eithera literal or predefined point.
Syntax: \tdplotsetrotatedcoordsorigin{point}
Parameters:
point A point predefined using the TikZ \coordinate command.
12
Example:
\tdplotsetmaincoords{70}{110}
\begin{tikzpicture}[tdplot_main_coords]
\draw[thick,->] (0,0,0) -- (1,0,0) node[anchor=north east]{$x$};
\draw[thick,->] (0,0,0) -- (0,1,0) node[anchor=north west]{$y$};
\draw[thick,->] (0,0,0) -- (0,0,1) node[anchor=south]{$z$};
\tdplotsetrotatedcoords{60}{40}{30}
\coordinate (Shift) at (0.5,0.5,0.5);
\tdplotsetrotatedcoordsorigin{(Shift)}
\draw[thick,color=blue,tdplot_rotated_coords,->] (0,0,0) --
(.7,0,0) node[anchor=north]{$x’$};
\draw[thick,color=blue,tdplot_rotated_coords,->] (0,0,0) --
(0,.7,0) node[anchor=west]{$y’$};
\draw[thick,color=blue,tdplot_rotated_coords,->] (0,0,0) --
(0,0,.7) node[anchor=south]{$z’$};
\end{tikzpicture}
xy
z
x′
y′z′
3.3.4 tdplotresetrotatedcoordsorigin
Description: Resets the origin of the rotated coordinate system back to theorigin of the main coordinate system.
Syntax: \tdplotresetrotatedcoordsorigin
Parameters: None
3.3.5 tdplotsetthetaplanecoords
Description: Generates a rotated coordinate system such that the x′y′ planeis coplanar to a plane containing the polar angle θ projecting from themain coordinate system z axis. This coordinate system is particularlyuseful for drawing within this “theta plane”, as TikZ draws arcs in the xyplane. As with tdplotsetrotatedcoords, this coordinate system is ac-cessible through the tdplot_rotated_coords style. Note that any rotated co-ordinate frame offset previously set by tdplotsetrotatedcoordsorigin
is automatically reset when this command is used.
Syntax: \tdplotsetthetaplanecoords{φ}
Parameters:
13
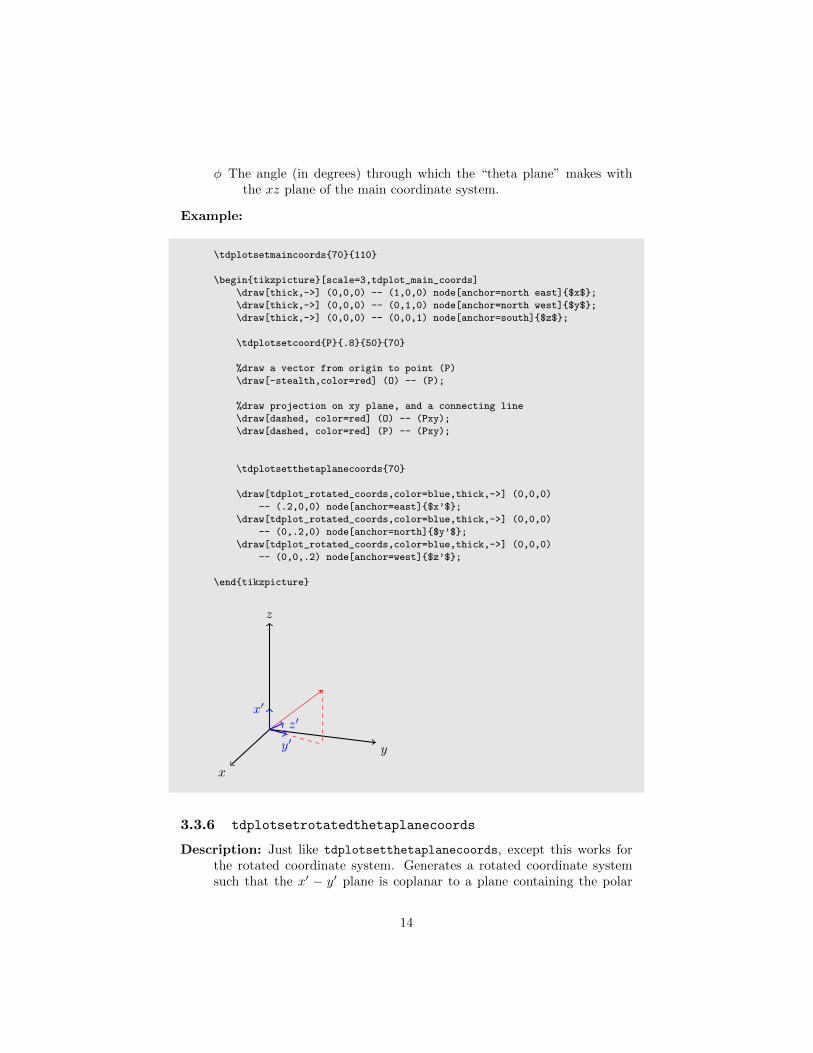
φ The angle (in degrees) through which the “theta plane” makes withthe xz plane of the main coordinate system.
Example:
\tdplotsetmaincoords{70}{110}
\begin{tikzpicture}[scale=3,tdplot_main_coords]
\draw[thick,->] (0,0,0) -- (1,0,0) node[anchor=north east]{$x$};
\draw[thick,->] (0,0,0) -- (0,1,0) node[anchor=north west]{$y$};
\draw[thick,->] (0,0,0) -- (0,0,1) node[anchor=south]{$z$};
\tdplotsetcoord{P}{.8}{50}{70}
%draw a vector from origin to point (P)
\draw[-stealth,color=red] (O) -- (P);
%draw projection on xy plane, and a connecting line
\draw[dashed, color=red] (O) -- (Pxy);
\draw[dashed, color=red] (P) -- (Pxy);
\tdplotsetthetaplanecoords{70}
\draw[tdplot_rotated_coords,color=blue,thick,->] (0,0,0)
-- (.2,0,0) node[anchor=east]{$x’$};
\draw[tdplot_rotated_coords,color=blue,thick,->] (0,0,0)
-- (0,.2,0) node[anchor=north]{$y’$};
\draw[tdplot_rotated_coords,color=blue,thick,->] (0,0,0)
-- (0,0,.2) node[anchor=west]{$z’$};
\end{tikzpicture}
x
y
z
x′
y′z′
3.3.6 tdplotsetrotatedthetaplanecoords
Description: Just like tdplotsetthetaplanecoords, except this works forthe rotated coordinate system. Generates a rotated coordinate systemsuch that the x′ − y′ plane is coplanar to a plane containing the polar
14
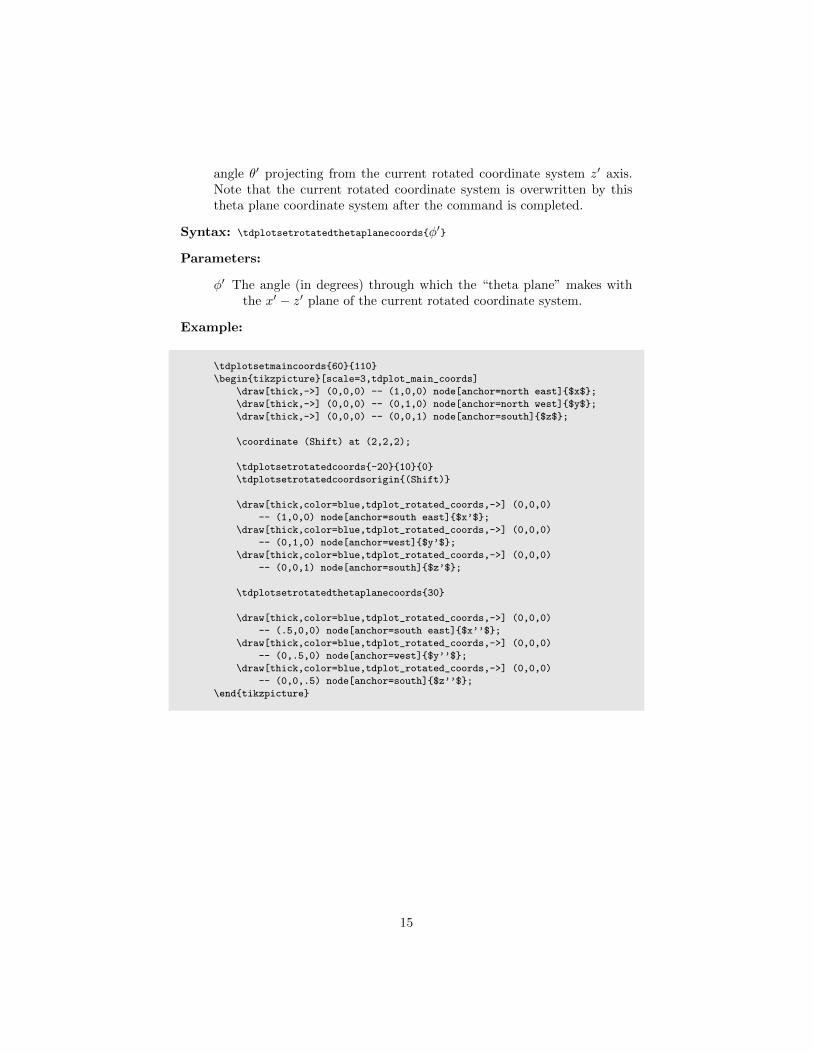
angle θ′ projecting from the current rotated coordinate system z′ axis.Note that the current rotated coordinate system is overwritten by thistheta plane coordinate system after the command is completed.
Syntax: \tdplotsetrotatedthetaplanecoords{φ′}
Parameters:
φ′ The angle (in degrees) through which the “theta plane” makes withthe x′ − z′ plane of the current rotated coordinate system.
Example:
\tdplotsetmaincoords{60}{110}
\begin{tikzpicture}[scale=3,tdplot_main_coords]
\draw[thick,->] (0,0,0) -- (1,0,0) node[anchor=north east]{$x$};
\draw[thick,->] (0,0,0) -- (0,1,0) node[anchor=north west]{$y$};
\draw[thick,->] (0,0,0) -- (0,0,1) node[anchor=south]{$z$};
\coordinate (Shift) at (2,2,2);
\tdplotsetrotatedcoords{-20}{10}{0}
\tdplotsetrotatedcoordsorigin{(Shift)}
\draw[thick,color=blue,tdplot_rotated_coords,->] (0,0,0)
-- (1,0,0) node[anchor=south east]{$x’$};
\draw[thick,color=blue,tdplot_rotated_coords,->] (0,0,0)
-- (0,1,0) node[anchor=west]{$y’$};
\draw[thick,color=blue,tdplot_rotated_coords,->] (0,0,0)
-- (0,0,1) node[anchor=south]{$z’$};
\tdplotsetrotatedthetaplanecoords{30}
\draw[thick,color=blue,tdplot_rotated_coords,->] (0,0,0)
-- (.5,0,0) node[anchor=south east]{$x’’$};
\draw[thick,color=blue,tdplot_rotated_coords,->] (0,0,0)
-- (0,.5,0) node[anchor=west]{$y’’$};
\draw[thick,color=blue,tdplot_rotated_coords,->] (0,0,0)
-- (0,0,.5) node[anchor=south]{$z’’$};
\end{tikzpicture}
15
x
y
z
x′y′
z′
x′′
y′′
z′′
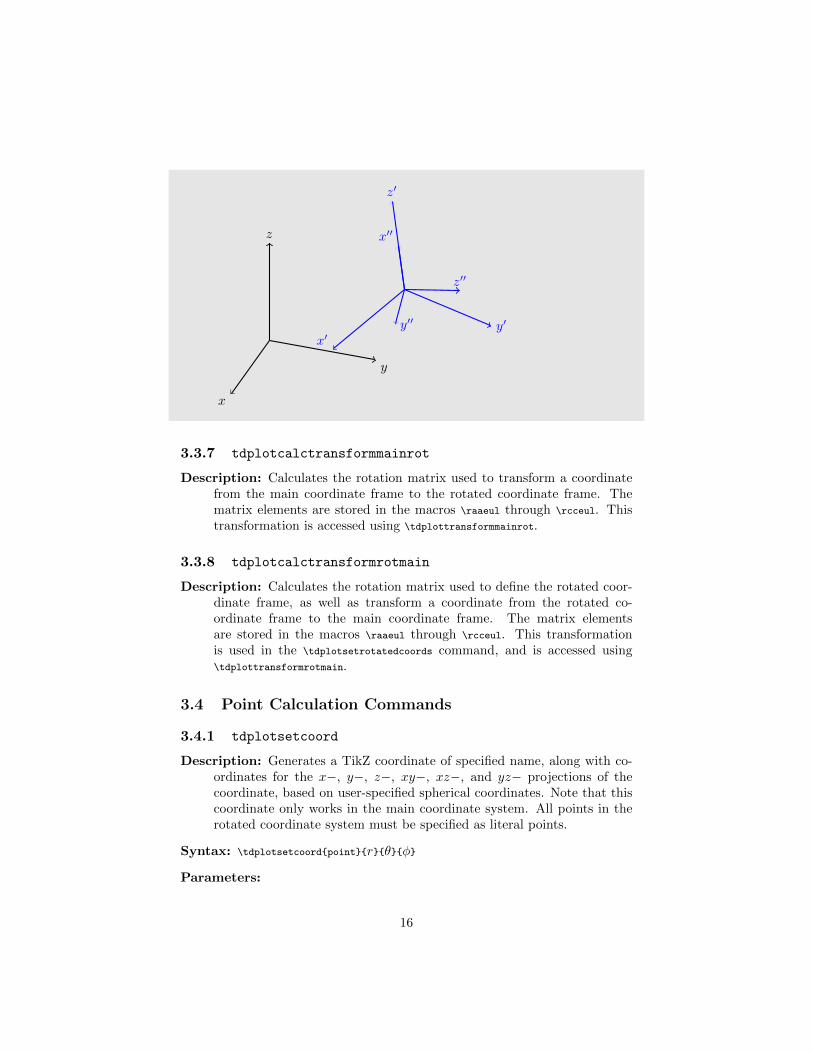
3.3.7 tdplotcalctransformmainrot
Description: Calculates the rotation matrix used to transform a coordinatefrom the main coordinate frame to the rotated coordinate frame. Thematrix elements are stored in the macros \raaeul through \rcceul. Thistransformation is accessed using \tdplottransformmainrot.
3.3.8 tdplotcalctransformrotmain
Description: Calculates the rotation matrix used to define the rotated coor-dinate frame, as well as transform a coordinate from the rotated co-ordinate frame to the main coordinate frame. The matrix elementsare stored in the macros \raaeul through \rcceul. This transformationis used in the \tdplotsetrotatedcoords command, and is accessed using\tdplottransformrotmain.
3.4 Point Calculation Commands
3.4.1 tdplotsetcoord
Description: Generates a TikZ coordinate of specified name, along with co-ordinates for the x−, y−, z−, xy−, xz−, and yz− projections of thecoordinate, based on user-specified spherical coordinates. Note that thiscoordinate only works in the main coordinate system. All points in therotated coordinate system must be specified as literal points.
Syntax: \tdplotsetcoord{point}{r}{θ}{φ}
Parameters:
16
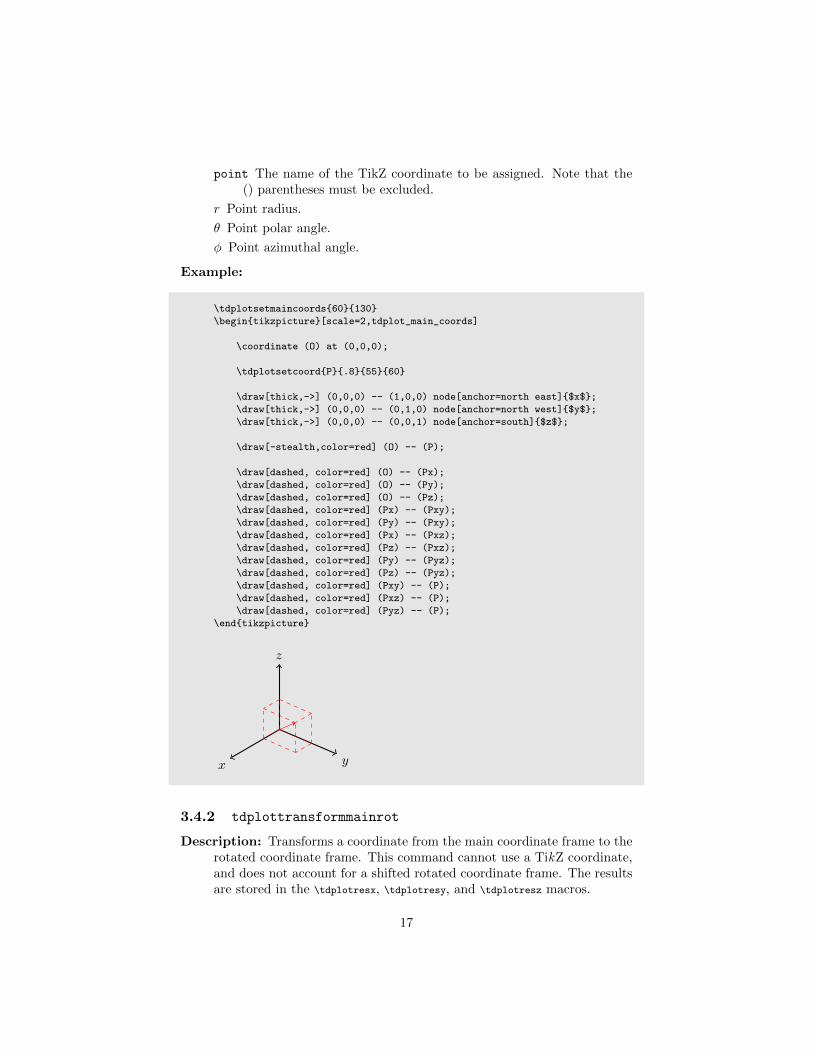
point The name of the TikZ coordinate to be assigned. Note that the() parentheses must be excluded.
r Point radius.
θ Point polar angle.
φ Point azimuthal angle.
Example:
\tdplotsetmaincoords{60}{130}
\begin{tikzpicture}[scale=2,tdplot_main_coords]
\coordinate (O) at (0,0,0);
\tdplotsetcoord{P}{.8}{55}{60}
\draw[thick,->] (0,0,0) -- (1,0,0) node[anchor=north east]{$x$};
\draw[thick,->] (0,0,0) -- (0,1,0) node[anchor=north west]{$y$};
\draw[thick,->] (0,0,0) -- (0,0,1) node[anchor=south]{$z$};
\draw[-stealth,color=red] (O) -- (P);
\draw[dashed, color=red] (O) -- (Px);
\draw[dashed, color=red] (O) -- (Py);
\draw[dashed, color=red] (O) -- (Pz);
\draw[dashed, color=red] (Px) -- (Pxy);
\draw[dashed, color=red] (Py) -- (Pxy);
\draw[dashed, color=red] (Px) -- (Pxz);
\draw[dashed, color=red] (Pz) -- (Pxz);
\draw[dashed, color=red] (Py) -- (Pyz);
\draw[dashed, color=red] (Pz) -- (Pyz);
\draw[dashed, color=red] (Pxy) -- (P);
\draw[dashed, color=red] (Pxz) -- (P);
\draw[dashed, color=red] (Pyz) -- (P);
\end{tikzpicture}
x y
z
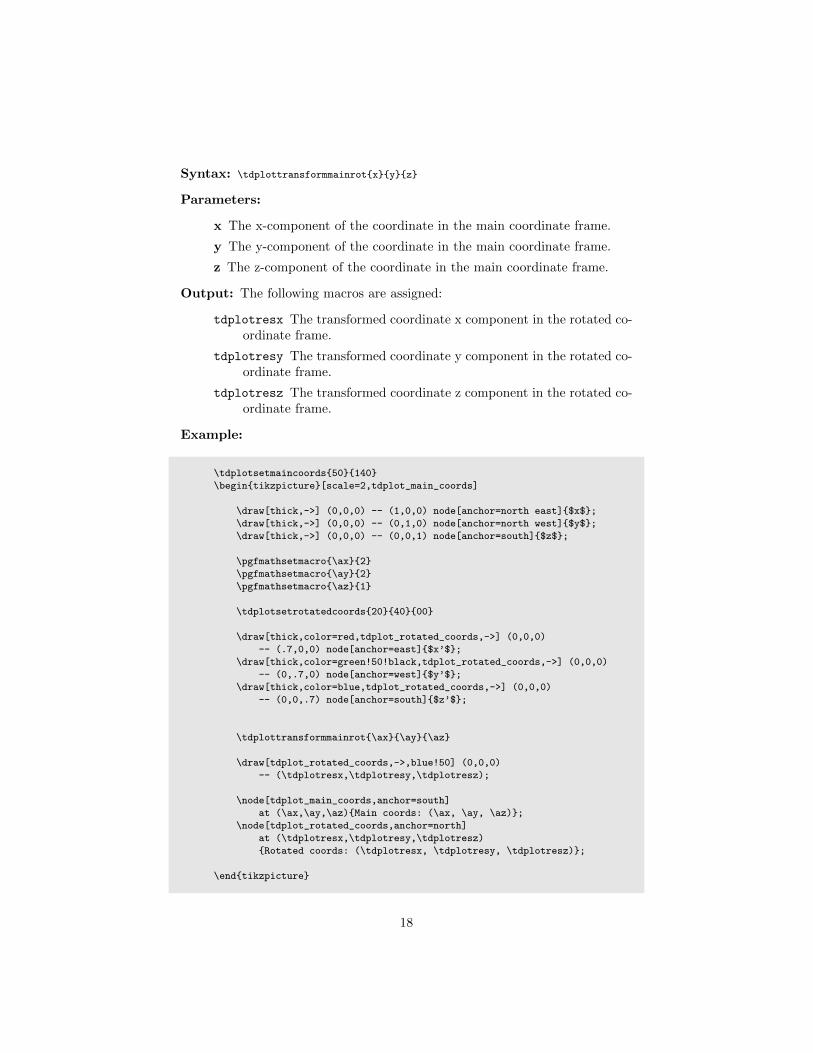
3.4.2 tdplottransformmainrot
Description: Transforms a coordinate from the main coordinate frame to therotated coordinate frame. This command cannot use a TikZ coordinate,and does not account for a shifted rotated coordinate frame. The resultsare stored in the \tdplotresx, \tdplotresy, and \tdplotresz macros.
17
Syntax: \tdplottransformmainrot{x}{y}{z}
Parameters:
x The x-component of the coordinate in the main coordinate frame.
y The y-component of the coordinate in the main coordinate frame.
z The z-component of the coordinate in the main coordinate frame.
Output: The following macros are assigned:
tdplotresx The transformed coordinate x component in the rotated co-ordinate frame.
tdplotresy The transformed coordinate y component in the rotated co-ordinate frame.
tdplotresz The transformed coordinate z component in the rotated co-ordinate frame.
Example:
\tdplotsetmaincoords{50}{140}
\begin{tikzpicture}[scale=2,tdplot_main_coords]
\draw[thick,->] (0,0,0) -- (1,0,0) node[anchor=north east]{$x$};
\draw[thick,->] (0,0,0) -- (0,1,0) node[anchor=north west]{$y$};
\draw[thick,->] (0,0,0) -- (0,0,1) node[anchor=south]{$z$};
\pgfmathsetmacro{\ax}{2}
\pgfmathsetmacro{\ay}{2}
\pgfmathsetmacro{\az}{1}
\tdplotsetrotatedcoords{20}{40}{00}
\draw[thick,color=red,tdplot_rotated_coords,->] (0,0,0)
-- (.7,0,0) node[anchor=east]{$x’$};
\draw[thick,color=green!50!black,tdplot_rotated_coords,->] (0,0,0)
-- (0,.7,0) node[anchor=west]{$y’$};
\draw[thick,color=blue,tdplot_rotated_coords,->] (0,0,0)
-- (0,0,.7) node[anchor=south]{$z’$};
\tdplottransformmainrot{\ax}{\ay}{\az}
\draw[tdplot_rotated_coords,->,blue!50] (0,0,0)
-- (\tdplotresx,\tdplotresy,\tdplotresz);
\node[tdplot_main_coords,anchor=south]
at (\ax,\ay,\az){Main coords: (\ax, \ay, \az)};
\node[tdplot_rotated_coords,anchor=north]
at (\tdplotresx,\tdplotresy,\tdplotresz)
{Rotated coords: (\tdplotresx, \tdplotresy, \tdplotresz)};
\end{tikzpicture}
18
x y
z
x′
y′
z′
Main coords: (2.0, 2.0, 1.0)
Rotated coords: (1.32086, 1.19534, 2.41377)
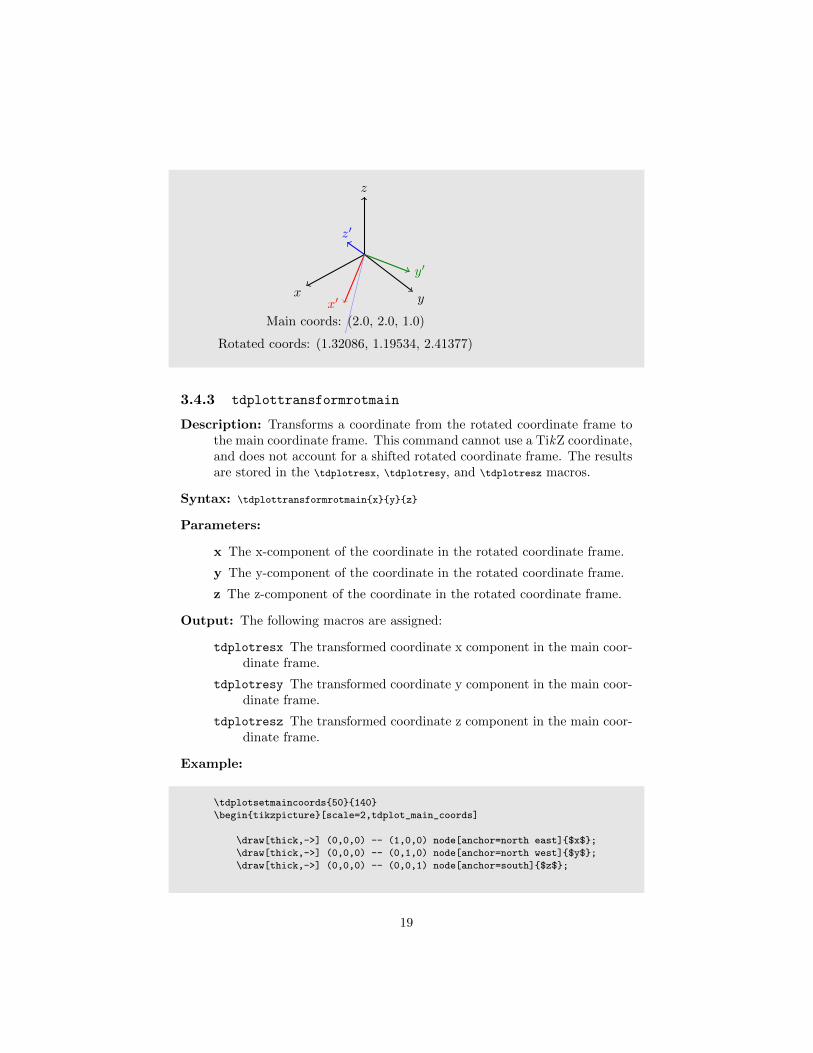
3.4.3 tdplottransformrotmain
Description: Transforms a coordinate from the rotated coordinate frame tothe main coordinate frame. This command cannot use a TikZ coordinate,and does not account for a shifted rotated coordinate frame. The resultsare stored in the \tdplotresx, \tdplotresy, and \tdplotresz macros.
Syntax: \tdplottransformrotmain{x}{y}{z}
Parameters:
x The x-component of the coordinate in the rotated coordinate frame.
y The y-component of the coordinate in the rotated coordinate frame.
z The z-component of the coordinate in the rotated coordinate frame.
Output: The following macros are assigned:
tdplotresx The transformed coordinate x component in the main coor-dinate frame.
tdplotresy The transformed coordinate y component in the main coor-dinate frame.
tdplotresz The transformed coordinate z component in the main coor-dinate frame.
Example:
\tdplotsetmaincoords{50}{140}
\begin{tikzpicture}[scale=2,tdplot_main_coords]
\draw[thick,->] (0,0,0) -- (1,0,0) node[anchor=north east]{$x$};
\draw[thick,->] (0,0,0) -- (0,1,0) node[anchor=north west]{$y$};
\draw[thick,->] (0,0,0) -- (0,0,1) node[anchor=south]{$z$};
19
\pgfmathsetmacro{\ax}{-.75}
\pgfmathsetmacro{\ay}{2.5}
\pgfmathsetmacro{\az}{0}
\tdplotsetrotatedcoords{20}{40}{00}
\draw[thick,color=red,tdplot_rotated_coords,->] (0,0,0)
-- (.7,0,0) node[anchor=east]{$x’$};
\draw[thick,color=green!50!black,tdplot_rotated_coords,->] (0,0,0)
-- (0,.7,0) node[anchor=west]{$y’$};
\draw[thick,color=blue,tdplot_rotated_coords,->] (0,0,0)
-- (0,0,.7) node[anchor=south]{$z’$};
\tdplottransformrotmain{\ax}{\ay}{\az}
\draw[tdplot_main_coords,->,blue!50] (0,0,0)
-- (\tdplotresx,\tdplotresy,\tdplotresz);
\node[tdplot_rotated_coords,anchor=north]
at (\ax,\ay,\az){Rotated coords: (\ax, \ay, \az)};
\node[tdplot_main_coords,anchor=south]
at (\tdplotresx,\tdplotresy,\tdplotresz)
{Main coords: (\tdplotresx, \tdplotresy, \tdplotresz)};
\end{tikzpicture}
x y
z
x′
y′
z′
Rotated coords: (-0.75, 2.5, 0.0)
Main coords: (-1.39493, 2.15276, 0.48209)
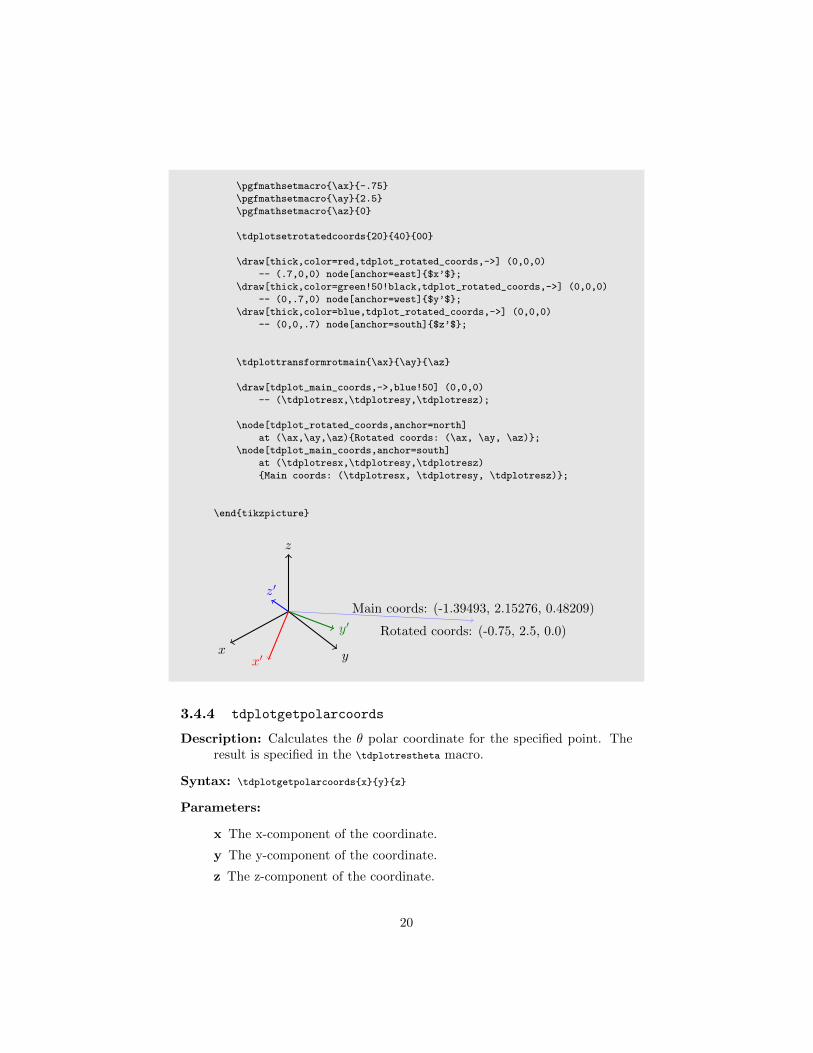
3.4.4 tdplotgetpolarcoords
Description: Calculates the θ polar coordinate for the specified point. Theresult is specified in the \tdplotrestheta macro.
Syntax: \tdplotgetpolarcoords{x}{y}{z}
Parameters:
x The x-component of the coordinate.
y The y-component of the coordinate.
z The z-component of the coordinate.
20
Output: tdplotrestheta The θ polar coordinate.
tdplotresphi The φ polar coordinate.
Example:
\tdplotsetmaincoords{70}{110}
\begin{tikzpicture}[tdplot_main_coords]
\draw[thick,->] (0,0,0) -- (3,0,0) node[anchor=north east]{$x$};
\draw[thick,->] (0,0,0) -- (0,3,0) node[anchor=north west]{$y$};
\draw[thick,->] (0,0,0) -- (0,0,3) node[anchor=south]{$z$};
\pgfmathsetmacro{\ax}{1}
\pgfmathsetmacro{\ay}{1}
\pgfmathsetmacro{\az}{1}
\draw[->,red] (0,0,0) -- (\ax,\ay,\az);
\draw[dashed,red] (0,0,0) -- (\ax,\ay,0) -- (\ax,\ay,\az);
\tdplotgetpolarcoords{\ax}{\ay}{\az}
\tdplotsetthetaplanecoords{\tdplotresphi}
\tdplotdrawarc[tdplot_rotated_coords]{(0,0,0)}{1}{0}%
{\tdplotrestheta}{anchor=west}{$\theta = \tdplotrestheta$}
\end{tikzpicture}
x
y
z
φ = 45.0
θ = 54.68636
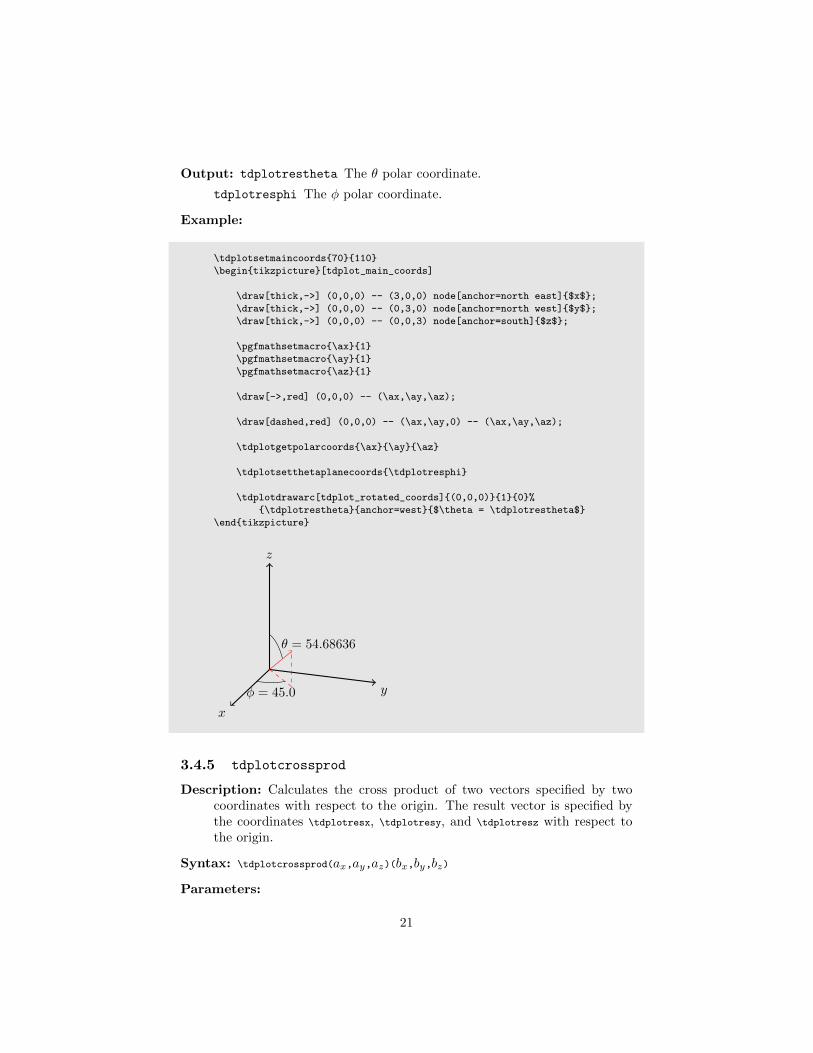
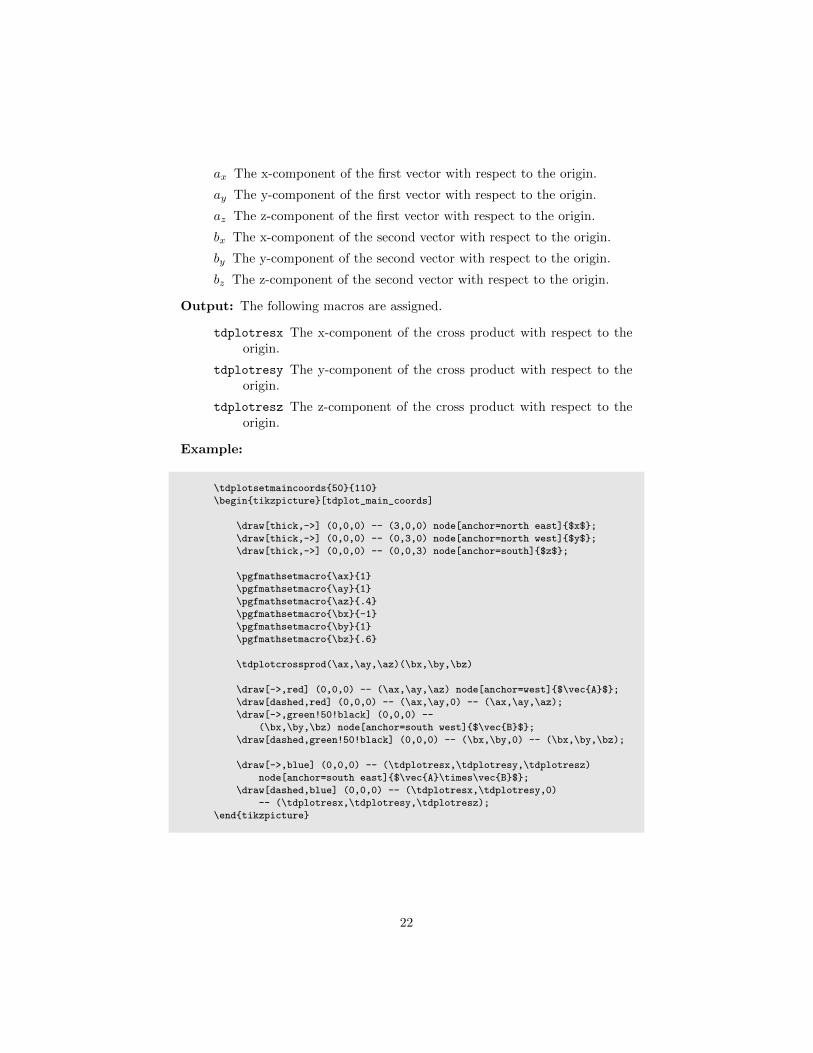
3.4.5 tdplotcrossprod
Description: Calculates the cross product of two vectors specified by twocoordinates with respect to the origin. The result vector is specified bythe coordinates \tdplotresx, \tdplotresy, and \tdplotresz with respect tothe origin.
Syntax: \tdplotcrossprod(ax,ay,az)(bx,by,bz)
Parameters:
21
ax The x-component of the first vector with respect to the origin.
ay The y-component of the first vector with respect to the origin.
az The z-component of the first vector with respect to the origin.
bx The x-component of the second vector with respect to the origin.
by The y-component of the second vector with respect to the origin.
bz The z-component of the second vector with respect to the origin.
Output: The following macros are assigned.
tdplotresx The x-component of the cross product with respect to theorigin.
tdplotresy The y-component of the cross product with respect to theorigin.
tdplotresz The z-component of the cross product with respect to theorigin.
Example:
\tdplotsetmaincoords{50}{110}
\begin{tikzpicture}[tdplot_main_coords]
\draw[thick,->] (0,0,0) -- (3,0,0) node[anchor=north east]{$x$};
\draw[thick,->] (0,0,0) -- (0,3,0) node[anchor=north west]{$y$};
\draw[thick,->] (0,0,0) -- (0,0,3) node[anchor=south]{$z$};
\pgfmathsetmacro{\ax}{1}
\pgfmathsetmacro{\ay}{1}
\pgfmathsetmacro{\az}{.4}
\pgfmathsetmacro{\bx}{-1}
\pgfmathsetmacro{\by}{1}
\pgfmathsetmacro{\bz}{.6}
\tdplotcrossprod(\ax,\ay,\az)(\bx,\by,\bz)
\draw[->,red] (0,0,0) -- (\ax,\ay,\az) node[anchor=west]{$\vec{A}$};
\draw[dashed,red] (0,0,0) -- (\ax,\ay,0) -- (\ax,\ay,\az);
\draw[->,green!50!black] (0,0,0) --
(\bx,\by,\bz) node[anchor=south west]{$\vec{B}$};
\draw[dashed,green!50!black] (0,0,0) -- (\bx,\by,0) -- (\bx,\by,\bz);
\draw[->,blue] (0,0,0) -- (\tdplotresx,\tdplotresy,\tdplotresz)
node[anchor=south east]{$\vec{A}\times\vec{B}$};
\draw[dashed,blue] (0,0,0) -- (\tdplotresx,\tdplotresy,0)
-- (\tdplotresx,\tdplotresy,\tdplotresz);
\end{tikzpicture}
22
x
y
z
~A
~B
~A× ~B
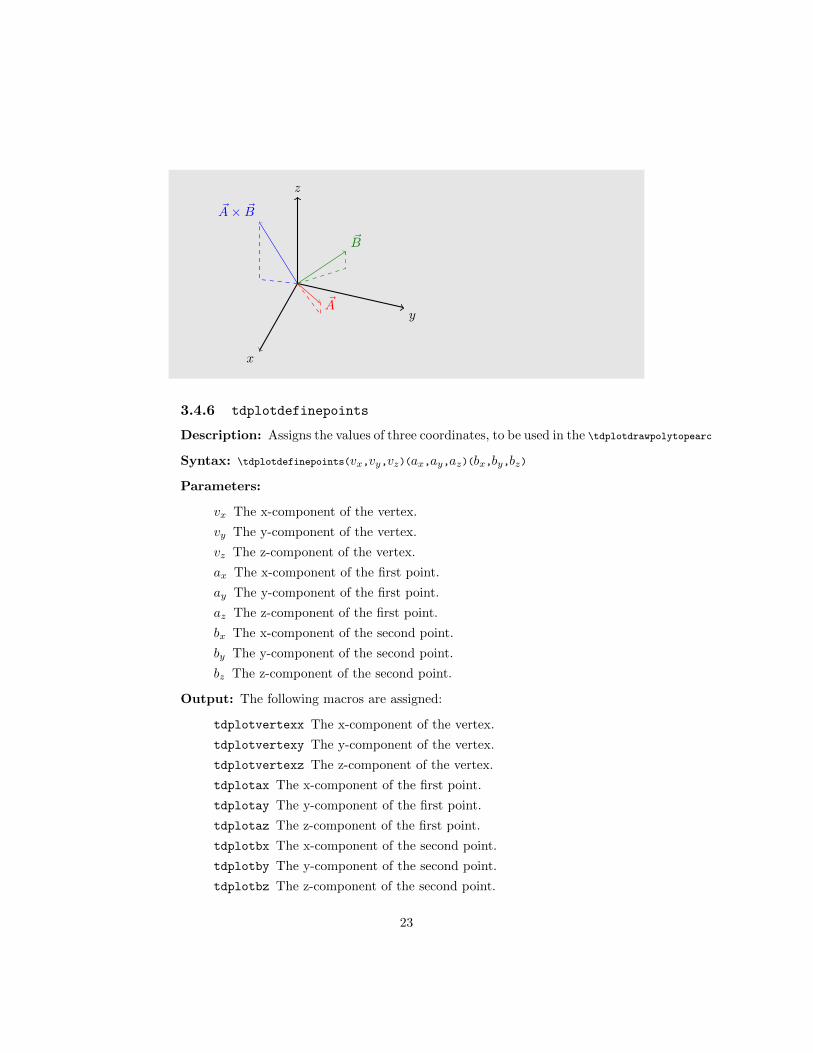
3.4.6 tdplotdefinepoints
Description: Assigns the values of three coordinates, to be used in the \tdplotdrawpolytopearc
Syntax: \tdplotdefinepoints(vx,vy,vz)(ax,ay,az)(bx,by,bz)
Parameters:
vx The x-component of the vertex.
vy The y-component of the vertex.
vz The z-component of the vertex.
ax The x-component of the first point.
ay The y-component of the first point.
az The z-component of the first point.
bx The x-component of the second point.
by The y-component of the second point.
bz The z-component of the second point.
Output: The following macros are assigned:
tdplotvertexx The x-component of the vertex.
tdplotvertexy The y-component of the vertex.
tdplotvertexz The z-component of the vertex.
tdplotax The x-component of the first point.
tdplotay The y-component of the first point.
tdplotaz The z-component of the first point.
tdplotbx The x-component of the second point.
tdplotby The y-component of the second point.
tdplotbz The z-component of the second point.
23
3.5 Drawing Commands
Along with all the conventional TikZ drawing commands, the following tikz-3dplot
commands can be used.
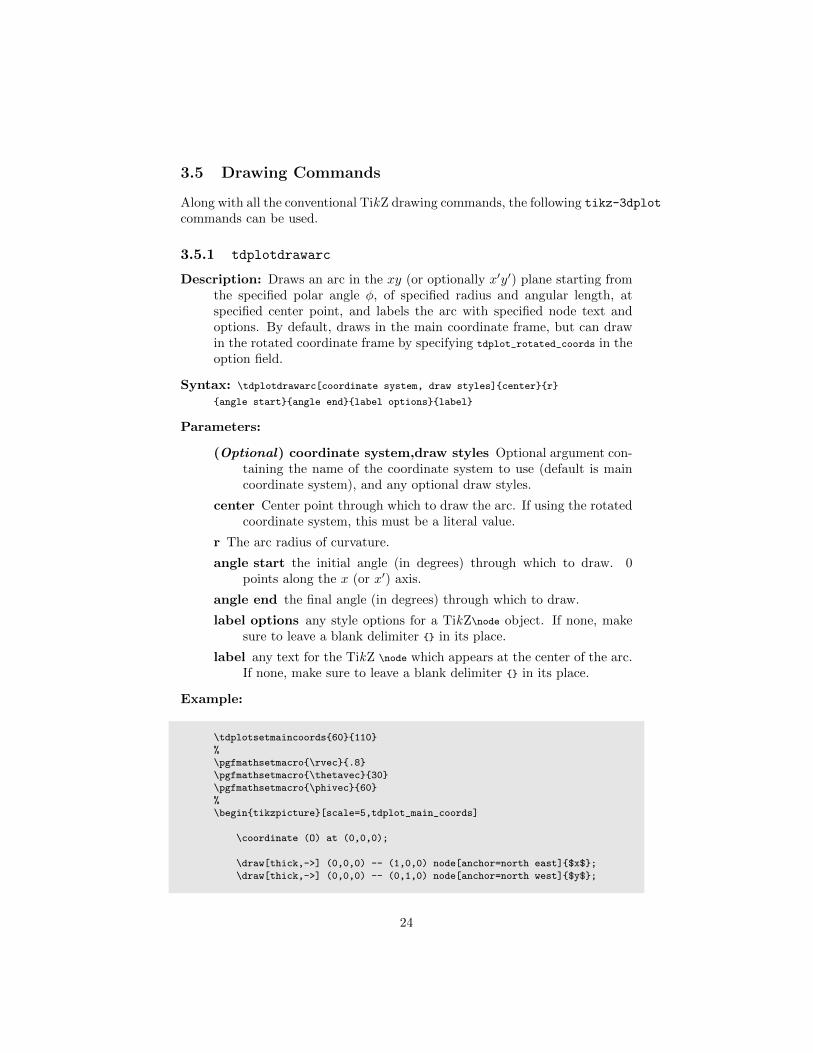
3.5.1 tdplotdrawarc
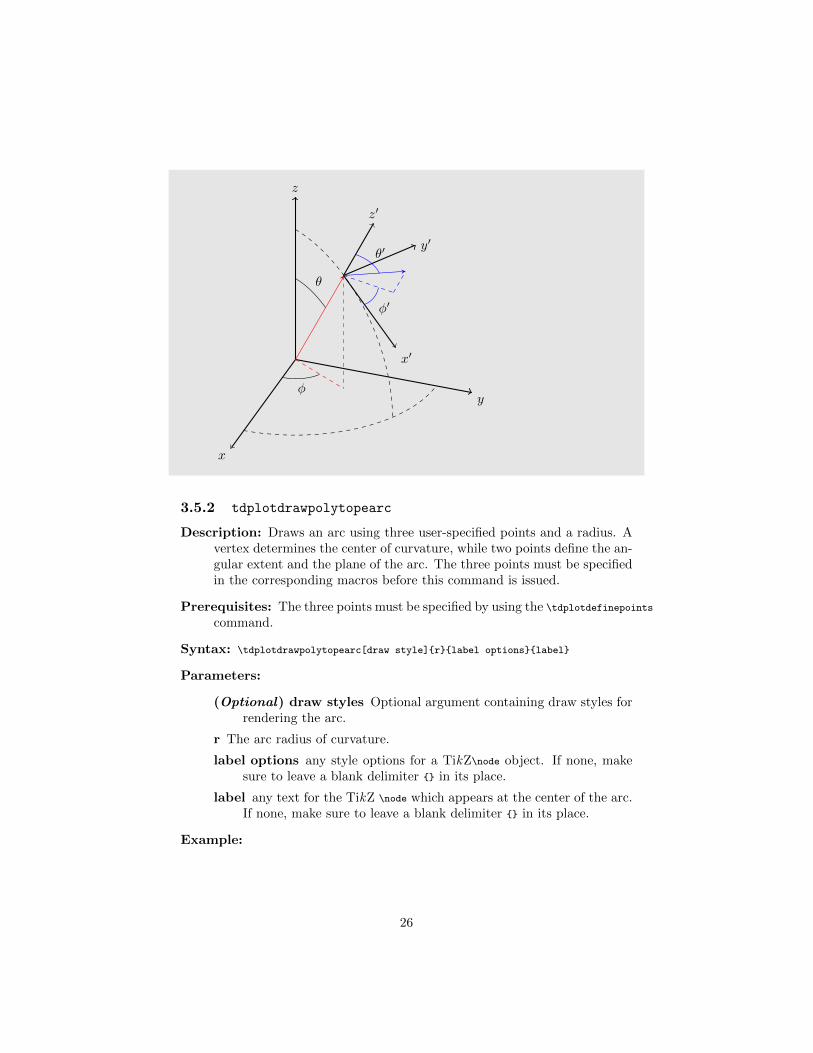
Description: Draws an arc in the xy (or optionally x′y′) plane starting fromthe specified polar angle φ, of specified radius and angular length, atspecified center point, and labels the arc with specified node text andoptions. By default, draws in the main coordinate frame, but can drawin the rotated coordinate frame by specifying tdplot_rotated_coords in theoption field.
Syntax: \tdplotdrawarc[coordinate system, draw styles]{center}{r}
{angle start}{angle end}{label options}{label}
Parameters:
(Optional) coordinate system,draw styles Optional argument con-taining the name of the coordinate system to use (default is maincoordinate system), and any optional draw styles.
center Center point through which to draw the arc. If using the rotatedcoordinate system, this must be a literal value.
r The arc radius of curvature.
angle start the initial angle (in degrees) through which to draw. 0points along the x (or x′) axis.
angle end the final angle (in degrees) through which to draw.
label options any style options for a TikZ\node object. If none, makesure to leave a blank delimiter {} in its place.
label any text for the TikZ \node which appears at the center of the arc.If none, make sure to leave a blank delimiter {} in its place.
Example:
\tdplotsetmaincoords{60}{110}
%
\pgfmathsetmacro{\rvec}{.8}
\pgfmathsetmacro{\thetavec}{30}
\pgfmathsetmacro{\phivec}{60}
%
\begin{tikzpicture}[scale=5,tdplot_main_coords]
\coordinate (O) at (0,0,0);
\draw[thick,->] (0,0,0) -- (1,0,0) node[anchor=north east]{$x$};
\draw[thick,->] (0,0,0) -- (0,1,0) node[anchor=north west]{$y$};
24
\draw[thick,->] (0,0,0) -- (0,0,1) node[anchor=south]{$z$};
\tdplotsetcoord{P}{\rvec}{\thetavec}{\phivec}
\draw[-stealth,color=red] (O) -- (P);
\draw[dashed, color=red] (O) -- (Pxy);
\draw[dashed, color=red] (P) -- (Pxy);
\tdplotdrawarc{(O)}{0.2}{0}{\phivec}{anchor=north}{$\phi$}
\tdplotsetthetaplanecoords{\phivec}
\tdplotdrawarc[tdplot_rotated_coords]{(0,0,0)}{0.5}{0}%
{\thetavec}{anchor=south west}{$\theta$}
\draw[dashed,tdplot_rotated_coords] (\rvec,0,0) arc (0:90:\rvec);
\draw[dashed] (\rvec,0,0) arc (0:90:\rvec);
\tdplotsetrotatedcoords{\phivec}{\thetavec}{0}
\tdplotsetrotatedcoordsorigin{(P)}
\draw[thick,tdplot_rotated_coords,->] (0,0,0)
-- (.5,0,0) node[anchor=north west]{$x’$};
\draw[thick,tdplot_rotated_coords,->] (0,0,0)
-- (0,.5,0) node[anchor=west]{$y’$};
\draw[thick,tdplot_rotated_coords,->] (0,0,0)
-- (0,0,.5) node[anchor=south]{$z’$};
\draw[-stealth,color=blue,tdplot_rotated_coords] (0,0,0) -- (.2,.2,.2);
\draw[dashed,color=blue,tdplot_rotated_coords] (0,0,0) -- (.2,.2,0);
\draw[dashed,color=blue,tdplot_rotated_coords] (.2,.2,0) -- (.2,.2,.2);
\tdplotdrawarc[tdplot_rotated_coords,color=blue]{(0,0,0)}{0.2}{0}%
{45}{anchor=north west,color=black}{$\phi’$}
\tdplotsetrotatedthetaplanecoords{45}
\tdplotdrawarc[tdplot_rotated_coords,color=blue]{(0,0,0)}{0.2}{0}%
{55}{anchor=south west,color=black}{$\theta’$}
\end{tikzpicture}
25
x
y
z
φ
θ
x′
y′
z′
φ′
θ′
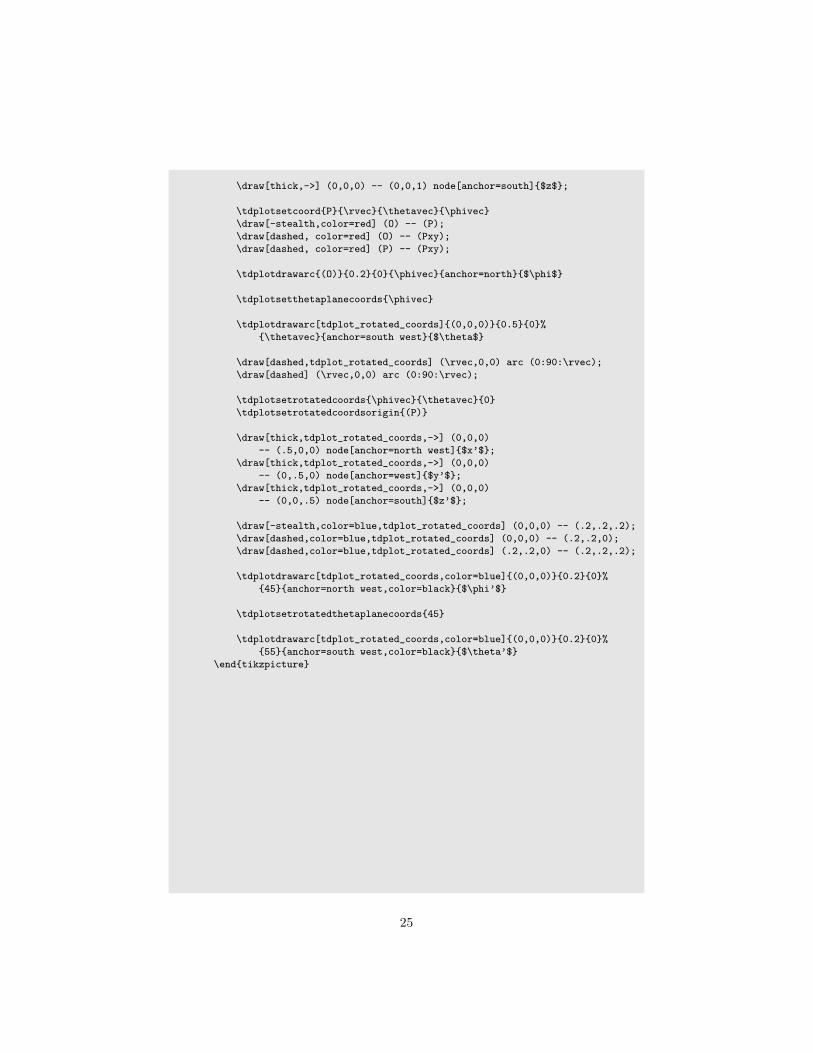
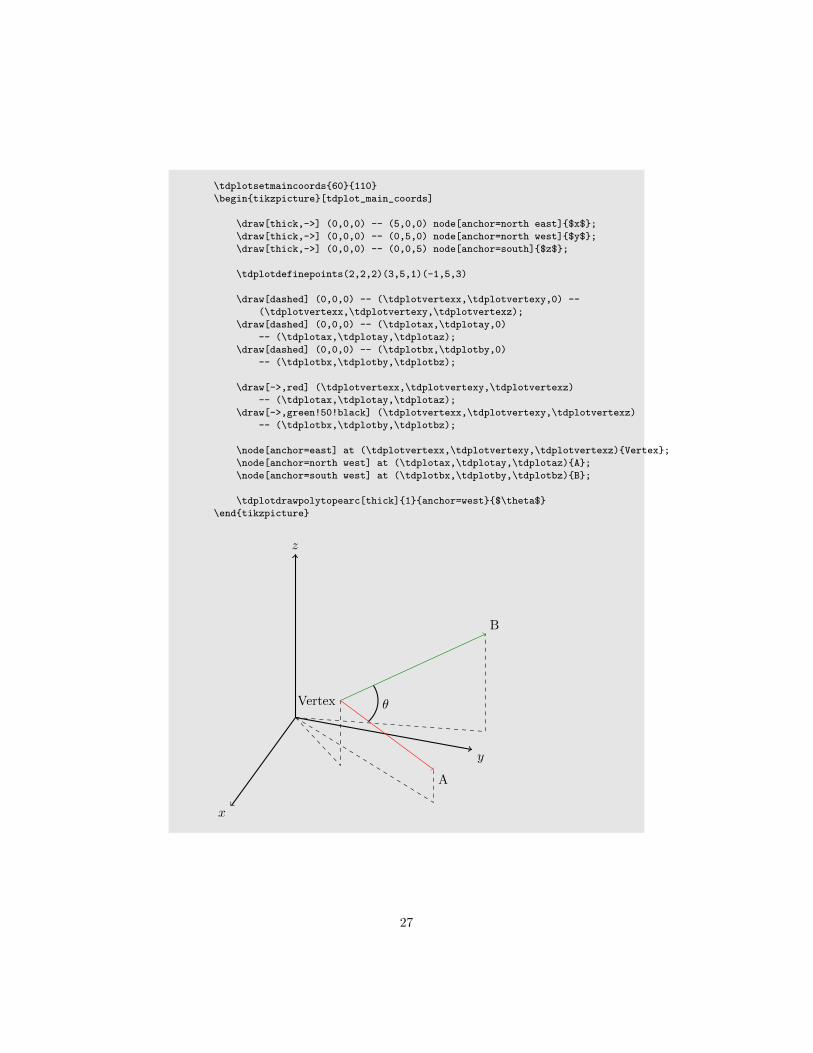
3.5.2 tdplotdrawpolytopearc
Description: Draws an arc using three user-specified points and a radius. Avertex determines the center of curvature, while two points define the an-gular extent and the plane of the arc. The three points must be specifiedin the corresponding macros before this command is issued.
Prerequisites: The three points must be specified by using the \tdplotdefinepoints
command.
Syntax: \tdplotdrawpolytopearc[draw style]{r}{label options}{label}
Parameters:
(Optional) draw styles Optional argument containing draw styles forrendering the arc.
r The arc radius of curvature.
label options any style options for a TikZ\node object. If none, makesure to leave a blank delimiter {} in its place.
label any text for the TikZ \node which appears at the center of the arc.If none, make sure to leave a blank delimiter {} in its place.
Example:
26
\tdplotsetmaincoords{60}{110}
\begin{tikzpicture}[tdplot_main_coords]
\draw[thick,->] (0,0,0) -- (5,0,0) node[anchor=north east]{$x$};
\draw[thick,->] (0,0,0) -- (0,5,0) node[anchor=north west]{$y$};
\draw[thick,->] (0,0,0) -- (0,0,5) node[anchor=south]{$z$};
\tdplotdefinepoints(2,2,2)(3,5,1)(-1,5,3)
\draw[dashed] (0,0,0) -- (\tdplotvertexx,\tdplotvertexy,0) --
(\tdplotvertexx,\tdplotvertexy,\tdplotvertexz);
\draw[dashed] (0,0,0) -- (\tdplotax,\tdplotay,0)
-- (\tdplotax,\tdplotay,\tdplotaz);
\draw[dashed] (0,0,0) -- (\tdplotbx,\tdplotby,0)
-- (\tdplotbx,\tdplotby,\tdplotbz);
\draw[->,red] (\tdplotvertexx,\tdplotvertexy,\tdplotvertexz)
-- (\tdplotax,\tdplotay,\tdplotaz);
\draw[->,green!50!black] (\tdplotvertexx,\tdplotvertexy,\tdplotvertexz)
-- (\tdplotbx,\tdplotby,\tdplotbz);
\node[anchor=east] at (\tdplotvertexx,\tdplotvertexy,\tdplotvertexz){Vertex};
\node[anchor=north west] at (\tdplotax,\tdplotay,\tdplotaz){A};
\node[anchor=south west] at (\tdplotbx,\tdplotby,\tdplotbz){B};
\tdplotdrawpolytopearc[thick]{1}{anchor=west}{$\theta$}
\end{tikzpicture}
x
y
z
Vertex
A
B
θ
27
3.6 The tdplotsphericalsurfaceplot Command
The \tdplotsphericalsurfaceplot command is quite complicated, and it seemedappropriate to occupy its own section. This command was initially developedto provide a method of rendering complex polar functions, z = z(θ, φ), wherethe magnitude of the function is expressed by the radius, and the phase of thefunction is expressed by the hue, as
r = |z(θ, φ)|hue = Arg [z(θ, φ)]
(3.1)
The command has been generalized so that the hue can be specified in termsof the three polar coordinates, as
r = f(θ, φ)
hue = g(r, θ, φ)(3.2)
3.6.1 How tdplotsphericalsurfaceplot Works
To achieve the illusion of a 3d surface with proper persistence of vision, thetikz-3dplot package divides the drawing task into smaller sections. Thisdivision ensures the surface on the far side of the viewing perspective is properlyoccluded from view.
For a given perspective assigned by the main coordinate frame, a “vieworientation” can be defined, giving the angles (θview, φview) that describe theorientation of the view. These angles determine how to dubdivide the surfacerendering process. The following divisions are made:
• Divide the surface into “front” and “back”, where the back is drawnbefore the front.
• Subdivide into “left” and “right”.
• Subdivide further into ”top” and ”bottom”.
The entire back half is drawn before the front half. For each half, the entireleft or right side is drawn. For each side, all θ angles are drawn in wedges foreach φ angle. When the back half is rendered, the θ angle is swept from θviewtoward the poles. When the front half is rendered, the θ angle is swept fromthe poles toward θview.
During this process, the x, y, and z axes are drawn at the appropriate time,ensuring the axes are occluded properly by the shape. The draw instructionsfor these axes are specified as user-defined parameters for this command.
3.6.2 Using tdplotsphericalsurfaceplot
Description: Draws a user-specified spherical polar function, with user-specifiedfill hues. Angular range to be displayed is specified with the \tdplotsetpolarplotrange
28
command. The line thickness can be specified by issuing the \pgfsetlinewidth
PGF macro.
Syntax: \tdplotsphericalsurfaceplot[fill color style]{theta steps}{phi steps}{function}
{line color}{fill color}{x axis}{y axis}{z axis}
Parameters:
(Optional) fill color style Specifies whether fill color is a functionof (\tdplotr, \tdplottheta, \tdplotphi), or a direct TikZ color. Set toparametricfill to enable functional coloring.
theta steps The number of steps used to render the surface along the θdirection. For best results, this number should not be smaller than12, and should be a factor of 360.
phi steps The number of steps used to render the surface along the φdirection. For best results, this number should not be smaller than12, and should be a factor of 360.
function A mathematical expression, containing the variables \tdplottheta
and \tdplotphi, used to define the radius of the surface for given an-gles. Note that the absolute value of the function is plotted.
line color TikZ color expression for surface lines.
fill color When the option parametricfill is used then this can be somemathematical expression containing \tdplottheta and \tdplotphi. Ifnot, then this can be any TikZ expression for color. Note that if thefunction specified by function is negative, a shift of 180 is appliedto the color. To avoid this, make sure function is always positive.
x axis Any draw commands used to render the x axis.
y axis Any draw commands used to render the y axis.
z axis Any draw commands used to render the z axis.
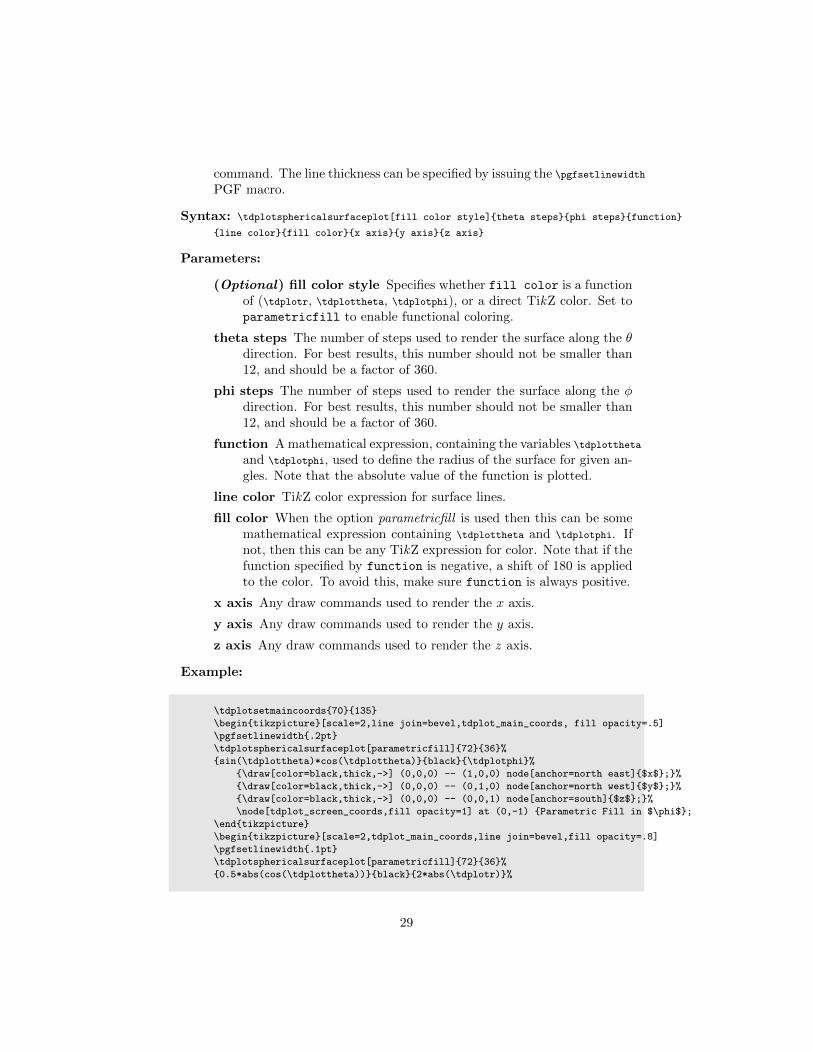
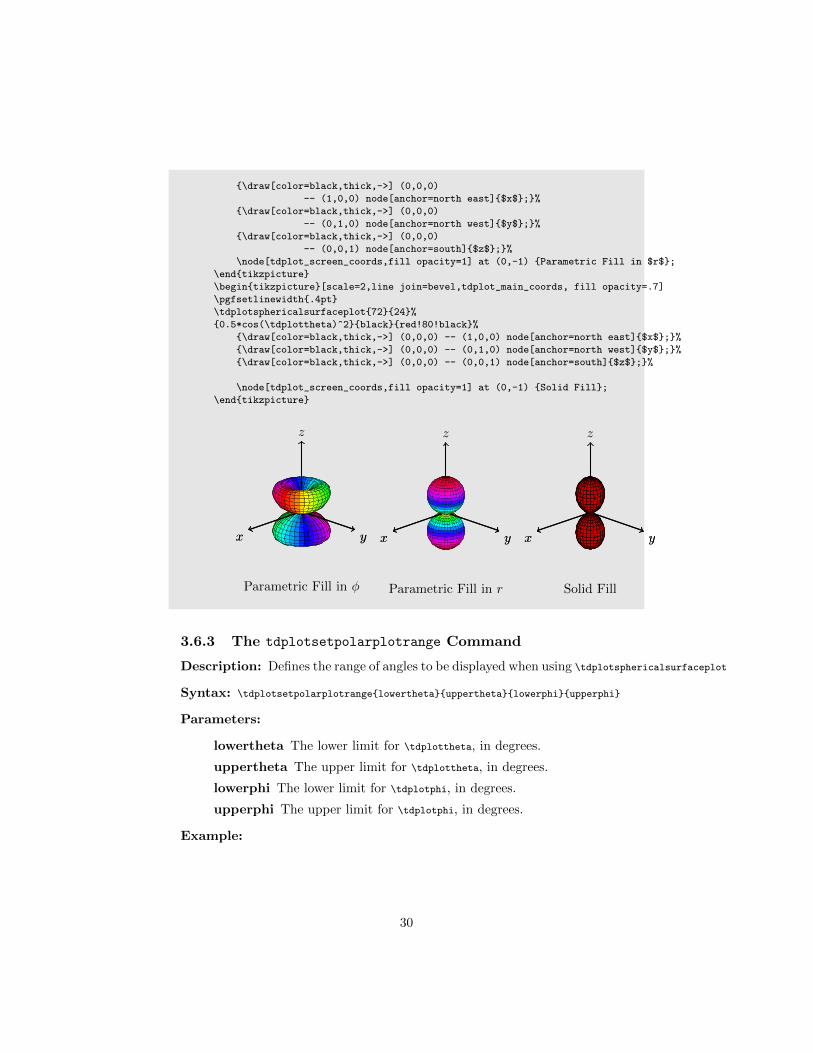
Example:
\tdplotsetmaincoords{70}{135}
\begin{tikzpicture}[scale=2,line join=bevel,tdplot_main_coords, fill opacity=.5]
\pgfsetlinewidth{.2pt}
\tdplotsphericalsurfaceplot[parametricfill]{72}{36}%
{sin(\tdplottheta)*cos(\tdplottheta)}{black}{\tdplotphi}%
{\draw[color=black,thick,->] (0,0,0) -- (1,0,0) node[anchor=north east]{$x$};}%
{\draw[color=black,thick,->] (0,0,0) -- (0,1,0) node[anchor=north west]{$y$};}%
{\draw[color=black,thick,->] (0,0,0) -- (0,0,1) node[anchor=south]{$z$};}%
\node[tdplot_screen_coords,fill opacity=1] at (0,-1) {Parametric Fill in $\phi$};
\end{tikzpicture}
\begin{tikzpicture}[scale=2,tdplot_main_coords,line join=bevel,fill opacity=.8]
\pgfsetlinewidth{.1pt}
\tdplotsphericalsurfaceplot[parametricfill]{72}{36}%
{0.5*abs(cos(\tdplottheta))}{black}{2*abs(\tdplotr)}%
29
{\draw[color=black,thick,->] (0,0,0)
-- (1,0,0) node[anchor=north east]{$x$};}%
{\draw[color=black,thick,->] (0,0,0)
-- (0,1,0) node[anchor=north west]{$y$};}%
{\draw[color=black,thick,->] (0,0,0)
-- (0,0,1) node[anchor=south]{$z$};}%
\node[tdplot_screen_coords,fill opacity=1] at (0,-1) {Parametric Fill in $r$};
\end{tikzpicture}
\begin{tikzpicture}[scale=2,line join=bevel,tdplot_main_coords, fill opacity=.7]
\pgfsetlinewidth{.4pt}
\tdplotsphericalsurfaceplot{72}{24}%
{0.5*cos(\tdplottheta)^2}{black}{red!80!black}%
{\draw[color=black,thick,->] (0,0,0) -- (1,0,0) node[anchor=north east]{$x$};}%
{\draw[color=black,thick,->] (0,0,0) -- (0,1,0) node[anchor=north west]{$y$};}%
{\draw[color=black,thick,->] (0,0,0) -- (0,0,1) node[anchor=south]{$z$};}%
\node[tdplot_screen_coords,fill opacity=1] at (0,-1) {Solid Fill};
\end{tikzpicture}
z
xx yy
Parametric Fill in φ
z
xx yy
Parametric Fill in r
z
xx yy
Solid Fill
3.6.3 The tdplotsetpolarplotrange Command
Description: Defines the range of angles to be displayed when using \tdplotsphericalsurfaceplot
Syntax: \tdplotsetpolarplotrange{lowertheta}{uppertheta}{lowerphi}{upperphi}
Parameters:
lowertheta The lower limit for \tdplottheta, in degrees.
uppertheta The upper limit for \tdplottheta, in degrees.
lowerphi The lower limit for \tdplotphi, in degrees.
upperphi The upper limit for \tdplotphi, in degrees.
Example:
30
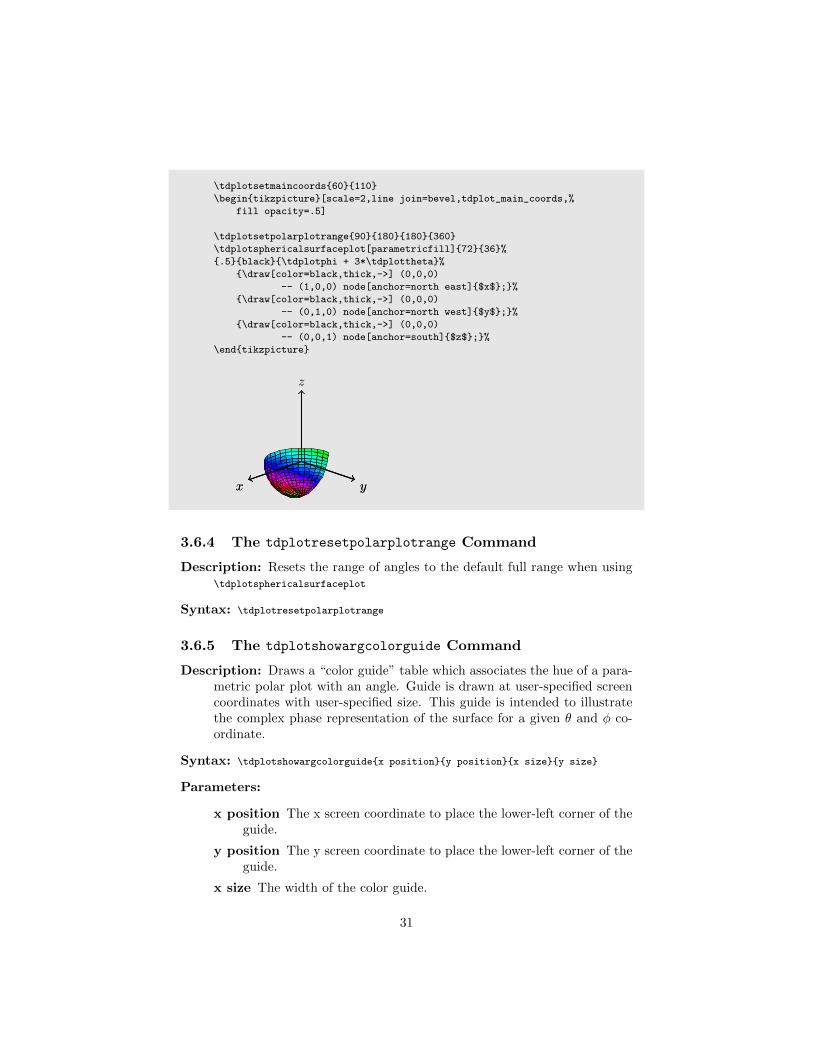
\tdplotsetmaincoords{60}{110}
\begin{tikzpicture}[scale=2,line join=bevel,tdplot_main_coords,%
fill opacity=.5]
\tdplotsetpolarplotrange{90}{180}{180}{360}
\tdplotsphericalsurfaceplot[parametricfill]{72}{36}%
{.5}{black}{\tdplotphi + 3*\tdplottheta}%
{\draw[color=black,thick,->] (0,0,0)
-- (1,0,0) node[anchor=north east]{$x$};}%
{\draw[color=black,thick,->] (0,0,0)
-- (0,1,0) node[anchor=north west]{$y$};}%
{\draw[color=black,thick,->] (0,0,0)
-- (0,0,1) node[anchor=south]{$z$};}%
\end{tikzpicture}
z
xx yy
3.6.4 The tdplotresetpolarplotrange Command
Description: Resets the range of angles to the default full range when using\tdplotsphericalsurfaceplot
Syntax: \tdplotresetpolarplotrange
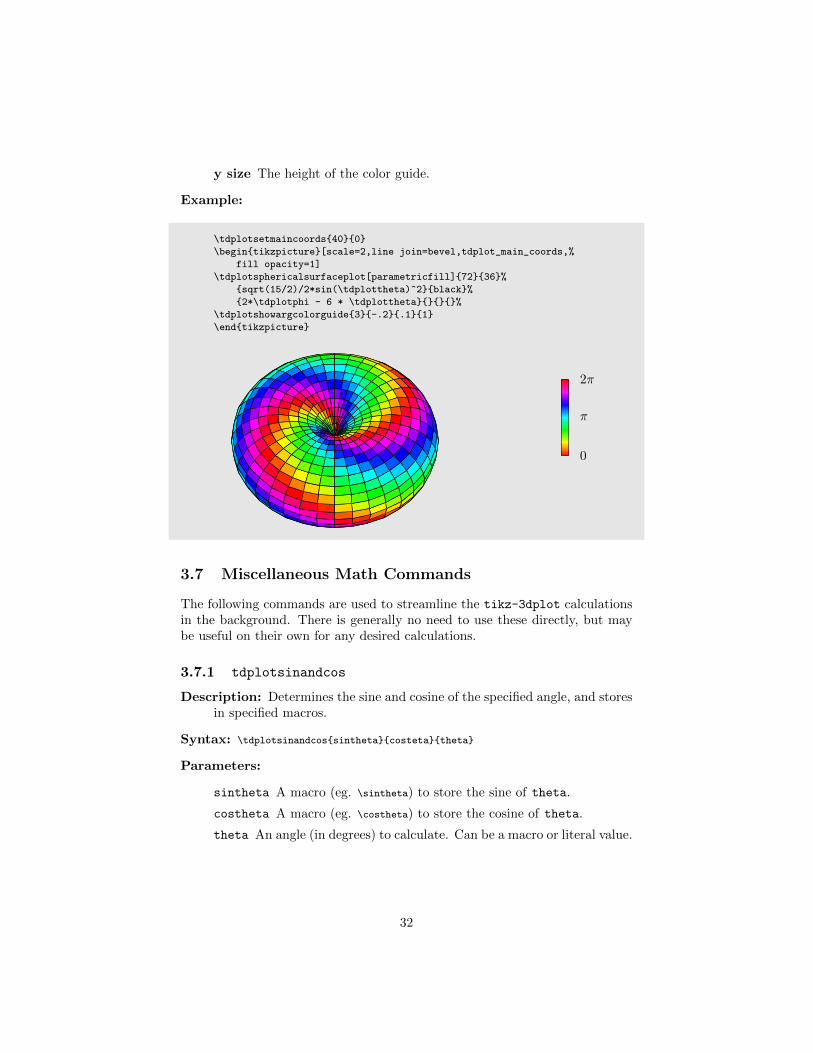
3.6.5 The tdplotshowargcolorguide Command
Description: Draws a “color guide” table which associates the hue of a para-metric polar plot with an angle. Guide is drawn at user-specified screencoordinates with user-specified size. This guide is intended to illustratethe complex phase representation of the surface for a given θ and φ co-ordinate.
Syntax: \tdplotshowargcolorguide{x position}{y position}{x size}{y size}
Parameters:
x position The x screen coordinate to place the lower-left corner of theguide.
y position The y screen coordinate to place the lower-left corner of theguide.
x size The width of the color guide.
31
y size The height of the color guide.
Example:
\tdplotsetmaincoords{40}{0}
\begin{tikzpicture}[scale=2,line join=bevel,tdplot_main_coords,%
fill opacity=1]
\tdplotsphericalsurfaceplot[parametricfill]{72}{36}%
{sqrt(15/2)/2*sin(\tdplottheta)^2}{black}%
{2*\tdplotphi - 6 * \tdplottheta}{}{}{}%
\tdplotshowargcolorguide{3}{-.2}{.1}{1}
\end{tikzpicture}
0
2π
π
3.7 Miscellaneous Math Commands
The following commands are used to streamline the tikz-3dplot calculationsin the background. There is generally no need to use these directly, but maybe useful on their own for any desired calculations.
3.7.1 tdplotsinandcos
Description: Determines the sine and cosine of the specified angle, and storesin specified macros.
Syntax: \tdplotsinandcos{sintheta}{costeta}{theta}
Parameters:
sintheta A macro (eg. \sintheta) to store the sine of theta.
costheta A macro (eg. \costheta) to store the cosine of theta.
theta An angle (in degrees) to calculate. Can be a macro or literal value.
32
3.7.2 tdplotmult
Description: Determines the product of two specified values, and stores theresult in the specified macro.
Syntax: \tdplotmult{result}{multiplicand}{multiplicator}
Parameters:
result A macro (eg. \result) to store the product of multiplicand *
multiplicator.
multiplicand The multiplicand of the product. Can be a macro orliteral value.
multiplicator The multiplicator of the product. Can be a macro orliteral value.
3.7.3 tdplotdiv
Description: Determines the quotient of two specified values, and stores theresult in the specified macro.
Syntax: \tdplotdiv{result}{dividend}{divisor}
Parameters:
result A macro (eg. \result) to store the quotient of dividend /
divisor.
dividend The dividend of the quotient. Can be a macro or literal value.
divisor The divisor of the quotient. Can be a macro or literal value.
33
Chapter 4
Known Issues
There are various issues that have been found while developing the tikz-3dplotpackage. Some of these are currently open problems which will hopefully beresolved. Feedback and suggestions are welcome.
4.1 Predefined Points Don’t Work in Rotated Frame
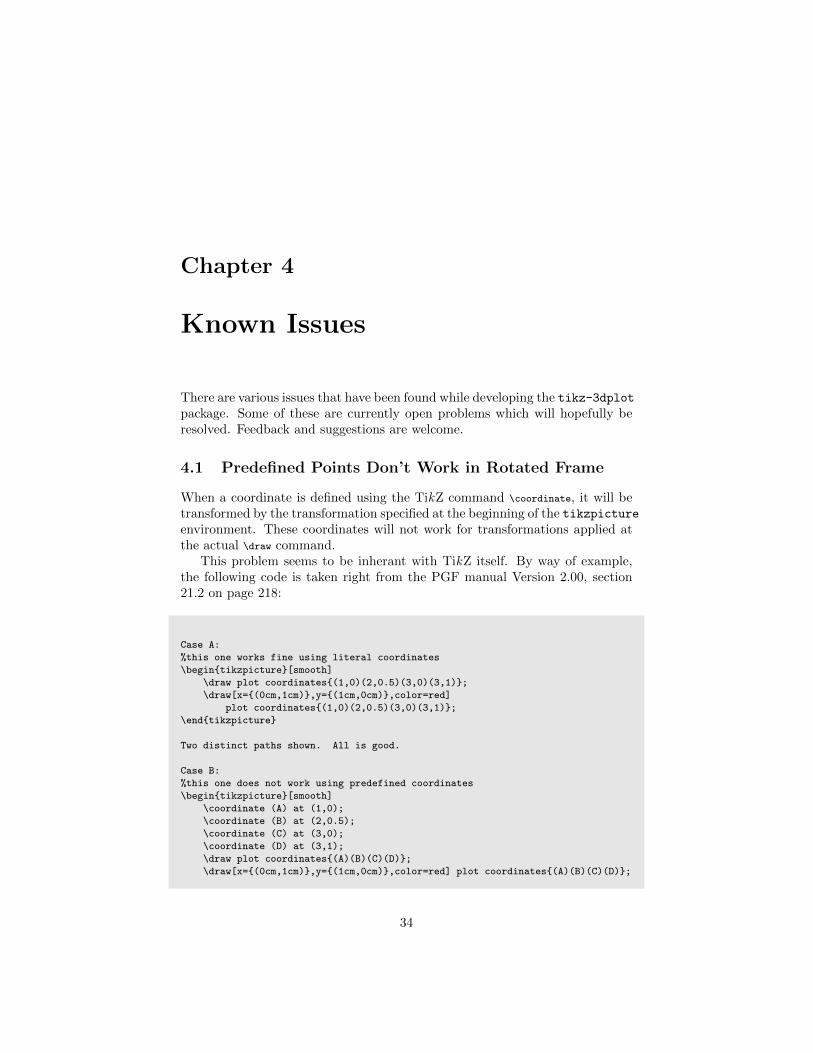
When a coordinate is defined using the TikZ command \coordinate, it will betransformed by the transformation specified at the beginning of the tikzpictureenvironment. These coordinates will not work for transformations applied atthe actual \draw command.
This problem seems to be inherant with TikZ itself. By way of example,the following code is taken right from the PGF manual Version 2.00, section21.2 on page 218:
Case A:
%this one works fine using literal coordinates
\begin{tikzpicture}[smooth]
\draw plot coordinates{(1,0)(2,0.5)(3,0)(3,1)};
\draw[x={(0cm,1cm)},y={(1cm,0cm)},color=red]
plot coordinates{(1,0)(2,0.5)(3,0)(3,1)};
\end{tikzpicture}
Two distinct paths shown. All is good.
Case B:
%this one does not work using predefined coordinates
\begin{tikzpicture}[smooth]
\coordinate (A) at (1,0);
\coordinate (B) at (2,0.5);
\coordinate (C) at (3,0);
\coordinate (D) at (3,1);
\draw plot coordinates{(A)(B)(C)(D)};
\draw[x={(0cm,1cm)},y={(1cm,0cm)},color=red] plot coordinates{(A)(B)(C)(D)};
34
\end{tikzpicture}
Both paths draw overtop each other, and the coordinates are not transformed!
Case A:Two distinct paths shown. All is good.
Case B:Both paths draw overtop each other, and the coordinates are not trans-
formed!
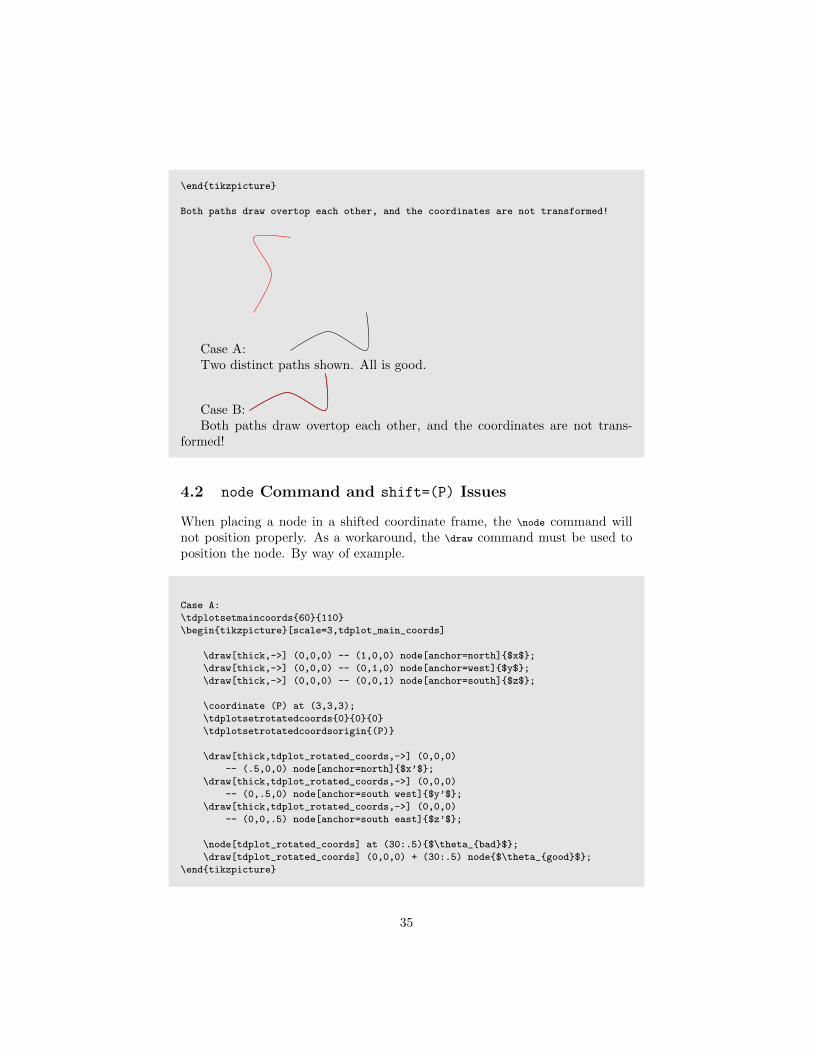
4.2 node Command and shift=(P) Issues
When placing a node in a shifted coordinate frame, the \node command willnot position properly. As a workaround, the \draw command must be used toposition the node. By way of example.
Case A:
\tdplotsetmaincoords{60}{110}
\begin{tikzpicture}[scale=3,tdplot_main_coords]
\draw[thick,->] (0,0,0) -- (1,0,0) node[anchor=north]{$x$};
\draw[thick,->] (0,0,0) -- (0,1,0) node[anchor=west]{$y$};
\draw[thick,->] (0,0,0) -- (0,0,1) node[anchor=south]{$z$};
\coordinate (P) at (3,3,3);
\tdplotsetrotatedcoords{0}{0}{0}
\tdplotsetrotatedcoordsorigin{(P)}
\draw[thick,tdplot_rotated_coords,->] (0,0,0)
-- (.5,0,0) node[anchor=north]{$x’$};
\draw[thick,tdplot_rotated_coords,->] (0,0,0)
-- (0,.5,0) node[anchor=south west]{$y’$};
\draw[thick,tdplot_rotated_coords,->] (0,0,0)
-- (0,0,.5) node[anchor=south east]{$z’$};
\node[tdplot_rotated_coords] at (30:.5){$\theta_{bad}$};
\draw[tdplot_rotated_coords] (0,0,0) + (30:.5) node{$\theta_{good}$};
\end{tikzpicture}
35
Here, the rotated coordinate frame is shifted by amount (P) within the main%
coordinate frame. The node labelled $\theta_{bad}$ does not accept any%
positioning coordinates.
Case B:
\tdplotsetmaincoords{60}{110}
\begin{tikzpicture}[scale=3,tdplot_main_coords]
\draw[thick,->] (0,0,0) -- (1,0,0) node[anchor=north]{$x$};
\draw[thick,->] (0,0,0) -- (0,1,0) node[anchor=west]{$y$};
\draw[thick,->] (0,0,0) -- (0,0,1) node[anchor=south]{$z$};
% \coordinate (P) at (3,3,3);
\tdplotsetrotatedcoords{0}{0}{0}
% \tdplotsetrotatedcoordsorigin{(P)}
\draw[thick,tdplot_rotated_coords,->] (0,0,0)
-- (.5,0,0) node[anchor=north]{$x’$};
\draw[thick,tdplot_rotated_coords,->] (0,0,0)
-- (0,.5,0) node[anchor=south west]{$y’$};
\draw[thick,tdplot_rotated_coords,->] (0,0,0)
-- (0,0,.5) node[anchor=south east]{$z’$};
\node[tdplot_rotated_coords] at (30:.5){$\theta_{bad}$};
\draw[tdplot_rotated_coords] (0,0,0) + (30:.5) node{$\theta_{good}$};
\end{tikzpicture}
Here, the shift is removed from the rotated coordinate frame. The %
previously failing \verb|\node| command works properly.
Case A: x
y
z
x′
y′
z′
θbad
θgood
Here, the rotated coordinate frame is shifted by amount (P) within themain coordinate frame. The node labelled θbad does not accept any positioningcoordinates.
36
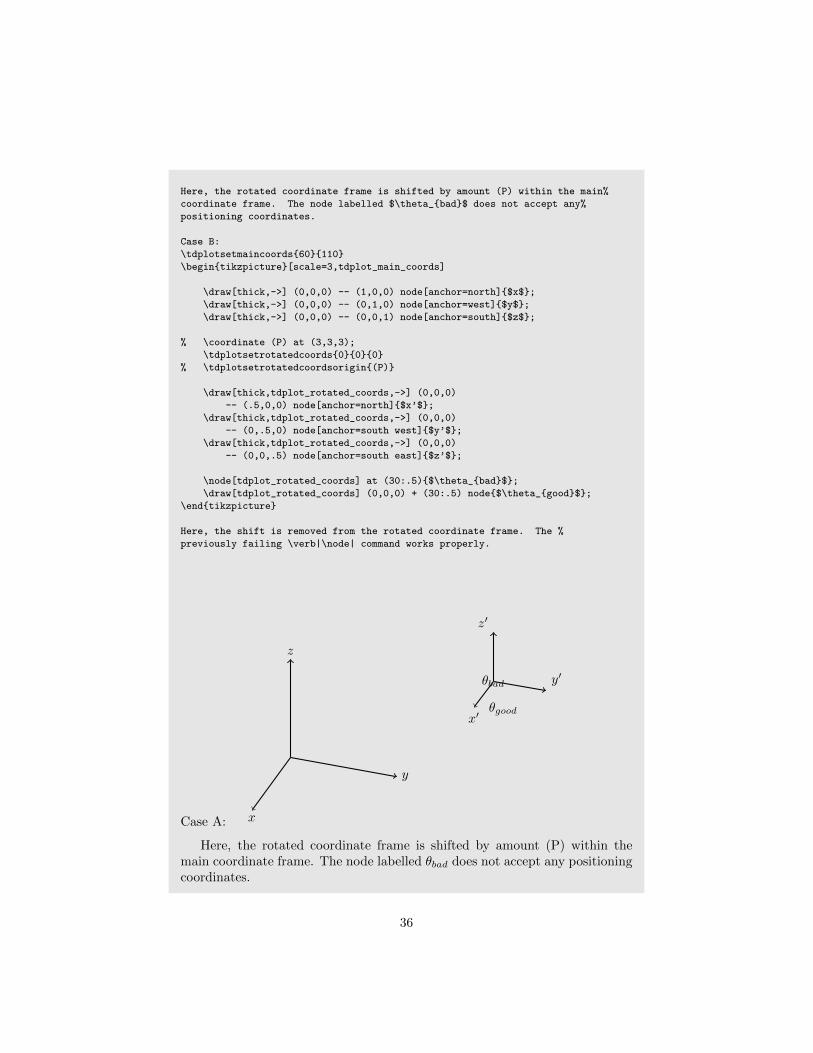
Case B: x
y
z
x′
y′
z′
θbadθgood
Here, the shift is removed from the rotated coordinate frame. The previ-ously failing \node command works properly.
4.3 PGF xyz spherical Coordinate System
I have recently heard about the xyz spherical coordinate system offered byPGF. Unfortunately, when I try to use it, I get compile errors. I haven’t spentmuch time looking into it though, so I’m probably just doing something silly.
\draw[-stealth,color=orange] (0,0,0)
-- (xyz spherical cs:radius=.5,longitude=60,latitude=120);
%this gives the following compile error using MikTeX 2.8:
% Undefined control sequence. <argument> \tikz@cs@radius.
37
Chapter 5
TODO list
This chapter contains notes and jots of ideas of things to do which can expandor improve the tikz-3dplotpackage.
• Figure out how to work in a variable scope that doesn’t interfere withother packages.
• Find a way to check if TikZ is loaded, and give a compile error if necessary.
• Find a way to use predefined coordinates in rotated or translated coor-dinate frames, instead of just literal coordinates.
• Generalize matrix math if such a package exists.
• Look into using TikZ spherical polar coordinates explicitly to streamlinecoordinate definitions.
• Find a way to extract coordinate components defined by the \coordinate
command and use them in macros defined by the \pgfmathsetmacro and\pgfmathparse commands.
38