
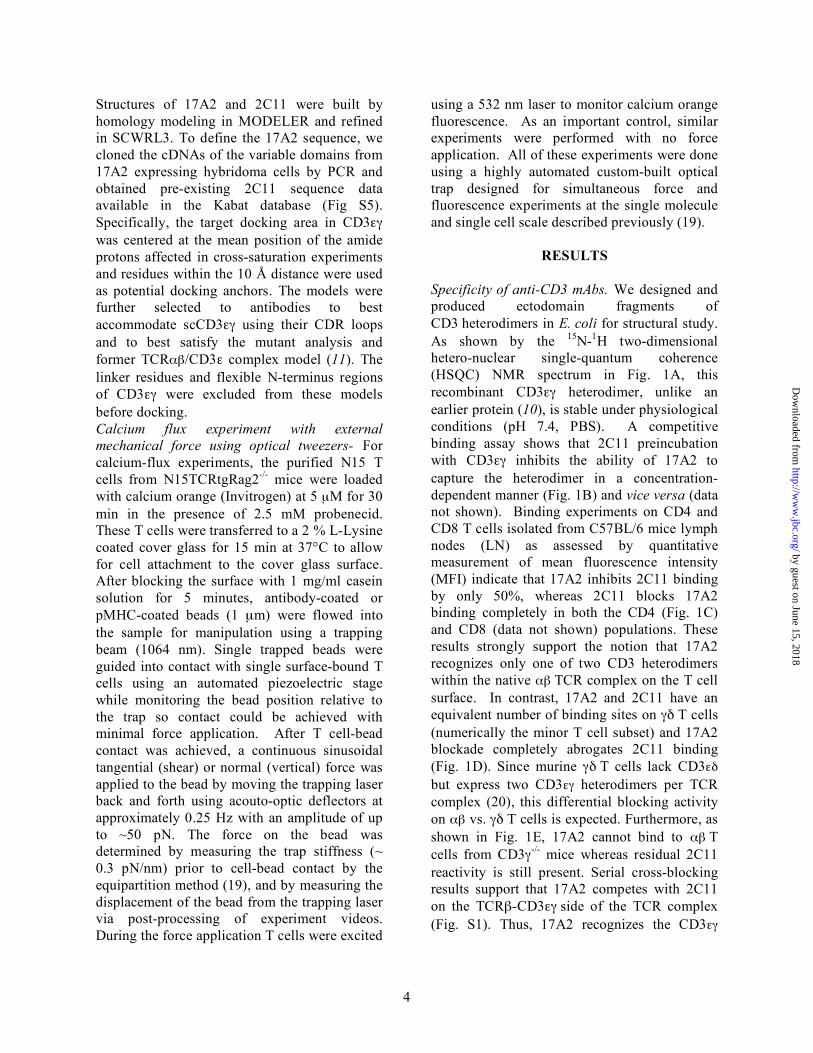
THE αβ T CELL RECEPTOR IS AN ANISOTROPIC … αβ T CELL RECEPTOR IS AN ANISOTROPIC MECHANOSENSOR...
18
1 THE αβ T CELL RECEPTOR IS AN ANISOTROPIC MECHANOSENSOR Sun Taek Kim 1 , Koh Takeuchi 2 , Zhen-Yu J. Sun 2 , Maki Touma 1 , Carlos E. Castro 3 , Amr Fahmy 2 , Matthew J. Lang 3, 4 , Gerhard Wagner 2 and Ellis L. Reinherz 1 1 Laboratory of Immunobiology and Department of Medical Oncology, Dana-Farber Cancer Institute and Departments of Medicine and 2 Biological Chemistry and Molecular Pharmacology, Harvard Medical School, Boston, MA 02115, USA, Departments of 3 Mechanical Engineering and 4 Biological Engineering, Massachusetts Institute of Technology, Cambridge, MA 02139, USA Running Title: TCR Quaternary change and signaling Address correspondence to: Ellis L. Reinherz, MD, 77 Avenue Louis Pasteur, HIM #419, Boston, MA 02115, Email: [email protected]; TEL: 617-632-3412; FAX: 617-632-3351 Thymus-derived lymphocytes protect mammalian hosts against virus- or cancer- related cellular alterations through immune surveillance, eliminating diseased cells. In this process, T cell receptors (TCRs) mediate both recognition and T cell activation via their dimeric αβ , CD3εγ , CD3εδ and CD3ζζ subunits using an unknown structural mechanism. Here, site-specific binding topology of anti-CD3 monoclonal antibodies (mAbs) and dynamic TCR quaternary change provide key clues. Agonist mAbs footprint to the membrane distal CD3ε lobe which they approach diagonally, adjacent to the lever-like Cβ FG loop that facilitates antigen (pMHC)-triggered activation. In contrast, a non-agonist mAb binds to the cleft between CD3ε and CD3γ in a perpendicular mode and is stimulatory only subsequent to an external tangential but not a normal force (~50 pN) applied via optical tweezers. Specific pMHC but not irrelevant pMHC activates a T cell upon application of a similar force. These findings suggest that the TCR is an anisotropic mechanosensor, converting mechanical energy into a biochemical signal upon specific pMHC ligation during immune surveillance. Activating anti-CD3 mAbs mimic this force via their intrinsic binding mode. A common TCR quaternary change rather than conformational alterations can better facilitate structural signal initiation, given the vast array of TCRs and their specific pMHC ligands. The T cell receptor (TCR) is a multimeric transmembrane complex composed of a disulfide-linked antigen binding clonotypic heterodimer (αβ or γδ) in non-covalent association with the signal-transducing CD3 subunits (CD3εγ, CD3εδ and CD3ζζ) (reviewed in (1)). TCR signaling via CD3 dimers evokes T cell lineage commitment and repertoire selection during development, maintains the peripheral T cell pool, and further differentiates naïve T cells into effector or memory cell populations upon immune stimulation (2-5). The interaction between an Fab-like αβ TCR heterodimer and an antigenic peptide bound to a major histocompatibility complex molecule (pMHC) initiates a cascade of downstream signaling events via the immunoreceptor tyrosine-based activation motif (ITAM) elements in the cytoplasmic tails of the associated CD3 subunits (6-9). The length of these CD3 cytoplasmic tails is substantial, relative to those of the TCR α and β chains (6,7). How recognition of pMHC by a weakly interacting (~1-100 μM K d ) clonotypic heterodimer on the T cell surface evokes intracellular signaling via the adjacent CD3 components remains undefined (1). Solution structures of CD3εγ and CD3εδ heterodimers reveal a unique side-to-side hydrophobic interface with conjoined β-sheets involving the G-strands of the two Ig-like ectodomains of the pair (10,11). The squat and rigid CD3 connecting segments contrast sharply with the long and flexible TCR α and β connecting peptides linking their respective constant domains to the transmembrane segments. To investigate the basis of signal transduction involving the ectodomain components within the TCR membrane complex, we have focused on three anti-CD3ε mAbs (2C11, 500A2 and 17A2) and mapped those interactions using NMR techniques. We present detailed information on antibody recognition sites on surfaces of these T cell elements, http://www.jbc.org/cgi/doi/10.1074/jbc.M109.052712 The latest version is at JBC Papers in Press. Published on September 15, 2009 as Manuscript M109.052712 Copyright 2009 by The American Society for Biochemistry and Molecular Biology, Inc. by guest on June 15, 2018 http://www.jbc.org/ Downloaded from
Transcript of THE αβ T CELL RECEPTOR IS AN ANISOTROPIC … αβ T CELL RECEPTOR IS AN ANISOTROPIC MECHANOSENSOR...
1
THE αβ T CELL RECEPTOR IS AN ANISOTROPIC MECHANOSENSOR Sun Taek Kim1, Koh Takeuchi2, Zhen-Yu J. Sun2, Maki Touma1, Carlos E. Castro3, Amr Fahmy2,
Matthew J. Lang3, 4, Gerhard Wagner2 and Ellis L. Reinherz1 1Laboratory of Immunobiology and Department of Medical Oncology, Dana-Farber Cancer Institute and
Departments of Medicine and 2Biological Chemistry and Molecular Pharmacology, Harvard Medical School, Boston, MA 02115, USA, Departments of 3Mechanical Engineering and 4Biological Engineering,
Massachusetts Institute of Technology, Cambridge, MA 02139, USA Running Title: TCR Quaternary change and signaling
Address correspondence to: Ellis L. Reinherz, MD, 77 Avenue Louis Pasteur, HIM #419, Boston, MA 02115, Email: [email protected]; TEL: 617-632-3412; FAX: 617-632-3351
Thymus-derived lymphocytes protect mammalian hosts against virus- or cancer-related cellular alterations through immune surveillance, eliminating diseased cells. In this process, T cell receptors (TCRs) mediate both recognition and T cell activation via their dimeric αβ , CD3εγ, CD3εδ and CD3ζζ subunits using an unknown structural mechanism. Here, site-specific binding topology of anti-CD3 monoclonal antibodies (mAbs) and dynamic TCR quaternary change provide key clues. Agonist mAbs footprint to the membrane distal CD3ε lobe which they approach diagonally, adjacent to the lever-like Cβ FG loop that facilitates antigen (pMHC)-triggered activation. In contrast, a non-agonist mAb binds to the cleft between CD3ε and CD3γ in a perpendicular mode and is stimulatory only subsequent to an external tangential but not a normal force (~50 pN) applied via optical tweezers. Specific pMHC but not irrelevant pMHC activates a T cell upon application of a similar force. These findings suggest that the TCR is an anisotropic mechanosensor, converting mechanical energy into a biochemical signal upon specific pMHC ligation during immune surveillance. Activating anti-CD3 mAbs mimic this force via their intrinsic binding mode. A common TCR quaternary change rather than conformational alterations can better facilitate structural signal initiation, given the vast array of TCRs and their specific pMHC ligands.
The T cell receptor (TCR) is a multimeric transmembrane complex composed of a disulfide-linked antigen binding clonotypic heterodimer (αβ or γδ) in non-covalent association with the signal-transducing CD3
subunits (CD3εγ, CD3εδ and CD3ζζ) (reviewed in (1)). TCR signaling via CD3 dimers evokes T cell lineage commitment and repertoire selection during development, maintains the peripheral T cell pool, and further differentiates naïve T cells into effector or memory cell populations upon immune stimulation (2-5). The interaction between an Fab-like αβ TCR heterodimer and an antigenic peptide bound to a major histocompatibility complex molecule (pMHC) initiates a cascade of downstream signaling events via the immunoreceptor tyrosine-based activation motif (ITAM) elements in the cytoplasmic tails of the associated CD3 subunits (6-9). The length of these CD3 cytoplasmic tails is substantial, relative to those of the TCR α and β chains (6,7).
How recognition of pMHC by a weakly interacting (~1-100 µM Kd) clonotypic heterodimer on the T cell surface evokes intracellular signaling via the adjacent CD3 components remains undefined (1). Solution structures of CD3εγ and CD3εδ heterodimers reveal a unique side-to-side hydrophobic interface with conjoined β-sheets involving the G-strands of the two Ig-like ectodomains of the pair (10,11). The squat and rigid CD3 connecting segments contrast sharply with the long and flexible TCR α and β connecting peptides linking their respective constant domains to the transmembrane segments.
To investigate the basis of signal transduction involving the ectodomain components within the TCR membrane complex, we have focused on three anti-CD3ε mAbs (2C11, 500A2 and 17A2) and mapped those interactions using NMR techniques. We present detailed information on antibody recognition sites on surfaces of these T cell elements,
http://www.jbc.org/cgi/doi/10.1074/jbc.M109.052712The latest version is at JBC Papers in Press. Published on September 15, 2009 as Manuscript M109.052712
Copyright 2009 by The American Society for Biochemistry and Molecular Biology, Inc.
by guest on June 15, 2018http://w
ww
.jbc.org/D
ownloaded from
2
revealing surfaces not engaged in interactions with the αβ or γδ heterodimer. We characterize the functional consequences of their binding on αβ and γδ T cells. TCR triggering is not linked to mAb affinity or CD3 binding stoichiometry per TCR. Rather, our results emphasize the critical role of the TCR β-CD3εγ module in αβ T cells, reveal a rationale for site-specific binding topology essential for anti-CD3 mAb-induced signaling, and demonstrate that a dynamic αβ TCR complex quaternary structure is essential for T cell activation by pMHC ligands. In this regard, an external torque on the TCR complex following pMHC ligation during T cell scanning of antigen presenting cells (APCs) can serve as the source of energy for directional force, defining the TCR as a mechanosensor.
Experimental Procedures Construction and Expression of an scCD3εγ Heterodimer- The scCD3εγ construct encoding a murine CD3γ fragment (residue ID 23 to 103 of Swiss-Prot P11942), a 26 residue flexible linker, and a murine CD3ε fragment (residue ID 22 to 100 of Swiss-Prot P22646) was cloned into a pET11a expression vector (New England BioLabs Inc.). Recombinant CD3εγ was produced as inclusion bodies in E. coli BL21 (DE3) and dissolved in 6 M GnHCl as described (11). Refolding efficiency in eight different conditions was monitored by 17A2 binding via surface plasmon resonance and confirmed by gel filtration chromatography. The optimal refolding buffer contained 55 mM MES pH 6.5, 264 mM NaCl, 11 mM KCl, 2.2 mM MgCl2, 2.2 mM CaCl2, 440 mM sucrose, 0.1 mM reduced glutathione, 1 mM oxidized glutathione, and 0.5 X complete protease inhibitor cocktail (Roche Applied Sciences, Indianapolis, IN). Soluble and monomeric CD3 proteins were purified by gel filtration on a Superdex-75. Antibodies and Flow Cytometric Analysis- The following fluorochrome labeled mAbs were used for surface receptor analysis by flow cytometry: FITC-anti-CD3 (2C11) and Alexa647-anti-CD3 (17A2), Pacific Blue-CD4 (H129.19), pacific orange anti-CD8α (53-6.7), FITC-conjugated
anti-TCR Cβ (H57), PE-Cy7-conjugated anti-CD69 (H1.2F3), APC-conjugated anti-CD5 (53-
7.3) (BD Pharmingen). For flow cytometry, single-cell suspensions of thymocytes or LN cells were prepared at 5 x 10⁶ cells/ml in PBS
containing 2% FCS and 0.05% NaN3. Those cells were triple or five-color stained with the Abs at saturating concentrations according to standard procedures. The phosphorylation state of ERK (Alexa647-anti-pERK) or MAPK (PE-anti-pMAPK) was determined by intracellular staining using BD Phosflow Lyse/Fix buffer BD and Phosflow Perm Buffer III after incubation with the immobilized anti-CD3 mAb. A FACScan or FACSAria (BD Biosciences) was used for flow cytometric measurements. Data analysis was performed using FlowJo software (Tree Star) after excluding dead cells by forward and side scatter gating. Measured F/P ratios for FITC-labeled 17A2 and 2C11 mAbs are 2.89 and 2.96, respectively. Antibody Purification and Fab Preparation- The hybridoma cell lines expressing 17A2 (from R. MacDonald, Switzerland), 2C11 and 500A2 were used for antibody production (See Fig. S5 for the sequences of the variable regions). Each mAb was purified from culture supernatant using Gammabind plus Sepharose Fast Flow chromatography (Amersham Pharmacia). After concentration using centrifugal filter devices with a 10 kDa molecular-weight cut-off (Millipore), gel filtration using Superdex-75 (Amersham Pharmacia) was performed for further purification and buffer change. Antibody fragments, Fabs, were generated using an Immunopure® Fab Preparation Kit following the manufacture’s instructions (Pierce). An additional Superdex-75 gel filtration was performed followed by concentration. Mice- C57BL/6 and TCRβ-/- mice were purchased from Taconic (Germanton, NY) and Jackson laboratory, respectively. CD3γ-/- mice have been described in detail elsewhere (12). N15 TCR transgenic (tg) mice on the RAG2-/- background bear T cells with a TCR specific for a vesicular stomatitis virus nuclear protein octapeptide (VSV8, RGYVYQGL) bound to the H-2Kb molecule (13). Mice were maintained and bred under specific pathogen-free conditions in the animal facility of the Dana-Farber Cancer Institute under a protocol reviewed and approved by the Animal Care and Use Committee.
by guest on June 15, 2018http://w
ww
.jbc.org/D
ownloaded from
3
Cell Purification- For γδ T cells purification, lymph node (LN) cells from TCRβ-/- mice were stained for 20 min on ice with a panel of PE-labeled mAbs containing anti-B220, anti-TCRβ, anti-CD4, anti-CD8, and DX5 mAbs. Cells were washed and then negatively sorted by a FACSAria (BD Biosciences). Following separation, γδ T cells from TCRβ-/- mice were about 80% pure, with no detectable contamination from γδ TCR- CD3+ cells. For αβ T cell purification, LN cells from C57BL/6 mice were stained with anti-B220-FITC, pacific blue-CD4 and pacific orange anti-CD8α, washed, and then separated on a FACSAria. CD4 T cells or CD8 T cells were more than 90% pure upon reanalysis. N15 T cells were purified by removing I-Ab positive cells using anti-I-Ab and magnetic beads from N15TCRtgRag2-/- mice. All LN cells from C57BL/6 and N15TCRtg Rag2-/- mice were used immediately after purification and without prior stimulation (i.e. naïve T cells) unless specifically indicated otherwise. Antibody and pMHC-coated Beads- For in vitro stimulation, 17A2, 2C11, or 500A2 was covalently immobilized on protein G-coupled dynabeads (Invitrogen). Antibody-coated beads were resuspended in freshly made 5 mM disuccinimidyl suberate (Pierce) for covalent cross linking followed by removing free antibody. 17A2, 2C11 and H35 (anti-CD8β) mAbs labeled using Alexa555 dye (Invitrogen) with equivalent molar ratio ([Alexa555]/[mAb] = ~1) on protein G-coupled polystyrene beads (1 µm diameter, Polysciences) were immobilized as above. H-2Kb and β2m protein expression, refolding, and purification were as described in detail (14). Preparation of H-2Kb with a biotinylation tag (GGGLNDIFEAQKIEWH) for birA enzymatic recognition at the C-terminus was previously described (15). Each biotinylated H-2Kb complex was used for incubations with streptavidin-coupled polystyrene beads (1 µm diameter, Polysciences) after Alexa555 labeling with an equivalent molar ratio ([Alexa555]/[H-2Kb] = ~1). Calcium Flux- For calcium-flux experiments, the T cells were loaded with Fluo-4AM (Molecular Probes) at 5 µM for 30 min in the presence of 2.5 mM probenecid. T cells were
transferred to minimal imaging media (MIM, colorless RPMI with 5 % FCS and 10 mM HEPES) and allowed to adhere to a 2% L-Lysine coated cover glass for 30 min at 37°C before data collection. Recordings were made with a Nikon TE2000-U inverted microscope under temperature control. Fluo-4 was imaged at 30 sec intervals for 10 min. All the samples were incubated in the imaging chambers at 37°C for 5 min before data collection. We quantified Fluo-4 responses by determining the average intensity of a region within each cell as a function of time using the Image J program (NIH). NMR Experiments- All NMR spectra were acquired on a Bruker Avance750 or Avance600 spectrometer equipped with a 5 mm cryogenic probe. Unbound CD3εγ or the CD3εγ/17A2, 2C11 Fab complex was dissolved in 10 mM phosphate buffer (pH 6.8), containing 100 mM NaCl at a concentration of 0.5-1 mM. All NMR experiments are performed at 298K. 15N-1H heteronuclear single quantum correlation experiments (HSQCs) using transverse relaxation optimization spectroscopy (TROSY) techniques were performed. Resonance assignments for unbound scCD3εγ were already established in previous studies (10) and were repeated for the new sCD3εγ construct. Native conformation was confirmed by its identity in long-range amide-amide patterns with the former construct. The bound CD3εγ assignments are determined by conventional 3D NMR spectroscopy with TROSY techniques (16), for comparison with the free assignments. Data were analyzed with XWINNMR (Bruker) and SPARKY (T.D. Goddard and D.G. Kneller, SPARKY 3, University of California, San Francisco). The binding surfaces of CD3εγ for Fabs were mapped with cross-saturation experiments following established protocols in the solvent (20% H2O / 80% D2O) (17). The saturation period was set to 0.5 sec in all CD3εγ/Fab complexes. Modeling Antibody Binding to the TCR Complex- We searched for plausible docking models for the CD3εγ/antibody complex using TREEDOCK software (18) while incorporating known experimental results. The coordinates were taken from the most representative NMR structures of scCD3εγ (PDB ID code 1JBJ).
by guest on June 15, 2018http://w
ww
.jbc.org/D
ownloaded from
4
Structures of 17A2 and 2C11 were built by homology modeling in MODELER and refined in SCWRL3. To define the 17A2 sequence, we cloned the cDNAs of the variable domains from 17A2 expressing hybridoma cells by PCR and obtained pre-existing 2C11 sequence data available in the Kabat database (Fig S5). Specifically, the target docking area in CD3εγ was centered at the mean position of the amide protons affected in cross-saturation experiments and residues within the 10 Å distance were used as potential docking anchors. The models were further selected to antibodies to best accommodate scCD3εγ using their CDR loops and to best satisfy the mutant analysis and former TCRαβ/CD3ε complex model (11). The linker residues and flexible N-terminus regions of CD3εγ were excluded from these models before docking. Calcium flux experiment with external mechanical force using optical tweezers- For calcium-flux experiments, the purified N15 T cells from N15TCRtgRag2-/- mice were loaded with calcium orange (Invitrogen) at 5 µM for 30 min in the presence of 2.5 mM probenecid. These T cells were transferred to a 2 % L-Lysine coated cover glass for 15 min at 37°C to allow for cell attachment to the cover glass surface. After blocking the surface with 1 mg/ml casein solution for 5 minutes, antibody-coated or pMHC-coated beads (1 µm) were flowed into the sample for manipulation using a trapping beam (1064 nm). Single trapped beads were guided into contact with single surface-bound T cells using an automated piezoelectric stage while monitoring the bead position relative to the trap so contact could be achieved with minimal force application. After T cell-bead contact was achieved, a continuous sinusoidal tangential (shear) or normal (vertical) force was applied to the bead by moving the trapping laser back and forth using acouto-optic deflectors at approximately 0.25 Hz with an amplitude of up to ~50 pN. The force on the bead was determined by measuring the trap stiffness (~ 0.3 pN/nm) prior to cell-bead contact by the equipartition method (19), and by measuring the displacement of the bead from the trapping laser via post-processing of experiment videos. During the force application T cells were excited
using a 532 nm laser to monitor calcium orange fluorescence. As an important control, similar experiments were performed with no force application. All of these experiments were done using a highly automated custom-built optical trap designed for simultaneous force and fluorescence experiments at the single molecule and single cell scale described previously (19).
RESULTS Specificity of anti-CD3 mAbs. We designed and produced ectodomain fragments of CD3 heterodimers in E. coli for structural study. As shown by the 15N-1H two-dimensional hetero-nuclear single-quantum coherence (HSQC) NMR spectrum in Fig. 1A, this recombinant CD3εγ heterodimer, unlike an earlier protein (10), is stable under physiological conditions (pH 7.4, PBS). A competitive binding assay shows that 2C11 preincubation with CD3εγ inhibits the ability of 17A2 to capture the heterodimer in a concentration-dependent manner (Fig. 1B) and vice versa (data not shown). Binding experiments on CD4 and CD8 T cells isolated from C57BL/6 mice lymph nodes (LN) as assessed by quantitative measurement of mean fluorescence intensity (MFI) indicate that 17A2 inhibits 2C11 binding by only 50%, whereas 2C11 blocks 17A2 binding completely in both the CD4 (Fig. 1C) and CD8 (data not shown) populations. These results strongly support the notion that 17A2 recognizes only one of two CD3 heterodimers within the native αβ TCR complex on the T cell surface. In contrast, 17A2 and 2C11 have an equivalent number of binding sites on γδ T cells (numerically the minor T cell subset) and 17A2 blockade completely abrogates 2C11 binding (Fig. 1D). Since murine γδ T cells lack CD3εδ but express two CD3εγ heterodimers per TCR complex (20), this differential blocking activity on αβ vs. γδ T cells is expected. Furthermore, as shown in Fig. 1E, 17A2 cannot bind to αβ T cells from CD3γ-/- mice whereas residual 2C11 reactivity is still present. Serial cross-blocking results support that 17A2 competes with 2C11 on the TCRβ-CD3εγ side of the TCR complex (Fig. S1). Thus, 17A2 recognizes the CD3εγ
by guest on June 15, 2018http://w
ww
.jbc.org/D
ownloaded from
5
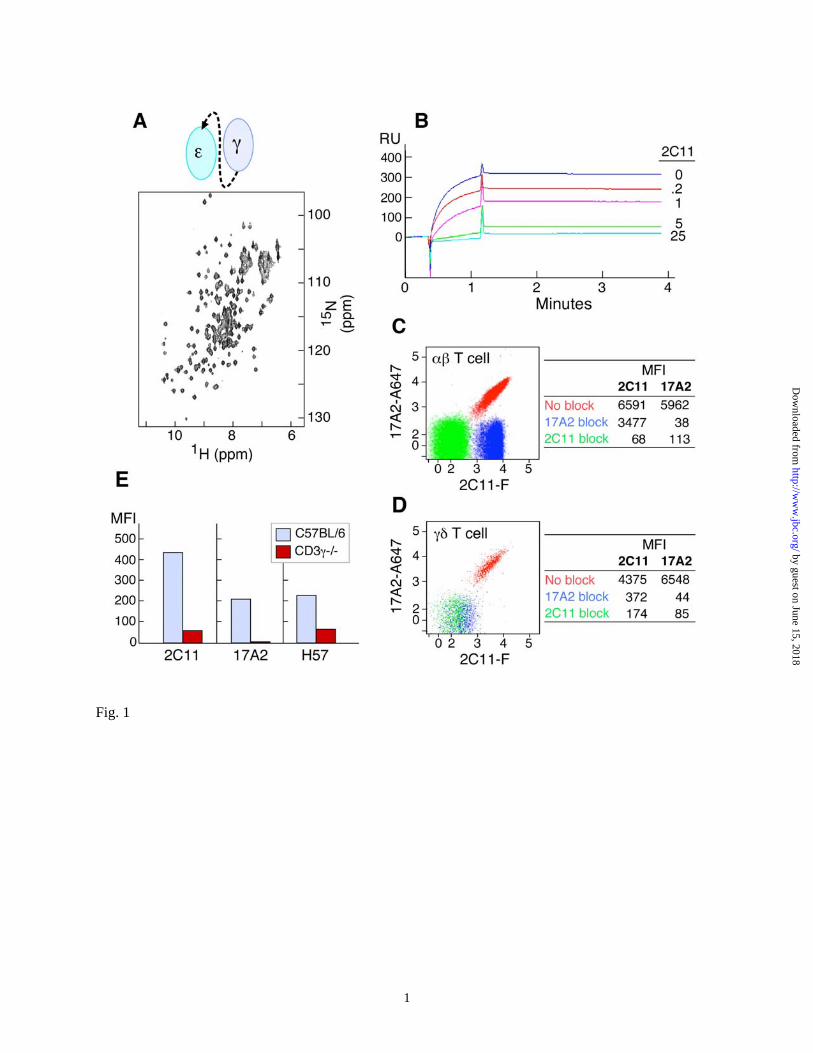
heterodimer but not the CD3εδ heterodimer on the surface of T cells. Differential capacity of anti-CD3 mAbs to activate T cells. We next assessed how 17A2 versus 2C11 mAbs influence T cell activation. Flow cytometric analysis on the αβ TCR-expressing DP (257-20-109) cell line (21), and the γδ TCR expressing B9 cell line (22) indicates that 17A2 and 2C11 binding affinities are similar (Fig. 2A). Moreover, since the fluorescein-labeling ratio of 2C11 and 17A2 mAbs are identical (Fig. S2), it is significant that 2C11 MFI is twice that of 17A2 on the DP cells, consistent with 2C11 binding to CD3ε in both CD3 heterodimers, while 17A2 only binds to CD3εγ. On the other hand, the 2C11 MFI is similar to that of 17A2 on B9 cells, consistent with the known γδ TCR stoichiometry (20). These results enabled us to then directly compare the functional consequence of 17A2 versus 2C11 mAb binding.
To monitor initial T cell activation triggered by 17A2 and 2C11, we measured ERK-phosphorylation at the single cell level using intracellular staining with anti-phospho-ERK antibody and flow cytometry. We immobilized equivalent amounts of 2C11 or 17A2 on protein G-coated magnetic beads (Fig. S2) and measured signaling dynamics in T cell-antibody immobilized bead conjugates. Phosphorylation of ERK is detected upon 2C11-bead stimulation in both αβ TCR+ and γδ TCR+ cells (Fig. 2B). These data regarding the ERK-signaling response to 2C11 are consistent with the highly amplified, digital ERK responses induced by agonist pMHC (23). Similar results were found for MAPK-phosphorylation stimulated by 2C11-beads. In contrast, neither phosphorylation of ERK nor MAPK was detected upon 17A2-bead stimulation (Fig. 2B). The number of antibody binding sites per TCR complex might account for such a functional difference in 2C11 versus 17A2 (2 vs. 1, respectively) in αβ T cells. To test this possibility, comparative analysis was performed using γδ T cells that exclusively incorporate CD3εγ heterodimers into their TCR complex (20). However, as with αβ T cells, ERK/MAPK-phosphorylation in γδ T cells is only induced by 2C11-beads. 500A2-beads, like 2C11-beads,
induce phosphorylation of ERK and MAPK, consistent with their strikingly similar binding behavior on T cells (Fig. S3).
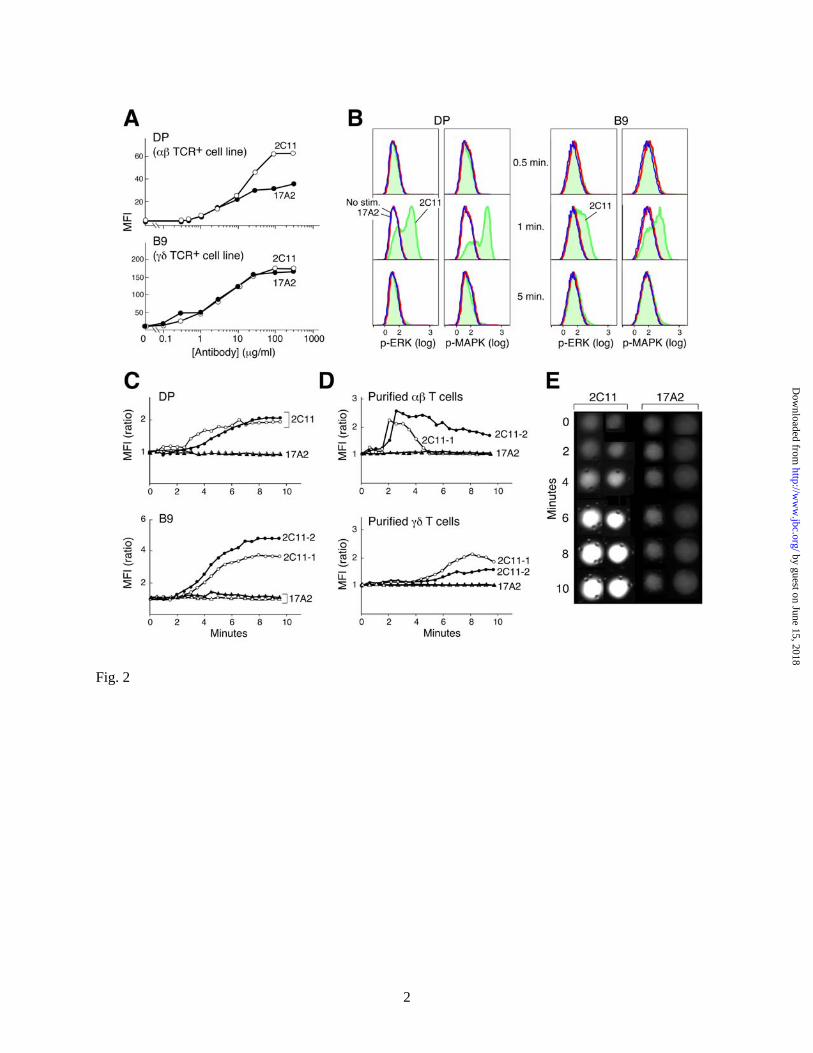
Since TCR signaling is associated with elevations in intracellular-free calcium, the ability of these anti-CD3 mAbs to induce a characteristic intracellular calcium flux was also tested. No detectable calcium flux was induced by 17A2-immobilized beads, but incubation with 2C11 beads triggered a response in αβ and γδ T cell lines as well as LN purified αβ and γδ T cells (Fig. 2C and D); curves are representative of multiple individual cells monitored. Calcium flux is detected after a delay of ~2 minutes, related to the interval required for conjugates to form between a T cell and beads and evident in single cell microscopic analysis (Fig. 2E). NMR cross-saturation analysis maps anti-CD3mAbs to membrane- and interface-distal corners of CD3ε. In the absence of differences in affinity or stoichiometry to explain the distinct functional effects of anti-CD3 mAbs, we performed structural comparison of 17A2 and 2C11 binding sites on the CD3εγ molecule. We established the bound assignment of these Fab/CD3εγ complexes by conventional 3D NMR spectroscopy using TROSY techniques (16). Benefiting from line narrowing due to the TROSY effect and per-deuteration of the CD3εγ molecule, most of the resonances remain sharp and are easily detected even with the relatively large molecular mass of the 71 kD complex. Exceptions are amide groups in close contact with other protons, as happens for certain interface residues juxtaposed to protonated Fabs. Red spheres in Fig. 3A indicate the position of those residues that are not observed in the complex due to this protonated Fab induced relaxation. In addition, we performed cross-saturation NMR experiments (24) to map the complete binding sites of 17A2 and 2C11 on the CD3εγ molecule. In the cross-saturation experiment, irradiation of Fab resonances causes indirect saturation of CD3εγ amide resonances only for those located close in space (<7Å) to the Fab fragment in a complex. The positions of amides (blue spheres) in the CD3εγ molecule that have greatly reduced intensity upon irradiation of Fab resonances (Isat / Iref < 0.5, see
by guest on June 15, 2018http://w
ww
.jbc.org/D
ownloaded from
6
also the signal reductions for each residues in Fig. S4A) or disappeared (red spheres) upon Fab binding are shown. These residues are located around the cleft formed between CD3ε and CD3γ by 17A2 binding (shown as the brown ellipsoid in Fig. 3A, left), while 2C11 binding is centered on the CD3ε-chain (brown circle in Fig. 3A, right). 17A2 and 2C11 have distinct binding sites on CD3εγ with some overlap of CD3ε footprint residues (D26, E27, T64, S67, T71).
To further investigate their distinctive binding modes, we performed theoretical calculations using Treedock (18), after incorporating structural models of their respective Fab variable domains (Fig. S5). The residues proximal to the two Fabs in CD3εγ identified in the cross-saturation experiments were used as candidate anchors for the docked complexes. As illustrated in Fig. 3B, 17A2 Fab binds to CD3εγ in a more upright mode, largely between the CD3ε and CD3γ molecules, while 2C11 binds to the side top "corner" of CD3ε to assume a diagonal orientation. Consistent with the cross-saturation experiment, 17A2 contacts primarily the top end of the GFCC’ face of CD3ε, while it is also close to the N-terminus of the A strand and BC loop, and the top end of FG strand in CD3γ. On the other hand, 2C11 binding involves primarily the C’ strand and the beginning of the C’E loops in CD3ε. The complex models also clearly explain the direct competition between 2C11 and 17A2 for the CD3εγ binding site since they partially overlap with each other, sharing C and C’ strands as well as the end of the F strand in the same CD3ε molecule. The binding site of 500A2 (25), a second activating anti-CD3 mAb, is similar to that of 2C11, being restricted in its interaction with the same top corner of CD3ε as 2C11 (Fig. S6). A molecular model of TCR quaternary topology. Prior models of the αβ TCR complex (11,26) were improved upon by accommodating biochemical and functional data herein (Fig. 3C). This quaternary structure model, constructed by iterative rigid body docking using XPLOR-NIH (27), illustrates the relative orientation between the ectodomains of the N15TCRαβ heterodimer (PDB: 1NFD), CD3εγ (PDB: 1JBJ) and CD3εδ
(PDB:1XMW). As shown in Fig. 3C, the binding sites for 2C11 on CD3ε of the CD3εδ heterodimer and on CD3ε of the CD3εγ heterodimer are both exposed in the TCR complex consistent with our analyses. The CD3ε site of CD3εγ is located in proximity to the TCR Cβ FG loop (Fig. 3C insert), compatible with the direct competition noted between 2C11 Fab and H57 Fab (28) (Fig. S1). Furthermore, binding competition between H57 and heterosera recognizing the N-terminus of CD3γ (29) (Fig. S7) is also consistent with this model. The TCR as a mechanoreceptor: optical tweezer analysis. The data amassed from NMR cross-saturation on murine CD3εγ show that activating anti-CD3 mAbs such as 2C11 and 500A2 bind to the membrane- and interface-distal corner of murine CD3ε in an orthogonal mode. Crystal structures of the human CD3εγ heterodimer complexed with OKT3 (30) and the human CD3εδ heterodimer complexed with UCHT-1(31), two mitogenic anti-human CD3ε mAbs, likewise identify a similar binding architecture.
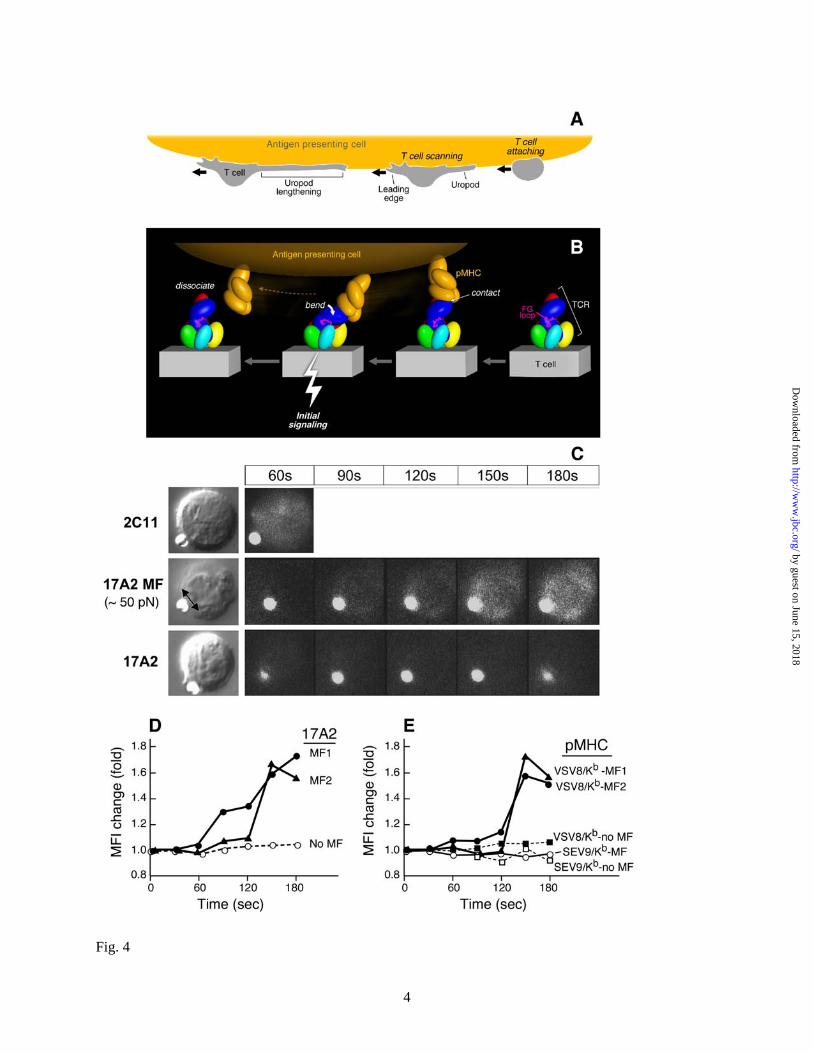
How might this particular binding orientation be stimulatory for human and mouse T cells? Fig. 4A schematically shows that scanning by T cells of APC surfaces in search of a specific pMHC can create a tensile mechanical force prior to transduction of a “stop movement” signal (Fig. 4A). Upon TCR-pMHC ligation, extracellular mechanical torque can result in quaternary structural changes within the TCR complex among the αβ and CD3 heterodimers (Fig. 4B), triggering downstream signaling via ITAMs in the CD3 cytoplasmic tails enhanced by Lck-linked CD4 and CD8 co-receptor function (not shown) during TCR/co-receptor approximation (32). Of note, the exposed TCR β chain constant domain FG loop, known to efficiently facilitate αβ T cell activation (33,34), likely functions as a lever, contributing to antigen-specific signal transfer from the αβ heterodimer to the CD3εγ heterodimer (Fig. 4B, magenta loop). Impairing TCR complex quaternary structure and requisite conformational change, either by addition of the FG loop-specific H57 Fab to antigen-specific T cells (Fig. S8B) or mutations in the adjacent CD3εγ heterodimer ectodomain, blocks specific
by guest on June 15, 2018http://w
ww
.jbc.org/D
ownloaded from
7
pMHC-stimulated cytokine production (data not shown).
In this process, the pMHC may behave as a detachable effort arm of a complex-lever system or "gaff"; its binding is determined by the specificity of an individual TCRαβ heterodimer but is not sufficient to mediate signal transduction per se. An external torque is additionally required to provide the energy for this signaling. Such an off-centered torque might be generated either via a shear force or pressure between opposing APC and T cell membranes. No additional energy costs would be incurred by the T cell during this process since energy expended on immune surveillance is productively channeled into signal transduction upon specific immune recognition. Note that in the view shown in Fig. 4B, scanning and attendant pMHC ligation results in a force on the membrane distal lobe of CD3ε akin to that contacted by activating anti-CD3ε mAbs.
If the distinctive antibody binding modes of 2C11 and 500A2 versus 17A2 account for their differential stimulatory activities, we reasoned that application of an external tangential force via 17A2 to T cells should convert 17A2 into a cellular activator. Thus, we exploited an optical trapping methodology to provide controlled external mechanical force to 17A2, thereby investigating how mAb binding and subsequent torque affect TCR signaling. Optical trapping combined with fluorescence imaging is established as a powerful tool for studying proteins and molecules (35). Here we use ligand, specifically 17A2 mAb -coated beads to probe cell membrane machinery. Strikingly, only after application of a tangential force (50 pN) to a 17A2 mAb-bound bead was calcium flux induced (Fig. 4C). Quantitation of changes in intracellular free calcium over time are shown for two representative T cells to which this 17A2 mAb-bound bead force was applied (MF) and, by comparison, that of a T cell only approximated to a 17A2 mAb bead (no MF) (Fig. 4D). In contrast, 2C11 mAb-bound bead binding itself triggers rapid calcium flux, without requirement for horizontal motion. This observation suggests that the intrinsic diagonal binding orientation of 2C11 provides the requisite activation force. Furthermore, neither an applied vertical (normal to the surface of the
cell) movement of the 17A2 mAb-bead or a comparable tangential force on a bead coupled with anti-CD8 mAb (H35) binding to the CD8 co-receptor on T cells was able to induce a calcium flux (Fig. S9). These results show that an asymmetric force or torque applied to the CD3εγ ectodomain rather than a normal movement is essential for TCR signaling initiation by antibody binding.
To next assess if TCR ligation by pMHC also required application of external force to induce a rise in intracellular free calcium in T cells, we used either VSV8/Kb or SEV9/Kb pMHC complexes. These were expressed recombinantly, purified and coupled to streptavidin beads at equivalent amounts as detailed in Experimental Procedures and Fig. S10. VSV8/Kb is the specific cognate ligand for the N15 TCR, while SEV9/Kb is irrelevant for the vesicular stomatitis virus-directed N15 TCR. The Sendai virus nonamer binds to Kb with identical affinity to VSV8, but is not activating (36).
As shown in Fig. 4E, application of 50 pN of tangential mechanical force to each of two naïve N15 TCR transgenic lymph node T cells via VSV8/Kb-coupled beads induced significant change in the MFI of the calcium sensing dye, calcium orange. In contrast, application of the same force to SEV9/Kb-beads induced no intracellular calcium change when monitored in the same way. Approximation of VSV8/Kb-bead to the N15 T cell but without force application induced no calcium change and was indistinguishable from the SEV9/Kb curve as depicted during 5 min of continuous observation. In summary, TCR triggering by pMHC in this system is antigen specific and requires application of force during the pMHC interaction with the TCR.
DISCUSSION
The TCR complex projects less than 100Å from the T cell membrane and is therefore resistant to non-specific perturbations such as fluid shear in distinction to mechanosensors in the nervous system (37). The highly-selective signaling torque generated through relevant pMHC ligation during T cell scanning of APC surfaces likely further precludes "non-specific" activation
by guest on June 15, 2018http://w
ww
.jbc.org/D
ownloaded from
8
to foster antigen-specific activation events including calcium flux and integrin upregulation. This in turn can facilitate stop movement for the T cell to form the immunologic synapse. Mechanoreceptor function is most likely tunable by inducible actin cytoskeletal interactions with TCR and pMHC on T cells and APCs, respectively, since torque will be greatest in their presence. Within the synapse, force could be generated on the TCR via microcluster formation and actin-based trafficking (38). Mechanosensing can be further amplified at the synapse where intermembrane distances (~150Å) are optimal for TCR/pMHC ligation (Fig. S11A) in conjunction with other signaling molecules to sustain activation from both p-SMAC and c-SMAC components. Rapid transport of TCRs to the immunological synapse and TCR signaling after disengagement of pMHC likely gives rise to serial TCR triggering for high activation efficiency within the immunological synapse. The force required in this dynamic mechanosensor model could also be mediated by dimeric antibody or multimeric pMHC (i.e. tetramers) bound to two sets of TCR complexes (Fig. S11B) without a prerequisite for TCR or pMHC oligomerization via "permissive" geometry on the T cell membrane. This suggestion also explains why monomeric pMHC and anti-CD3 Fab are ineffective at T cell activation.
Our data suggest a model wherein tangential force is applied along the pseudo-two fold symmetry axis of the TCR complex such that the αβ heterodimer exerts torque on CD3εγ and CD3εδ. There is a directionality to the TCR mechanosensor at the molecular level. However, given the rapid rotational motion of both TCR and pMHC, the assembly likely reorients relative to the direction of cell movement.
2C11 mAb binding exploits the most sensitive triggering direction of pMHC signaling (Fig. S11). Thus only minute force is required for T cell activation in contrast to the more vertically binding 17A2 and pMHC. Such lateral force may come from Brownian motion of the bead used in the optical tweezer experiments or diffusion /transportation of the TCR complex. Given the close proximity of Cβ FG loop to the CD3ε of the CD3εγ heterodimer, we envision
the FG loop as a lever to exert force on CD3ε upon pMHC ligation at the moving cell surface. This is similar to the torque mediated by 2C11 pulling on CD3ε. Obviously, physical force is required for the FG loop to impinge on the adjacent CD3εγ heterodimer (Fig. S11) in agreement with results depicted in Fig. 4E.
The application of 50 pN of force as used herein is a reasonable force to be anticipated under physiologic conditions. In this regard, Wulfing et al. (39) determined the minimum adhesion strength between activated T cells and APCs to be 90 dyne/cm2. A force of 50 pN results in an applied stress of 80 dyne/cm2, assuming the contact area between the cell and the bead is approximately half the bead surface area.
These data and our mechanosensor model need to be considered in the context of alternative signaling mechanisms proposed for the TCR. For example, earlier studies suggesting that pMHC applies an external force to push on or "deform" the TCR (10,40) are not inconsistent with the current view, although the present model is more detailed, being guided by further structural and functional information. Moreover, a singularly vertical or piston-like motion previously suggested as a signaling basis seems excluded by the optical trap analysis herein. The notions of permissive geometry (41) involving dimers of TCRs and pMHC or pseudodimers (42) are unlikely given the extensive glycosylation of the TCR complex. However, such considerations do not exclude micro-clustering of TCR complexes in the absence of TCR and/or co-receptor protein ectodomain oligomerization, nor models of kinetic segregation. The latter is suggested to partition inhibitory phosphatases away from the activation machinery in the T cell-APC contact zone (43).
That the TCR is an evolved mechanosensor activated by direction-specific physical force has several immediate implications. First, since the total force applied to the T cell surface is essentially defined during movement of the T cell membrane relative to that of the APC, ligation of several TCRs by several cognate pMHCs on the opposing APC will exert a greater physical force on each individual TCR than multiple TCR ligations on
by guest on June 15, 2018http://w
ww
.jbc.org/D
ownloaded from
9
the same T cell by a large number of TCR-pMHC interactions. Hence, specificity and sensitivity are built into TCR mechanosensor function. Second, in principle, shear forces can form catch bonds at the TCR-pMHC interface to enhance binding and/or confer additional ligand specificity. These bonds that are strengthened by tensile force have been described for cell adhesion molecules (44). Third, since the B cell receptor (BCR) is made up of cell surface immunoglobulin associated with ITAM-containing Igα and Igβ invariant proteins (45), physical force may be important for BCR-mediated B cell activation as well. Precedent for mechanoreceptors in the hematopoietic system is the von Willebrand factor (VWF) receptor on platelets where tensile stress on bonds between the GPIbα subunit and the VWFA1 domain under fluid dynamic conditions triggers integrin αIIbβIII activation to support platelet adhesion (46). Fourth, this anisotropic (direction-dependent) non-equilibrium signaling mechanism implies that isotropic equilibrium constants may not be sufficient to describe mechanoreceptor signaling kinetics.
by guest on June 15, 2018http://w
ww
.jbc.org/D
ownloaded from
10
REFERENCES 1. Rudolph, M. G., Stanfield, R. L., and Wilson, I. A. (2006) Annu Rev Immunol 24, 419-466 2. Iwashima, M., Irving, B. A., van Oers, N. S., Chan, A. C., and Weiss, A. (1994) Science
263(5150), 1136-1139 3. Shinkai, Y., Ma, A., Cheng, H. L., and Alt, F. W. (1995) Immunity 2(4), 401-411 4. Sprent, J., and Surh, C. D. (2002) Annu Rev Immunol 20, 551-579 5. Teixeiro, E., Daniels, M. A., Hamilton, S. E., Schrum, A. G., Bragado, R., Jameson, S. C., and
Palmer, E. (2009) Science 323(5913), 502-505 6. Reth, M. (1989) Nature 338(6214), 383-384 7. Letourneur, F., and Klausner, R. D. (1992) Science 255(5040), 79-82 8. Crabtree, G. R., and Clipstone, N. A. (1994) Annu Rev Biochem 63, 1045-1083 9. Robb, R. J., Munck, A., and Smith, K. A. (1981) J Exp Med 154(5), 1455-1474 10. Sun, Z. J., Kim, K. S., Wagner, G., and Reinherz, E. L. (2001) Cell 105(7), 913-923 11. Sun, Z. Y., Kim, S. T., Kim, I. C., Fahmy, A., Reinherz, E. L., and Wagner, G. (2004) Proc Natl
Acad Sci U S A 101(48), 16867-16872 12. Haks, M. C., Krimpenfort, P., Borst, J., and Kruisbeek, A. M. (1998) Embo J 17(7), 1871-1882 13. Ghendler, Y., Hussey, R. E., Witte, T., Mizoguchi, E., Clayton, L. K., Bhan, A. K., Koyasu, S.,
Chang, H. C., and Reinherz, E. L. (1997) Eur J Immunol 27(9), 2279-2289 14. Kern, P. S., Teng, M. K., Smolyar, A., Liu, J. H., Liu, J., Hussey, R. E., Spoerl, R., Chang, H. C.,
Reinherz, E. L., and Wang, J. H. (1998) Immunity 9(4), 519-530 15. Moody, A. M., Xiong, Y., Chang, H. C., and Reinherz, E. L. (2001) Eur J Immunol 31(9), 2791-
2799 16. Ferentz, A. E., and Wagner, G. (2000) Q Rev Biophys 33(1), 29-65 17. Takahashi, H., Nakanishi, T., Kami, K., Arata, Y., and Shimada, I. (2000) Nat Struct Biol 7(3),
220-223 18. Fahmy, A., and Wagner, G. (2002) J Am Chem Soc 124(7), 1241-1250 19. Brau, R. R., Tarsa, P. B., Ferrer, J. M., Lee, P., and Lang, M. J. (2006) Biophys J 91(3), 1069-
1077 20. Hayes, S. M., and Love, P. E. (2002) Immunity 16(6), 827-838 21. Nishida, T., Matsuki, Y., Ono, T., Oguma, T., Tsujimoto, K., Sato, M., and Tadakuma, T. (2004)
J Immunol 172(11), 6634-6641 22. Mizoguchi, A., Mizoguchi, E., de Jong, Y. P., Takedatsu, H., Preffer, F. I., Terhorst, C., and Bhan,
A. K. (2003) Int Immunol 15(1), 97-108 23. Altan-Bonnet, G., and Germain, R. N. (2005) PLoS Biol 3(11), e356 24. Takahashi, H., Nakanishi, T., Kami, K., Arata, Y., and Shimada, I. (2000) Nat Struct Biol 7, 220-
223 25. Havran, W. L., Poenie, M., Kimura, J., Tsien, R., Weiss, A., and Allison, J. P. (1987) Nature
330(6144), 170-173 26. Kuhns, M. S., and Davis, M. M. (2007) Immunity 26(3), 357-369 27. Schwieters, C. D., Kuszewski, J. J., Tjandra, N., and Clore, G. M. (2003) J Magn Reson 160(1),
65-73 28. Ghendler, Y., Smolyar, A., Chang, H. C., and Reinherz, E. L. (1998) J Exp Med 187(9), 1529-
1536 29. Touma, M., Sun, Z. Y., Clayton, L. K., Marissen, W. E., Kruisbeek, A. M., Wagner, G., and
Reinherz, E. L. (2007) J Immunol 178(6), 3668-3679 30. Kjer-Nielsen, L., Dunstone, M. A., Kostenko, L., Ely, L. K., Beddoe, T., Mifsud, N. A., Purcell,
A. W., Brooks, A. G., McCluskey, J., and Rossjohn, J. (2004) Proc Natl Acad Sci U S A 101(20), 7675-7680
by guest on June 15, 2018http://w
ww
.jbc.org/D
ownloaded from
11
31. Arnett, K. L., Harrison, S. C., and Wiley, D. C. (2004) Proc Natl Acad Sci U S A 101(46), 16268-16273
32. Palmer, E., and Naeher, D. (2009) Nat Rev Immunol 9(3), 207-213 33. Sasada, T., Touma, M., Chang, H. C., Clayton, L. K., Wang, J. H., and Reinherz, E. L. (2002) J
Exp Med 195(11), 1419-1431 34. Touma, M., Chang, H. C., Sasada, T., Handley, M., Clayton, L. K., and Reinherz, E. L. (2006) J
Immunol 176(11), 6812-6823 35. van Mameren, J., Modesti, M., Kanaar, R., Wyman, C., Peterman, E. J., and Wuite, G. J. (2009)
Nature 457(7230), 745-748 36. Ghendler, Y., Teng, M. K., Liu, J. H., Witte, T., Liu, J., Kim, K. S., Kern, P., Chang, H. C., Wang,
J. H., and Reinherz, E. L. (1998) Proc Natl Acad Sci U S A 95(17), 10061-10066 37. Kung, C. (2005) Nature 436(7051), 647-654 38. Yokosuka, T., Kobayashi, W., Sakata-Sogawa, K., Takamatsu, M., Hashimoto-Tane, A., Dustin,
M. L., Tokunaga, M., and Saito, T. (2008) Immunity 29(4), 589-601 39. Wulfing, C., Sjaastad, M. D., and Davis, M. M. (1998) Proc Natl Acad Sci U S A 95(11), 6302-
6307 40. Ma, Z., Janmey, P. A., and Finkel, T. H. (2008) FASEB J 22, 1002-1008 41. Minguet, S., and Schamdel, W. W. (2008) Trends Biochem Sci 33, 51-57 42. Krogsgaard, M., Li, Q. J., Sumen, C., Huppa, J. B., Huse, M., and Davis, M. M. (2005) Nature
434, 238-243 43. Davis, S. J., and van der Merwe, P. A. (2006) Nat Immunol 7, 803-809 44. Marshall, B. T., Long, M., Piper, J. W., Yago, T., McEver, R. P., and Zhu, C. (2003) Nature
423(6936), 190-193 45. Kulathu, Y., Hobeika, E., Turchinovich, G., and Reth, M. (2008) Embo J 27(9), 1333-1344 46. Ruggeri, Z. M. (2007) Thromb Haemost 98(1), 55-62 47. Wang, J., Lim, K., Smolyar, A., Teng, M., Liu, J., Tse, A. G., Liu, J., Hussey, R. E., Chishti, Y.,
Thomson, C. T., Sweet, R. M., Nathenson, S. G., Chang, H. C., Sacchettini, J. C., and Reinherz, E. L. (1998) Embo J 17(1), 10-26
FOOTNOTES
We thank Drs. Oreste Acuto, Darrell J. Irvine, Kristine Brazin, Linda Clayton and Robert Mallis for thoughtful reviews of this manuscript. We acknowledge Dr. Haesook Kim and Dr. Guanglan Zhang for statistical analysis and Maris Handley for flow cytometry. This work was supported by NIH grant AI19807 to ELR and AI37581, GM47467 and EB002026 to GW.
FIGURE LEGENDS Fig. 1. Specificity of anti-CD3 mAbs. (A) 15N-1H two-dimensional HSQC spectrum of
recombinant CD3εγ (schematically represented) is stable under physiological conditions (pH 7.4, PBS). (B) SPR analysis of competitive scCD3εγ binding between 17A2 and 2C11. Direct binding between recombinant CD3εγ (1µM) and surface-bound 17A2 was measured using a BIA3000 Biosensor. Sensorgrams without and with 2C11 pre-addition to the CD3εγ protein are shown (numbers represent antibody to CD3εγ protein molar ratios). (C) and (D) Binding competition between 17A2 and 2C11 on the T cell surface. LNs were isolated from C57BL/6 mice. mAbs against T cell surface markers including CD3 were used for flow cytometric analysis. Each dot represents 2C11-FITC (2C11-F) and 17A2-Alexa647 (17A2-A647) binding after unlabeled 17A2 blocking (blue), 2C11 blocking (green) or no blocking (red). CD4 single-positive αβ TCR-positive or γδ TCR-positive populations were gated for analysis. Data are representative of three independent experiments and plotted on a 5 log scale (0-5). MFI values are given in the accompanying tables for binding of each antibody fluorochrome-labeled antibody
by guest on June 15, 2018http://w
ww
.jbc.org/D
ownloaded from
12
without or with indicated unlabeled mAb blockade. (E) Differential binding of 17A2 to thymocytes of wild type (blue) and CD3γ−/− (red) mice. CD4 single-positive thymocytes were gated for analysis. H57 recognizes the FG loop in the constant region of TCRβ (47).
Fig. 2. Differential functional activation of T cells by anti-CD3 mAbs. (A) Flow cytometry
analysis with MFI binding quantitation of 2C11-FITC and 17A2-FITC at varying concentrations to the DP (αβ TCR+) and B9 (γδ TCR+) cell lines. (B) Phosphorylation states of ERK or MAPK after 2C11- or 17A2-coupled bead stimulation (blue = no stimulation; red = 17A2 stimulation; green = 2C11 stimulation). (C and D) Intracellular calcium dynamics upon interaction with 2C11- or 17A2-coupled bead. Circles represent cells stimulated by 2C11-beads and triangles represent cells stimulated by 17A2-beads (two independent measurements are shown for each with open and filled symbols). For calcium flux experiments, γδ and αβ T cells were purified from LNs of TCRβ−/− and B6 mice, respectively, as described in the supporting online material. Time 0 = time of bead addition to cells. (E) Microscopic images of calcium flux in individual cells using Fluo-4 and microscopy as described in Experimental Procedures. Fluo-4 responses were quantified by determining the average intensity of a region within each cell as a function of time using the Image J program (NIH). Results are representative of the 64 individual T cells analyzed. 2-tailed T test analysis was performed to compare MIF values from 64 T cells. The increase in intracellular free calcium levels induced by 2C11- beads was significantly different from those induced by 17A2-beads (i.e., p< 0.05 at 6 min).
Fig. 3. NMR cross-saturation experiments to map antibody binding surfaces on CD3εγ and TCR
quaternary structure. (A) The residues in the binding sites of CD3εγ for 17A2 (left) and 2C11 (right) Fabs were mapped using cross-saturation analysis. Blue and red spheres indicate residues that experience significant cross-saturation (signal reduction <0.5) or disappear upon Fab binding, respectively, and thus mediate direct contact with the Fabs. (B) Representative models of CD3εγ/17A2 Fab and CD3εγ/2C11 Fab complexes as described in the text. Red represents the heavy chain fragments and blue the light chain of the Fab. (C) Proposed TCR quaternary structure model as viewed from the T cell membrane. Magnified boxed region in the complex model shows the location of the Cβ FG loop (magenta) and N-terminal segment of CD3γ (orange) with the Cβ/Cα cave (47) represented as a grey sphere. For simplicity, only CD3γ (green) and CD3δ (yellow) glycans are shown. Hypothetical distance constraints between nearby charged residues were employed with a number of residues, including the entire N-terminal segment of CD3ε which was allowed to be flexible during annealing between the docking steps.
Fig. 4. Mechanosensor model for TCR signaling. (A) T cell scanning an APC surface in search of
specific pMHC. Upon attachment, the T cell assumes a polarized morphology with a leading edge and lengthening uropod. (B) One pMHC molecule is shown in orange on the APC while the ectodomains of TCR subunits on the T cell membrane below are colored as in Fig. 3. The view is from the CD3εγ side. Initial ligation of the TCR by pMHC (right) constitutes a detachable mechanosensor which, as a result of continued T cell scanning, transmits an external torque (bend) into initial signaling (bolt) via the rigid components of the TCR complex prior to dissociation. Τhe β FG loop is shown in magenta. (C) Calcium flux in naïve T cells after application of external mechanical force using optical tweezers. Equivalent amounts of Alexa555-labeled 17A2 or 2C11 were immobilized on protein G-coupled polystyrene beads (1 µm diameter). T cell-bead contact was manipulated via the trapping beam as shown in bright field images (left panel). The direction of the external mechanical force (MF) for a 17A2 bead is denoted by the double-headed arrow. Microscopic fluorescence images were recorded using a 532 nm laser for both Alexa555 and calcium orange (cellular dye for detecting calcium flux) under temperature control at 37oC (right panels). For 2C11 beads, the 60 second point only is shown, given the rapidity of calcium flux and the absence of a requirement of any additional MF. The fluorescent antibody-bound bead is the smaller object next to the T cell in every frame. (D) Quantitative intracellular calcium dynamics upon 17A2 bead interaction. Results are representative of 112 cellular N15 T cell events quantitated in eight separate
by guest on June 15, 2018http://w
ww
.jbc.org/D
ownloaded from
13
experiments. 2-tailed T test was performed to compare MFI values of all cells between the 150-180 secs interval. Only 17A2-bead with applied tangential mechanical force significantly induces intracellular calcium flux (p< 0.05). Three representative T cells are shown; two receiving ~50 pN mechanical force (MF1/2) and one without (No MF) (E) Calcium dynamics upon pMHC bead interaction. Equivalent numbers (~1,000) of VSV8/Kb and SEV9/Kb complexes were immobilized on streptavidin-coupled polystyrene beads (1 µm diameter). Tangential mechanical force (~50 pN) was provided for each of three pMHC beads (pMHC MF) but not two others (no MF). Five representative cells are shown among 190 cell determinations analyzed. Only VSV8/Kb beads upon MF application induced significant calcium flux (p< 0.05) when ~10 and ~1,000 pMHC complexes per bead were examined. The extent of calcium flux was not diminished at the lower pMHC complex density nor kinetics of activation lengthened.
by guest on June 15, 2018http://w
ww
.jbc.org/D
ownloaded from
Fahmy, Matthew J. Lang, Gerhard Wagner and Ellis L. ReinherzSun Taek Kim, Koh Takeuchi, Zhen-Yu J. Sun, Maki Touma, Carlos E. Castro, Amr
The alphabeta T cell receptor is an anisotropic mechanosensor
published online September 15, 2009J. Biol. Chem.
10.1074/jbc.M109.052712Access the most updated version of this article at doi:
Alerts:
When a correction for this article is posted•
When this article is cited•
to choose from all of JBC's e-mail alertsClick here
Supplemental material:
http://www.jbc.org/content/suppl/2009/09/15/M109.052712.DC1
by guest on June 15, 2018http://w
ww
.jbc.org/D
ownloaded from