the scope of nanoporous steroidal ureas Cholanamide ... components for organic alloys; expanding the...
34
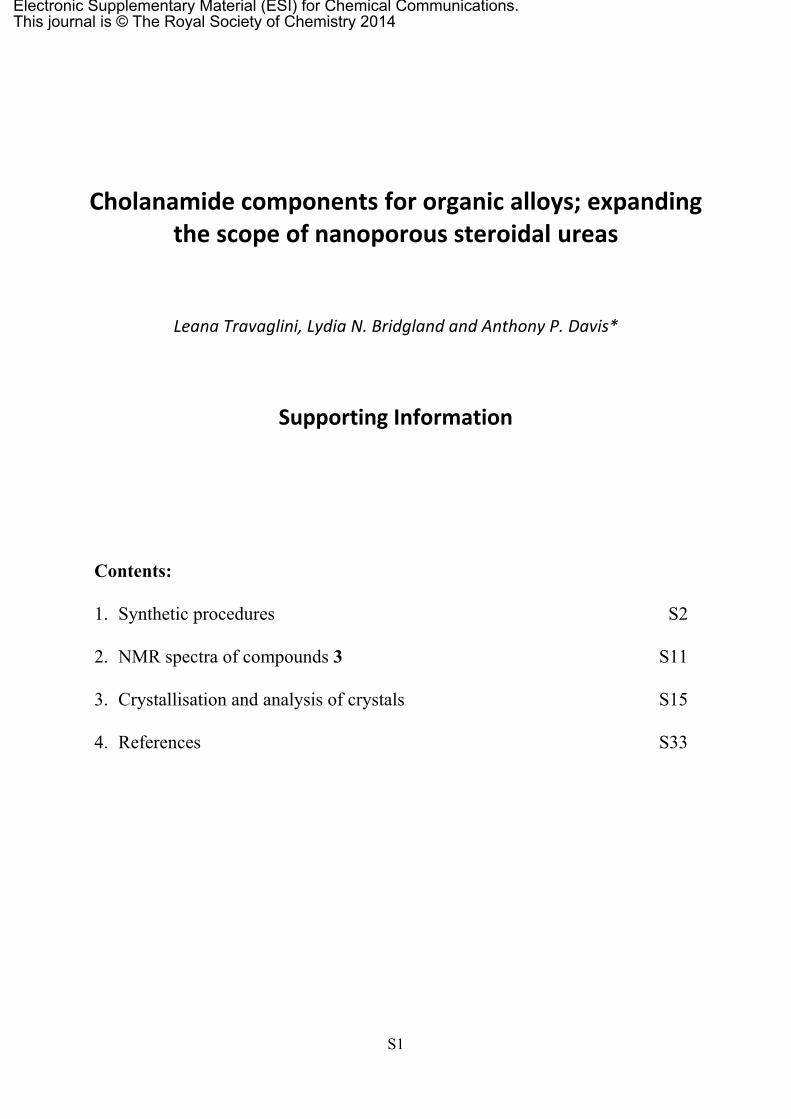
S1 Cholanamide components for organic alloys; expanding the scope of nanoporous steroidal ureas Leana Travaglini, Lydia N. Bridgland and Anthony P. Davis* Supporting Information Contents: 1. Synthetic procedures S2 2. NMR spectra of compounds 3 S11 3. Crystallisation and analysis of crystals S15 4. References S33 Electronic Supplementary Material (ESI) for Chemical Communications. This journal is © The Royal Society of Chemistry 2014
Transcript of the scope of nanoporous steroidal ureas Cholanamide ... components for organic alloys; expanding the...
S1
Cholanamide components for organic alloys; expanding the scope of nanoporous steroidal ureas
Leana Travaglini, Lydia N. Bridgland and Anthony P. Davis*
Supporting Information
Contents:
1. Synthetic procedures S2
2. NMR spectra of compounds 3 S11
3. Crystallisation and analysis of crystals S15
4. References S33
Electronic Supplementary Material (ESI) for Chemical Communications.This journal is © The Royal Society of Chemistry 2014
S2
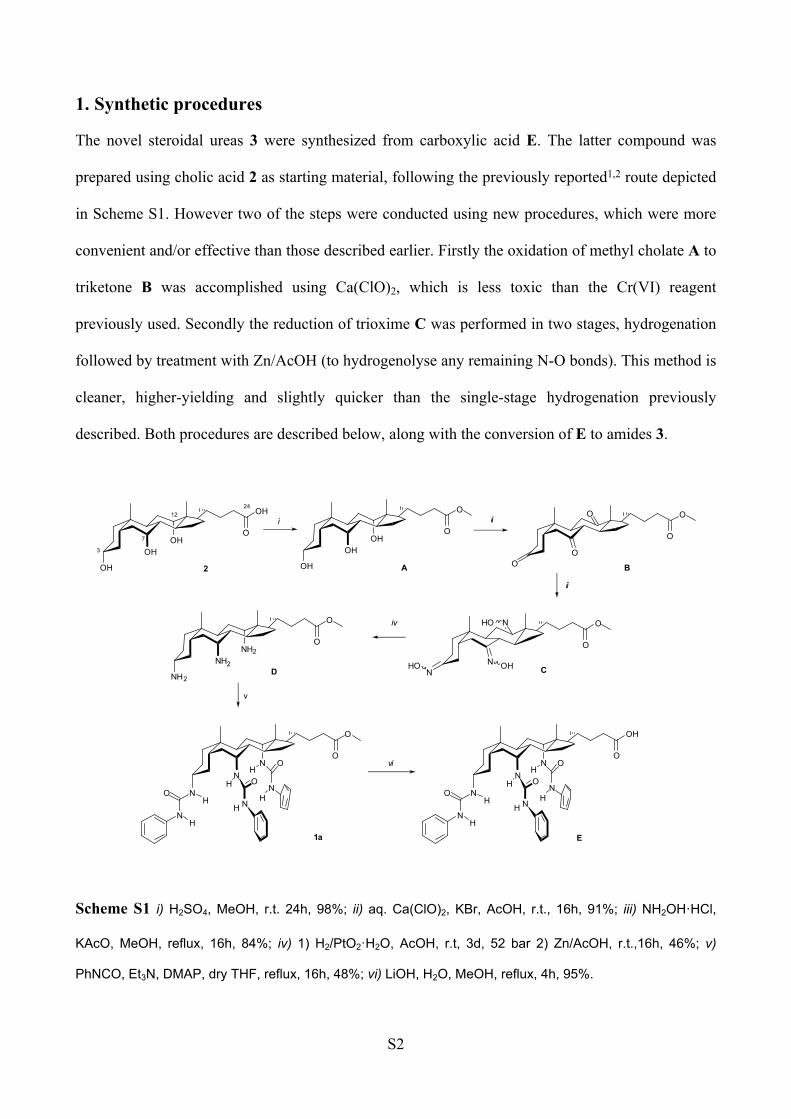
1. Synthetic procedures
The novel steroidal ureas 3 were synthesized from carboxylic acid E. The latter compound was
prepared using cholic acid 2 as starting material, following the previously reported1,2 route depicted
in Scheme S1. However two of the steps were conducted using new procedures, which were more
convenient and/or effective than those described earlier. Firstly the oxidation of methyl cholate A to
triketone B was accomplished using Ca(ClO)2, which is less toxic than the Cr(VI) reagent
previously used. Secondly the reduction of trioxime C was performed in two stages, hydrogenation
followed by treatment with Zn/AcOH (to hydrogenolyse any remaining N-O bonds). This method is
cleaner, higher-yielding and slightly quicker than the single-stage hydrogenation previously
described. Both procedures are described below, along with the conversion of E to amides 3.
O
O
OHOH
O
OH
OH
3
7
1224
2
NH
NN
O
OH
O
O
N
N
HH
H
H
O
N
NH
NN
O
O
O
O
N
N
HH
H
H
O
N
1a E
H H
OO
O
OHOH
O
O
OH
O
O
NN
NHO
OHHONH2
NH2O
O
NH2
A B
CD
i ii
ii
iv
v
vi
Scheme S1 i) H2SO4, MeOH, r.t. 24h, 98%; ii) aq. Ca(ClO)2, KBr, AcOH, r.t., 16h, 91%; iii) NH2OH·HCl,
KAcO, MeOH, reflux, 16h, 84%; iv) 1) H2/PtO2·H2O, AcOH, r.t, 3d, 52 bar 2) Zn/AcOH, r.t.,16h, 46%; v)
PhNCO, Et3N, DMAP, dry THF, reflux, 16h, 48%; vi) LiOH, H2O, MeOH, reflux, 4h, 95%.
S3
General. All commercially available chemicals were purchased from Aldrich or Alfa-Aesar and
used as received. Dry solvents, except for N,N-dimethylformamide DMF, were obtained from an
Anhydrous Engineering Solvent Purification System. DMF was left 24h over P2O5 and then distilled
under reduced pressure. Reactions and chromatographic separations were monitored by thin layer
chromatography (TLC) on 0.25 mm silica gel plates (Merck Silica Gel 60 F254). Phosphomolybdic
acid (12% solution in EtOH) and UV light (254 nm) were used as revealing agents. Column
chromatography was carried out on silica-gel (Sigma Aldrich 60, 230-400 mesh, 0.060-0.063 mm).
Melting points were measured on a Gallenkamp apparatus and are quoted as uncorrected values. 1H
and 13C NMR spectra were recorded on Varian 400-MR, JEOL ECP (Eclipse) 400, Jeol Lambda
300 and Varian VNMRS500a spectrometers. Chemical shifts are reported in parts per million
(ppm) with residual protons of the deuterated solvent as the reference standard. Signal splittings are
described as singlet (s), broad singlet (br. s), doublet (d), triplet (t), multiplet (m), complex multiplet
(cm). High resolution mass spectra were recorded on a Bruker Apex 4e 7.0T FT-MS.
S4
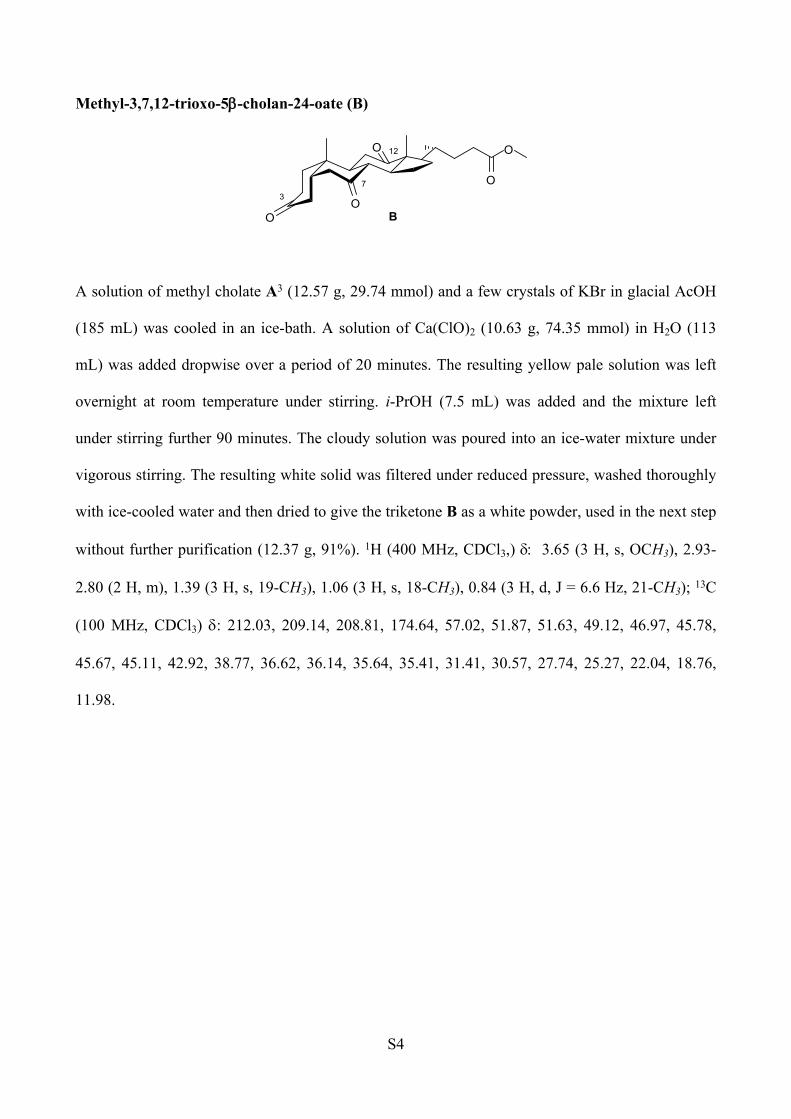
Methyl-3,7,12-trioxo-5-cholan-24-oate (B)
O
O
OO
O
B
37
12
A solution of methyl cholate A3 (12.57 g, 29.74 mmol) and a few crystals of KBr in glacial AcOH
(185 mL) was cooled in an ice-bath. A solution of Ca(ClO)2 (10.63 g, 74.35 mmol) in H2O (113
mL) was added dropwise over a period of 20 minutes. The resulting yellow pale solution was left
overnight at room temperature under stirring. i-PrOH (7.5 mL) was added and the mixture left
under stirring further 90 minutes. The cloudy solution was poured into an ice-water mixture under
vigorous stirring. The resulting white solid was filtered under reduced pressure, washed thoroughly
with ice-cooled water and then dried to give the triketone B as a white powder, used in the next step
without further purification (12.37 g, 91%). 1H (400 MHz, CDCl3,) 3.65 (3 H, s, OCH3), 2.93-
2.80 (2 H, m), 1.39 (3 H, s, 19-CH3), 1.06 (3 H, s, 18-CH3), 0.84 (3 H, d, J = 6.6 Hz, 21-CH3); 13C
(100 MHz, CDCl3) : 212.03, 209.14, 208.81, 174.64, 57.02, 51.87, 51.63, 49.12, 46.97, 45.78,
45.67, 45.11, 42.92, 38.77, 36.62, 36.14, 35.64, 35.41, 31.41, 30.57, 27.74, 25.27, 22.04, 18.76,
11.98.
S5
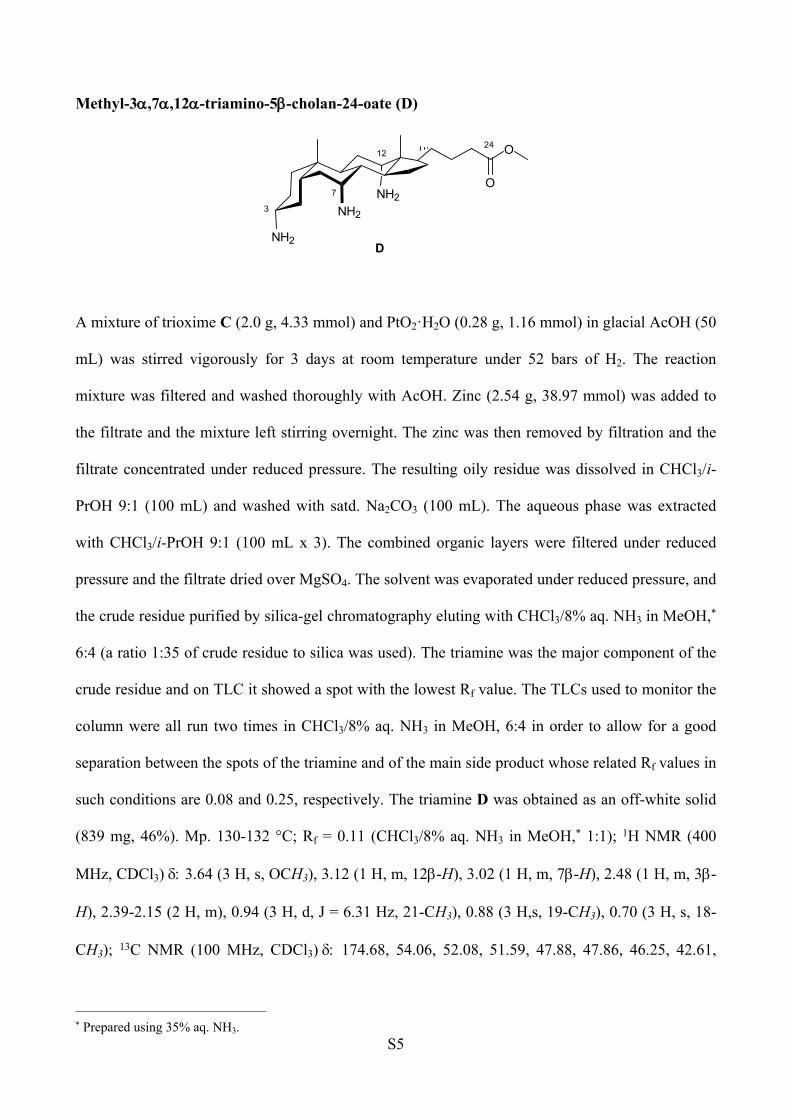
Methyl-3,7,12-triamino-5-cholan-24-oate (D)
NH2
NH2
NH2O
O
3
7
1224
D
A mixture of trioxime C (2.0 g, 4.33 mmol) and PtO2·H2O (0.28 g, 1.16 mmol) in glacial AcOH (50
mL) was stirred vigorously for 3 days at room temperature under 52 bars of H2. The reaction
mixture was filtered and washed thoroughly with AcOH. Zinc (2.54 g, 38.97 mmol) was added to
the filtrate and the mixture left stirring overnight. The zinc was then removed by filtration and the
filtrate concentrated under reduced pressure. The resulting oily residue was dissolved in CHCl3/i-
PrOH 9:1 (100 mL) and washed with satd. Na2CO3 (100 mL). The aqueous phase was extracted
with CHCl3/i-PrOH 9:1 (100 mL x 3). The combined organic layers were filtered under reduced
pressure and the filtrate dried over MgSO4. The solvent was evaporated under reduced pressure, and
the crude residue purified by silica-gel chromatography eluting with CHCl3/8% aq. NH3 in MeOH,*
6:4 (a ratio 1:35 of crude residue to silica was used). The triamine was the major component of the
crude residue and on TLC it showed a spot with the lowest Rf value. The TLCs used to monitor the
column were all run two times in CHCl3/8% aq. NH3 in MeOH, 6:4 in order to allow for a good
separation between the spots of the triamine and of the main side product whose related Rf values in
such conditions are 0.08 and 0.25, respectively. The triamine D was obtained as an off-white solid
(839 mg, 46%). Mp. 130-132 °C; Rf = 0.11 (CHCl3/8% aq. NH3 in MeOH,* 1:1); 1H NMR (400
MHz, CDCl3 3.64 (3 H, s, OCH3), 3.12 (1 H, m, 12-H), 3.02 (1 H, m, 7-H), 2.48 (1 H, m, 3-
H), 2.39-2.15 (2 H, m), 0.94 (3 H, d, J = 6.31 Hz, 21-CH3), 0.88 (3 H,s, 19-CH3), 0.70 (3 H, s, 18-
CH3); 13C NMR (100 MHz, CDCl3 174.68, 54.06, 52.08, 51.59, 47.88, 47.86, 46.25, 42.61,
* Prepared using 35% aq. NH3.
S6
42.07, 41.79, 39.76, 36.27, 35.26, 35.12, 31.87, 31.21, 31.02, 28.43, 27.73, 26.12, 23.71, 23.10,
17.31, 13.73; MS (ES+): m/z 420.36 ([M+H+], 100 %).
S7
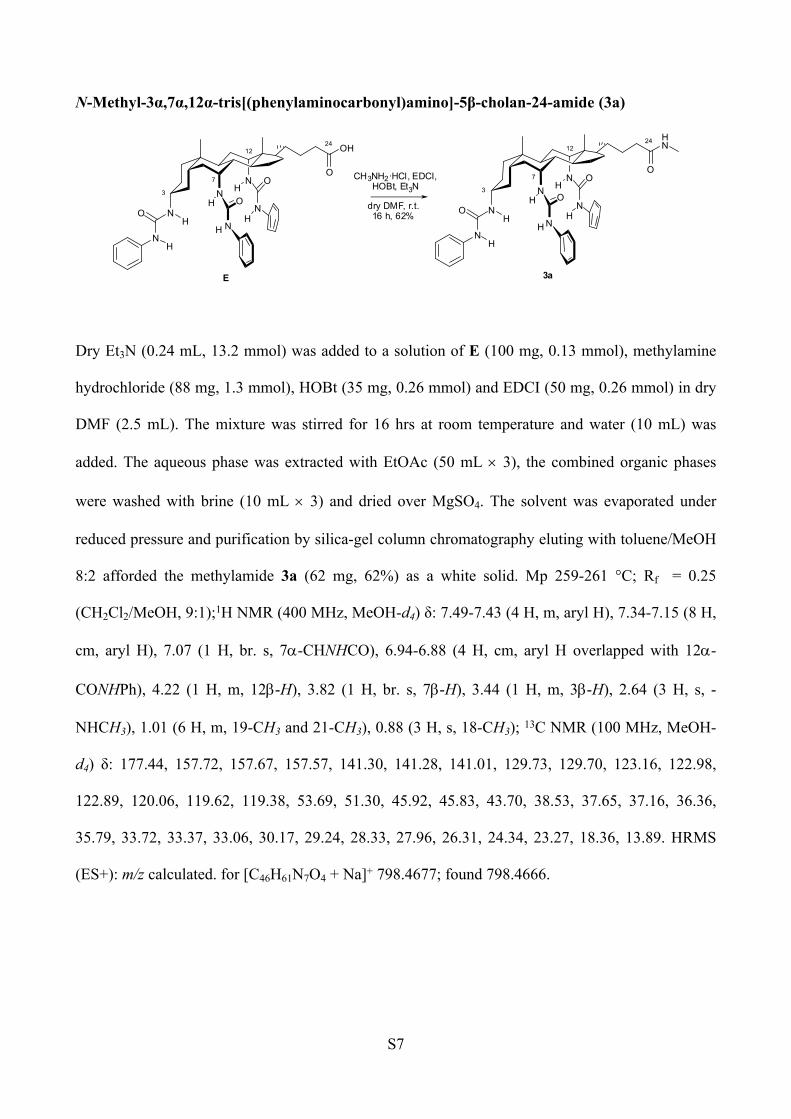
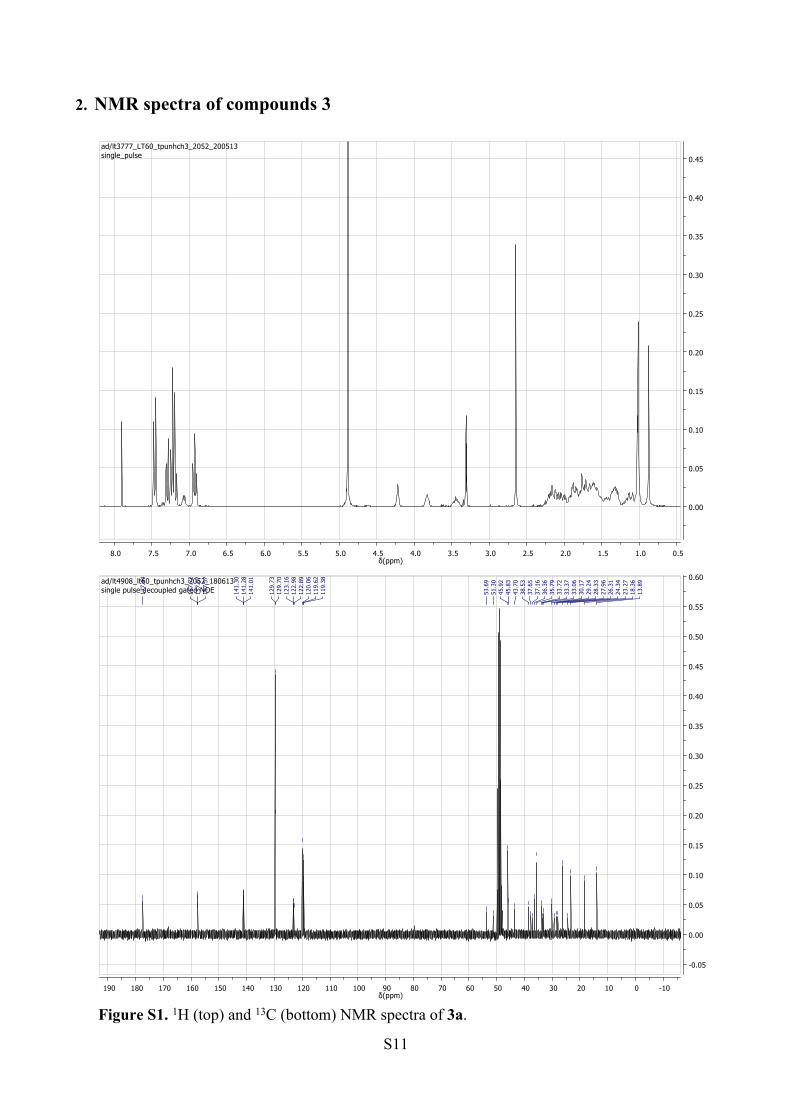
N-Methyl-3α,7α,12α-tris[(phenylaminocarbonyl)amino]-5β-cholan-24-amide (3a)
NH
NN
O
HN
O
O
N
N
HH
HH
O
N
3
7
1224
3a
H
NH
NN
O
OH
O
O
N
N
HH
HH
O
N
3
7
1224
H
E
CH3NH2·HCl, EDCI,HOBt, Et3N
dry DMF, r.t.16 h, 62%
Dry Et3N (0.24 mL, 13.2 mmol) was added to a solution of E (100 mg, 0.13 mmol), methylamine
hydrochloride (88 mg, 1.3 mmol), HOBt (35 mg, 0.26 mmol) and EDCI (50 mg, 0.26 mmol) in dry
DMF (2.5 mL). The mixture was stirred for 16 hrs at room temperature and water (10 mL) was
added. The aqueous phase was extracted with EtOAc (50 mL 3), the combined organic phases
were washed with brine (10 mL 3) and dried over MgSO4. The solvent was evaporated under
reduced pressure and purification by silica-gel column chromatography eluting with toluene/MeOH
8:2 afforded the methylamide 3a (62 mg, 62%) as a white solid. Mp 259-261 °C; Rf = 0.25
(CH2Cl2/MeOH, 9:1);1H NMR (400 MHz, MeOH-d4) δ: 7.49-7.43 (4 H, m, aryl H), 7.34-7.15 (8 H,
cm, aryl H), 7.07 (1 H, br. s, 7-CHNHCO), 6.94-6.88 (4 H, cm, aryl H overlapped with 12-
CONHPh), 4.22 (1 H, m, 12-H), 3.82 (1 H, br. s, 7-H), 3.44 (1 H, m, 3-H), 2.64 (3 H, s, -
NHCH3), 1.01 (6 H, m, 19-CH3 and 21-CH3), 0.88 (3 H, s, 18-CH3); 13C NMR (100 MHz, MeOH-
d4) δ: 177.44, 157.72, 157.67, 157.57, 141.30, 141.28, 141.01, 129.73, 129.70, 123.16, 122.98,
122.89, 120.06, 119.62, 119.38, 53.69, 51.30, 45.92, 45.83, 43.70, 38.53, 37.65, 37.16, 36.36,
35.79, 33.72, 33.37, 33.06, 30.17, 29.24, 28.33, 27.96, 26.31, 24.34, 23.27, 18.36, 13.89. HRMS
(ES+): m/z calculated. for [C46H61N7O4 + Na]+ 798.4677; found 798.4666.
S8
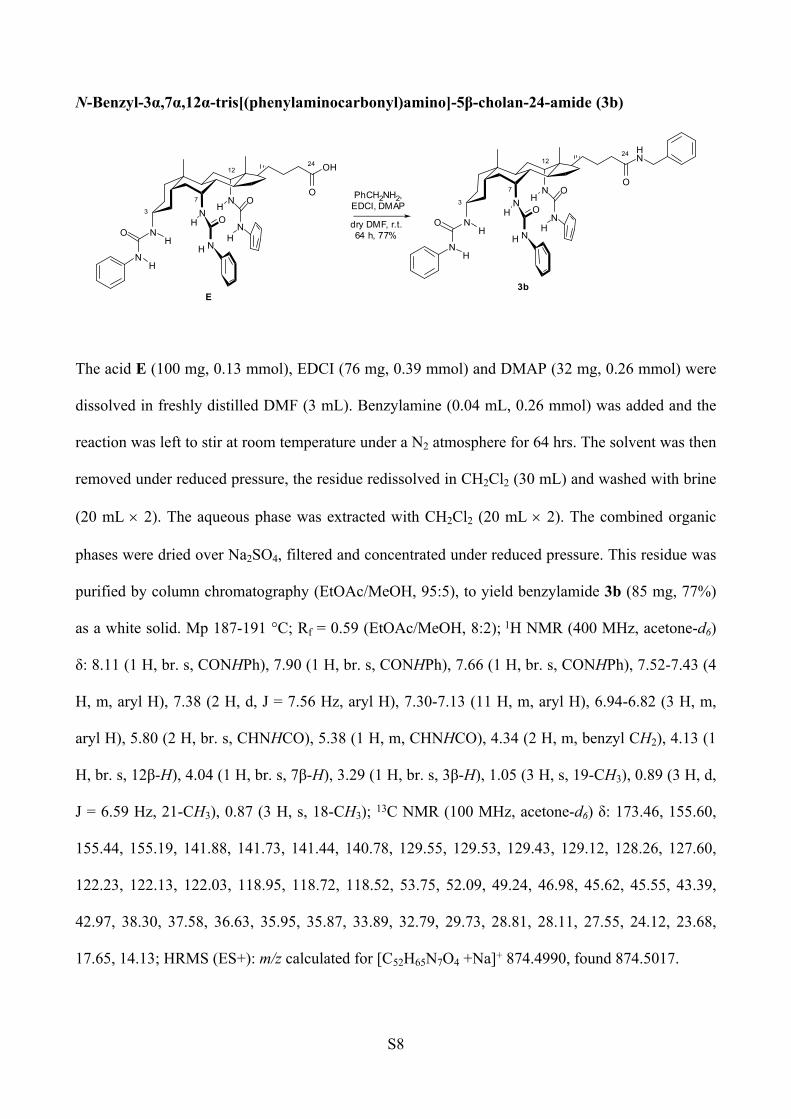
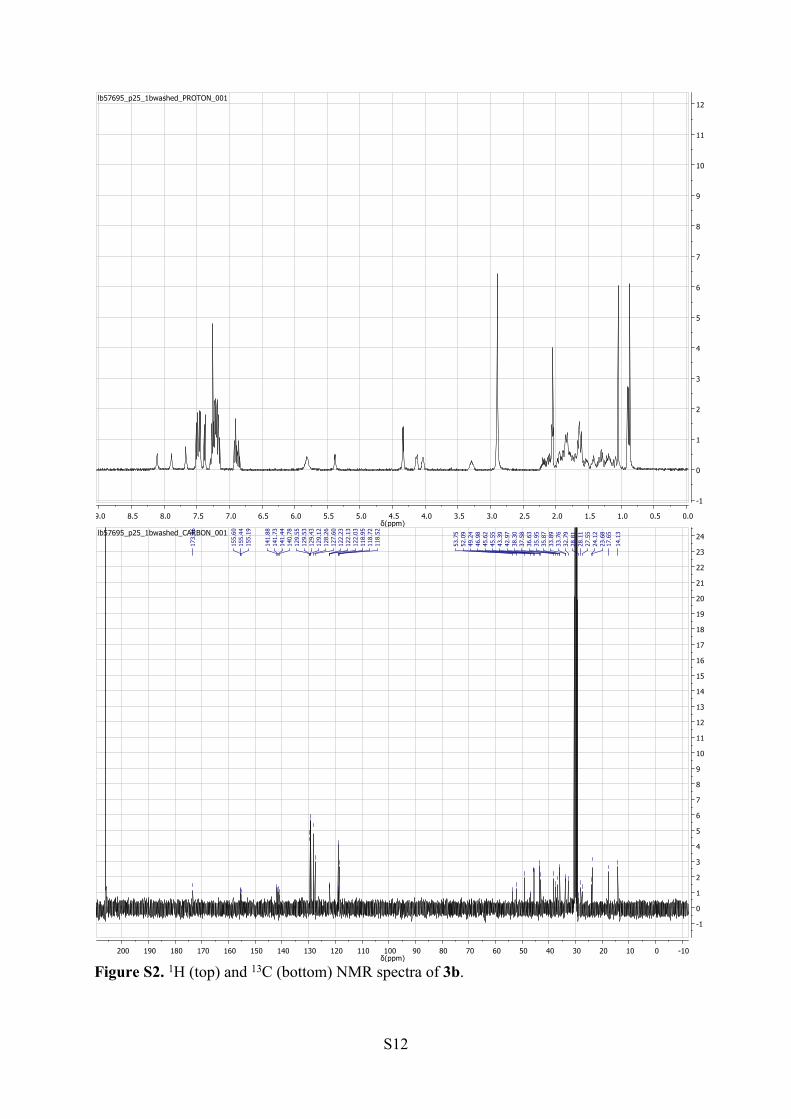
N-Benzyl-3α,7α,12α-tris[(phenylaminocarbonyl)amino]-5β-cholan-24-amide (3b)
NH
NN
O
HN
O
O
N
N
HH
HH
O
N
3
7
1224
3b
H
NH
NN
O
OH
O
O
N
N
HH
H
H
O
N
3
7
1224
H
E
PhCH2NH2, EDCI, DMAP
dry DMF, r.t.64 h, 77%
The acid E (100 mg, 0.13 mmol), EDCI (76 mg, 0.39 mmol) and DMAP (32 mg, 0.26 mmol) were
dissolved in freshly distilled DMF (3 mL). Benzylamine (0.04 mL, 0.26 mmol) was added and the
reaction was left to stir at room temperature under a N2 atmosphere for 64 hrs. The solvent was then
removed under reduced pressure, the residue redissolved in CH2Cl2 (30 mL) and washed with brine
(20 mL 2). The aqueous phase was extracted with CH2Cl2 (20 mL 2). The combined organic
phases were dried over Na2SO4, filtered and concentrated under reduced pressure. This residue was
purified by column chromatography (EtOAc/MeOH, 95:5), to yield benzylamide 3b (85 mg, 77%)
as a white solid. Mp 187-191 °C; Rf = 0.59 (EtOAc/MeOH, 8:2); 1H NMR (400 MHz, acetone-d6)
δ: 8.11 (1 H, br. s, CONHPh), 7.90 (1 H, br. s, CONHPh), 7.66 (1 H, br. s, CONHPh), 7.52-7.43 (4
H, m, aryl H), 7.38 (2 H, d, J = 7.56 Hz, aryl H), 7.30-7.13 (11 H, m, aryl H), 6.94-6.82 (3 H, m,
aryl H), 5.80 (2 H, br. s, CHNHCO), 5.38 (1 H, m, CHNHCO), 4.34 (2 H, m, benzyl CH2), 4.13 (1
H, br. s, 12β-H), 4.04 (1 H, br. s, 7β-H), 3.29 (1 H, br. s, 3β-H), 1.05 (3 H, s, 19-CH3), 0.89 (3 H, d,
J = 6.59 Hz, 21-CH3), 0.87 (3 H, s, 18-CH3); 13C NMR (100 MHz, acetone-d6) δ: 173.46, 155.60,
155.44, 155.19, 141.88, 141.73, 141.44, 140.78, 129.55, 129.53, 129.43, 129.12, 128.26, 127.60,
122.23, 122.13, 122.03, 118.95, 118.72, 118.52, 53.75, 52.09, 49.24, 46.98, 45.62, 45.55, 43.39,
42.97, 38.30, 37.58, 36.63, 35.95, 35.87, 33.89, 32.79, 29.73, 28.81, 28.11, 27.55, 24.12, 23.68,
17.65, 14.13; HRMS (ES+): m/z calculated for [C52H65N7O4 +Na]+ 874.4990, found 874.5017.
S9
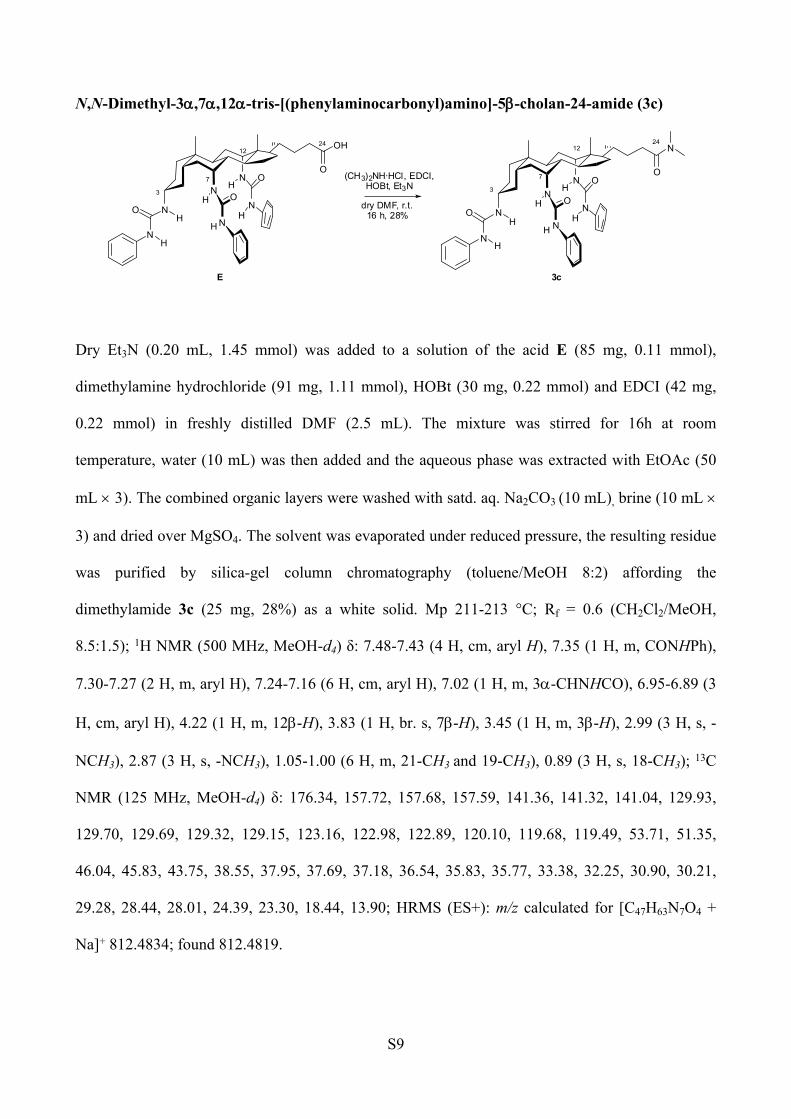
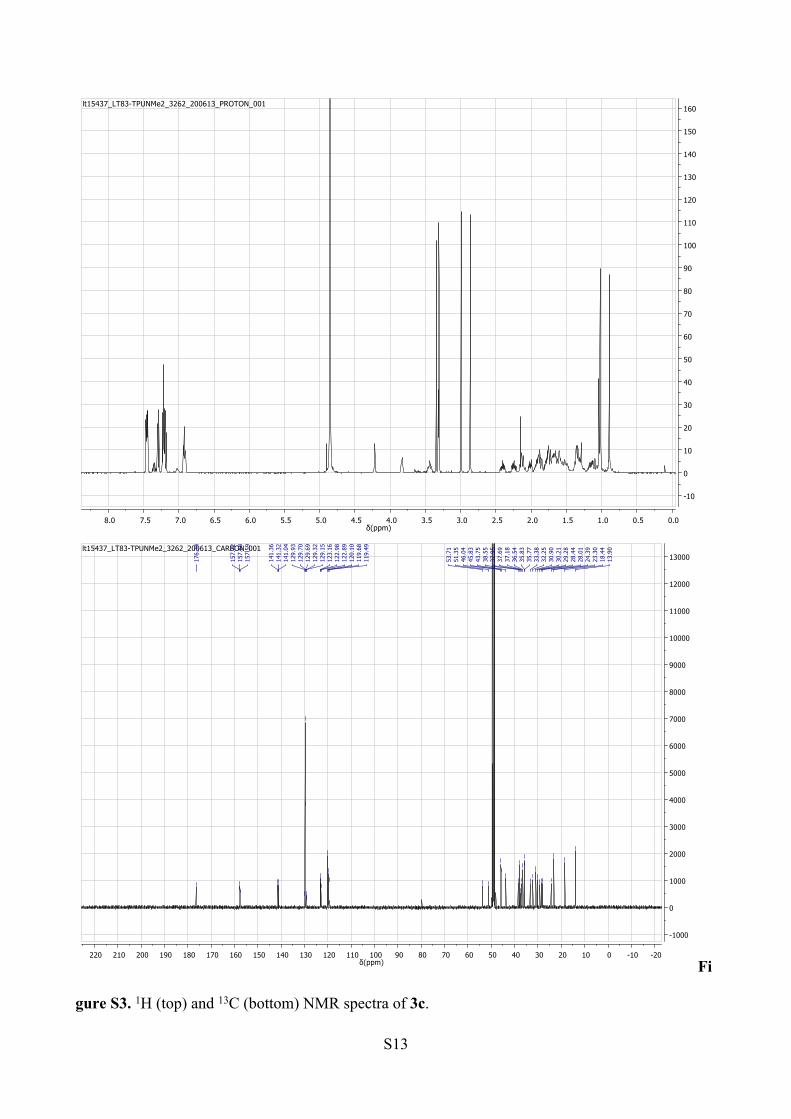
N,N-Dimethyl-3,7,12-tris-[(phenylaminocarbonyl)amino]-5-cholan-24-amide (3c)
NH
NN
O
N
O
O
N
N
HH
H
H
O
N
3
7
1224
3c
H
NH
NN
O
OH
O
O
N
N
HH
HH
O
N
3
7
1224
H
E
(CH3)2NH·HCl, EDCI,HOBt, Et3N
dry DMF, r.t.16 h, 28%
Dry Et3N (0.20 mL, 1.45 mmol) was added to a solution of the acid E (85 mg, 0.11 mmol),
dimethylamine hydrochloride (91 mg, 1.11 mmol), HOBt (30 mg, 0.22 mmol) and EDCI (42 mg,
0.22 mmol) in freshly distilled DMF (2.5 mL). The mixture was stirred for 16h at room
temperature, water (10 mL) was then added and the aqueous phase was extracted with EtOAc (50
mL 3). The combined organic layers were washed with satd. aq. Na2CO3 (10 mL), brine (10 mL
3) and dried over MgSO4. The solvent was evaporated under reduced pressure, the resulting residue
was purified by silica-gel column chromatography (toluene/MeOH 8:2) affording the
dimethylamide 3c (25 mg, 28%) as a white solid. Mp 211-213 °C; Rf = 0.6 (CH2Cl2/MeOH,
8.5:1.5); 1H NMR (500 MHz, MeOH-d4) δ: 7.48-7.43 (4 H, cm, aryl H), 7.35 (1 H, m, CONHPh),
7.30-7.27 (2 H, m, aryl H), 7.24-7.16 (6 H, cm, aryl H), 7.02 (1 H, m, 3-CHNHCO), 6.95-6.89 (3
H, cm, aryl H), 4.22 (1 H, m, 12-H), 3.83 (1 H, br. s, 7-H), 3.45 (1 H, m, 3-H), 2.99 (3 H, s, -
NCH3), 2.87 (3 H, s, -NCH3), 1.05-1.00 (6 H, m, 21-CH3 and 19-CH3), 0.89 (3 H, s, 18-CH3); 13C
NMR (125 MHz, MeOH-d4) δ: 176.34, 157.72, 157.68, 157.59, 141.36, 141.32, 141.04, 129.93,
129.70, 129.69, 129.32, 129.15, 123.16, 122.98, 122.89, 120.10, 119.68, 119.49, 53.71, 51.35,
46.04, 45.83, 43.75, 38.55, 37.95, 37.69, 37.18, 36.54, 35.83, 35.77, 33.38, 32.25, 30.90, 30.21,
29.28, 28.44, 28.01, 24.39, 23.30, 18.44, 13.90; HRMS (ES+): m/z calculated for [C47H63N7O4 +
Na]+ 812.4834; found 812.4819.
S10
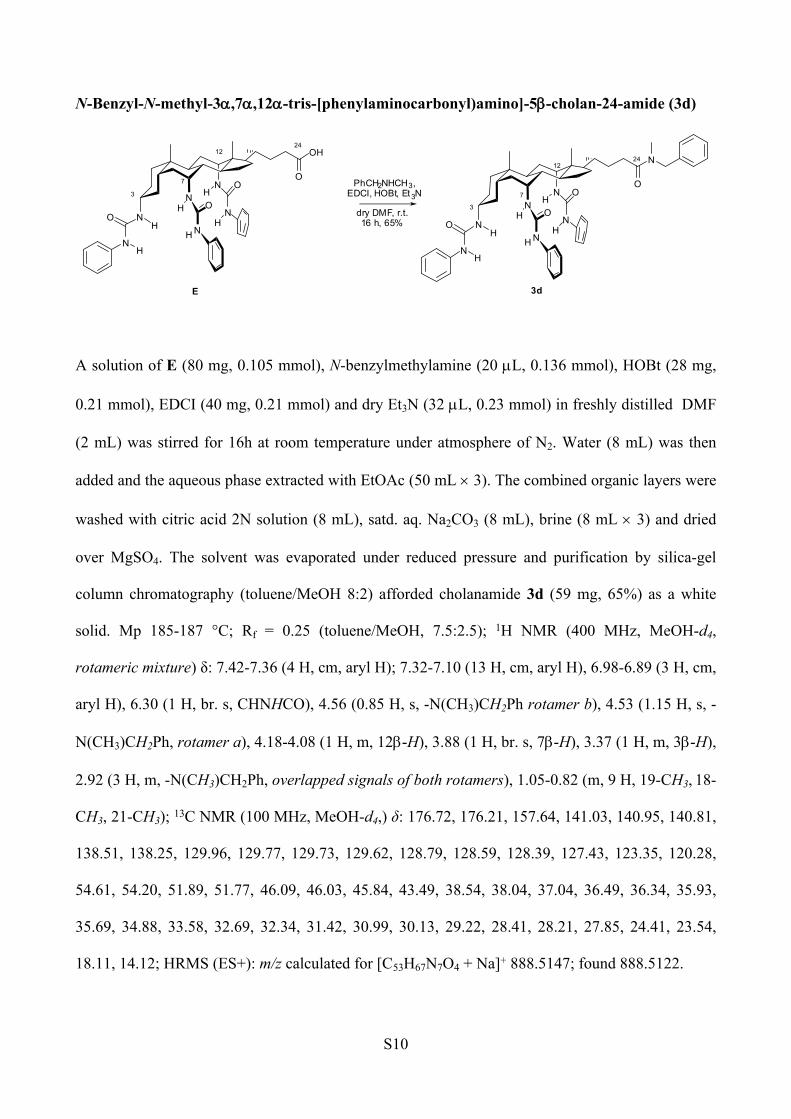
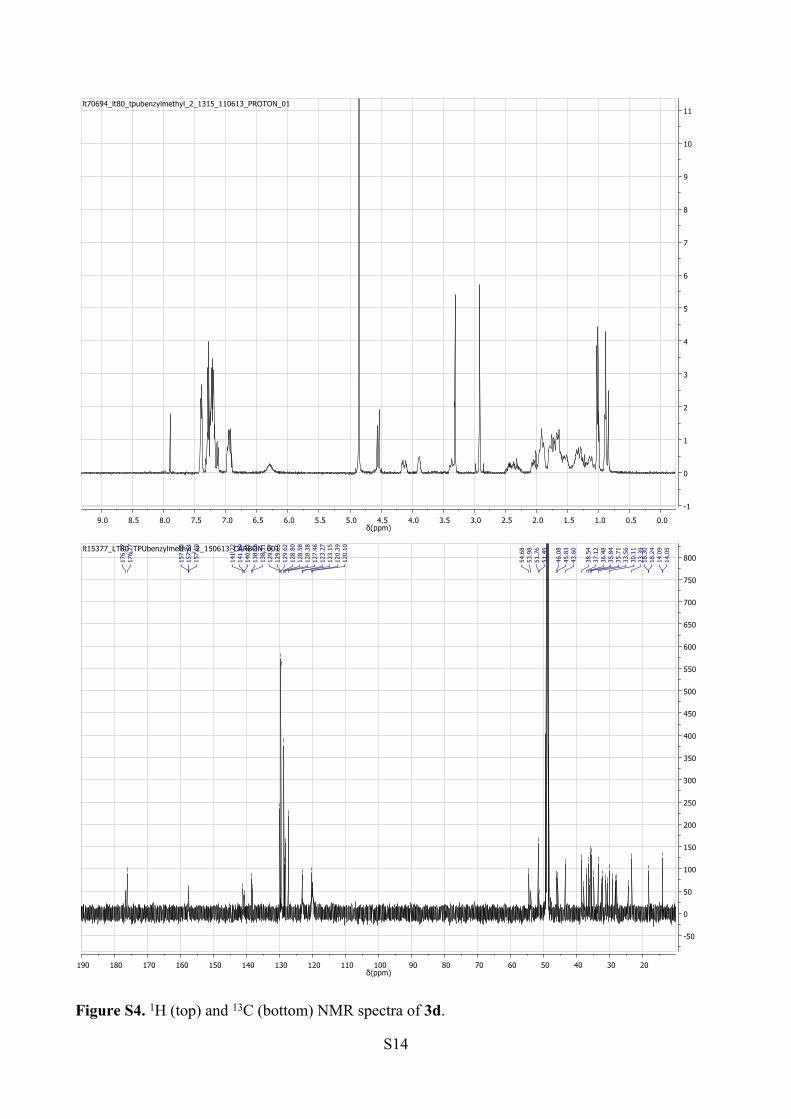
N-Benzyl-N-methyl-3,7,12-tris-[phenylaminocarbonyl)amino]-5-cholan-24-amide (3d)
NH
NN
O
N
O
O
N
N
HH
H
H
O
N
3
7
1224
3d
H
NH
NN
O
OH
O
O
N
N
HH
H
H
O
N
3
7
1224
H
E
PhCH2NHCH3, EDCI, HOBt, Et3N
dry DMF, r.t.16 h, 65%
A solution of E (80 mg, 0.105 mmol), N-benzylmethylamine (20 L, 0.136 mmol), HOBt (28 mg,
0.21 mmol), EDCI (40 mg, 0.21 mmol) and dry Et3N (32 L, 0.23 mmol) in freshly distilled DMF
(2 mL) was stirred for 16h at room temperature under atmosphere of N2. Water (8 mL) was then
added and the aqueous phase extracted with EtOAc (50 mL 3). The combined organic layers were
washed with citric acid 2N solution (8 mL), satd. aq. Na2CO3 (8 mL), brine (8 mL 3) and dried
over MgSO4. The solvent was evaporated under reduced pressure and purification by silica-gel
column chromatography (toluene/MeOH 8:2) afforded cholanamide 3d (59 mg, 65%) as a white
solid. Mp 185-187 °C; Rf = 0.25 (toluene/MeOH, 7.5:2.5); 1H NMR (400 MHz, MeOH-d4,
rotameric mixture) δ: 7.42-7.36 (4 H, cm, aryl H); 7.32-7.10 (13 H, cm, aryl H), 6.98-6.89 (3 H, cm,
aryl H), 6.30 (1 H, br. s, CHNHCO), 4.56 (0.85 H, s, -N(CH3)CH2Ph rotamer b), 4.53 (1.15 H, s, -
N(CH3)CH2Ph, rotamer a), 4.18-4.08 (1 H, m, 12-H), 3.88 (1 H, br. s, 7-H), 3.37 (1 H, m, 3-H),
2.92 (3 H, m, -N(CH3)CH2Ph, overlapped signals of both rotamers), 1.05-0.82 (m, 9 H, 19-CH3, 18-
CH3, 21-CH3); 13C NMR (100 MHz, MeOH-d4,) δ: 176.72, 176.21, 157.64, 141.03, 140.95, 140.81,
138.51, 138.25, 129.96, 129.77, 129.73, 129.62, 128.79, 128.59, 128.39, 127.43, 123.35, 120.28,
54.61, 54.20, 51.89, 51.77, 46.09, 46.03, 45.84, 43.49, 38.54, 38.04, 37.04, 36.49, 36.34, 35.93,
35.69, 34.88, 33.58, 32.69, 32.34, 31.42, 30.99, 30.13, 29.22, 28.41, 28.21, 27.85, 24.41, 23.54,
18.11, 14.12; HRMS (ES+): m/z calculated for [C53H67N7O4 + Na]+ 888.5147; found 888.5122.
S11
2. NMR spectra of compounds 3
0.51.01.52.02.53.03.54.04.55.05.56.06.57.07.58.0δ(ppm)
0.00
0.05
0.10
0.15
0.20
0.25
0.30
0.35
0.40
0.45
ad/lt3777_LT60_tpunhch3_2052_200513single_pulse
-100102030405060708090100110120130140150160170180190δ(ppm)
-0.05
0.00
0.05
0.10
0.15
0.20
0.25
0.30
0.35
0.40
0.45
0.50
0.55
0.60ad/lt4908_lt60_tpunhch3_2052_180613single pulse decoupled gated NOE 13
.89
18.3
623
.27
24.3
426
.31
27.9
628
.33
29.2
430
.17
33.0
633
.37
33.7
235
.79
36.3
637
.16
37.6
538
.53
43.7
045
.83
45.9
251
.30
53.6
9
119.
3811
9.62
120.
0612
2.89
122.
9812
3.16
129.
7012
9.73
141.
0114
1.28
141.
30
157.
5715
7.67
157.
72
177.
44
Figure S1. 1H (top) and 13C (bottom) NMR spectra of 3a.
S12
0.00.51.01.52.02.53.03.54.04.55.05.56.06.57.07.58.08.59.0δ(ppm)
-1
0
1
2
3
4
5
6
7
8
9
10
11
12lb57695_p25_1bwashed_PROTON_001
-100102030405060708090100110120130140150160170180190200δ(ppm)
-1
0
1
2
3
4
5
6
7
8
9
10
11
12
13
14
15
16
17
18
19
20
21
22
23
24lb57695_p25_1bwashed_CARBON_001
14.1
3
17.6
523
.68
24.1
227
.55
28.1
128
.81
32.7
933
.76
33.8
935
.87
35.9
536
.63
37.5
838
.30
42.9
743
.39
45.5
545
.62
46.9
849
.24
52.0
953
.75
118.
5211
8.72
118.
9512
2.03
122.
1312
2.23
127.
6012
8.26
129.
1212
9.43
129.
5312
9.55
140.
7814
1.44
141.
7314
1.88
155.
1915
5.44
155.
60
173.
46
Figure S2. 1H (top) and 13C (bottom) NMR spectra of 3b.
S13
0.00.51.01.52.02.53.03.54.04.55.05.56.06.57.07.58.0δ(ppm)
-10
0
10
20
30
40
50
60
70
80
90
100
110
120
130
140
150
160lt15437_LT83-TPUNMe2_3262_200613_PROTON_001
-20-100102030405060708090100110120130140150160170180190200210220δ(ppm)
-1000
0
1000
2000
3000
4000
5000
6000
7000
8000
9000
10000
11000
12000
13000lt15437_LT83-TPUNMe2_3262_200613_CARBON_001
13.9
018
.44
23.3
024
.39
28.0
128
.44
29.2
830
.21
30.9
032
.25
33.3
835
.77
35.8
336
.54
37.1
837
.69
37.9
538
.55
43.7
545
.83
46.0
451
.35
53.7
1
119.
4911
9.68
120.
1012
2.89
122.
9812
3.16
129.
1512
9.32
129.
6912
9.70
129.
9314
1.04
141.
3214
1.36
157.
5915
7.68
157.
72
176.
34
Fi
gure S3. 1H (top) and 13C (bottom) NMR spectra of 3c.
S14
0.00.51.01.52.02.53.03.54.04.55.05.56.06.57.07.58.08.59.0δ(ppm)
-1
0
1
2
3
4
5
6
7
8
9
10
11lt70694_lt80_tpubenzylmethyl_2_1315_110613_PROTON_01
2030405060708090100110120130140150160170180190δ(ppm)
-50
0
50
100
150
200
250
300
350
400
450
500
550
600
650
700
750
800lt15377_LT80_TPUbenzylmethyl_2_150613_CARBON_001
14.0
514
.09
18.2
418
.30
23.3
930
.11
33.5
635
.71
35.8
436
.48
37.1
238
.54
43.6
045
.83
46.0
8
51.4
551
.76
53.9
854
.68
120.
1012
0.39
123.
1512
3.27
127.
4612
8.38
128.
5812
8.80
129.
6212
9.65
129.
9713
8.31
138.
5614
0.83
141.
0914
1.22
157.
6015
7.64
157.
65
176.
2717
6.77
Figure S4. 1H (top) and 13C (bottom) NMR spectra of 3d.
S15
3. Crystallisation and analysis of crystals
Crystallisation procedure. Mixtures of cholanamides 3 and the prototype tris-urea 1a were
prepared by dissolving in hot acetone the two compounds in the desired molar ratio: 1:1, 1:2 and 1:5
of 3 to 1a. Water was added dropwise until the mixture appeared cloudy, the sufficient acetone
added to redissolve the precipitate. A compressed seal of hydrophilic cotton was used to close the
vials, in order to permit a slow evaporation of the solvent. For the mixtures 1a:3c,d = 2:1 and
1a:3a-d = 5:1, needle-like crystals started growing within two days. When crystallisation appeared
complete the crystals were isolated by filtration, washed with ice-cold acetone, dried and stored in a
vial. For the remaining mixtures the acetone evaporation led only to the precipitation of the
compounds as amorphous solids.
Analysis of crystals. Crystals were analysed by 1H NMR spectroscopy to reveal the bulk
composition. Relevant portions of the spectra are shown in Figs. S5, S7, S9, S11, S13 and S15
below. In each case a single crystal was subjected by ESI-MS to confirm the presence of both the
two components in individual crystals (see Figs. S6, S8, S10, S12, S14 and S16 below). Crystals
from mixtures 1a:3c,d = 2:1 and 1a:3b-d = 5:1 were also subjected to single crystal X-Ray
diffraction (SCXRD) analysis to confirm the space group and determine unit cell dimensions.
SCXRD was collected in EHI of Station 119 of Diamond Light Source on a Rigaku Saturn CCD
diffractometer ( = 0.68890 Å) after submission through the rapid-access program.4 The programs
CrystalClear and CrysAlisPro were used for collecting frames of data, indexing reflections, and
determining lattice parameters, and structures were solved by direct methods using SHELXS-86
and refined by full-matrix least-squares on F2 using SHELXS-97.5,6 In each case the solved
structure was essentially identical to that of pure 1a, as reported previously.7
S16
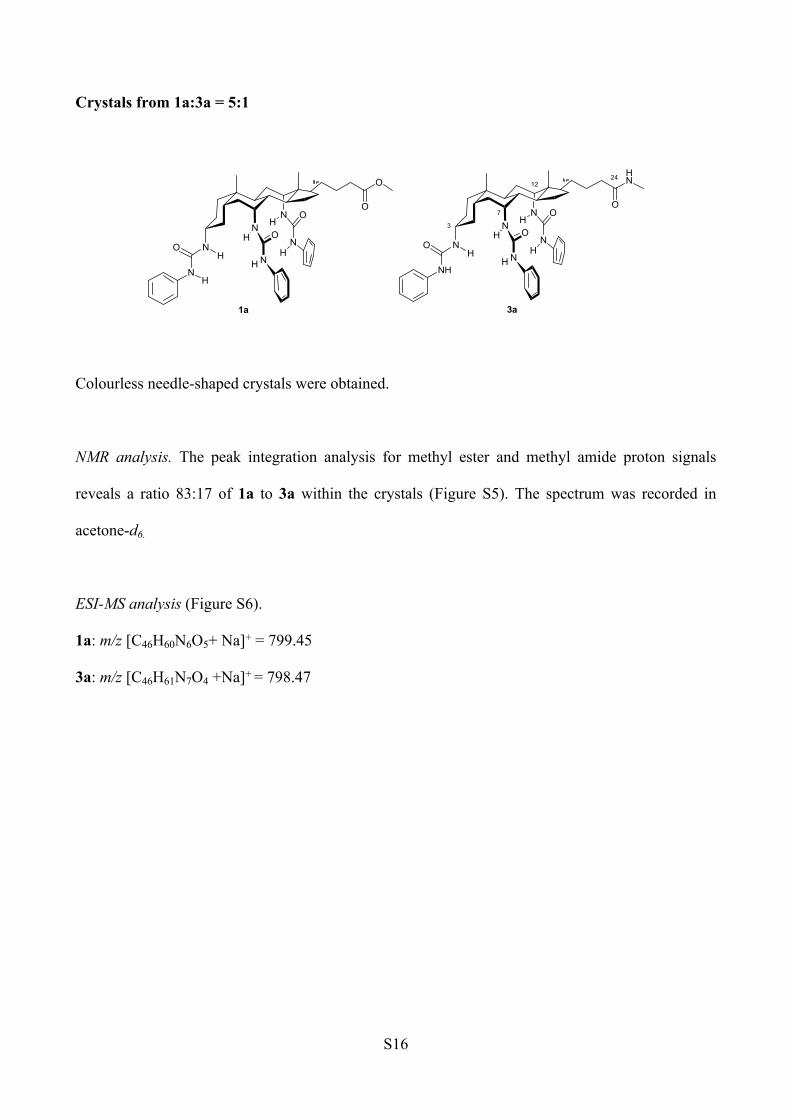
Crystals from 1a:3a = 5:1
NH
NN
O
O
O
O
N
N
HH
HH
O
N
1a
H
NH
NN
O
HN
O
O
N
N
HH
HH
O
NH
3
7
1224
3a
Colourless needle-shaped crystals were obtained.
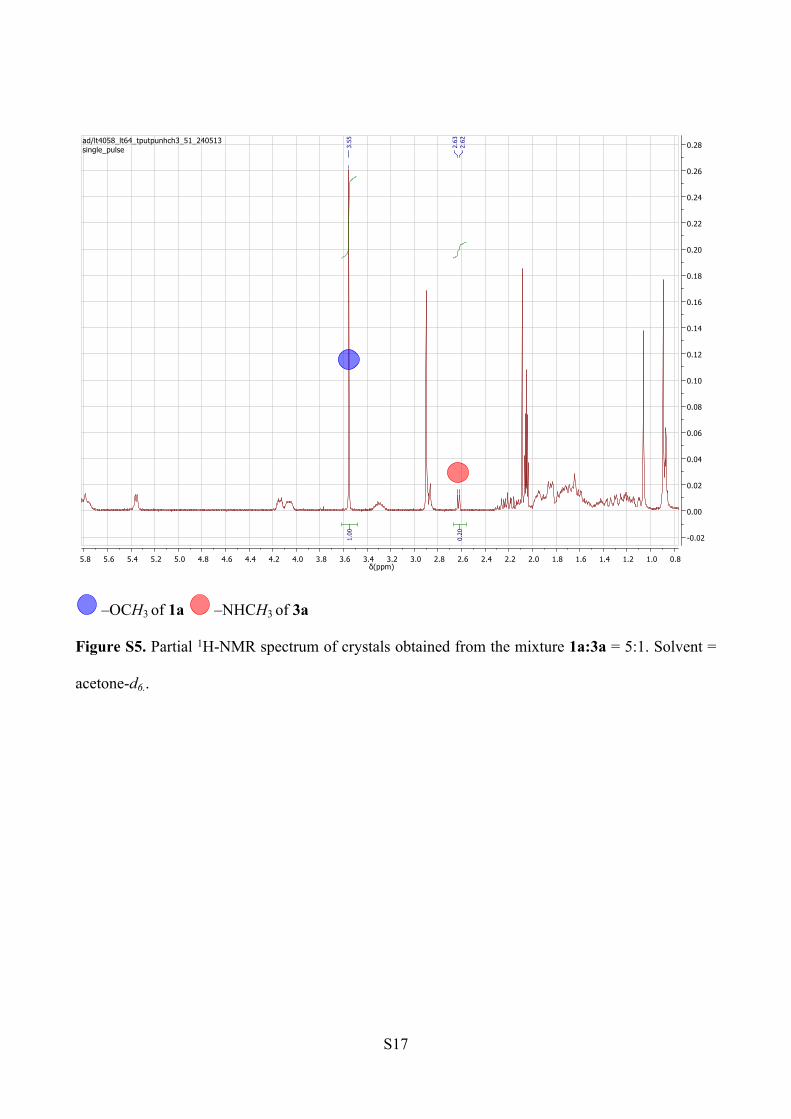
NMR analysis. The peak integration analysis for methyl ester and methyl amide proton signals
reveals a ratio 83:17 of 1a to 3a within the crystals (Figure S5). The spectrum was recorded in
acetone-d6.
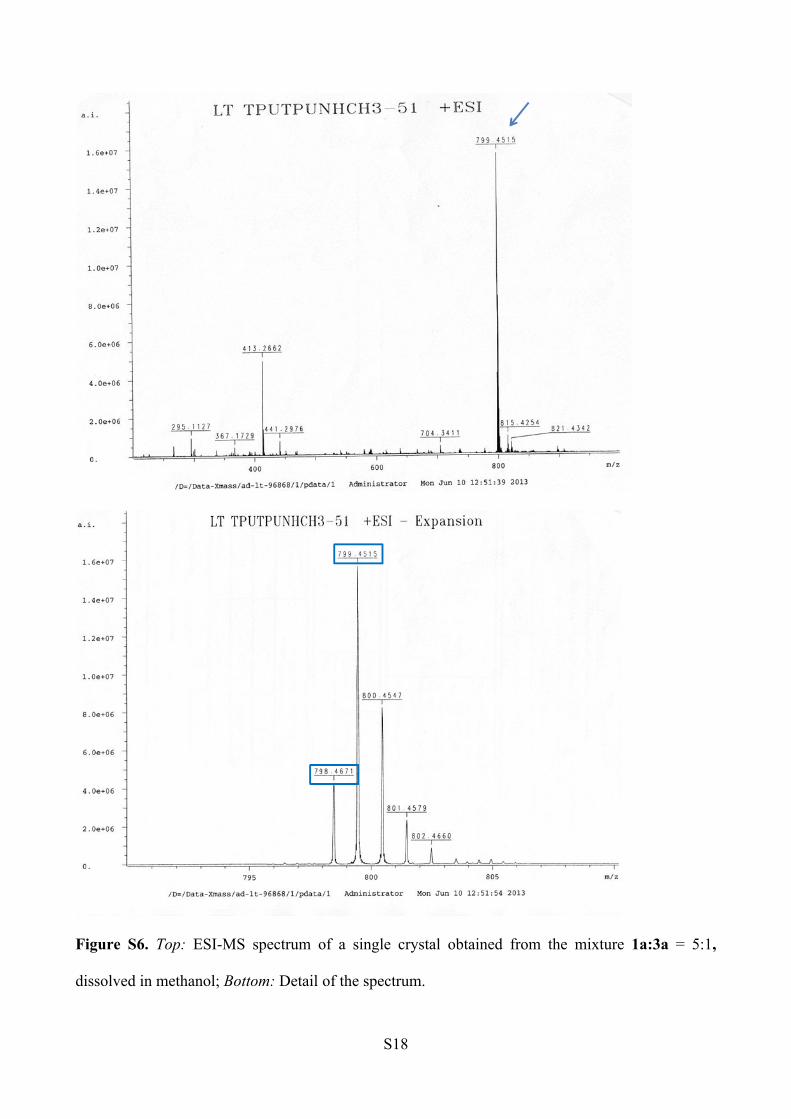
ESI-MS analysis (Figure S6).
1a: m/z [C46H60N6O5+ Na]+ = 799.45
3a: m/z [C46H61N7O4 +Na]+ = 798.47
S17
0.81.01.21.41.61.82.02.22.42.62.83.03.23.43.63.84.04.24.44.64.85.05.25.45.65.8δ(ppm)
-0.02
0.00
0.02
0.04
0.06
0.08
0.10
0.12
0.14
0.16
0.18
0.20
0.22
0.24
0.26
0.28ad/lt4058_lt64_tputpunhch3_51_240513single_pulse
0.20
1.00
2.62
2.63
3.55
–OCH3 of 1a –NHCH3 of 3a
Figure S5. Partial 1H-NMR spectrum of crystals obtained from the mixture 1a:3a = 5:1. Solvent =
acetone-d6..
S18
Figure S6. Top: ESI-MS spectrum of a single crystal obtained from the mixture 1a:3a = 5:1,
dissolved in methanol; Bottom: Detail of the spectrum.
S19
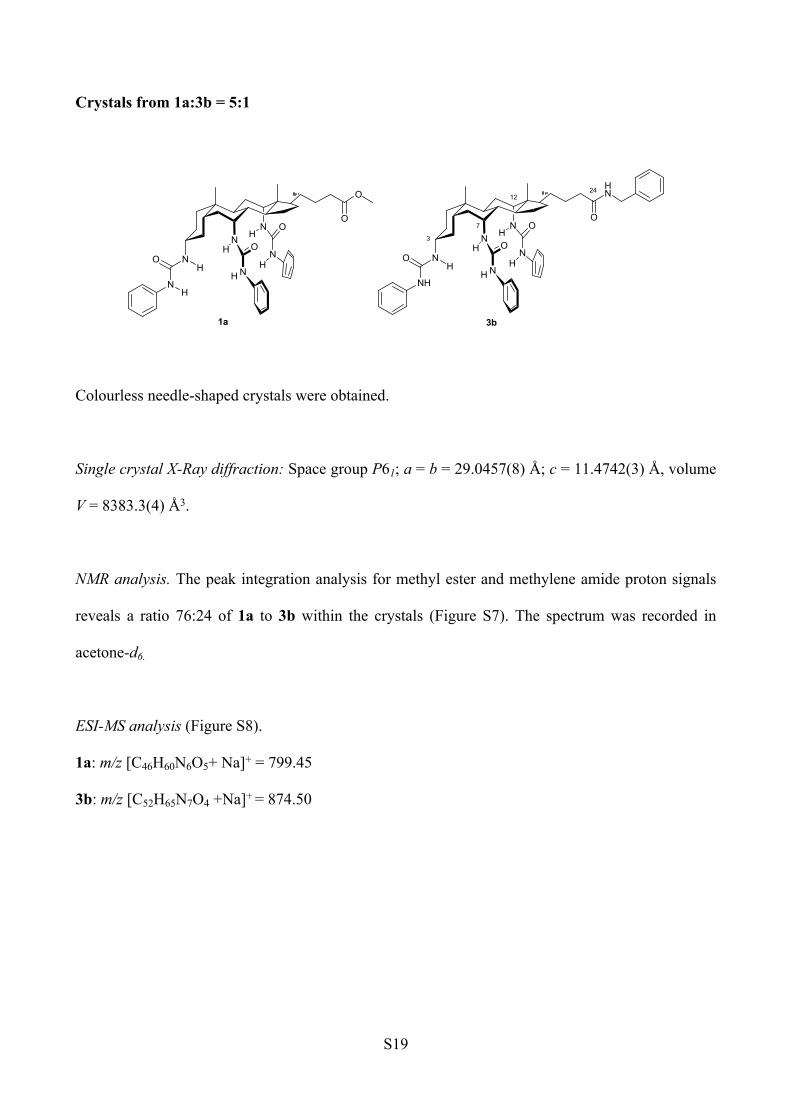
Crystals from 1a:3b = 5:1
NH
NN
O
O
O
O
N
N
HH
HH
O
N
1a
H
NH
NN
O
HN
O
O
N
N
HH
HH
O
NH
3
7
1224
3b
Colourless needle-shaped crystals were obtained.
Single crystal X-Ray diffraction: Space group P61; a = b = 29.0457(8) Å; c = 11.4742(3) Å, volume
V = 8383.3(4) Å3.
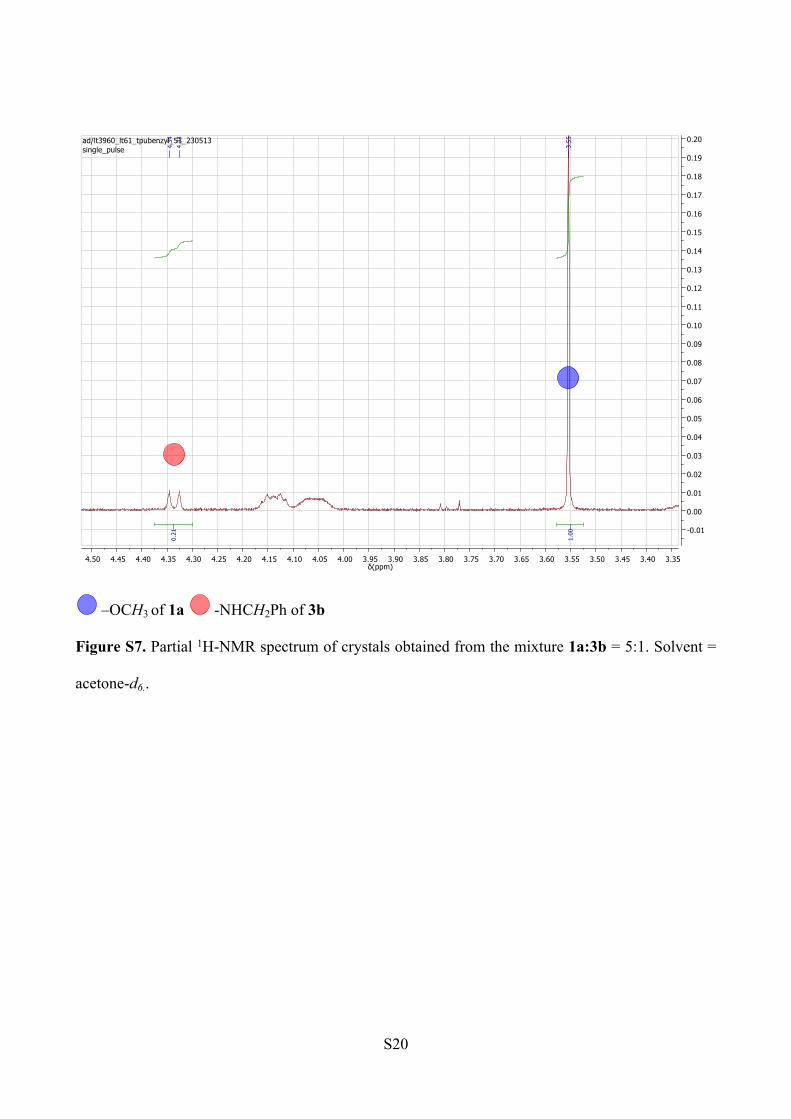
NMR analysis. The peak integration analysis for methyl ester and methylene amide proton signals
reveals a ratio 76:24 of 1a to 3b within the crystals (Figure S7). The spectrum was recorded in
acetone-d6.
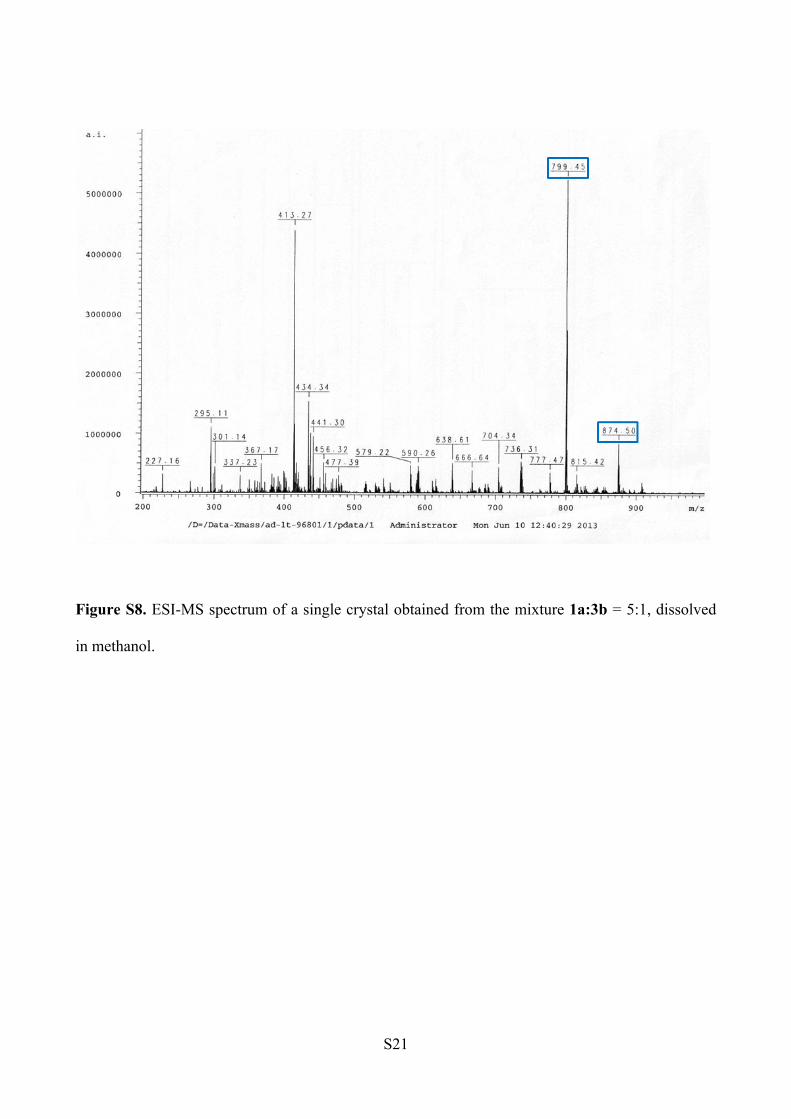
ESI-MS analysis (Figure S8).
1a: m/z [C46H60N6O5+ Na]+ = 799.45
3b: m/z [C52H65N7O4 +Na]+ = 874.50
S20
3.353.403.453.503.553.603.653.703.753.803.853.903.954.004.054.104.154.204.254.304.354.404.454.50δ(ppm)
-0.01
0.00
0.01
0.02
0.03
0.04
0.05
0.06
0.07
0.08
0.09
0.10
0.11
0.12
0.13
0.14
0.15
0.16
0.17
0.18
0.19
0.20ad/lt3960_lt61_tpubenzyl_51_230513single_pulse
1.00
0.21
3.55
4.33
4.34
–OCH3 of 1a -NHCH2Ph of 3b
Figure S7. Partial 1H-NMR spectrum of crystals obtained from the mixture 1a:3b = 5:1. Solvent =
acetone-d6..
S21
Figure S8. ESI-MS spectrum of a single crystal obtained from the mixture 1a:3b = 5:1, dissolved
in methanol.
S22
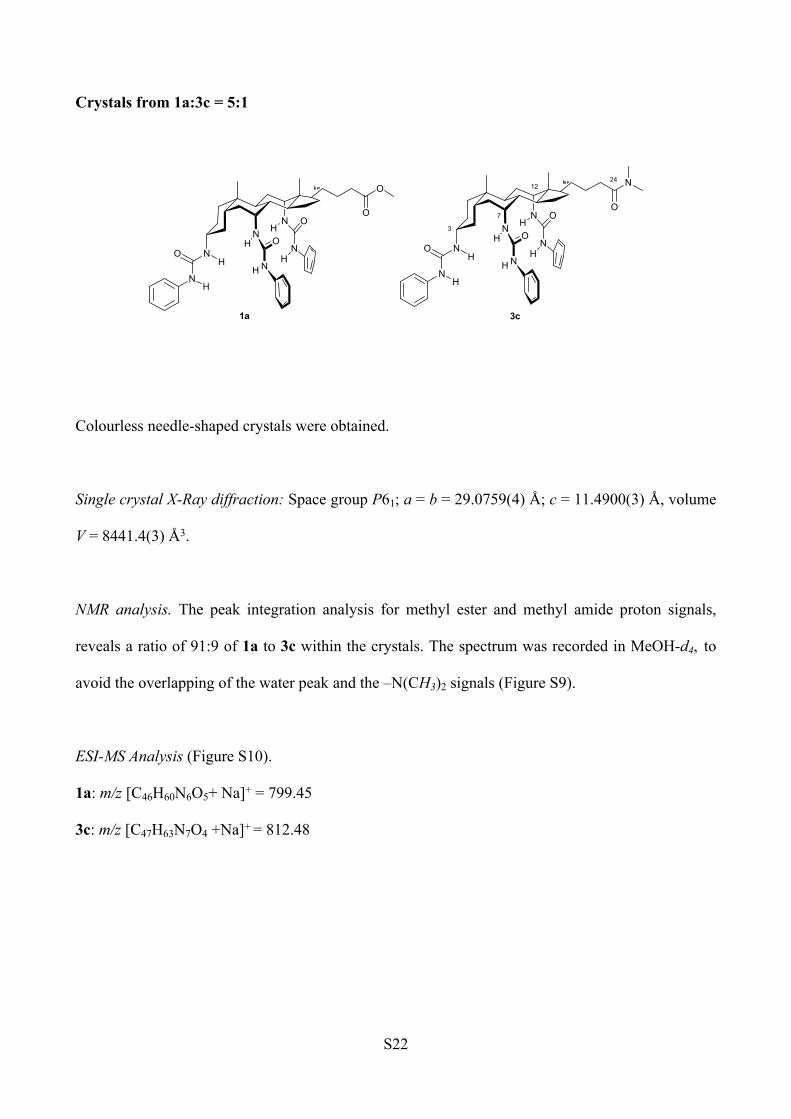
Crystals from 1a:3c = 5:1
NH
NN
O
O
O
O
N
N
HH
HH
O
N
1a
H
NH
NN
O
N
O
O
N
N
HH
HH
O
N
3
7
1224
3c
H
Colourless needle-shaped crystals were obtained.
Single crystal X-Ray diffraction: Space group P61; a = b = 29.0759(4) Å; c = 11.4900(3) Å, volume
V = 8441.4(3) Å3.
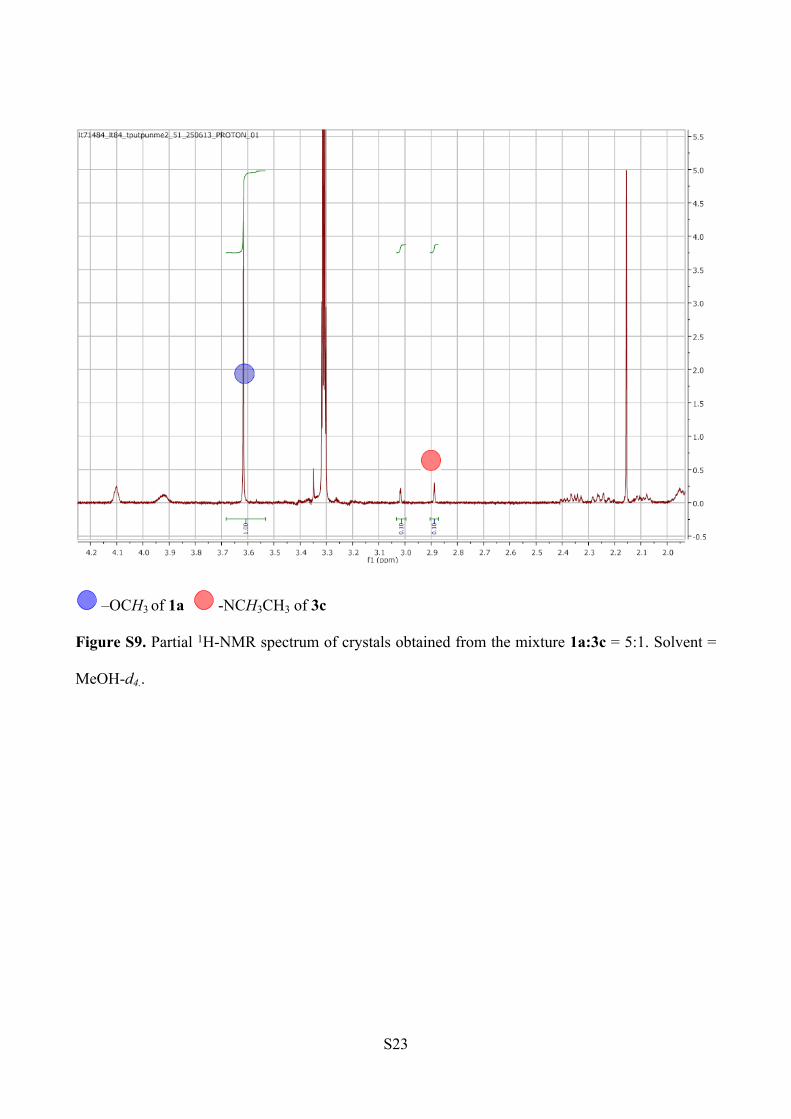
NMR analysis. The peak integration analysis for methyl ester and methyl amide proton signals,
reveals a ratio of 91:9 of 1a to 3c within the crystals. The spectrum was recorded in MeOH-d4, to
avoid the overlapping of the water peak and the –N(CH3)2 signals (Figure S9).
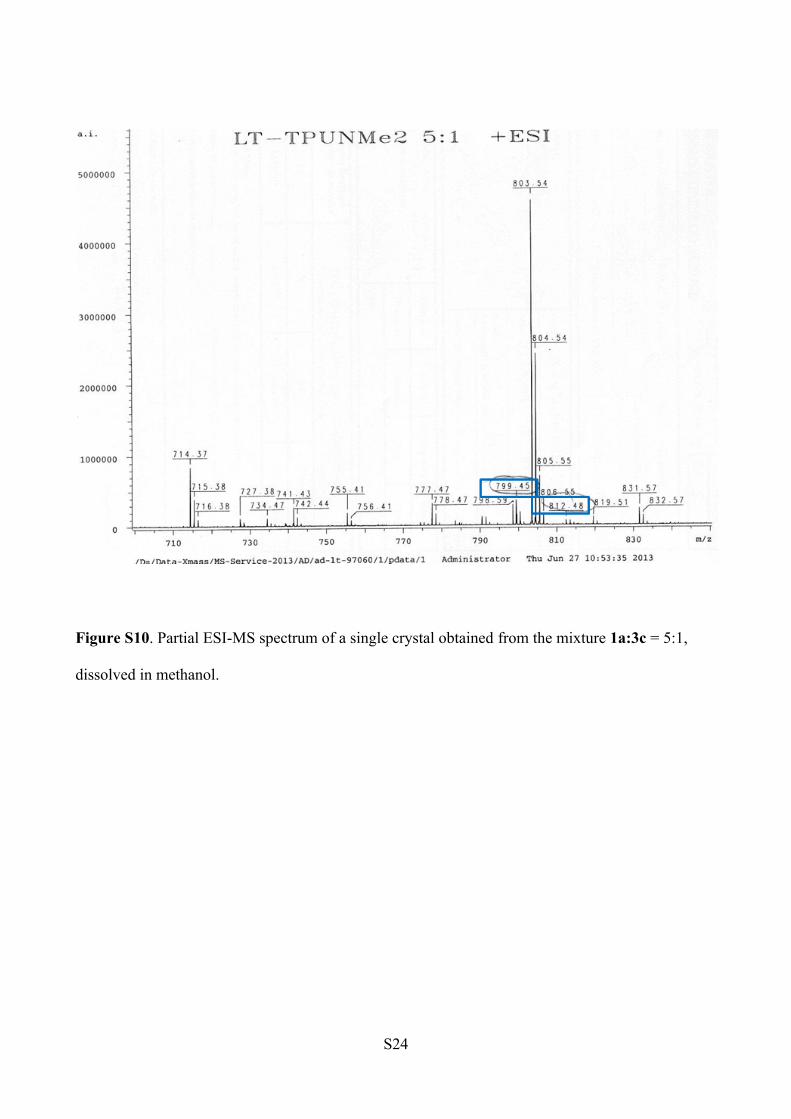
ESI-MS Analysis (Figure S10).
1a: m/z [C46H60N6O5+ Na]+ = 799.45
3c: m/z [C47H63N7O4 +Na]+ = 812.48
S23
–OCH3 of 1a -NCH3CH3 of 3c
Figure S9. Partial 1H-NMR spectrum of crystals obtained from the mixture 1a:3c = 5:1. Solvent =
MeOH-d4..
S24
Figure S10. Partial ESI-MS spectrum of a single crystal obtained from the mixture 1a:3c = 5:1,
dissolved in methanol.

S25
Crystals from 1a:3c = 2:1
NH
NN
O
O
O
O
N
N
HH
HH
O
N
1a
H
NH
NN
O
N
O
O
N
N
HH
HH
O
N
3
7
1224
3c
H
Colourless needle-shaped crystals were obtained.
Single crystal X-Ray diffraction: Space group P61; a = b = 29.0994(4) Å; c = 11.4992(3) Å, volume
V = 8432.7(3) Å3.
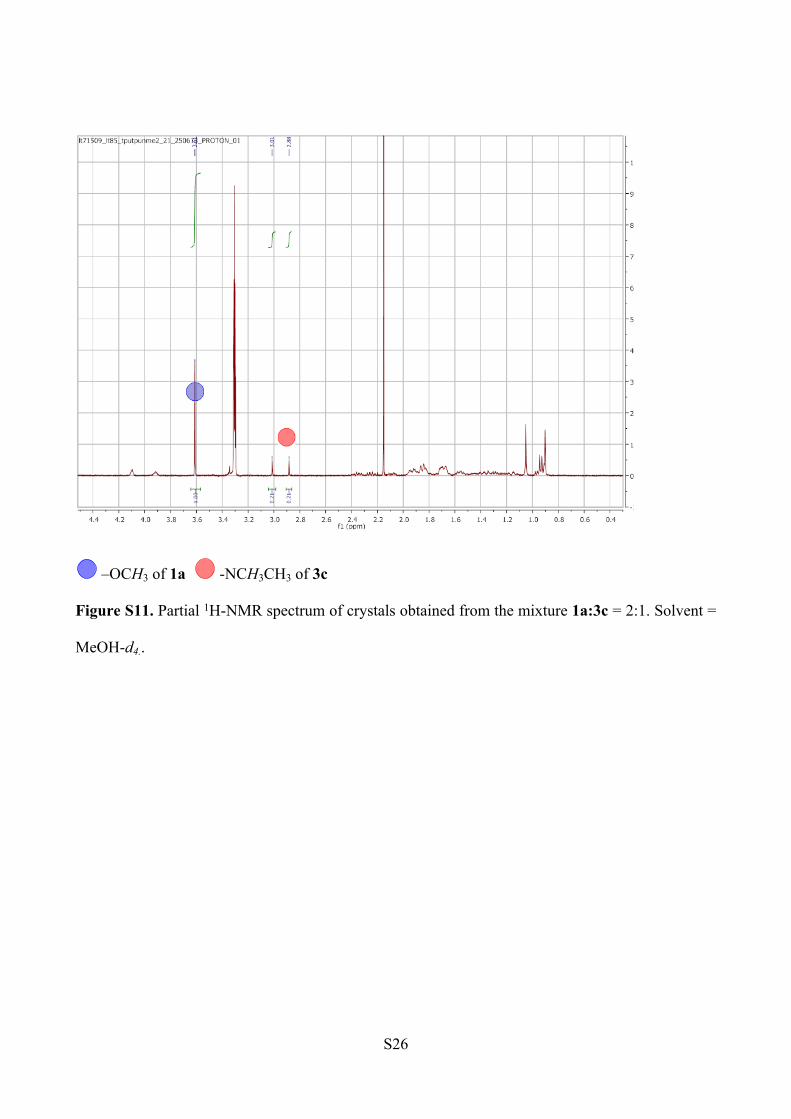
NMR analysis. The peak integration analysis for methyl ester and methyl amide proton signals,
reveals a ratio of 83:17 of 1a to 3c within the crystals. The spectrum was recorded in MeOH-d4, to
avoid the overlapping of the water peak and the –N(CH3)2 signals (Figure S11).
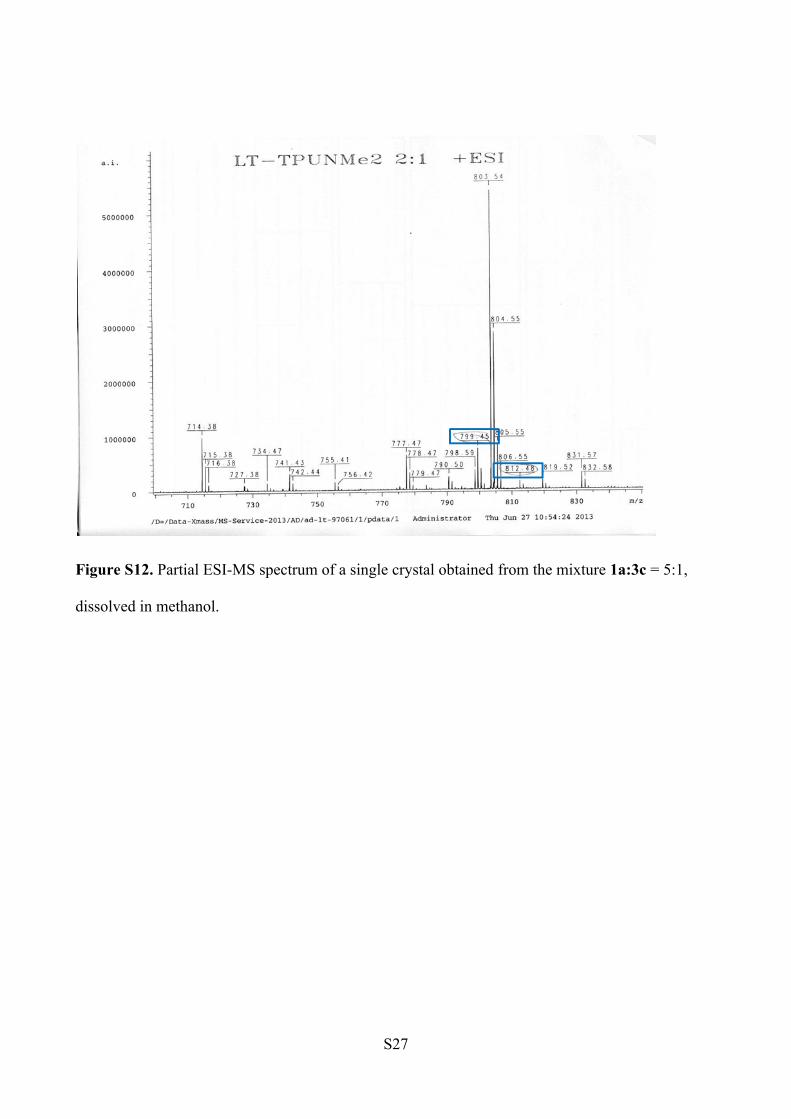
ESI-MS Analysis (Figure S12).
1a: m/z [C46H60N6O5+ Na]+ = 799.45
3c: m/z [C47H63N7O4 +Na]+ = 812.48
S26
–OCH3 of 1a -NCH3CH3 of 3c
Figure S11. Partial 1H-NMR spectrum of crystals obtained from the mixture 1a:3c = 2:1. Solvent =
MeOH-d4..
S27
Figure S12. Partial ESI-MS spectrum of a single crystal obtained from the mixture 1a:3c = 5:1,
dissolved in methanol.
S28
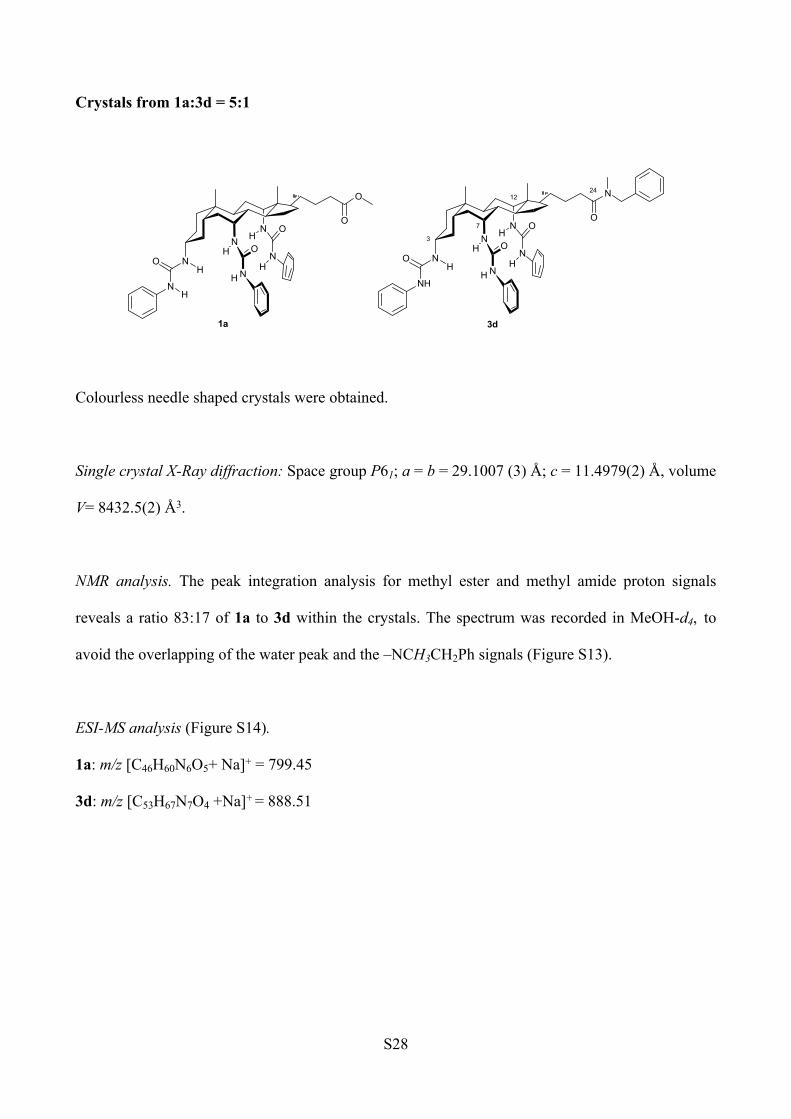
Crystals from 1a:3d = 5:1
NH
NN
O
O
O
O
N
N
HH
HH
O
N
1a
H
NH
NN
O
N
O
O
N
N
HH
HH
O
NH
3
7
1224
3d
Colourless needle shaped crystals were obtained.
Single crystal X-Ray diffraction: Space group P61; a = b = 29.1007 (3) Å; c = 11.4979(2) Å, volume
V= 8432.5(2) Å3.
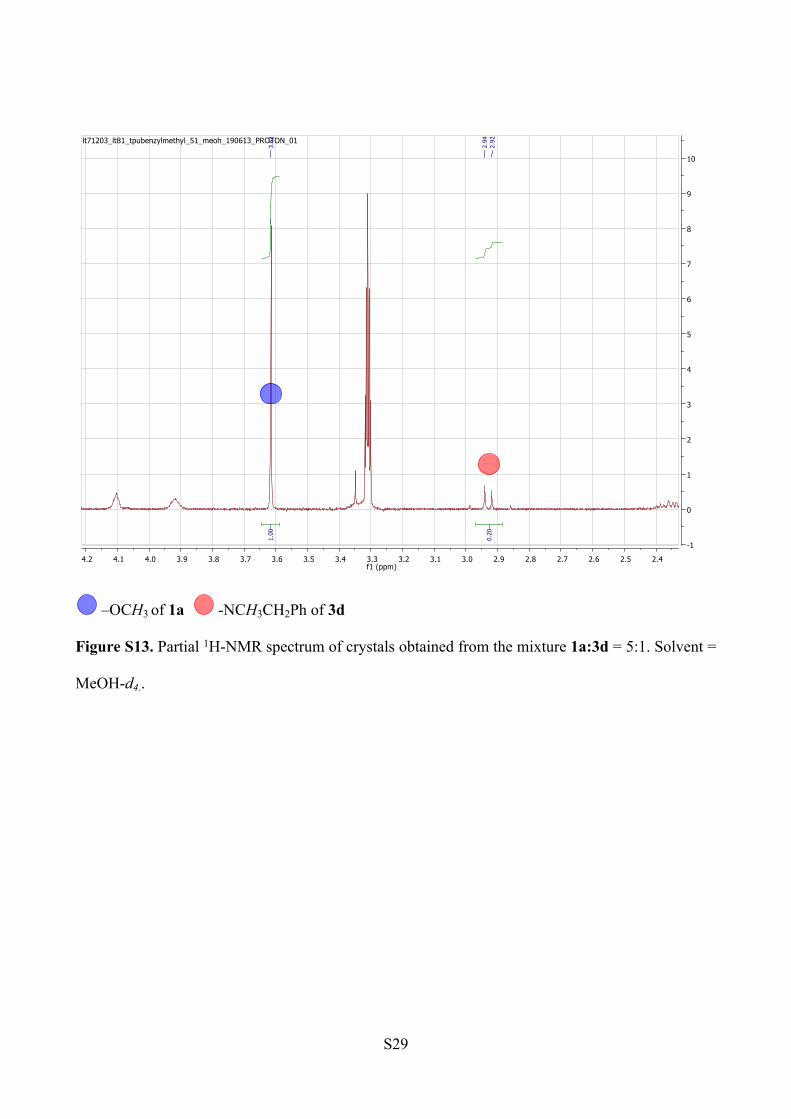
NMR analysis. The peak integration analysis for methyl ester and methyl amide proton signals
reveals a ratio 83:17 of 1a to 3d within the crystals. The spectrum was recorded in MeOH-d4, to
avoid the overlapping of the water peak and the –NCH3CH2Ph signals (Figure S13).
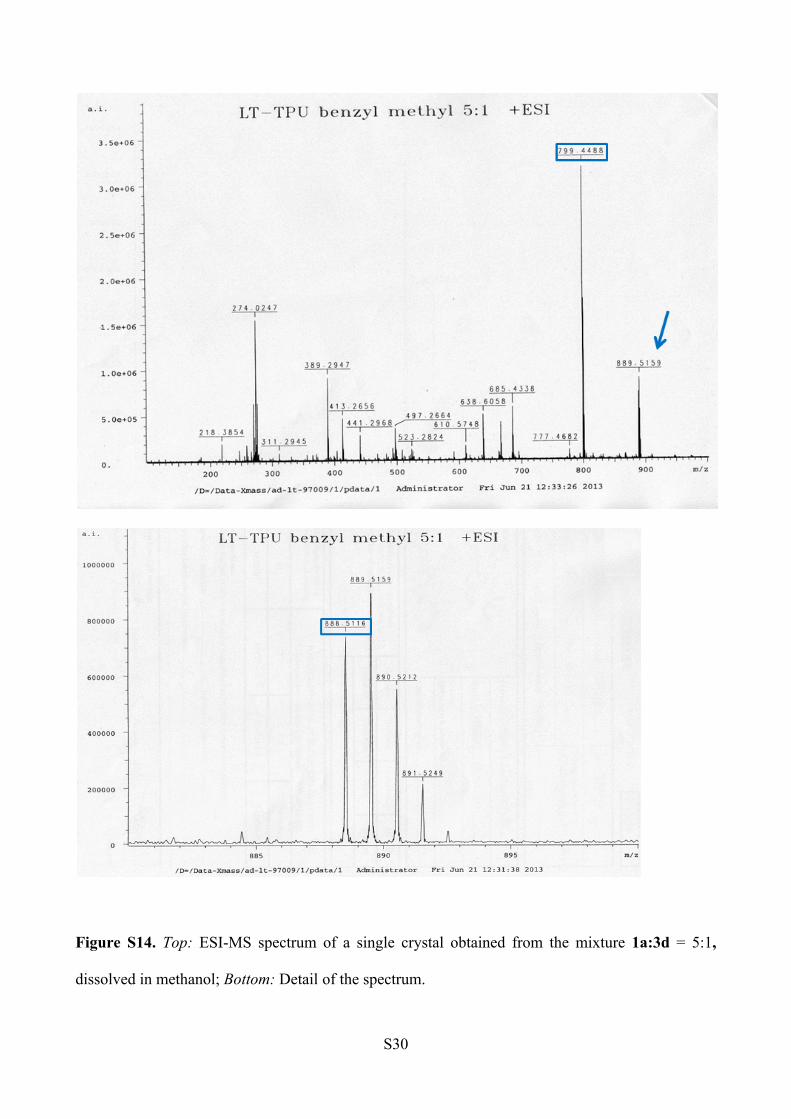
ESI-MS analysis (Figure S14).
1a: m/z [C46H60N6O5+ Na]+ = 799.45
3d: m/z [C53H67N7O4 +Na]+ = 888.51
S29
2.42.52.62.72.82.93.03.13.23.33.43.53.63.73.83.94.04.14.2f1 (ppm)
-1
0
1
2
3
4
5
6
7
8
9
10
lt71203_lt81_tpubenzylmethyl_51_meoh_190613_PROTON_01
0.20
1.00
2.92
2.94
3.62
–OCH3 of 1a -NCH3CH2Ph of 3d
Figure S13. Partial 1H-NMR spectrum of crystals obtained from the mixture 1a:3d = 5:1. Solvent =
MeOH-d4..
S30
Figure S14. Top: ESI-MS spectrum of a single crystal obtained from the mixture 1a:3d = 5:1,
dissolved in methanol; Bottom: Detail of the spectrum.
S31
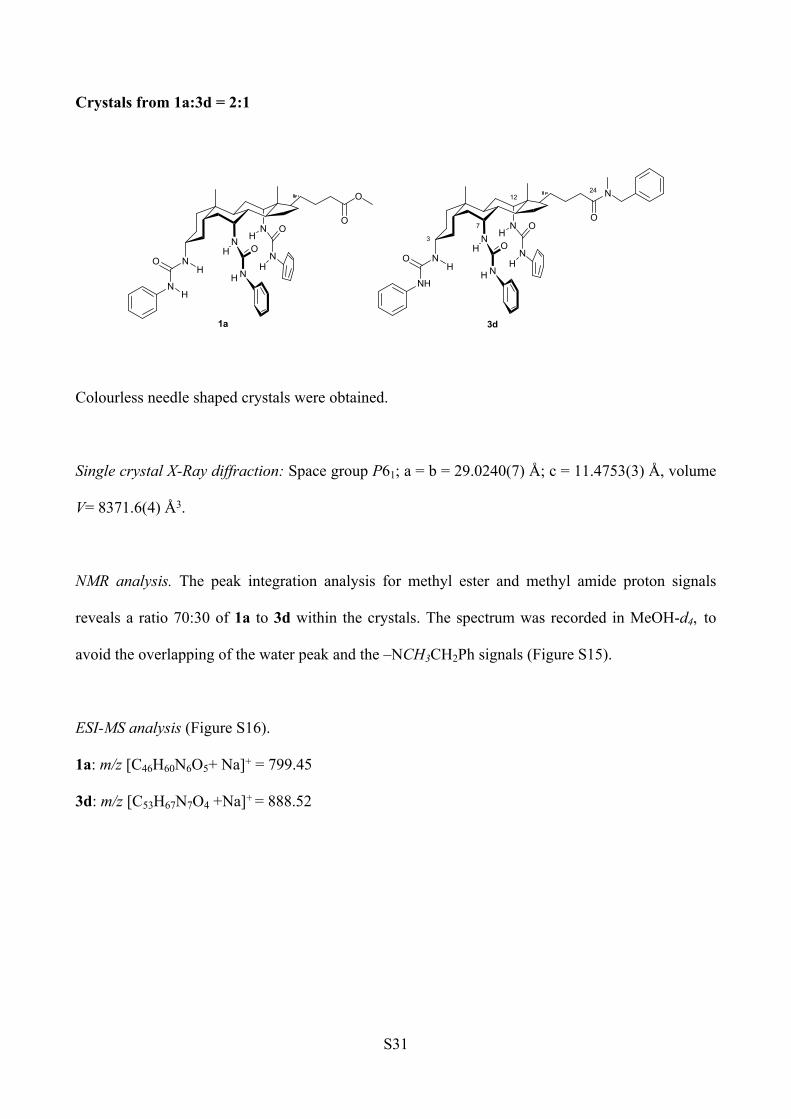
Crystals from 1a:3d = 2:1
NH
NN
O
O
O
O
N
N
HH
HH
O
N
1a
H
NH
NN
O
N
O
O
N
N
HH
HH
O
NH
3
7
1224
3d
Colourless needle shaped crystals were obtained.
Single crystal X-Ray diffraction: Space group P61; a = b = 29.0240(7) Å; c = 11.4753(3) Å, volume
V= 8371.6(4) Å3.
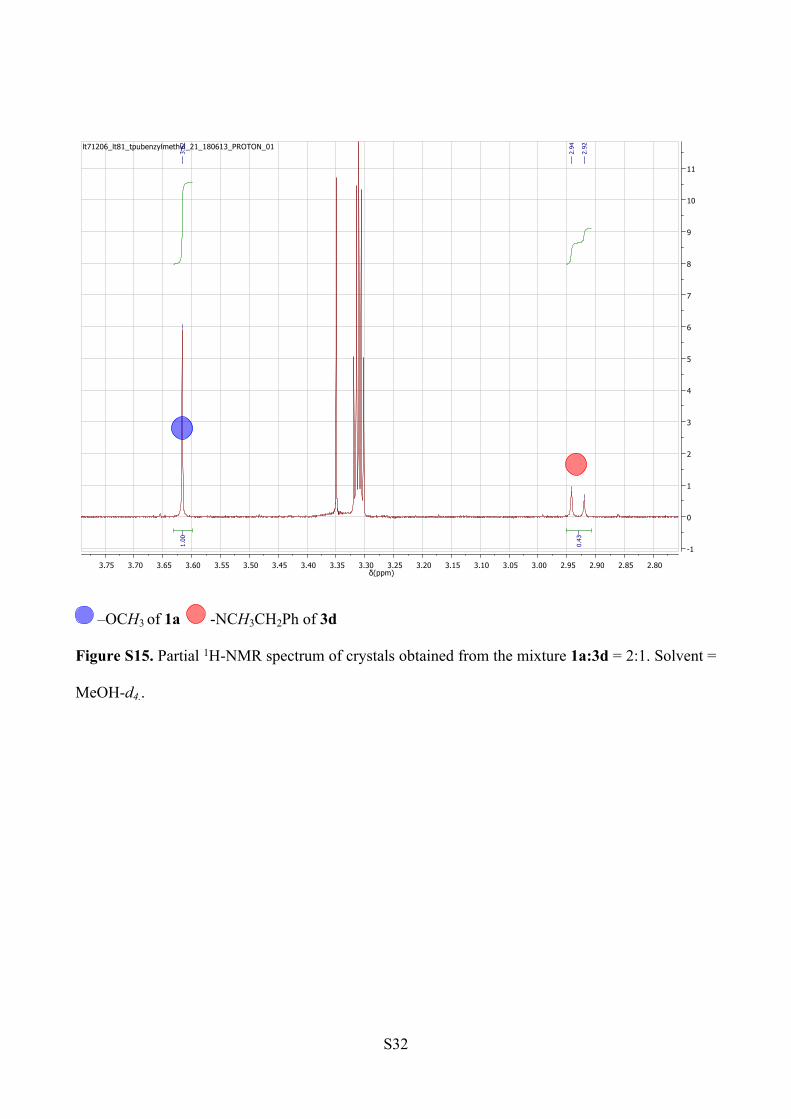
NMR analysis. The peak integration analysis for methyl ester and methyl amide proton signals
reveals a ratio 70:30 of 1a to 3d within the crystals. The spectrum was recorded in MeOH-d4, to
avoid the overlapping of the water peak and the –NCH3CH2Ph signals (Figure S15).
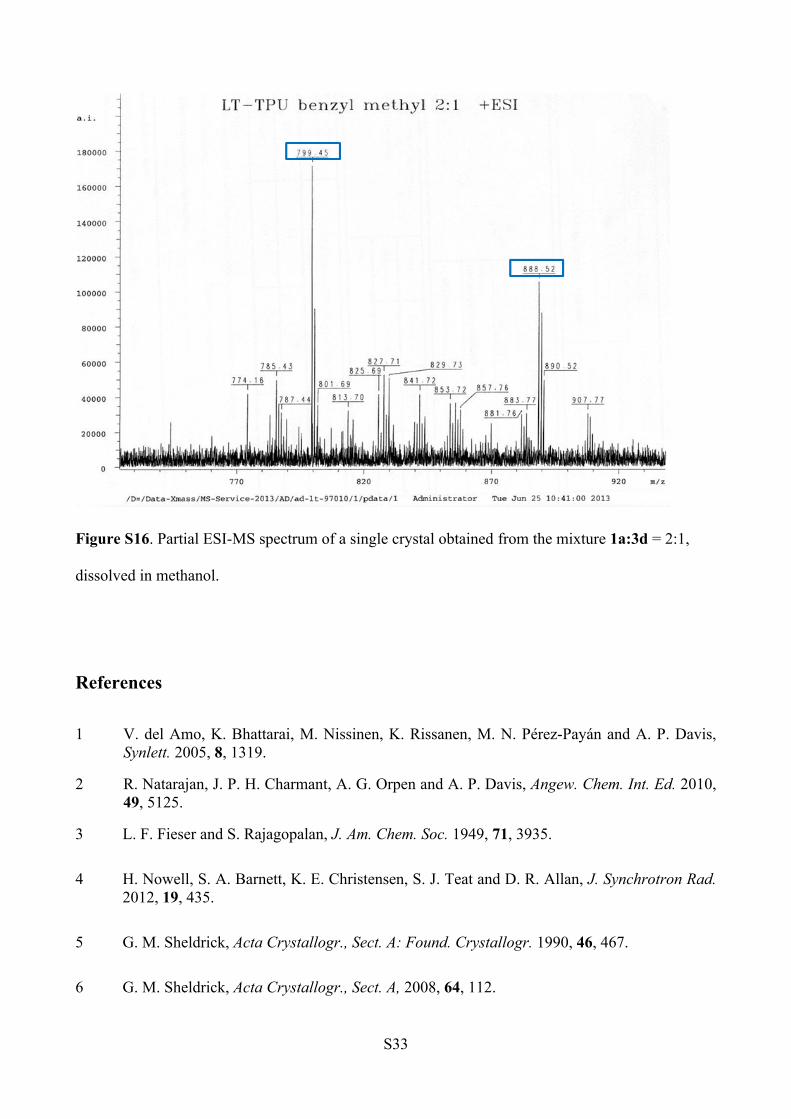
ESI-MS analysis (Figure S16).
1a: m/z [C46H60N6O5+ Na]+ = 799.45
3d: m/z [C53H67N7O4 +Na]+ = 888.52
S32
2.802.852.902.953.003.053.103.153.203.253.303.353.403.453.503.553.603.653.703.75δ(ppm)
-1
0
1
2
3
4
5
6
7
8
9
10
11
lt71206_lt81_tpubenzylmethyl_21_180613_PROTON_01
0.43
1.00
2.92
2.94
3.62
–OCH3 of 1a -NCH3CH2Ph of 3d
Figure S15. Partial 1H-NMR spectrum of crystals obtained from the mixture 1a:3d = 2:1. Solvent =
MeOH-d4..
S33
Figure S16. Partial ESI-MS spectrum of a single crystal obtained from the mixture 1a:3d = 2:1,
dissolved in methanol.
References
1 V. del Amo, K. Bhattarai, M. Nissinen, K. Rissanen, M. N. Pérez-Payán and A. P. Davis, Synlett. 2005, 8, 1319.
2 R. Natarajan, J. P. H. Charmant, A. G. Orpen and A. P. Davis, Angew. Chem. Int. Ed. 2010, 49, 5125.
3 L. F. Fieser and S. Rajagopalan, J. Am. Chem. Soc. 1949, 71, 3935.
4 H. Nowell, S. A. Barnett, K. E. Christensen, S. J. Teat and D. R. Allan, J. Synchrotron Rad. 2012, 19, 435.
5 G. M. Sheldrick, Acta Crystallogr., Sect. A: Found. Crystallogr. 1990, 46, 467.
6 G. M. Sheldrick, Acta Crystallogr., Sect. A, 2008, 64, 112.
S34
7 A. L. Sisson, V. del Amo Sanchez, G. Magro, A. M. E. Griffin, S. Shah, J. P. H. Charmant and A. P. Davis, Angew. Chem., Int. Ed., 2005, 44, 6878.