The purpose of experimentation was to determine which carbon source - glucose, glycerol, or maple...
3
The purpose of experimentation was to determine which carbon source - glucose, The purpose of experimentation was to determine which carbon source - glucose, glycerol, or maple syrup - caused glycerol, or maple syrup - caused Bacillus megaterium Bacillus megaterium to produce the most poly- to produce the most poly- β- β- hydroxybutyric acid (PHB) by utilizing a UV spectrophotometer to compare the hydroxybutyric acid (PHB) by utilizing a UV spectrophotometer to compare the differing absorbance values of the bacterial byproducts at 235 nm differing absorbance values of the bacterial byproducts at 235 nm and by employing and by employing a standard curve to calculate the dry weight of PHB in each media. One of the a standard curve to calculate the dry weight of PHB in each media. One of the ultimate goals of experimentation was to ascertain an inexpensive method to ultimate goals of experimentation was to ascertain an inexpensive method to produce great quantities of PHB, which can be used to create biodegradable produce great quantities of PHB, which can be used to create biodegradable plastics. Each of the carbon sources chosen had a specific advantage. Glycerol is plastics. Each of the carbon sources chosen had a specific advantage. Glycerol is an undesirable byproduct of methanol and alkali catalysis, a methyl ester process an undesirable byproduct of methanol and alkali catalysis, a methyl ester process used to make biodiesel. Glucose is an easily accessible simple sugar, and maple used to make biodiesel. Glucose is an easily accessible simple sugar, and maple syrup is a plentiful natural product. Thus, PHB production would be beneficial in syrup is a plentiful natural product. Thus, PHB production would be beneficial in any one of the media, but the most advantageous result would be if the greatest any one of the media, but the most advantageous result would be if the greatest production was in the glycerol media so that the process of creating biodiesel production was in the glycerol media so that the process of creating biodiesel would have minimal negative side effects. Production of PHB in glucose would be would have minimal negative side effects. Production of PHB in glucose would be beneficial as well due to its accessibility, and maple syrup provides a natural beneficial as well due to its accessibility, and maple syrup provides a natural process of generating a nature-friendly plastic. The study demonstrates that the process of generating a nature-friendly plastic. The study demonstrates that the most effective carbon source was maple syrup for the media containing maple syrup most effective carbon source was maple syrup for the media containing maple syrup as a nutrient supplement led to the greatest production of PHB. as a nutrient supplement led to the greatest production of PHB. Bacillus megaterium Bacillus megaterium was cultivated in media that was was cultivated in media that was prepared using sodium phosphate dibasic, prepared using sodium phosphate dibasic, potassium phosphate monobasic, sodium chloride, potassium phosphate monobasic, sodium chloride, and ammonium chloride. The resultant broth was and ammonium chloride. The resultant broth was divided into four flasks, and a different divided into four flasks, and a different carbon source - maple syrup, glycerol, and carbon source - maple syrup, glycerol, and glucose - was added to each medium except the glucose - was added to each medium except the control in order to vary the nutrients each control in order to vary the nutrients each culture received. The bacteria were then culture received. The bacteria were then transferred into the broth and left to grow for transferred into the broth and left to grow for a week. During this period, a second trial was a week. During this period, a second trial was begun in which the media had more of each begun in which the media had more of each carbon source to determine if merely an carbon source to determine if merely an increase in the carbon source was enough to increase in the carbon source was enough to cause the bacteria to produce more PHB. cause the bacteria to produce more PHB. Therefore, the carbon to nitrogen ratio was Therefore, the carbon to nitrogen ratio was raised to 6:1. The third trial involved media raised to 6:1. The third trial involved media with nutrients derived from Tryptone Soya broth with nutrients derived from Tryptone Soya broth powder and then the various carbon sources powder and then the various carbon sources added later on, which would indicate if excess added later on, which would indicate if excess carbon sources as well as normal nutrients carbon sources as well as normal nutrients would cause increased PHB synthesis (Fig. 1). would cause increased PHB synthesis (Fig. 1). Blanks of the broths in the second and third Blanks of the broths in the second and third trials were created so subsequent growth in the trials were created so subsequent growth in the broth could be detected in a UV broth could be detected in a UV spectrophotometer. In order to speed the rate spectrophotometer. In order to speed the rate of their growth, the bacteria in rounds two and of their growth, the bacteria in rounds two and three were incubated at 38 °C for 24 hours. three were incubated at 38 °C for 24 hours. After 26 and 72 hours, the bacteria were After 26 and 72 hours, the bacteria were scanned in the spectrometer to see the amount scanned in the spectrometer to see the amount of growth over time. of growth over time. Bacterial Bacterial Growth Growth Introduction Introduction In order to create PHB suspensions, a vortexed sample In order to create PHB suspensions, a vortexed sample of each broth was extracted and centrifuged to isolate of each broth was extracted and centrifuged to isolate the bacteria (Fig. 2). The cell paste was resuspended the bacteria (Fig. 2). The cell paste was resuspended in a sodium hypochlorite solution for 1 hour at 37 °C, in a sodium hypochlorite solution for 1 hour at 37 °C, which lyses the bacteria’s cell walls. After being which lyses the bacteria’s cell walls. After being washed by water, acetone, and ethanol, the remaining washed by water, acetone, and ethanol, the remaining lipid granules were transferred into boiling lipid granules were transferred into boiling chloroform, which extracts the PHB and dissolves any chloroform, which extracts the PHB and dissolves any residual contaminants using the set-up (Fig. 3). residual contaminants using the set-up (Fig. 3). PHB Detection PHB Detection After five minutes, the chloroform After five minutes, the chloroform extract was filtered through 42.5 mm extract was filtered through 42.5 mm filter paper and dried on a hot plate. 10 filter paper and dried on a hot plate. 10 mL of 99% sulfuric acid was then added to mL of 99% sulfuric acid was then added to the extract, and this mixture was heated the extract, and this mixture was heated and stirred, converting PHB to crotonic and stirred, converting PHB to crotonic acid (Fig. 4). This solution was compared acid (Fig. 4). This solution was compared against a sulfuric acid blank in the UV against a sulfuric acid blank in the UV spectrophotometer at 235 nm. A standard spectrophotometer at 235 nm. A standard assay was created, enabling the amount of assay was created, enabling the amount of PHB produced to be determined based on PHB produced to be determined based on Fig. Fig. 1 1 Fig. Fig. 2 2 Fig. Fig. 4 4 Fig. Fig. 3 3
-
Upload
osborn-carter -
Category
Documents
-
view
220 -
download
0
Transcript of The purpose of experimentation was to determine which carbon source - glucose, glycerol, or maple...
The purpose of experimentation was to determine which carbon source - glucose, glycerol, or maple syrup - caused The purpose of experimentation was to determine which carbon source - glucose, glycerol, or maple syrup - caused Bacillus megateriumBacillus megaterium to produce the most poly- to produce the most poly-β-β-hydroxybutyric acid (PHB) by utilizing a UV spectrophotometer to hydroxybutyric acid (PHB) by utilizing a UV spectrophotometer to compare the differing absorbance values of the bacterial byproducts at 235 nmcompare the differing absorbance values of the bacterial byproducts at 235 nm and by employing a standard curve to and by employing a standard curve to calculate the dry weight of PHB in each media. One of the ultimate goals of experimentation was to ascertain an calculate the dry weight of PHB in each media. One of the ultimate goals of experimentation was to ascertain an inexpensive method to produce great quantities of PHB, which can be used to create biodegradable plastics. Each of the inexpensive method to produce great quantities of PHB, which can be used to create biodegradable plastics. Each of the carbon sources chosen had a specific advantage. Glycerol is an undesirable byproduct of methanol and alkali catalysis, a carbon sources chosen had a specific advantage. Glycerol is an undesirable byproduct of methanol and alkali catalysis, a methyl ester process used to make biodiesel. Glucose is an easily accessible simple sugar, and maple syrup is a plentiful methyl ester process used to make biodiesel. Glucose is an easily accessible simple sugar, and maple syrup is a plentiful natural product. Thus, PHB production would be beneficial in any one of the media, but the most advantageous result natural product. Thus, PHB production would be beneficial in any one of the media, but the most advantageous result would be if the greatest production was in the glycerol media so that the process of creating biodiesel would have minimal would be if the greatest production was in the glycerol media so that the process of creating biodiesel would have minimal negative side effects. Production of PHB in glucose would be beneficial as well due to its accessibility, and maple syrup negative side effects. Production of PHB in glucose would be beneficial as well due to its accessibility, and maple syrup provides a natural process of generating a nature-friendly plastic. The study demonstrates that the most effective carbon provides a natural process of generating a nature-friendly plastic. The study demonstrates that the most effective carbon source was maple syrup for the media containing maple syrup as a nutrient supplement led to the greatest production of source was maple syrup for the media containing maple syrup as a nutrient supplement led to the greatest production of PHB. PHB.
Bacillus megaterium Bacillus megaterium was cultivated in media that was prepared using was cultivated in media that was prepared using sodium phosphate dibasic, potassium phosphate monobasic, sodium sodium phosphate dibasic, potassium phosphate monobasic, sodium chloride, and ammonium chloride. The resultant broth was divided chloride, and ammonium chloride. The resultant broth was divided into four flasks, and a different carbon source - maple syrup, glycerol, into four flasks, and a different carbon source - maple syrup, glycerol, and glucose - was added to each medium except the control in order to and glucose - was added to each medium except the control in order to vary the nutrients each culture received. The bacteria were then vary the nutrients each culture received. The bacteria were then transferred into the broth and left to grow for a week. During this transferred into the broth and left to grow for a week. During this period, a second trial was begun in which the media had more of each period, a second trial was begun in which the media had more of each carbon source to determine if merely an increase in the carbon source carbon source to determine if merely an increase in the carbon source was enough to cause the bacteria to produce more PHB. Therefore, the was enough to cause the bacteria to produce more PHB. Therefore, the carbon to nitrogen ratio was raised to 6:1. The third trial involved carbon to nitrogen ratio was raised to 6:1. The third trial involved media with nutrients derived from Tryptone Soya broth powder and media with nutrients derived from Tryptone Soya broth powder and then the various carbon sources added later on, which would indicate if then the various carbon sources added later on, which would indicate if excess carbon sources as well as normal nutrients would cause excess carbon sources as well as normal nutrients would cause increased PHB synthesis (Fig. 1). Blanks of the broths in the second increased PHB synthesis (Fig. 1). Blanks of the broths in the second and third trials were created so subsequent growth in the broth could and third trials were created so subsequent growth in the broth could be detected in a UV spectrophotometer. In order to speed the rate of be detected in a UV spectrophotometer. In order to speed the rate of their growth, the bacteria in rounds two and three were incubated at 38 their growth, the bacteria in rounds two and three were incubated at 38 °C for 24 hours. After 26 and 72 hours, the bacteria were scanned in °C for 24 hours. After 26 and 72 hours, the bacteria were scanned in the spectrometer to see the amount of growth over time.the spectrometer to see the amount of growth over time.
Bacterial Bacterial GrowthGrowth
IntroductionIntroduction
In order to create PHB suspensions, a vortexed sample of each broth was In order to create PHB suspensions, a vortexed sample of each broth was extracted and centrifuged to isolate the bacteria (Fig. 2). The cell paste was extracted and centrifuged to isolate the bacteria (Fig. 2). The cell paste was resuspended in a sodium hypochlorite solution for 1 hour at 37 °C, which lyses resuspended in a sodium hypochlorite solution for 1 hour at 37 °C, which lyses the bacteria’s cell walls. After being washed by water, acetone, and ethanol, the the bacteria’s cell walls. After being washed by water, acetone, and ethanol, the remaining lipid granules were transferred into boiling chloroform, which extracts remaining lipid granules were transferred into boiling chloroform, which extracts the PHB and dissolves any residual contaminants using the set-up (Fig. 3). the PHB and dissolves any residual contaminants using the set-up (Fig. 3).
PHB PHB DetectionDetection
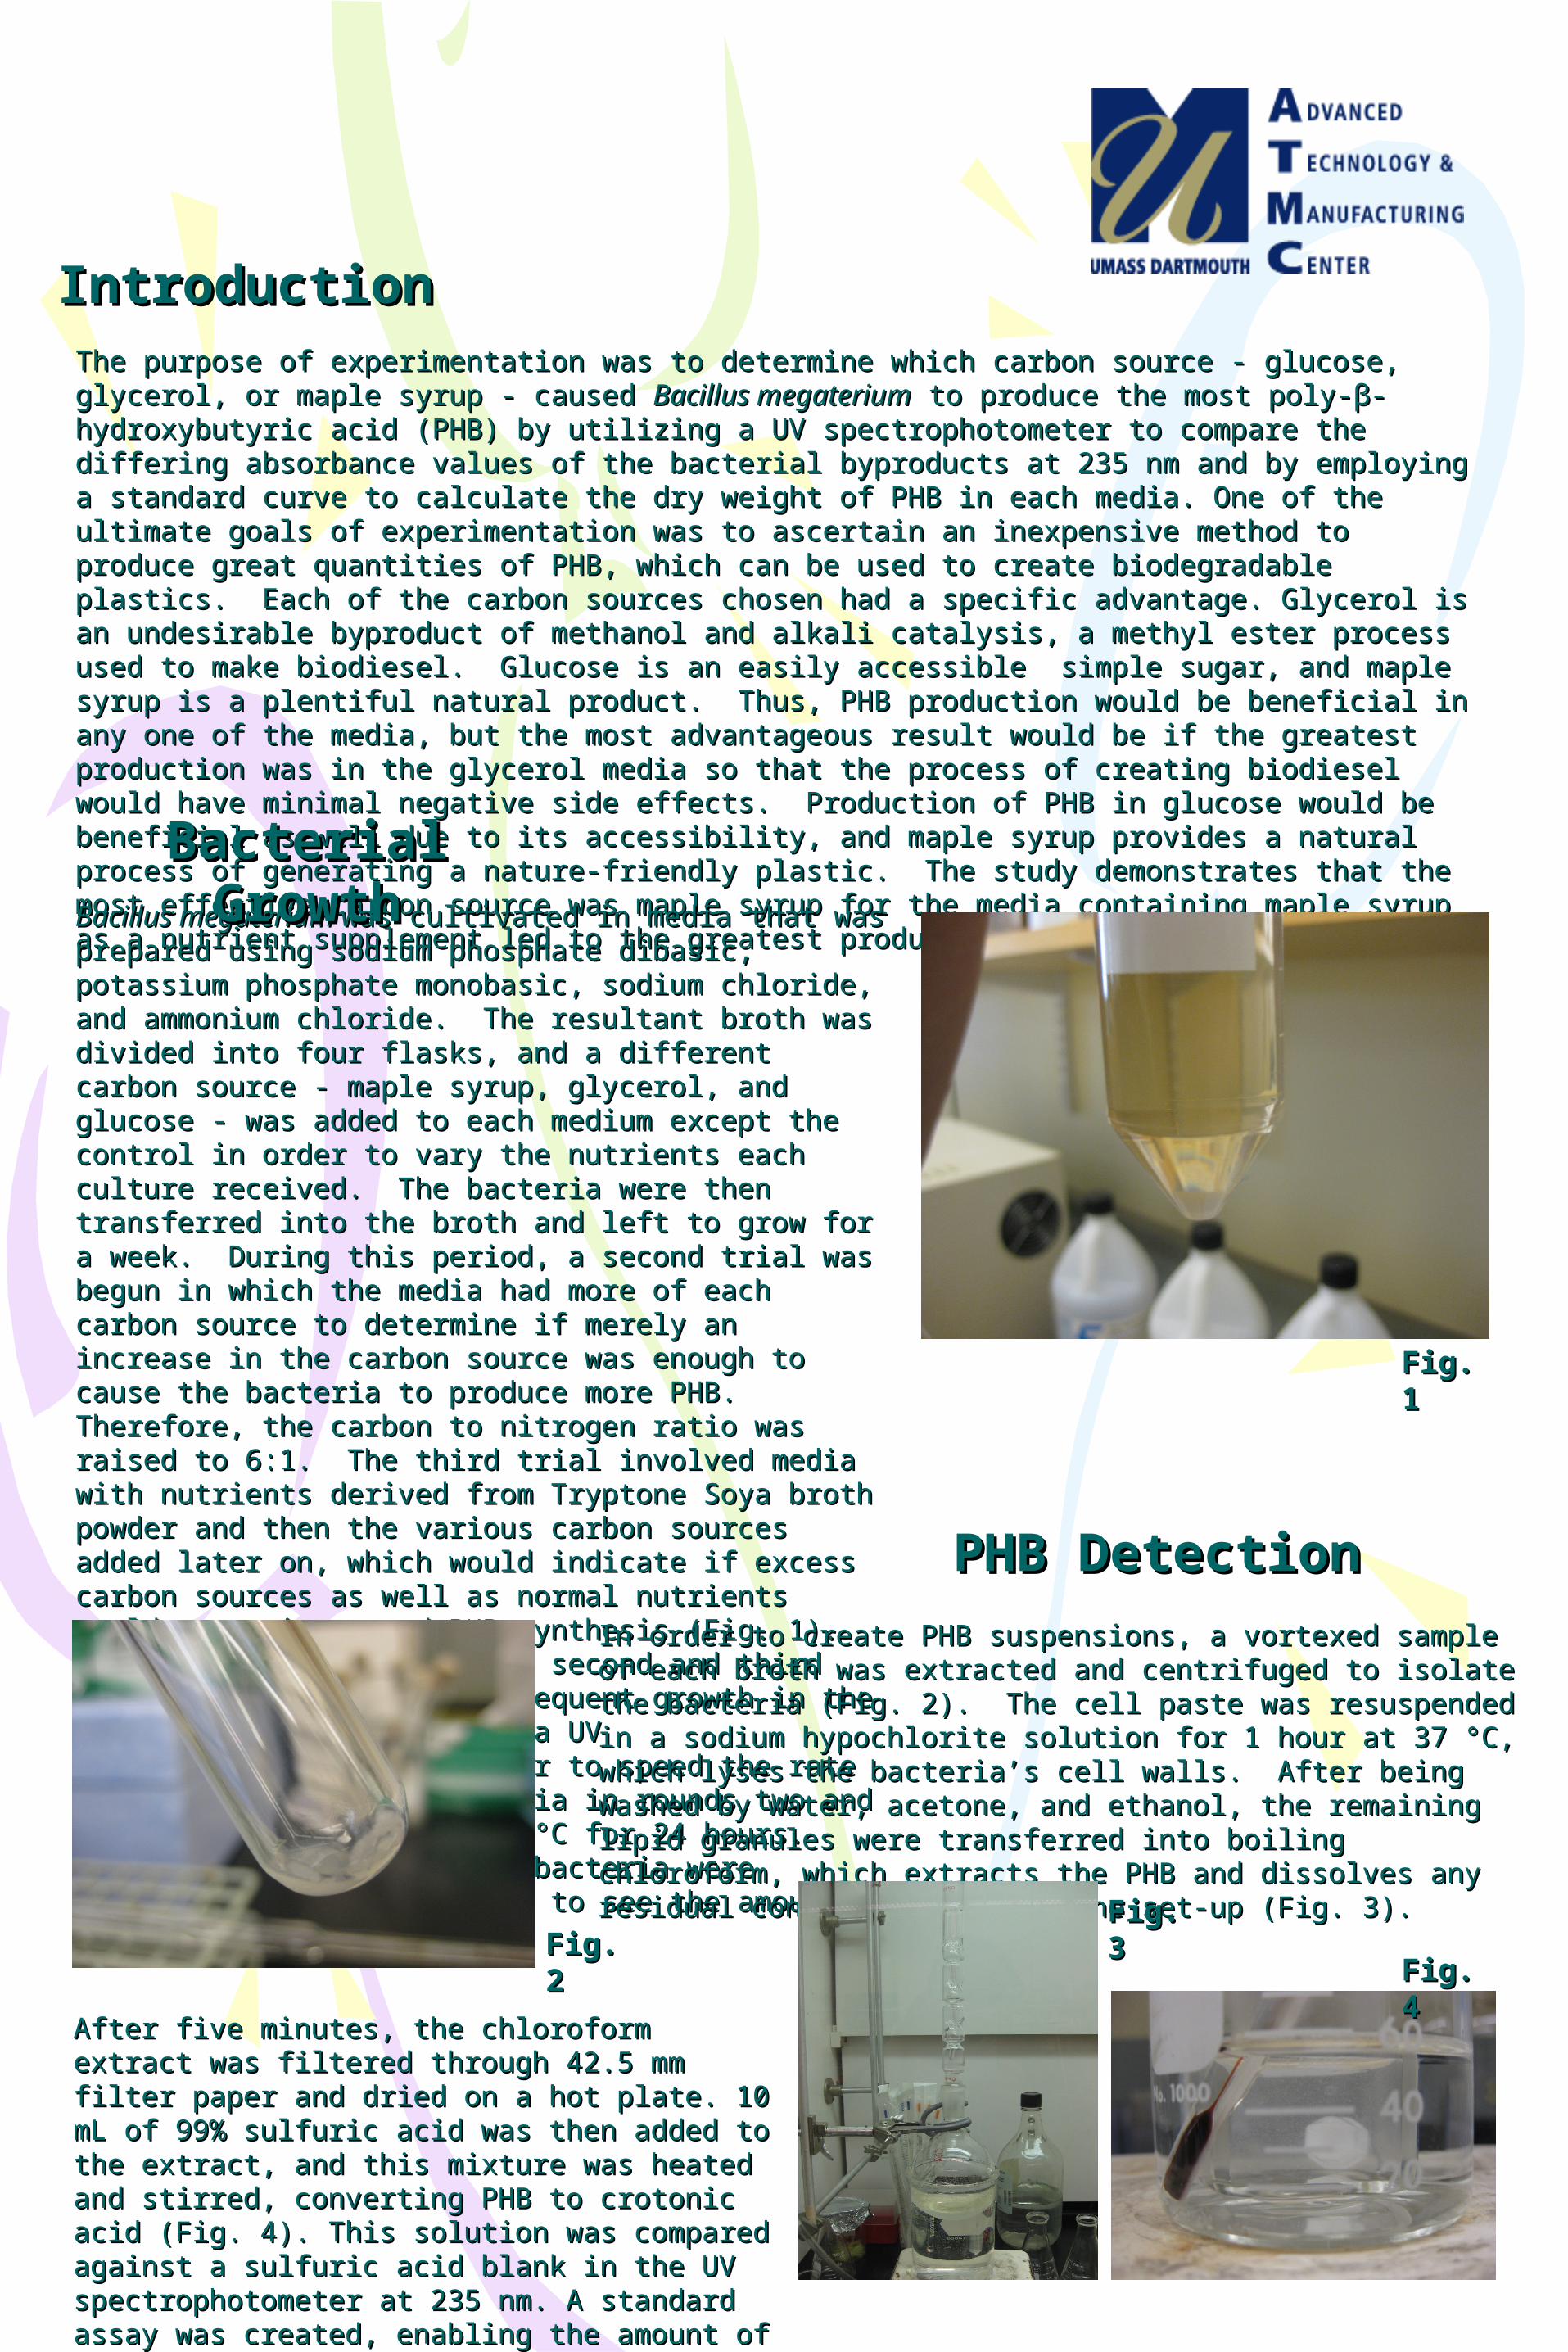
After five minutes, the chloroform extract was filtered After five minutes, the chloroform extract was filtered through 42.5 mm filter paper and dried on a hot plate. 10 mL through 42.5 mm filter paper and dried on a hot plate. 10 mL of 99% sulfuric acid was then added to the extract, and this of 99% sulfuric acid was then added to the extract, and this mixture was heated and stirred, converting PHB to crotonic mixture was heated and stirred, converting PHB to crotonic acid (Fig. 4). This solution was compared against a sulfuric acid (Fig. 4). This solution was compared against a sulfuric acid blank in the UV spectrophotometer at 235 nm. A acid blank in the UV spectrophotometer at 235 nm. A standard assay was created, enabling the amount of PHB standard assay was created, enabling the amount of PHB produced to be determined based on the absorbance at 235 produced to be determined based on the absorbance at 235 nm.nm.
Fig. 1Fig. 1
Fig. 2Fig. 2Fig. 4Fig. 4
Fig. 3Fig. 3
Production of Poly-Production of Poly-ββ-Hydroxybutyric Acid-Hydroxybutyric Acidwith with B.B. megateriummegaterium in Carbon Sources in Carbon Sources
Gretchen Sileo and Amy SungGretchen Sileo and Amy SungHopkinton High SchoolHopkinton High SchoolHopkinton, MAHopkinton, MA
Chen-Lu YangChen-Lu YangAdvanced Technology and Manufacturing CenterAdvanced Technology and Manufacturing CenterUniversity of Massachusetts - Dartmouth University of Massachusetts - Dartmouth
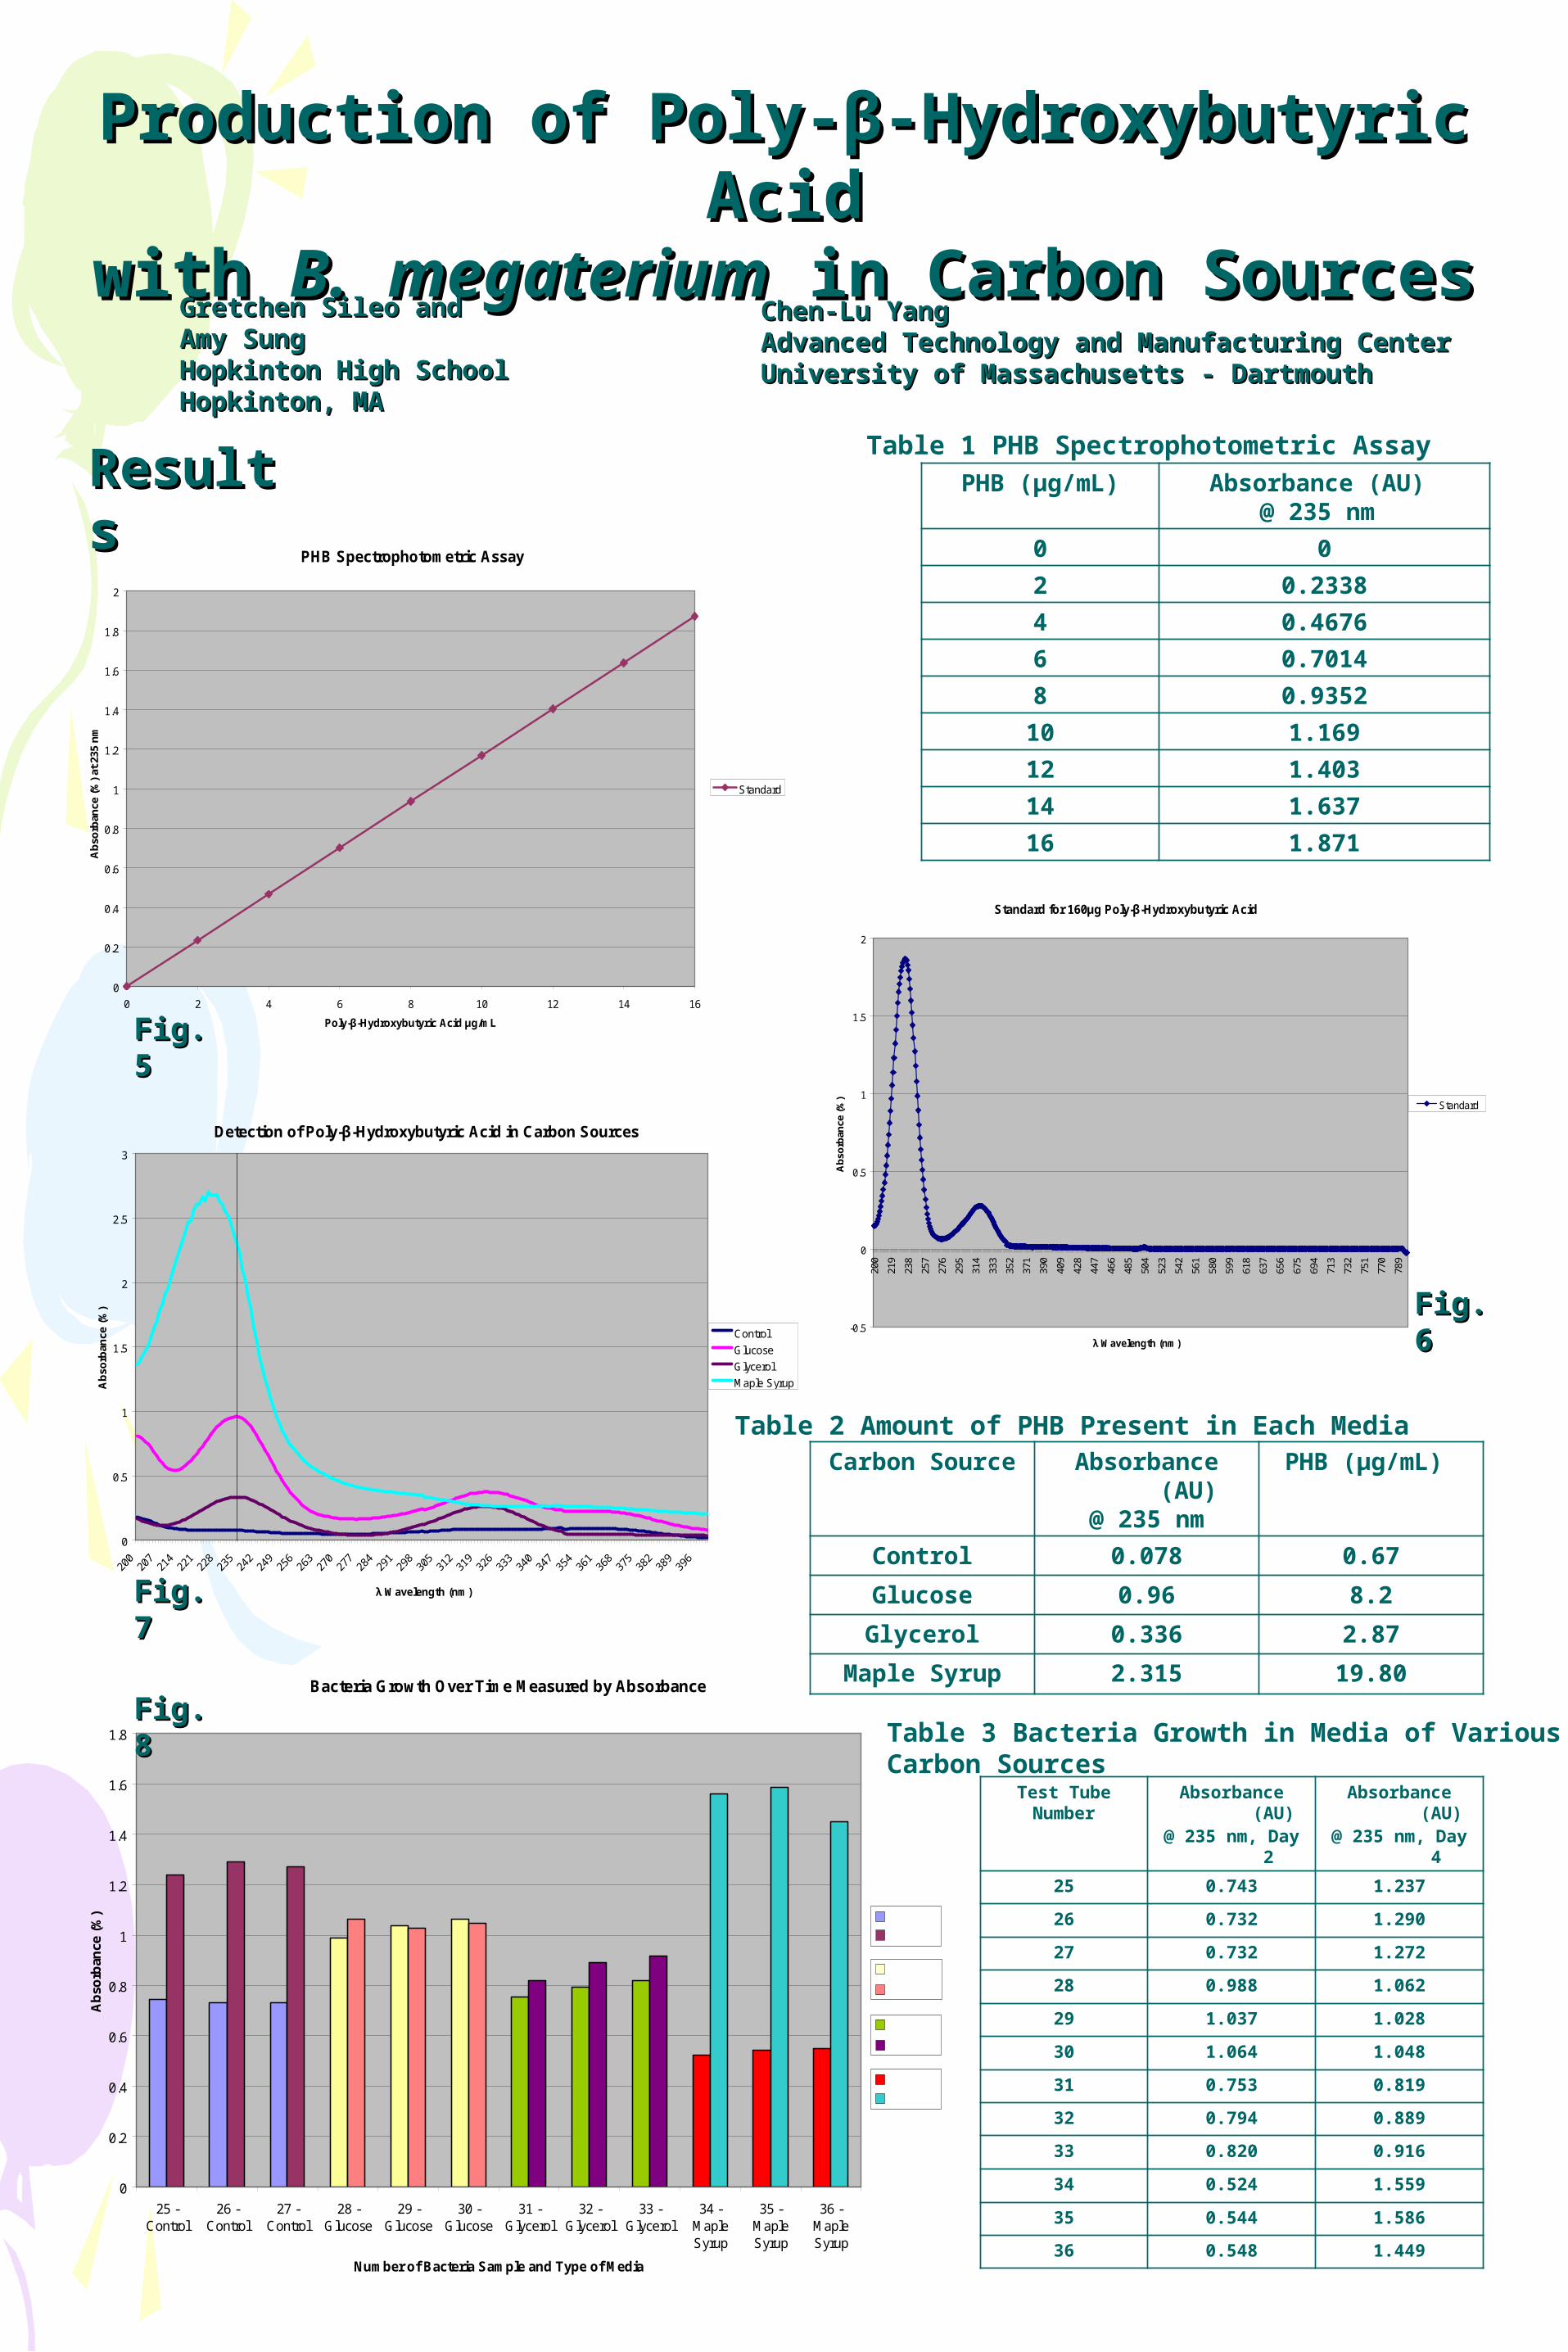
PHB Spectrophotometric Assay
0
0.2
0.4
0.6
0.8
1
1.2
1.4
1.6
1.8
2
0 2 4 6 8 10 12 14 16
Poly-β-Hydroxybutyric Acid μg/mL
Ab
sorb
ance
(%
) at
235
nm
Standard
PHB (μg/mL) Absorbance (AU) @ 235 nm
0 0
2 0.2338
4 0.4676
6 0.7014
8 0.9352
10 1.169
12 1.403
14 1.637
16 1.871
Standard for 160μg Poly-β-Hydroxybutyric Acid
-0.5
0
0.5
1
1.5
2
200
219
238
257
276
295
314
333
352
371
390
409
428
447
466
485
504
523
542
561
580
599
618
637
656
675
694
713
732
751
770
789
λ Wavelength (nm)
Ab
sorb
ance
(%
)
Standard
Detection of Poly-β-Hydroxybutyric Acid in Carbon Sources
0
0.5
1
1.5
2
2.5
3
λ Wavelength (nm)
Ab
sorb
ance
(%
)
Control
Glucose
Glycerol
Maple Syrup
Bacteria Growth Over Time Measured by Absorbance
0
0.2
0.4
0.6
0.8
1
1.2
1.4
1.6
1.8
25 -Control
26 -Control
27 -Control
28 -Glucose
29 -Glucose
30 -Glucose
31 -Glycerol
32 -Glycerol
33 -Glycerol
34 -MapleSyrup
35 -MapleSyrup
36 -MapleSyrup
Number of Bacteria Sample and Type of Media
Ab
sorb
ance
(%
)
26 hours 71 hours
26 hours 71 hours
26 hours 71 hours
26 hours 71 hours
Test Tube Number Absorbance (AU)@ 235 nm, Day 2
Absorbance (AU)@ 235 nm, Day 4
25 0.743 1.237
26 0.732 1.290
27 0.732 1.272
28 0.988 1.062
29 1.037 1.028
30 1.064 1.048
31 0.753 0.819
32 0.794 0.889
33 0.820 0.916
34 0.524 1.559
35 0.544 1.586
36 0.548 1.449
Carbon Source Absorbance (AU)@ 235 nm
PHB (μg/mL)
Control 0.078 0.67
Glucose 0.96 8.2
Glycerol 0.336 2.87
Maple Syrup 2.315 19.80
Table 1 PHB Spectrophotometric Assay
Table 2 Amount of PHB Present in Each Media
Table 3 Bacteria Growth in Media of Various Carbon Sources
Fig. 5Fig. 5
Fig. 6Fig. 6
Fig. 7Fig. 7
Fig. 8Fig. 8
ResultResultss
Discussion and Discussion and ConclusionsConclusions
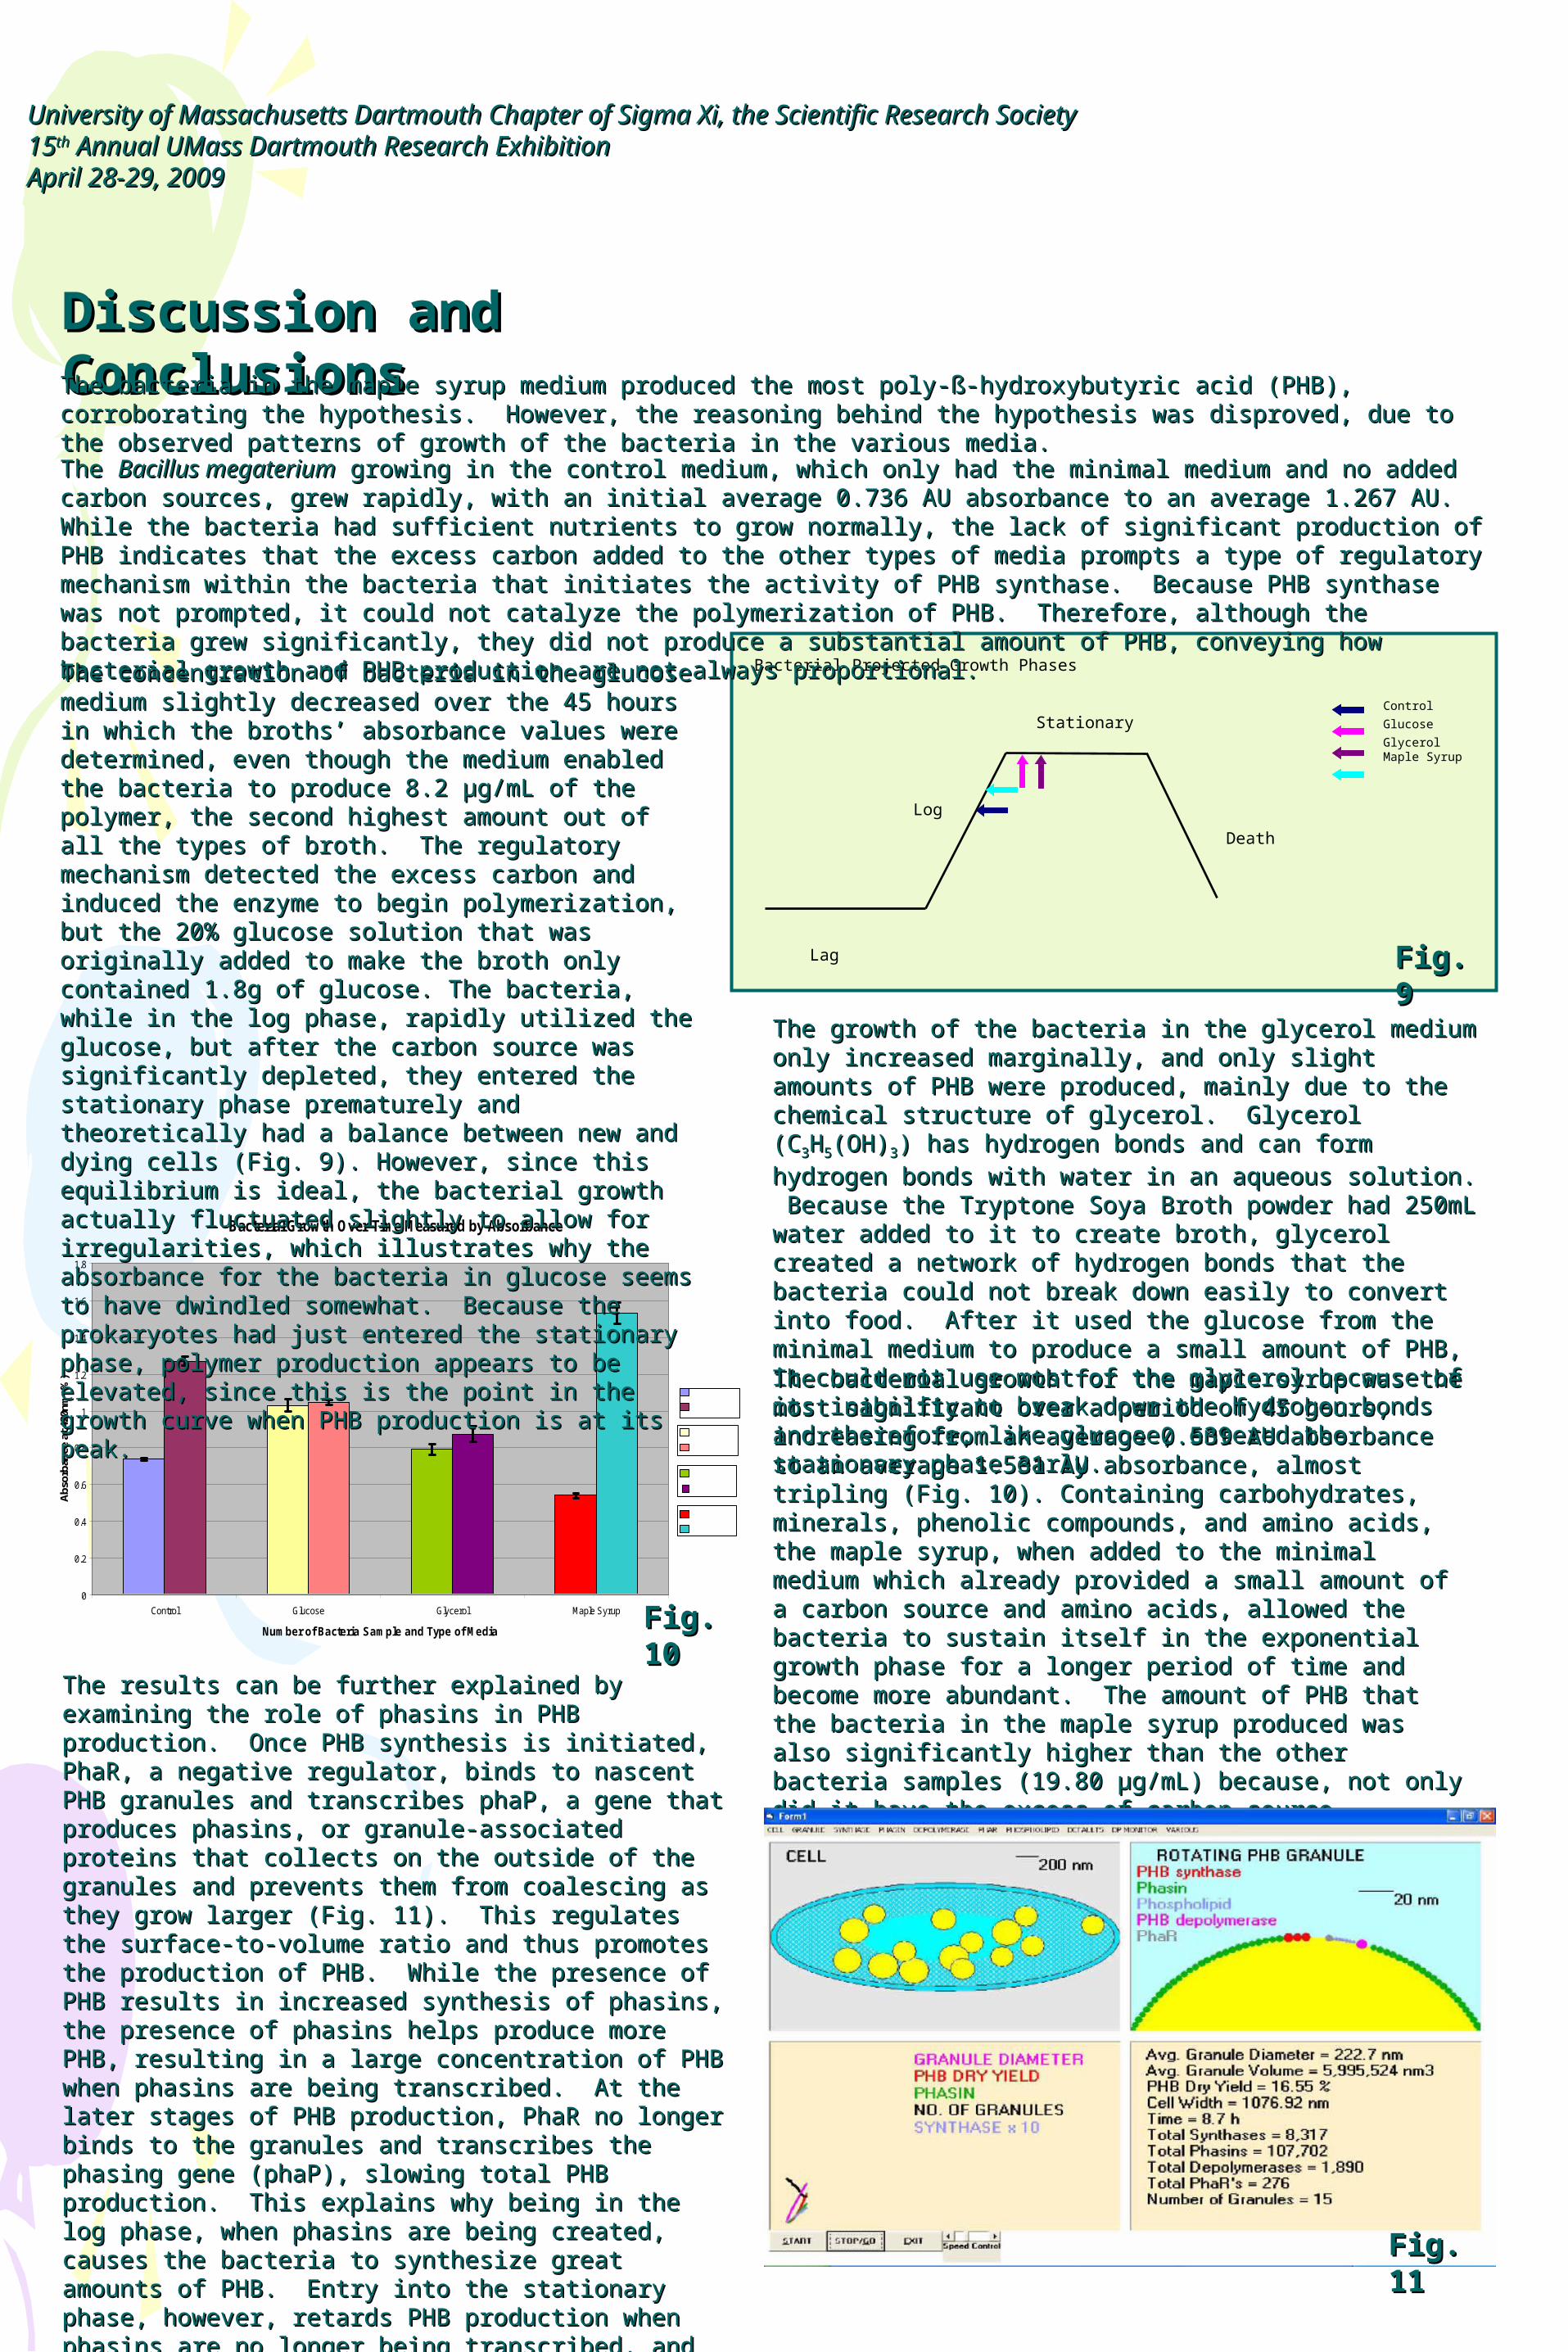
The results can be further explained by examining the role of phasins The results can be further explained by examining the role of phasins in PHB production. Once PHB synthesis is initiated, PhaR, a in PHB production. Once PHB synthesis is initiated, PhaR, a negative regulator, binds to nascent PHB granules and transcribes negative regulator, binds to nascent PHB granules and transcribes phaP, a gene that produces phasins, or granule-associated proteins phaP, a gene that produces phasins, or granule-associated proteins that collects on the outside of the granules and prevents them from that collects on the outside of the granules and prevents them from coalescing as they grow larger (Fig. 11). This regulates the surface-coalescing as they grow larger (Fig. 11). This regulates the surface-to-volume ratio and thus promotes the production of PHB. While the to-volume ratio and thus promotes the production of PHB. While the presence of PHB results in increased synthesis of phasins, the presence of PHB results in increased synthesis of phasins, the presence of phasins helps produce more PHB, resulting in a large presence of phasins helps produce more PHB, resulting in a large concentration of PHB when phasins are being transcribed. At the concentration of PHB when phasins are being transcribed. At the later stages of PHB production, PhaR no longer binds to the granules later stages of PHB production, PhaR no longer binds to the granules and transcribes the phasing gene (phaP), slowing total PHB and transcribes the phasing gene (phaP), slowing total PHB production. This explains why being in the log phase, when phasins production. This explains why being in the log phase, when phasins are being created, causes the bacteria to synthesize great amounts of are being created, causes the bacteria to synthesize great amounts of PHB. Entry into the stationary phase, however, retards PHB PHB. Entry into the stationary phase, however, retards PHB production when phasins are no longer being transcribed, and the production when phasins are no longer being transcribed, and the bacteria’s rapid utilization of the polymer that remains eventually bacteria’s rapid utilization of the polymer that remains eventually eliminates the presence of the polymer in the bacterial cells eliminates the presence of the polymer in the bacterial cells completely. Therefore, the bacteria must be harvested just when it is completely. Therefore, the bacteria must be harvested just when it is entering the stationary phase in order to collect the most polymer entering the stationary phase in order to collect the most polymer from the cells.from the cells.
Lag
Log
Stationary
Death
Bacterial Projected Growth Phases
Control
Glucose
GlycerolMaple Syrup
Bacterial Growth Over Time Measured by Absorbance
0
0.2
0.4
0.6
0.8
1
1.2
1.4
1.6
1.8
Control Glucose Glycerol Maple Syrup
Number of Bacteria Sample and Type of Media
Abs
orba
nce
at 4
20nm
(%)
26 hours 71 hours
26 hours 71 hours
26 hours 71 hours
26 hours 71 hours
The bacteria in the maple syrup medium produced the most poly-ß-hydroxybutyric acid (PHB), corroborating the hypothesis. However, the The bacteria in the maple syrup medium produced the most poly-ß-hydroxybutyric acid (PHB), corroborating the hypothesis. However, the reasoning behind the hypothesis was disproved, due to the observed patterns of growth of the bacteria in the various media.reasoning behind the hypothesis was disproved, due to the observed patterns of growth of the bacteria in the various media.
The The Bacillus megateriumBacillus megaterium growing in the control medium, which only had the minimal medium and no added carbon sources, grew rapidly, with an growing in the control medium, which only had the minimal medium and no added carbon sources, grew rapidly, with an initial average 0.736 AU absorbance to an average 1.267 AU. While the bacteria had sufficient nutrients to grow normally, the lack of significant initial average 0.736 AU absorbance to an average 1.267 AU. While the bacteria had sufficient nutrients to grow normally, the lack of significant production of PHB indicates that the excess carbon added to the other types of media prompts a type of regulatory mechanism within the bacteria production of PHB indicates that the excess carbon added to the other types of media prompts a type of regulatory mechanism within the bacteria that initiates the activity of PHB synthase. Because PHB synthase was not prompted, it could not catalyze the polymerization of PHB. Therefore, that initiates the activity of PHB synthase. Because PHB synthase was not prompted, it could not catalyze the polymerization of PHB. Therefore, although the bacteria grew significantly, they did not produce a substantial amount of PHB, conveying how bacterial growth and PHB production although the bacteria grew significantly, they did not produce a substantial amount of PHB, conveying how bacterial growth and PHB production are not always proportional.are not always proportional.
The concentration of bacteria in the glucose medium slightly The concentration of bacteria in the glucose medium slightly decreased over the 45 hours in which the broths’ absorbance decreased over the 45 hours in which the broths’ absorbance values were determined, even though the medium enabled the values were determined, even though the medium enabled the bacteria to produce 8.2 bacteria to produce 8.2 μμg/mL of the polymer, the second highest g/mL of the polymer, the second highest amount out of all the types of broth. The regulatory mechanism amount out of all the types of broth. The regulatory mechanism detected the excess carbon and induced the enzyme to begin detected the excess carbon and induced the enzyme to begin polymerization, but the 20% glucose solution that was originally polymerization, but the 20% glucose solution that was originally added to make the broth only contained 1.8g of glucose. The added to make the broth only contained 1.8g of glucose. The bacteria, while in the log phase, rapidly utilized the glucose, but bacteria, while in the log phase, rapidly utilized the glucose, but after the carbon source was significantly depleted, they entered after the carbon source was significantly depleted, they entered the stationary phase prematurely and theoretically had a balance the stationary phase prematurely and theoretically had a balance between new and dying cells (Fig. 9). However, since this between new and dying cells (Fig. 9). However, since this equilibrium is ideal, the bacterial growth actually fluctuated equilibrium is ideal, the bacterial growth actually fluctuated slightly to allow for irregularities, which illustrates why the slightly to allow for irregularities, which illustrates why the absorbance for the bacteria in glucose seems to have dwindled absorbance for the bacteria in glucose seems to have dwindled somewhat. Because the prokaryotes had just entered the somewhat. Because the prokaryotes had just entered the stationary phase, polymer production appears to be elevated, since stationary phase, polymer production appears to be elevated, since this is the point in the growth curve when PHB production is at its this is the point in the growth curve when PHB production is at its peak.peak.
The growth of the bacteria in the glycerol medium only increased The growth of the bacteria in the glycerol medium only increased marginally, and only slight amounts of PHB were produced, mainly due marginally, and only slight amounts of PHB were produced, mainly due to the chemical structure of glycerol. Glycerol (Cto the chemical structure of glycerol. Glycerol (C33HH55(OH)(OH)33) has hydrogen ) has hydrogen
bonds and can form hydrogen bonds with water in an aqueous solution. bonds and can form hydrogen bonds with water in an aqueous solution. Because the Tryptone Soya Broth powder had 250mL water added to it to Because the Tryptone Soya Broth powder had 250mL water added to it to create broth, glycerol created a network of hydrogen bonds that the create broth, glycerol created a network of hydrogen bonds that the bacteria could not break down easily to convert into food. After it used bacteria could not break down easily to convert into food. After it used the glucose from the minimal medium to produce a small amount of the glucose from the minimal medium to produce a small amount of PHB, it could not use most of the glycerol because of its inability to PHB, it could not use most of the glycerol because of its inability to break down the hydrogen bonds and therefore, like glucose, entered the break down the hydrogen bonds and therefore, like glucose, entered the stationary phase early.stationary phase early.
The bacterial growth for the maple syrup was the most significant over a The bacterial growth for the maple syrup was the most significant over a period of 45 hours, increasing from an average 0.539 AU absorbance to period of 45 hours, increasing from an average 0.539 AU absorbance to an average 1.531 AU absorbance, almost tripling (Fig. 10). Containing an average 1.531 AU absorbance, almost tripling (Fig. 10). Containing carbohydrates, minerals, phenolic compounds, and amino acids, the carbohydrates, minerals, phenolic compounds, and amino acids, the maple syrup, when added to the minimal medium which already maple syrup, when added to the minimal medium which already provided a small amount of a carbon source and amino acids, allowed provided a small amount of a carbon source and amino acids, allowed the bacteria to sustain itself in the exponential growth phase for a longer the bacteria to sustain itself in the exponential growth phase for a longer period of time and become more abundant. The amount of PHB that the period of time and become more abundant. The amount of PHB that the bacteria in the maple syrup produced was also significantly higher than bacteria in the maple syrup produced was also significantly higher than the other bacteria samples (19.80 the other bacteria samples (19.80 μμg/mL) because, not only did it have g/mL) because, not only did it have the excess of carbon source necessary for the regulatory mechanism to the excess of carbon source necessary for the regulatory mechanism to prompt PHB synthase to begin producing polymer, it also had the prompt PHB synthase to begin producing polymer, it also had the surplus of nutrients to maintain bacteria that were multiplying surplus of nutrients to maintain bacteria that were multiplying exponentially and all producing PHB for an extended period of time.exponentially and all producing PHB for an extended period of time.
University of Massachusetts Dartmouth Chapter of Sigma Xi, the Scientific Research SocietyUniversity of Massachusetts Dartmouth Chapter of Sigma Xi, the Scientific Research Society1515thth Annual UMass Dartmouth Research Exhibition Annual UMass Dartmouth Research ExhibitionApril 28-29, 2009April 28-29, 2009
Fig. 9Fig. 9
Fig. 10Fig. 10
Fig. 11Fig. 11