THE PSACHNA (EVIA ISLAND) EARTHQUAKE … PSACHNA (EVIA ISLAND) EARTHQUAKE SWARM OF JUNE 2003 ......
10
1379 ∆ελτίο της Ελληνικής Γεωλογικής Εταιρίας τομ. XXXVI, 2004 Πρακτικά 10 ου ∆ιεθνούς Συνεδρίου, Θεσ/νίκη Απρίλιος 2004 Bulletin of the Geological Society of Greece vol. XXXVI, 2004 Proceedings of the 10 th International Congress, Thessaloniki, April 2004 THE PSACHNA (EVIA ISLAND) EARTHQUAKE SWARM OF JUNE 2003 Benetatos C. 1 , Kiratzi A. 1 , Kementzetzidou K. 1 , Roumelioti Z. 1 , Karakaisis G. 1 , Scordilis E. 1 , Latoussakis I. 2 , Drakatos G. 2 1 Geophysical Laboratory, School of Geology, Aristotle University of Thessaloniki, 54124, Thessaloniki, , [email protected], [email protected] 2 National Observatory of Athens (NOA), Institute of Geodynamics, P.O. BOX 20048, 11810, Athens ABSTRACT Evia Island (Greece) lies in a transition zone from strike-slip faulting in the east, due to the strands of the North Anatolian Fault (NAF) that enter to the Aegean Sea, to normal faulting in the west along central Greece. In June 2003 a series of moderate events occurred in central Evia whose source parameters are investigated. These earthquakes caused serious damage to almost 20 residencies mainly in the town of Psachna. The sequence could be identified as an earthquake swarm with earthquake magnitudes in the range of 3 < M < 4.9. We used the P and S arrivals at the stations of the National Seismic Network to relocate the events using the double-difference algo- rithm. All P and S phase pickings were made by us using the broad band records from the network operated by the Geodynamic Institute of Athens. The relocated epicenters define a pronounced ENE- WSW zone, parallel to the high topography of the area. All depths are shallow from 1 to 8 Km. Regional waveform modeling was applied to determine the focal mechanisms of the larger events and FPFIT for the focal mechanisms of the smaller magnitude events. The majority of the focal mechanisms indicate normal faulting along almost E-W striking planes suggesting that defor- mation is mainly taken by normal faulting with a minor dextral horizontal motion. Normal faults with a N-S strike have been also observed showing that the E-W extension is present as it is observed in other parts of the Aegean region. Evia Island and its pattern of deformation is very interesting from the seismotectonic point of view. The fact that no large magnitude earthquake has occurred in Evia Island during instrumental times, makes the study of this earthquake swarm important. Previ- ous work (Kiratzi, 2002) has shown that the deformation in northern Evia Island is taken up mainly by strike-slip faulting. Moreover, depending on the orientation of the activated faults in respect to the present state stress field, dextral or sinistral horizontal motion is observed. The Psachna earth- quakes showed that an almost N-S extensional field prevails in central Evia Island with a few strike- slip focal mechanisms, suggesting that this part is mostly affected by the normal faulting system of central Greece. 1 INTRODUCTION From the middle of June 2003 until the end of July 2003 moderate magnitude earthquake clus- tering has been observed near the town of Psachna in central Evia (Greece). Similar clustering has been also observed in July 2001. The 2003 clustering began on 13 June 2003 with an earthquake of magnitude Mw 4.2 that was followed by a series of events with magnitudes up to Mw 4.9. In the town of Psachna more than 90 residencies were severely damaged and became inhabitant and al- most 500 more experienced less but extensive damage. The occurrence of earthquakes at that area continued until almost the end of August 2003. In total 13 earthquakes occurred in the area with magnitudes larger than Mw 3.5 and more than 100 with magnitudes between 2.5 < Mw < 3.5. The earthquake activity has the characteristics of an earthquake swarm. Earthquake swarms are defined as a sequence of earthquakes, where the number and magnitude increase with time and then decay after a certain period of time, and are characterized by the absence of a single domi-
Transcript of THE PSACHNA (EVIA ISLAND) EARTHQUAKE … PSACHNA (EVIA ISLAND) EARTHQUAKE SWARM OF JUNE 2003 ......
1379
∆ελτίο της Ελληνικής Γεωλογικής Εταιρίας τοµ. XXXVI, 2004 Πρακτικά 10ου ∆ιεθνούς Συνεδρίου, Θεσ/νίκη Απρίλιος 2004
Bulletin of the Geological Society of Greece vol. XXXVI, 2004 Proceedings of the 10th International Congress, Thessaloniki, April 2004
THE PSACHNA (EVIA ISLAND) EARTHQUAKE SWARM OF JUNE 2003 Benetatos C.1, Kiratzi A.1, Kementzetzidou K.1, Roumelioti Z.1, Karakaisis G.1, Scordilis E.1, Latoussakis I.2, Drakatos G.2 1 Geophysical Laboratory, School of Geology, Aristotle University of Thessaloniki, 54124, Thessaloniki, , [email protected], [email protected] 2 National Observatory of Athens (NOA), Institute of Geodynamics, P.O. BOX 20048, 11810, Athens
ABSTRACT
Evia Island (Greece) lies in a transition zone from strike-slip faulting in the east, due to the strands of the North Anatolian Fault (NAF) that enter to the Aegean Sea, to normal faulting in the west along central Greece. In June 2003 a series of moderate events occurred in central Evia whose source parameters are investigated. These earthquakes caused serious damage to almost 20 residencies mainly in the town of Psachna. The sequence could be identified as an earthquake swarm with earthquake magnitudes in the range of 3 < M < 4.9. We used the P and S arrivals at the stations of the National Seismic Network to relocate the events using the double-difference algo-rithm. All P and S phase pickings were made by us using the broad band records from the network operated by the Geodynamic Institute of Athens. The relocated epicenters define a pronounced ENE- WSW zone, parallel to the high topography of the area. All depths are shallow from 1 to 8 Km. Regional waveform modeling was applied to determine the focal mechanisms of the larger events and FPFIT for the focal mechanisms of the smaller magnitude events. The majority of the focal mechanisms indicate normal faulting along almost E-W striking planes suggesting that defor-mation is mainly taken by normal faulting with a minor dextral horizontal motion. Normal faults with a N-S strike have been also observed showing that the E-W extension is present as it is observed in other parts of the Aegean region. Evia Island and its pattern of deformation is very interesting from the seismotectonic point of view. The fact that no large magnitude earthquake has occurred in Evia Island during instrumental times, makes the study of this earthquake swarm important. Previ-ous work (Kiratzi, 2002) has shown that the deformation in northern Evia Island is taken up mainly by strike-slip faulting. Moreover, depending on the orientation of the activated faults in respect to the present state stress field, dextral or sinistral horizontal motion is observed. The Psachna earth-quakes showed that an almost N-S extensional field prevails in central Evia Island with a few strike-slip focal mechanisms, suggesting that this part is mostly affected by the normal faulting system of central Greece.
1 INTRODUCTION
From the middle of June 2003 until the end of July 2003 moderate magnitude earthquake clus-tering has been observed near the town of Psachna in central Evia (Greece). Similar clustering has been also observed in July 2001. The 2003 clustering began on 13 June 2003 with an earthquake of magnitude Mw 4.2 that was followed by a series of events with magnitudes up to Mw 4.9. In the town of Psachna more than 90 residencies were severely damaged and became inhabitant and al-most 500 more experienced less but extensive damage. The occurrence of earthquakes at that area continued until almost the end of August 2003. In total 13 earthquakes occurred in the area with magnitudes larger than Mw 3.5 and more than 100 with magnitudes between 2.5 < Mw < 3.5. The earthquake activity has the characteristics of an earthquake swarm. Earthquake swarms are defined as a sequence of earthquakes, where the number and magnitude increase with time and then decay after a certain period of time, and are characterized by the absence of a single domi-
1380
nant principal earthquake (Mogi, 1963). Swarms occur in regions having an exceptionally heteroge-neous distribution of material properties and stress concentrations, typical of areas of recent vol-canism, igneous intrusions, and geothermal activities.
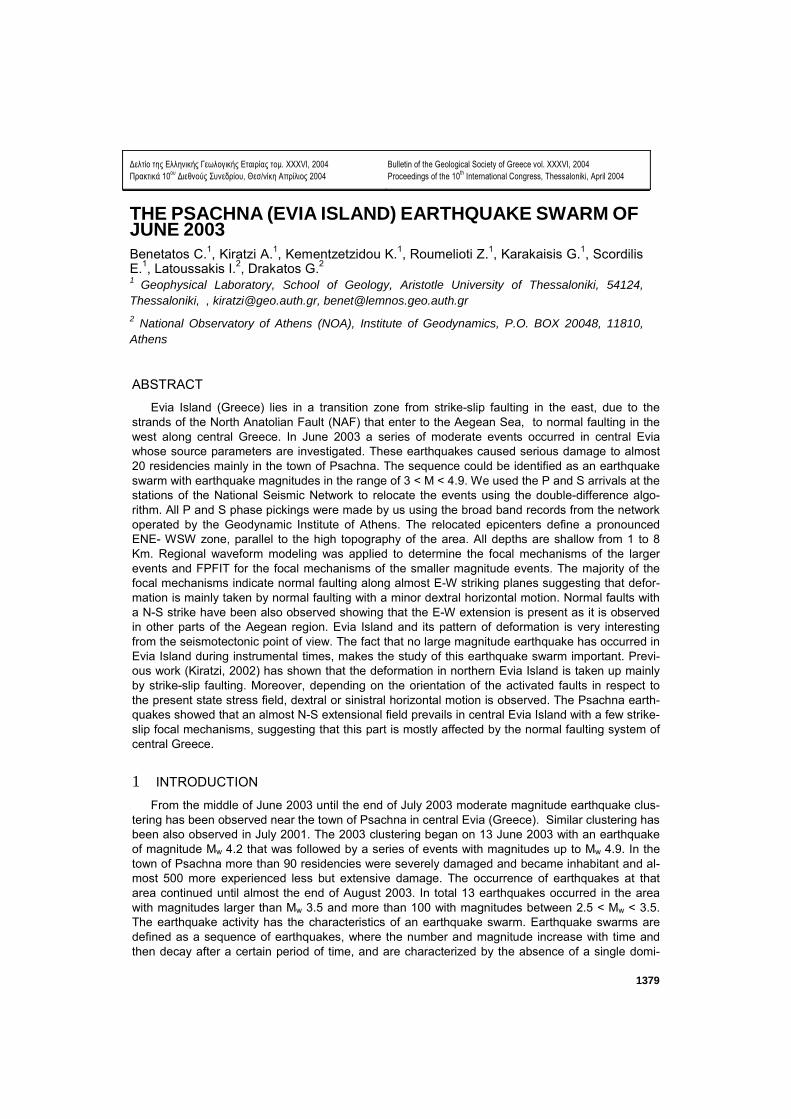
The area of Psachna (Fig. 1) lies close to the north Gulf of the Evia Island which is a graben of almost 100 Km length and is bounded by normal faults. The instrumentally recorded seismicity of the area is moderate (Papadopoulos et al., 2003) and no earthquake with magnitude greater than Mw 5.0 has been recorded. Furthermore even from historical records there is a lack of seismological information about this area (Papazachos and Papazachou, 2003).
Figure 1. Left: Focal mechanisms of the broader Evia Island area. Note that on the northern part of the island mainly strike slip mechanisms prevail. Right: Close- up of the Psachna area of study.
In the eastern part of the Evia Island (Fig. 1) strike- slip focal mechanisms are dominant due to
the branches of the right-lateral north Anatolian fault that extend to the northern Aegean area. In the western part the focal mechanisms gradually change to normal due to the N-S extension of central Greece. Evia Island lies in the crossroads between the two types of faulting systems. The only available focal mechanisms on the Evia Island are concentrated in its northern part and show a dif-fuse picture where strike slip faults are mixed with normal faults that have significant strike-slip component (Hatzfeld et al., 1999). The lack of information about the Psachna area along with the important role of Evia Island as the transition zone from strike slip to normal faulting makes the study of the earthquake swarm of June 2003 significant.
The aim of the present study is to relocate the earthquakes of the earthquake swarm in order to enhance the picture of the seismicity distribution, to specify the dimensions of the activated area and also to define the focal mechanisms of the strongest events.
2 DATA COLLECTION AND METHODS USED
We used data from the stations of the national broad-band seismographic network, operated by the National Observatory of Athens, for the time period from June 13, 2003 until August 30, 2003. In total we collected data for more than 100 earthquakes of magnitudes that varied from Mw 3.0 - 4.7. We used HYPO71 (Lee and Lahr, 1975) location software for the initial location and HYPODD (Waldhauser and Ellsworth, 2000) software for our relocation purposes. Furthermore for the largest of these events we used the whole waveform inversion, following the method of Dreger and Helm-
1381
berger (1990, 1991, 1993) and Dreger (2002) to calculate accurate focal mechanisms. For the smallest of the events we used FPFIT (Reasenberg and Openheimer, 1985) software that incorpo-rates the polarity of the first-motion of the P-waves to calculate focal mechanisms.
2.1 Initial locations and relocation of the events
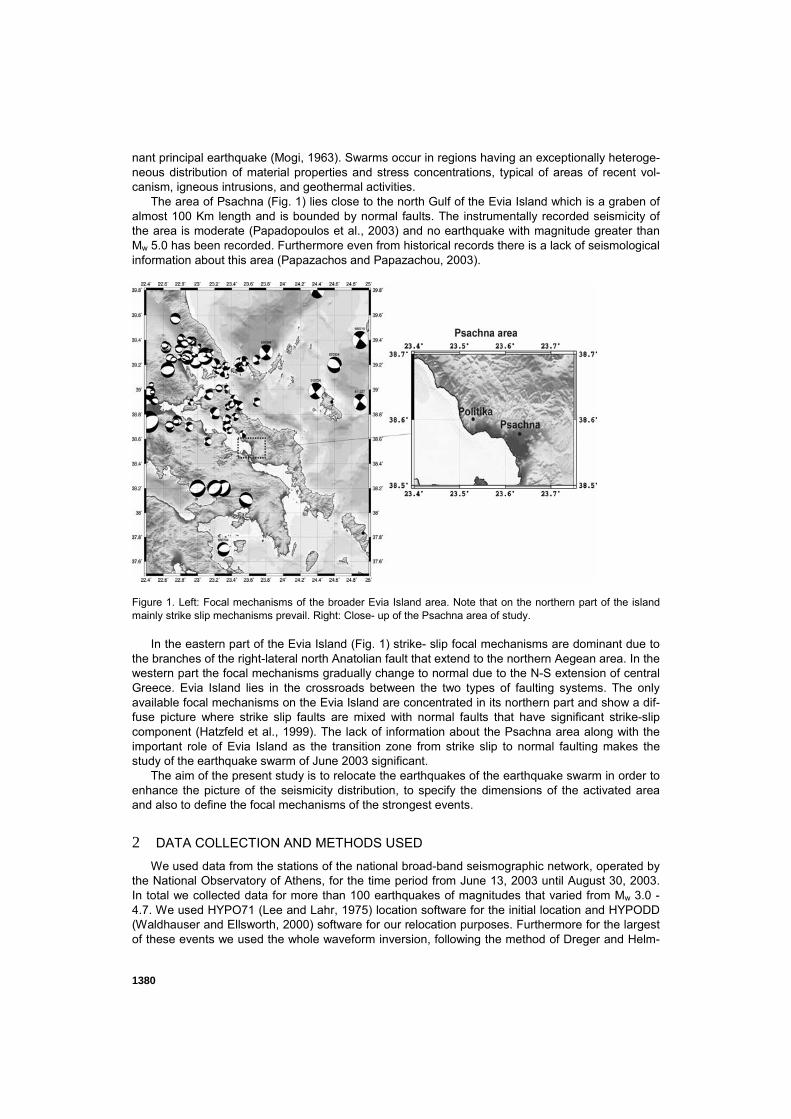
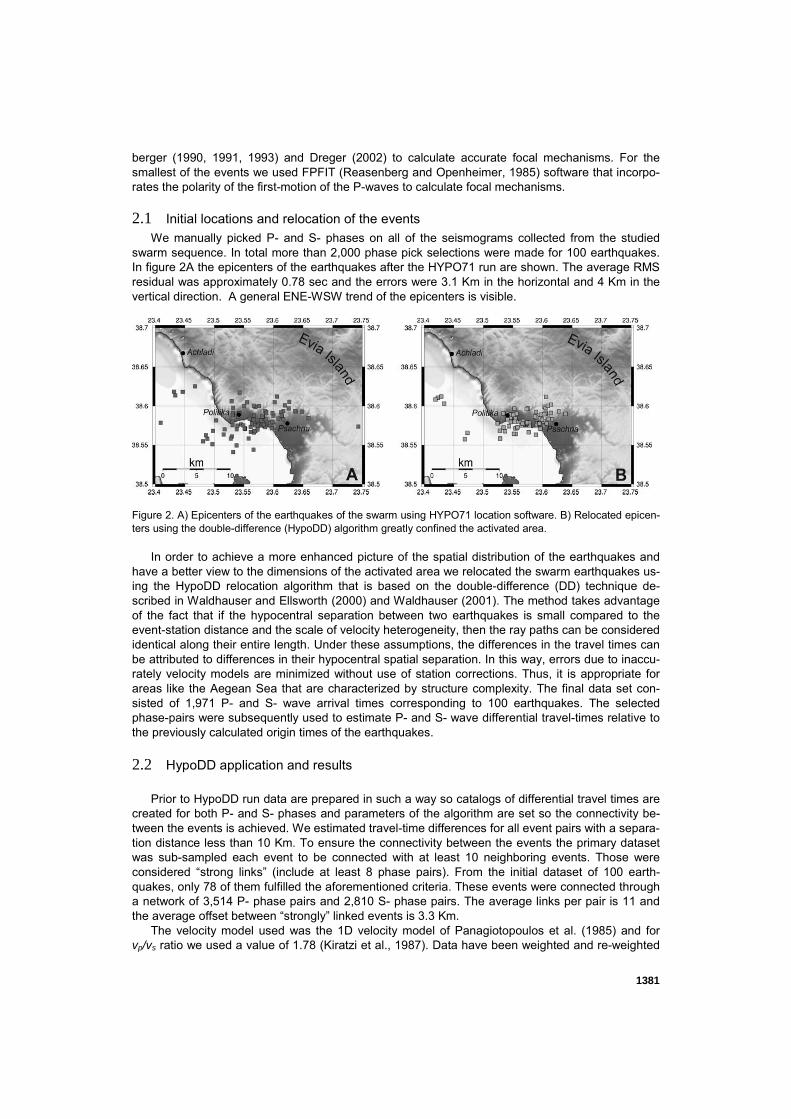
We manually picked P- and S- phases on all of the seismograms collected from the studied swarm sequence. In total more than 2,000 phase pick selections were made for 100 earthquakes. In figure 2A the epicenters of the earthquakes after the HYPO71 run are shown. The average RMS residual was approximately 0.78 sec and the errors were 3.1 Km in the horizontal and 4 Km in the vertical direction. A general ENE-WSW trend of the epicenters is visible.
Figure 2. A) Epicenters of the earthquakes of the swarm using HYPO71 location software. B) Relocated epicen-ters using the double-difference (HypoDD) algorithm greatly confined the activated area.
In order to achieve a more enhanced picture of the spatial distribution of the earthquakes and
have a better view to the dimensions of the activated area we relocated the swarm earthquakes us-ing the HypoDD relocation algorithm that is based on the double-difference (DD) technique de-scribed in Waldhauser and Ellsworth (2000) and Waldhauser (2001). The method takes advantage of the fact that if the hypocentral separation between two earthquakes is small compared to the event-station distance and the scale of velocity heterogeneity, then the ray paths can be considered identical along their entire length. Under these assumptions, the differences in the travel times can be attributed to differences in their hypocentral spatial separation. In this way, errors due to inaccu-rately velocity models are minimized without use of station corrections. Thus, it is appropriate for areas like the Aegean Sea that are characterized by structure complexity. The final data set con-sisted of 1,971 P- and S- wave arrival times corresponding to 100 earthquakes. The selected phase-pairs were subsequently used to estimate P- and S- wave differential travel-times relative to the previously calculated origin times of the earthquakes.
2.2 HypoDD application and results
Prior to HypoDD run data are prepared in such a way so catalogs of differential travel times are
created for both P- and S- phases and parameters of the algorithm are set so the connectivity be-tween the events is achieved. We estimated travel-time differences for all event pairs with a separa-tion distance less than 10 Km. To ensure the connectivity between the events the primary dataset was sub-sampled each event to be connected with at least 10 neighboring events. Those were considered “strong links” (include at least 8 phase pairs). From the initial dataset of 100 earth-quakes, only 78 of them fulfilled the aforementioned criteria. These events were connected through a network of 3,514 P- phase pairs and 2,810 S- phase pairs. The average links per pair is 11 and the average offset between “strongly” linked events is 3.3 Km.
The velocity model used was the 1D velocity model of Panagiotopoulos et al. (1985) and for vp/vs ratio we used a value of 1.78 (Kiratzi et al., 1987). Data have been weighted and re-weighted
1382
during the inversion procedure. During the first iterations the weights for the P- and S- waves were 1.0 and 0.5. After the first five iterations we applied a weighting curve that assigns larger weights for small inter-events distances and smaller weights for large inter-event distances.
The singular value decomposition algorithm (SVD) was selected for the relocation purposes be-cause it could provide us with reliable estimates of the uncertainty of the hypocentral parameters. In total 71 earthquakes were relocated. The average uncertainty of the relocated catalog is 0.49 Km in the E-W direction, 0.29 Km in the N-S direction and 0.61 Km in the vertical direction. The RMS re-sidual decreased from 0.78 sec of the initial catalog to 0.33 sec in the relocated one. Similar im-provement in the hypocentral parameters has been observed in the work of Roumelioti et al. (2003b) for the relocation of the aftershock sequence of Skyros earthquake of July 26, 2001 using HypoDD algorithm.
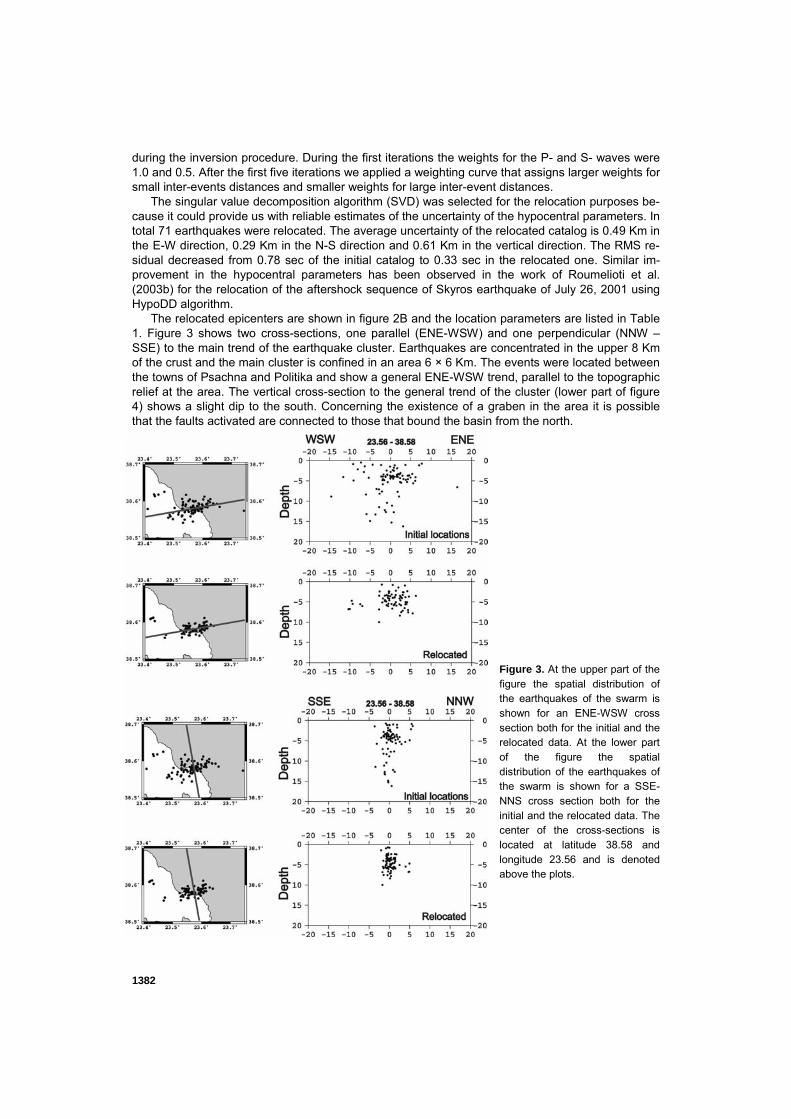
The relocated epicenters are shown in figure 2B and the location parameters are listed in Table 1. Figure 3 shows two cross-sections, one parallel (ENE-WSW) and one perpendicular (NNW – SSE) to the main trend of the earthquake cluster. Earthquakes are concentrated in the upper 8 Km of the crust and the main cluster is confined in an area 6 × 6 Km. The events were located between the towns of Psachna and Politika and show a general ENE-WSW trend, parallel to the topographic relief at the area. The vertical cross-section to the general trend of the cluster (lower part of figure 4) shows a slight dip to the south. Concerning the existence of a graben in the area it is possible that the faults activated are connected to those that bound the basin from the north.
Figure 3. At the upper part of the figure the spatial distribution of the earthquakes of the swarm is shown for an ENE-WSW cross section both for the initial and the relocated data. At the lower part of the figure the spatial distribution of the earthquakes of the swarm is shown for a SSE-NNS cross section both for the initial and the relocated data. The center of the cross-sections is located at latitude 38.58 and longitude 23.56 and is denoted above the plots.
1383
3 FOCAL MECHANISMS
We determined the focal mechanisms of 14 earthquakes of the swarm (with magnitude 3.5 <Mw< 4.9) using the regional waveform modeling technique (Dreger and Helmberger 1990, 1991, 1993). For smaller magnitude events we used he FPFIT software (Reasenberg and Openheimer, 1985) and determined the focal mechanisms for 39 more events with magnitudes Mw < 3.5.
3.1 Regional waveform modeling method
We calculated focal mechanisms of the earthquakes of the swarm sequence using regional
broad-band seismograms. The method is based on the work of Dreger and Helmberger (1990, 1991, 1993) and is capable of revealing the seismic moment tensor of earthquakes of magnitudes as low as Mw 3.5 (Pasyanos et al., 1996). Green’s functions were calculated using the frequency-wavenumber integration code (FKRPROG) developed by Saikia (1994).
In brief, the general representation of the seismic source is simplified by considering a point source both in space and time:
),,(),( , tzxGMtxU jniijn ⋅== (1)
where Un is the nth observed component of displacement, Gni,j is the nth component Green’s function for specific force-couple orientations, x corresponds to the source-station distance, z is the source depth and Mij is the scalar seismic moment tensor. The general force-couples for a devia-toric moment tensor may be represented by three fundamental faults, namely a vertical strike-slip, a vertical dip-slip, and a 450 dip-slip (Jost and Herrmann, 1989). In order to apply the method, the fol-lowing assumptions are made: the crustal model is sufficiently well known to explain the low fre-quency part of the regionally recorded waveforms, event location can be represented by the high frequency hypocentral location and the source time history is synchronous for all moment tensor elements. Equation (1) is solved using linear least squares for a given source depth. The inversion yields the Mij, which is decomposed into the scalar seismic moment, a double-couple (DC) moment tensor and a compensated linear vector dipole moment tensor (CLVD). The basic method and de-composition of the seismic moment tensor is described in Jost and Herrmann (1989). The optimum hypocentral depth is found by iteration and evaluating an objective function (f) that depends upon the RMS of the difference of the observed waveforms (data) and the synthetic waveforms (synth), modulated by the percent double couple (Pdc):
PdcsynthdataRMSf )( −
= (2)
Another measure that is used is the variance reduction (VR):
∫∫ −
−=dtdata
dtsynthdataVR
2
2
][
][0.1
(3)
A successful application of the method results in small values of the objective function (f) and large values of variance reduction (VR), indicating that both the fit between the observed and syn-thetic waveforms and the percent of double couple are large.
3.2 Regional waveform modeling application and results
Data from the stations of the National Seismographic Network of the National Observatory of
Athens were used. The stations are equipped with Lennartz 20 sec seismometers (LE-3D/20s). Prior to the inversion procedure the waveforms were cut into segments of at least 5 minutes of data, they were band-pass filtered between 0.05 – 0.08 Hz and resampled to a frequency of 1 Hz.
The velocity model that was used for the calculation of the synthetic Green’s functions was de-rived from the work of Novotny et al. (2001) and was used as input in the FKRPROG code of Saikia (1994). The aforementioned velocity model has been used in previous works in the Aegean area by
1384
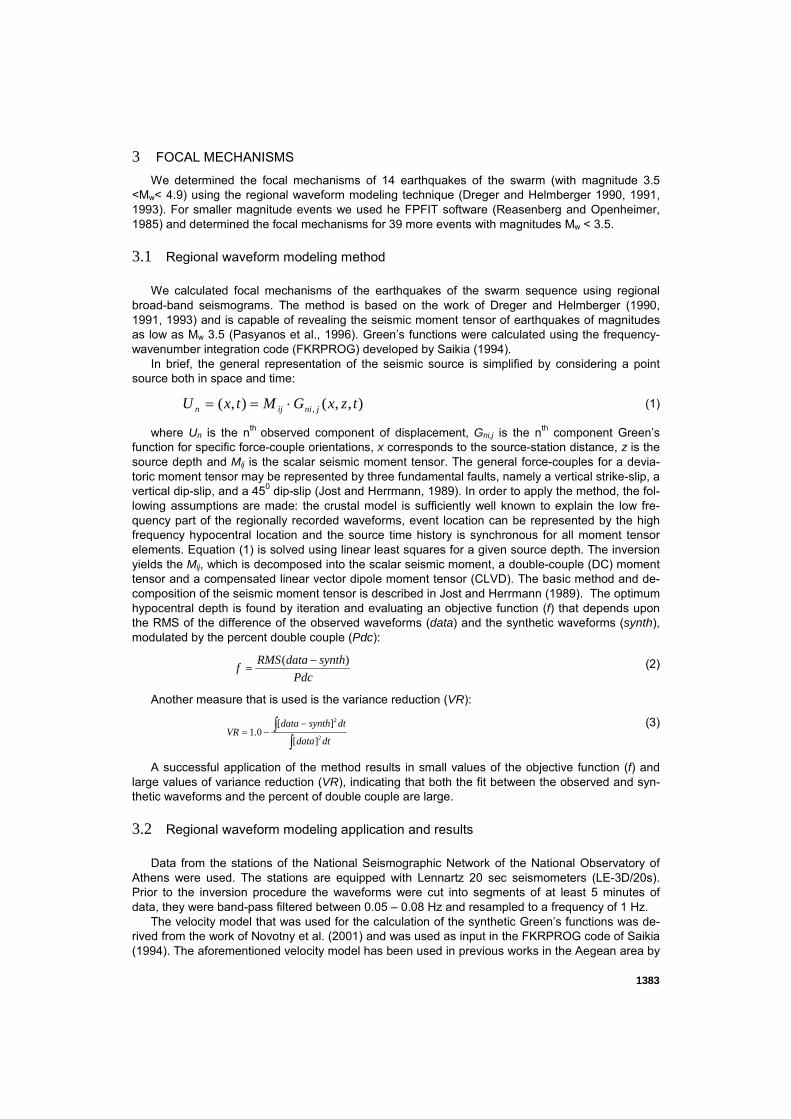
others (Benetatos et al. 2002, 2004, Roumelioti et al. 2003a) and has proven that is adequate to explain the low frequency content (0.05 – 0.08 Hz) of the waveforms. The synthetic Green’s func-tions were used later for the calculation of the focal mechanisms. The optimum depth for each one of the studied earthquakes was found iteratively by examining the overall variance reduction and the percent double couple of the focal mechanism. We performed the inversions for depths ranging from 3 km to 10 km with an increment of 1km guided by the depths of the relocated catalogue.
a)
b) Figure 4. a) Focal mechanisms of the largest earthquakes of the swarm, calculated using regional waveform modeling. b) Distribution of T-axes in the study area.
In total 14 focal mechanisms were calculated (Fig. 4a) the parameters of which are listed in Ta-
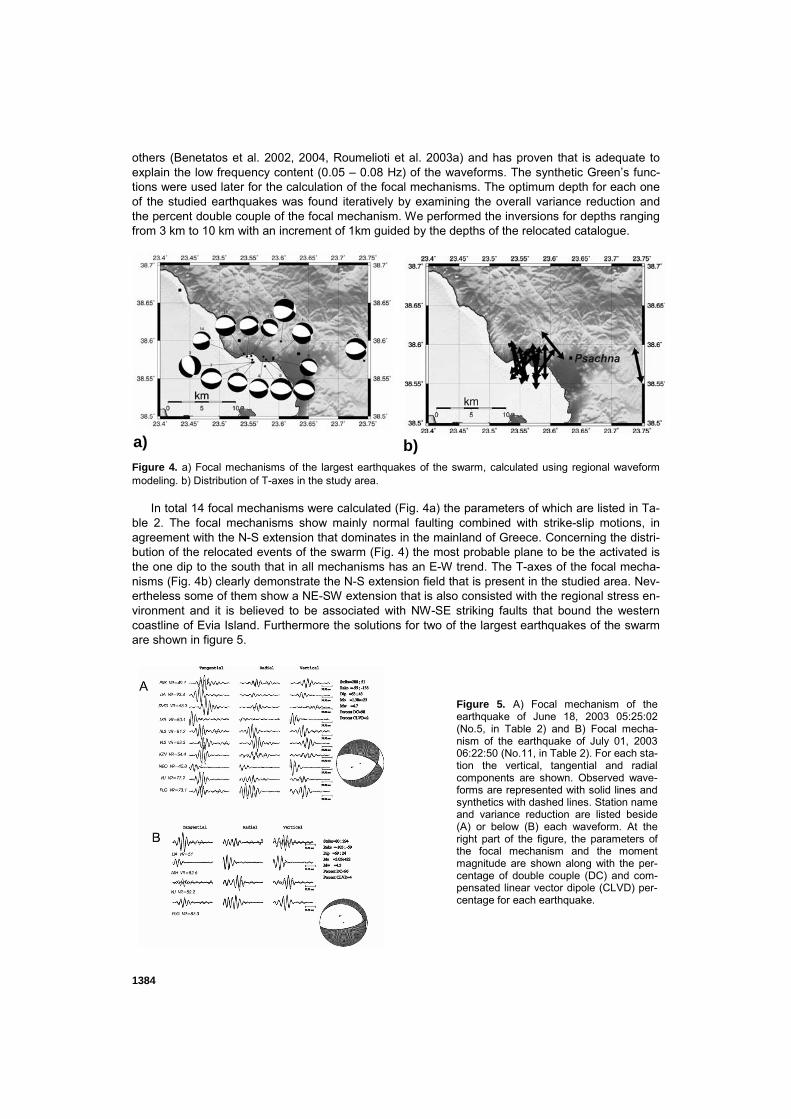
ble 2. The focal mechanisms show mainly normal faulting combined with strike-slip motions, in agreement with the N-S extension that dominates in the mainland of Greece. Concerning the distri-bution of the relocated events of the swarm (Fig. 4) the most probable plane to be the activated is the one dip to the south that in all mechanisms has an E-W trend. The T-axes of the focal mecha-nisms (Fig. 4b) clearly demonstrate the N-S extension field that is present in the studied area. Nev-ertheless some of them show a NE-SW extension that is also consisted with the regional stress en-vironment and it is believed to be associated with NW-SE striking faults that bound the western coastline of Evia Island. Furthermore the solutions for two of the largest earthquakes of the swarm are shown in figure 5.
Figure 5. A) Focal mechanism of the earthquake of June 18, 2003 05:25:02 (No.5, in Table 2) and B) Focal mecha-nism of the earthquake of July 01, 2003 06:22:50 (No.11, in Table 2). For each sta-tion the vertical, tangential and radial components are shown. Observed wave-forms are represented with solid lines and synthetics with dashed lines. Station name and variance reduction are listed beside (A) or below (B) each waveform. At the right part of the figure, the parameters of the focal mechanism and the moment magnitude are shown along with the per-centage of double couple (DC) and com-pensated linear vector dipole (CLVD) per-centage for each earthquake.
1385
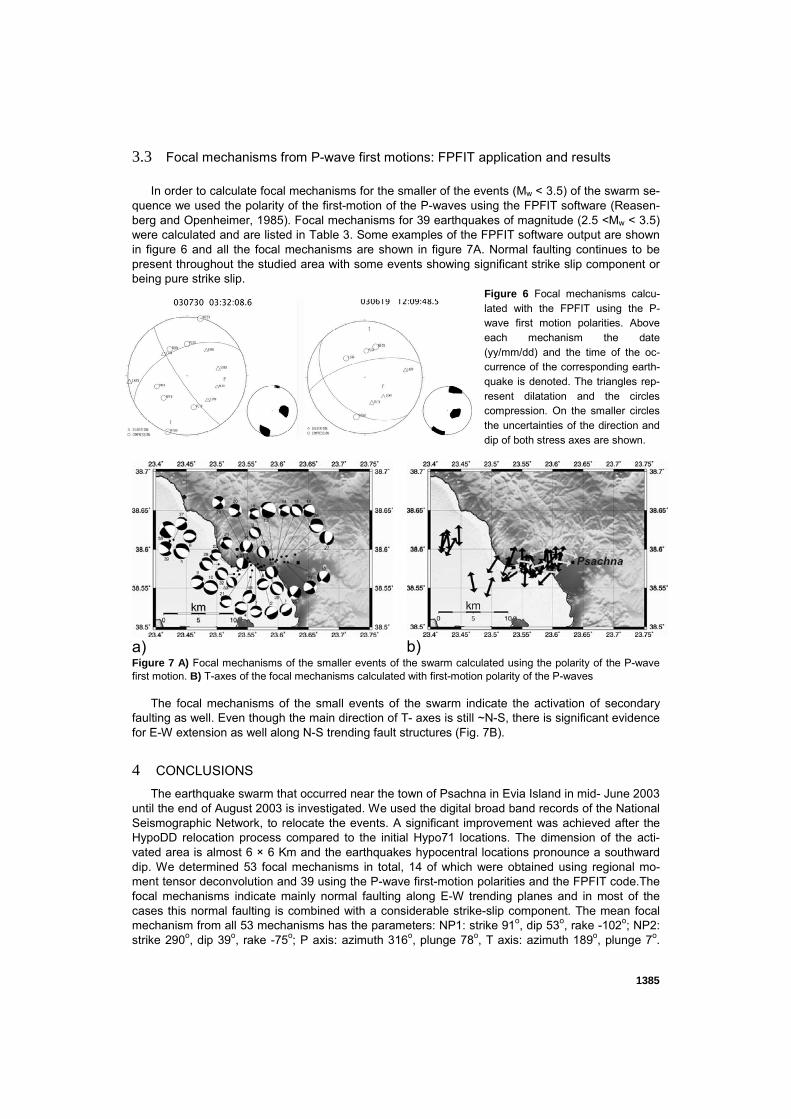
3.3 Focal mechanisms from P-wave first motions: FPFIT application and results In order to calculate focal mechanisms for the smaller of the events (Mw < 3.5) of the swarm se-
quence we used the polarity of the first-motion of the P-waves using the FPFIT software (Reasen-berg and Openheimer, 1985). Focal mechanisms for 39 earthquakes of magnitude (2.5 <Mw < 3.5) were calculated and are listed in Table 3. Some examples of the FPFIT software output are shown in figure 6 and all the focal mechanisms are shown in figure 7A. Normal faulting continues to be present throughout the studied area with some events showing significant strike slip component or being pure strike slip.
Figure 6 Focal mechanisms calcu-lated with the FPFIT using the P-wave first motion polarities. Above each mechanism the date (yy/mm/dd) and the time of the oc-currence of the corresponding earth-quake is denoted. The triangles rep-resent dilatation and the circles compression. On the smaller circles the uncertainties of the direction and dip of both stress axes are shown.
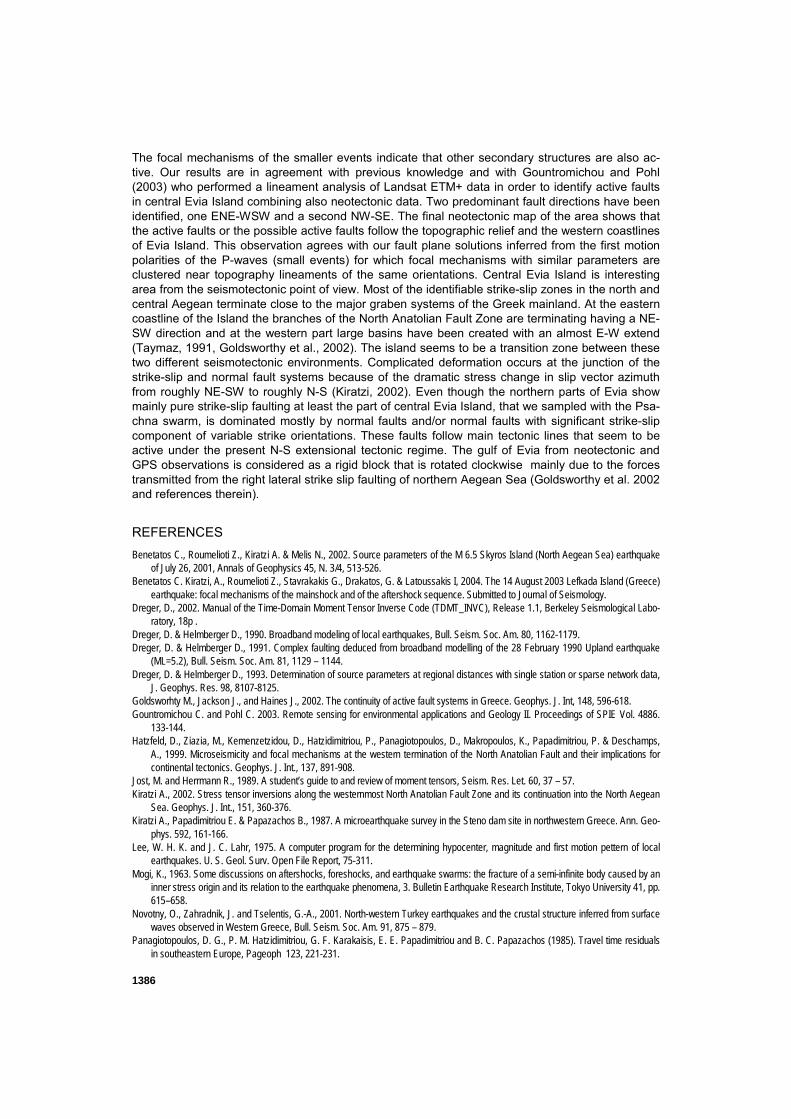
Figure 7 A) Focal mechanisms of the smaller events of the swarm calculated using the polarity of the P-wave first motion. B) T-axes of the focal mechanisms calculated with first-motion polarity of the P-waves
The focal mechanisms of the small events of the swarm indicate the activation of secondary faulting as well. Even though the main direction of T- axes is still ~N-S, there is significant evidence for E-W extension as well along N-S trending fault structures (Fig. 7B).
4 CONCLUSIONS
The earthquake swarm that occurred near the town of Psachna in Evia Island in mid- June 2003 until the end of August 2003 is investigated. We used the digital broad band records of the National Seismographic Network, to relocate the events. A significant improvement was achieved after the HypoDD relocation process compared to the initial Hypo71 locations. The dimension of the acti-vated area is almost 6 × 6 Km and the earthquakes hypocentral locations pronounce a southward dip. We determined 53 focal mechanisms in total, 14 of which were obtained using regional mo-ment tensor deconvolution and 39 using the P-wave first-motion polarities and the FPFIT code.The focal mechanisms indicate mainly normal faulting along E-W trending planes and in most of the cases this normal faulting is combined with a considerable strike-slip component. The mean focal mechanism from all 53 mechanisms has the parameters: NP1: strike 91o, dip 53o, rake -102o; NP2: strike 290o, dip 39o, rake -75o; P axis: azimuth 316o, plunge 78o, T axis: azimuth 189o, plunge 7o.
a)
b)
1386
The focal mechanisms of the smaller events indicate that other secondary structures are also ac-tive. Our results are in agreement with previous knowledge and with Gountromichou and Pohl (2003) who performed a lineament analysis of Landsat ETM+ data in order to identify active faults in central Evia Island combining also neotectonic data. Two predominant fault directions have been identified, one ENE-WSW and a second NW-SE. The final neotectonic map of the area shows that the active faults or the possible active faults follow the topographic relief and the western coastlines of Evia Island. This observation agrees with our fault plane solutions inferred from the first motion polarities of the P-waves (small events) for which focal mechanisms with similar parameters are clustered near topography lineaments of the same orientations. Central Evia Island is interesting area from the seismotectonic point of view. Most of the identifiable strike-slip zones in the north and central Aegean terminate close to the major graben systems of the Greek mainland. At the eastern coastline of the Island the branches of the North Anatolian Fault Zone are terminating having a NE-SW direction and at the western part large basins have been created with an almost E-W extend (Taymaz, 1991, Goldsworthy et al., 2002). The island seems to be a transition zone between these two different seismotectonic environments. Complicated deformation occurs at the junction of the strike-slip and normal fault systems because of the dramatic stress change in slip vector azimuth from roughly NE-SW to roughly N-S (Kiratzi, 2002). Even though the northern parts of Evia show mainly pure strike-slip faulting at least the part of central Evia Island, that we sampled with the Psa-chna swarm, is dominated mostly by normal faults and/or normal faults with significant strike-slip component of variable strike orientations. These faults follow main tectonic lines that seem to be active under the present N-S extensional tectonic regime. The gulf of Evia from neotectonic and GPS observations is considered as a rigid block that is rotated clockwise mainly due to the forces transmitted from the right lateral strike slip faulting of northern Aegean Sea (Goldsworthy et al. 2002 and references therein).
REFERENCES Benetatos C., Roumelioti Z., Kiratzi A. & Melis N., 2002. Source parameters of the M 6.5 Skyros Island (North Aegean Sea) earthquake
of July 26, 2001, Annals of Geophysics 45, N. 3/4, 513-526. Benetatos C. Kiratzi, A., Roumelioti Z., Stavrakakis G., Drakatos, G. & Latoussakis I, 2004. The 14 August 2003 Lefkada Island (Greece)
earthquake: focal mechanisms of the mainshock and of the aftershock sequence. Submitted to Journal of Seismology. Dreger, D., 2002. Manual of the Time-Domain Moment Tensor Inverse Code (TDMT_INVC), Release 1.1, Berkeley Seismological Labo-
ratory, 18p . Dreger, D. & Helmberger D., 1990. Broadband modeling of local earthquakes, Bull. Seism. Soc. Am. 80, 1162-1179. Dreger, D. & Helmberger D., 1991. Complex faulting deduced from broadband modelling of the 28 February 1990 Upland earthquake
(ML=5.2), Bull. Seism. Soc. Am. 81, 1129 – 1144. Dreger, D. & Helmberger D., 1993. Determination of source parameters at regional distances with single station or sparse network data,
J. Geophys. Res. 98, 8107-8125. Goldsworhty M., Jackson J., and Haines J., 2002. The continuity of active fault systems in Greece. Geophys. J. Int, 148, 596-618. Gountromichou C. and Pohl C. 2003. Remote sensing for environmental applications and Geology II. Proceedings of SPIE Vol. 4886.
133-144. Hatzfeld, D., Ziazia, M., Kemenzetzidou, D., Hatzidimitriou, P., Panagiotopoulos, D., Makropoulos, K., Papadimitriou, P. & Deschamps,
A., 1999. Microseismicity and focal mechanisms at the western termination of the North Anatolian Fault and their implications for continental tectonics. Geophys. J. Int., 137, 891-908.
Jost, M. and Herrmann R., 1989. A student’s guide to and review of moment tensors, Seism. Res. Let. 60, 37 – 57. Kiratzi A., 2002. Stress tensor inversions along the westernmost North Anatolian Fault Zone and its continuation into the North Aegean
Sea. Geophys. J. Int., 151, 360-376. Kiratzi A., Papadimitriou E. & Papazachos B., 1987. A microearthquake survey in the Steno dam site in northwestern Greece. Ann. Geo-
phys. 592, 161-166. Lee, W. H. K. and J. C. Lahr, 1975. A computer program for the determining hypocenter, magnitude and first motion pettern of local
earthquakes. U. S. Geol. Surv. Open File Report, 75-311. Mogi, K., 1963. Some discussions on aftershocks, foreshocks, and earthquake swarms: the fracture of a semi-infinite body caused by an
inner stress origin and its relation to the earthquake phenomena, 3. Bulletin Earthquake Research Institute, Tokyo University 41, pp. 615–658.
Novotny, O., Zahradnik, J. and Tselentis, G.-A., 2001. North-western Turkey earthquakes and the crustal structure inferred from surface waves observed in Western Greece, Bull. Seism. Soc. Am. 91, 875 – 879.
Panagiotopoulos, D. G., P. M. Hatzidimitriou, G. F. Karakaisis, E. E. Papadimitriou and B. C. Papazachos (1985). Travel time residuals in southeastern Europe, Pageoph 123, 221-231.
1387
Paige C. & Sanders M., 1982. LSQR: sparse linear equations and least squares problems. ACM Trans. Mathematical software 8 (2), 195-209.
Papadopoulos G.A. , Ganas, A., Karastathis, V., Melis, N., Sokos, E. Orfanogiannaki, K. , Plessa, A. , Ziazia, M. , G. Diakogianni (2003). EARTHQUAKE CLUSTER IN PSACHNA, EVIA ISL., CENTRAL GREECE . Proc of the 1st Int. Workshop on Earthquake Prediction, 6-7.11.2003, Athens, 3 p.
Papazachos, B. & C. Papazachou, 2003. The earthquakes of Greece, 3rd edition, Ziti Public., Thessaloniki, 286p. Pasyanos, M., Dreger D., & Romanowicz B., 1996. Towards real-time determination of regional moment tensors, Bull. Seism. Soc. Am.
86, 1255-1269. Reasenberg P. & Openheimer D., 1985. FPFIT.U.S. Geological Survey 345 Middlefield Road Menlo Park, California. Roumelioti, Z.,Kiratzi A. & N. Melis, 2003a. Relocation of the July 26, 2001 Skyros island (Greece) earthquake sequence using the dou-
ble-difference technique, Physics of the Earth and Planetary Interior, Vol. 138, 231 - 239. Roumelioti Z., Benetatos Ch., Kiratzi A., Stavrakakis G. & Melis N., 2003b. Preliminary study of the 2 December 2002 (M 5.5)
Vartholomio (Western Peloponnese, Greece) earthquake sequence. Submitted to Tectonophysics. Saikia, C., 1994. Modified frequency-wavenumber algorithm for regional seismograms using Filon’s quadrature; modelling of Lg waves in
eastern North America, Geophys. J. Int. 118, 142 – 158. Taymaz, T., Jackson, J. & McKenzie, D., 1991. Active tectonics of the north and central Aegean Sea. Geophys. J. Int., 106, 433-490. Waldhauser F., 2001. HypoDD - A program to compute double-difference hypocenter locations, U.S. Geological Survey open-file report,
113pp. Waldhauser F. & Ellsworth W., 2000. A Double-Difference Location Algorithm: Method and Application to the Northern Hayward Fault,
California. Bull.Seis.Soc.Am., 90, 6, 1353-1368.
APPENDIX – LIST OF TABLES
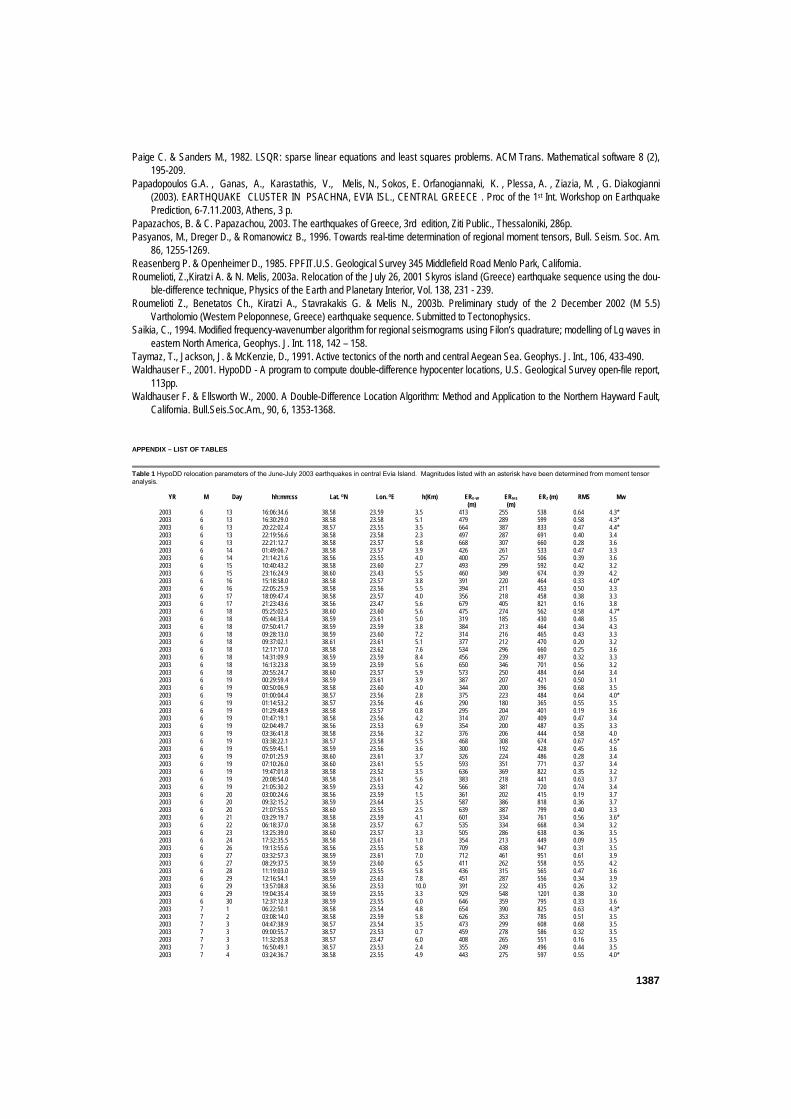
Table 1 HypoDD relocation parameters of the June-July 2003 earthquakes in central Evia Island. Magnitudes listed with an asterisk have been determined from moment tensor analysis.
YR M Day hh:mm:ss Lat. ON Lon. OE h(Km) ERE-W (m)
ERN-S (m)
ERZ (m) RMS Mw
2003 6 13 16:06:34.6 38.58 23.59 3.5 413 255 538 0.64 4.3* 2003 6 13 16:30:29.0 38.58 23.58 5.1 479 289 599 0.58 4.3* 2003 6 13 20:22:02.4 38.57 23.55 3.5 664 387 833 0.47 4.4* 2003 6 13 22:19:56.6 38.58 23.58 2.3 497 287 691 0.40 3.4 2003 6 13 22:21:12.7 38.58 23.57 5.8 668 307 660 0.28 3.6 2003 6 14 01:49:06.7 38.58 23.57 3.9 426 261 533 0.47 3.3 2003 6 14 21:14:21.6 38.56 23.55 4.0 400 257 506 0.39 3.6 2003 6 15 10:40:43.2 38.58 23.60 2.7 493 299 592 0.42 3.2 2003 6 15 23:16:24.9 38.60 23.43 5.5 460 349 674 0.39 4.2 2003 6 16 15:18:58.0 38.58 23.57 3.8 391 220 464 0.33 4.0* 2003 6 16 22:05:25.9 38.58 23.56 5.5 394 211 453 0.50 3.3 2003 6 17 18:09:47.4 38.58 23.57 4.0 356 218 458 0.38 3.3 2003 6 17 21:23:43.6 38.56 23.47 5.6 679 405 821 0.16 3.8 2003 6 18 05:25:02.5 38.60 23.60 5.6 475 274 562 0.58 4.7* 2003 6 18 05:44:33.4 38.59 23.61 5.0 319 185 430 0.48 3.5 2003 6 18 07:50:41.7 38.59 23.59 3.8 384 213 464 0.34 4.3 2003 6 18 09:28:13.0 38.59 23.60 7.2 314 216 465 0.43 3.3 2003 6 18 09:37:02.1 38.61 23.61 5.1 377 212 470 0.20 3.2 2003 6 18 12:17:17.0 38.58 23.62 7.6 534 296 660 0.25 3.6 2003 6 18 14:31:09.9 38.59 23.59 8.4 456 239 497 0.32 3.3 2003 6 18 16:13:23.8 38.59 23.59 5.6 650 346 701 0.56 3.2 2003 6 18 20:55:24.7 38.60 23.57 5.9 573 250 484 0.64 3.4 2003 6 19 00:29:59.4 38.59 23.61 3.9 387 207 421 0.50 3.1 2003 6 19 00:50:06.9 38.58 23.60 4.0 344 200 396 0.68 3.5 2003 6 19 01:00:04.4 38.57 23.56 2.8 375 223 484 0.64 4.0* 2003 6 19 01:14:53.2 38.57 23.56 4.6 290 180 365 0.55 3.5 2003 6 19 01:29:48.9 38.58 23.57 0.8 295 204 401 0.19 3.6 2003 6 19 01:47:19.1 38.58 23.56 4.2 314 207 409 0.47 3.4 2003 6 19 02:04:49.7 38.56 23.53 6.9 354 200 487 0.35 3.3 2003 6 19 03:36:41.8 38.58 23.56 3.2 376 206 444 0.58 4.0 2003 6 19 03:38:22.1 38.57 23.58 5.5 468 308 674 0.67 4.5* 2003 6 19 05:59:45.1 38.59 23.56 3.6 300 192 428 0.45 3.6 2003 6 19 07:01:25.9 38.60 23.61 3.7 326 224 486 0.28 3.4 2003 6 19 07:10:26.0 38.60 23.61 5.5 593 351 771 0.37 3.4 2003 6 19 19:47:01.8 38.58 23.52 3.5 636 369 822 0.35 3.2 2003 6 19 20:08:54.0 38.58 23.61 5.6 383 218 441 0.63 3.7 2003 6 19 21:05:30.2 38.59 23.53 4.2 566 381 720 0.74 3.4 2003 6 20 03:00:24.6 38.56 23.59 1.5 361 202 415 0.19 3.7 2003 6 20 09:32:15.2 38.59 23.64 3.5 587 386 818 0.36 3.7 2003 6 20 21:07:55.5 38.60 23.55 2.5 639 387 799 0.40 3.3 2003 6 21 03:29:19.7 38.58 23.59 4.1 601 334 761 0.56 3.6* 2003 6 22 06:18:37.0 38.58 23.57 6.7 535 334 668 0.34 3.2 2003 6 23 13:25:39.0 38.60 23.57 3.3 505 286 638 0.36 3.5 2003 6 24 17:32:35.5 38.58 23.61 1.0 354 213 449 0.09 3.5 2003 6 26 19:13:55.6 38.56 23.55 5.8 709 438 947 0.31 3.5 2003 6 27 03:32:57.3 38.59 23.61 7.0 712 461 951 0.61 3.9 2003 6 27 08:29:37.5 38.59 23.60 6.5 411 262 558 0.55 4.2 2003 6 28 11:19:03.0 38.59 23.55 5.8 436 315 565 0.47 3.6 2003 6 29 12:16:54.1 38.59 23.63 7.8 451 287 556 0.34 3.9 2003 6 29 13:57:08.8 38.56 23.53 10.0 391 232 435 0.26 3.2 2003 6 29 19:04:35.4 38.59 23.55 3.3 929 548 1201 0.38 3.0 2003 6 30 12:37:12.8 38.59 23.55 6.0 646 359 795 0.33 3.6 2003 7 1 06:22:50.1 38.58 23.54 4.8 654 390 825 0.63 4.3* 2003 7 2 03:08:14.0 38.58 23.59 5.8 626 353 785 0.51 3.5 2003 7 3 04:47:38.9 38.57 23.54 3.5 473 299 608 0.68 3.5 2003 7 3 09:00:55.7 38.57 23.53 0.7 459 278 586 0.32 3.5 2003 7 3 11:32:05.8 38.57 23.47 6.0 408 265 551 0.16 3.5 2003 7 3 16:50:49.1 38.57 23.53 2.4 355 249 496 0.44 3.5 2003 7 4 03:24:36.7 38.58 23.55 4.9 443 275 597 0.55 4.0*
1388
2003 7 4 05:43:20.2 38.57 23.54 5.1 435 276 606 0.66 3.0 2003 7 4 07:17:11.7 38.59 23.54 4.5 492 334 709 0.51 3.4 2003 7 4 07:18:48.2 38.58 23.55 2.4 516 311 667 0.44 3.6 2003 7 4 07:18:50.7 38.58 23.60 2.6 698 374 832 0.25 n/a 2003 7 5 13:00:14.0 38.58 23.55 5.4 537 316 680 0.60 3.6* 2003 7 8 20:35:54.7 38.57 23.60 7.5 732 442 907 0.34 3.7 2003 7 16 04:45:38.4 38.59 23.60 3.3 733 479 994 0.23 3.1 2003 7 16 12:10:30.1 38.59 23.59 4.6 543 324 685 0.32 3.5 2003 7 16 15:40:28.6 38.60 23.61 2.4 431 270 576 0.32 3.8 2003 7 30 03:20:29.1 38.61 23.43 4.7 590 366 782 0.33 3.6 2003 7 30 03:32:08.6 38.61 23.42 6.7 553 336 750 0.16 4.4 2003 7 30 08:57:07.4 38.61 23.42 6.8 696 430 931 0.44 4.0
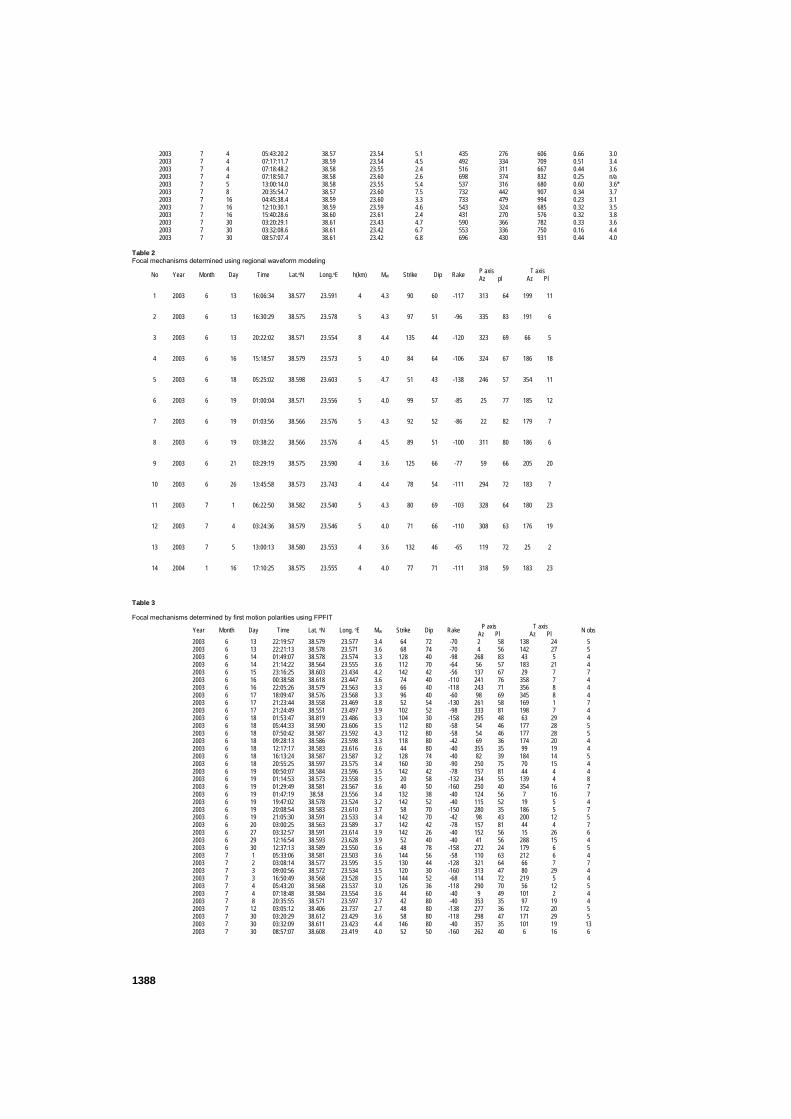
Table 2 Focal mechanisms determined using regional waveform modeling
No Year Month Day Time Lat.oN Long.oE h(km) MW Strike Dip Rake P axis Az pl
T axis Az Pl
1 2003 6 13 16:06:34 38.577 23.591 4 4.3 90 60 -117 313 64 199 11
2 2003 6 13 16:30:29 38.575 23.578 5 4.3 97 51 -96 335 83 191 6
3 2003 6 13 20:22:02 38.571 23.554 8 4.4 135 44 -120 323 69 66 5
4 2003 6 16 15:18:57 38.579 23.573 5 4.0 84 64 -106 324 67 186 18
5 2003 6 18 05:25:02 38.598 23.603 5 4.7 51 43 -138 246 57 354 11
6 2003 6 19 01:00:04 38.571 23.556 5 4.0 99 57 -85 25 77 185 12
7 2003 6 19 01:03:56 38.566 23.576 5 4.3 92 52 -86 22 82 179 7
8 2003 6 19 03:38:22 38.566 23.576 4 4.5 89 51 -100 311 80 186 6
9 2003 6 21 03:29:19 38.575 23.590 4 3.6 125 66 -77 59 66 205 20
10 2003 6 26 13:45:58 38.573 23.743 4 4.4 78 54 -111 294 72 183 7
11 2003 7 1 06:22:50 38.582 23.540 5 4.3 80 69 -103 328 64 180 23
12 2003 7 4 03:24:36 38.579 23.546 5 4.0 71 66 -110 308 63 176 19
13 2003 7 5 13:00:13 38.580 23.553 4 3.6 132 46 -65 119 72 25 2
14 2004 1 16 17:10:25 38.575 23.555 4 4.0 77 71 -111 318 59 183 23
Table 3
Focal mechanisms determined by first motion polarities using FPFIT
Year Month Day Time Lat. oN Long. oE MW Strike Dip Rake P axis Az Pl
T axis Az Pl N obs
2003 6 13 22:19:57 38.579 23.577 3.4 64 72 -70 2 58 138 24 5 2003 6 13 22:21:13 38.578 23.571 3.6 68 74 -70 4 56 142 27 5 2003 6 14 01:49:07 38.578 23.574 3.3 128 40 -98 268 83 43 5 4 2003 6 14 21:14:22 38.564 23.555 3.6 112 70 -64 56 57 183 21 4 2003 6 15 23:16:25 38.603 23.434 4.2 142 42 -56 137 67 29 7 7 2003 6 16 00:38:58 38.618 23.447 3.6 74 40 -110 241 76 358 7 4 2003 6 16 22:05:26 38.579 23.563 3.3 66 40 -118 243 71 356 8 4 2003 6 17 18:09:47 38.576 23.568 3.3 96 40 -60 98 69 345 8 4 2003 6 17 21:23:44 38.558 23.469 3.8 52 54 -130 261 58 169 1 7 2003 6 17 21:24:49 38.551 23.497 3.9 102 52 -98 333 81 198 7 4 2003 6 18 01:53:47 38.819 23.486 3.3 104 30 -158 295 48 63 29 4 2003 6 18 05:44:33 38.590 23.606 3.5 112 80 -58 54 46 177 28 5 2003 6 18 07:50:42 38.587 23.592 4.3 112 80 -58 54 46 177 28 5 2003 6 18 09:28:13 38.586 23.598 3.3 118 80 -42 69 36 174 20 4 2003 6 18 12:17:17 38.583 23.616 3.6 44 80 -40 355 35 99 19 4 2003 6 18 16:13:24 38.587 23.587 3.2 128 74 -40 82 39 184 14 5 2003 6 18 20:55:25 38.597 23.575 3.4 160 30 -90 250 75 70 15 4 2003 6 19 00:50:07 38.584 23.596 3.5 142 42 -78 157 81 44 4 4 2003 6 19 01:14:53 38.573 23.558 3.5 20 58 -132 234 55 139 4 8 2003 6 19 01:29:49 38.581 23.567 3.6 40 50 -160 250 40 354 16 7 2003 6 19 01:47:19 38.58 23.556 3.4 132 38 -40 124 56 7 16 7 2003 6 19 19:47:02 38.578 23.524 3.2 142 52 -40 115 52 19 5 4 2003 6 19 20:08:54 38.583 23.610 3.7 58 70 -150 280 35 186 5 7 2003 6 19 21:05:30 38.591 23.533 3.4 142 70 -42 98 43 200 12 5 2003 6 20 03:00:25 38.563 23.589 3.7 142 42 -78 157 81 44 4 7 2003 6 27 03:32:57 38.591 23.614 3.9 142 26 -40 152 56 15 26 6 2003 6 29 12:16:54 38.593 23.628 3.9 52 40 -40 41 56 288 15 4 2003 6 30 12:37:13 38.589 23.550 3.6 48 78 -158 272 24 179 6 5 2003 7 1 05:33:06 38.581 23.503 3.6 144 56 -58 110 63 212 6 4 2003 7 2 03:08:14 38.577 23.595 3.5 130 44 -128 321 64 66 7 7 2003 7 3 09:00:56 38.572 23.534 3.5 120 30 -160 313 47 80 29 4 2003 7 3 16:50:49 38.568 23.528 3.5 144 52 -68 114 72 219 5 4 2003 7 4 05:43:20 38.568 23.537 3.0 126 36 -118 290 70 56 12 5 2003 7 4 07:18:48 38.584 23.554 3.6 44 60 -40 9 49 101 2 4 2003 7 8 20:35:55 38.571 23.597 3.7 42 80 -40 353 35 97 19 4 2003 7 12 03:05:12 38.406 23.737 2.7 48 80 -138 277 36 172 20 5 2003 7 30 03:20:29 38.612 23.429 3.6 58 80 -118 298 47 171 29 5 2003 7 30 03:32:09 38.611 23.423 4.4 146 80 -40 357 35 101 19 13 2003 7 30 08:57:07 38.608 23.419 4.0 52 50 -160 262 40 6 16 6