The Normal Distribution - California State University...
14
1 The Normal Distribution Cal State Northridge Ψ320 Andrew Ainsworth PhD The standard deviation Benefits: Uses measure of central tendency (i.e. mean) Uses all of the data points Has a special relationship with the normal curve Can be used in further calculations 2 Psy 320 - Cal State Northridge Normal Distribution 0 0.005 0.01 0.015 0.02 0.025 20 40 60 80 100 120 140 160 180 f(X) Example: The Mean = 100 and the Standard Deviation = 20 3 Psy 320 - Cal State Northridge
Transcript of The Normal Distribution - California State University...
1
The Normal Distribution
Cal State Northridge
Ψ320
Andrew Ainsworth PhD
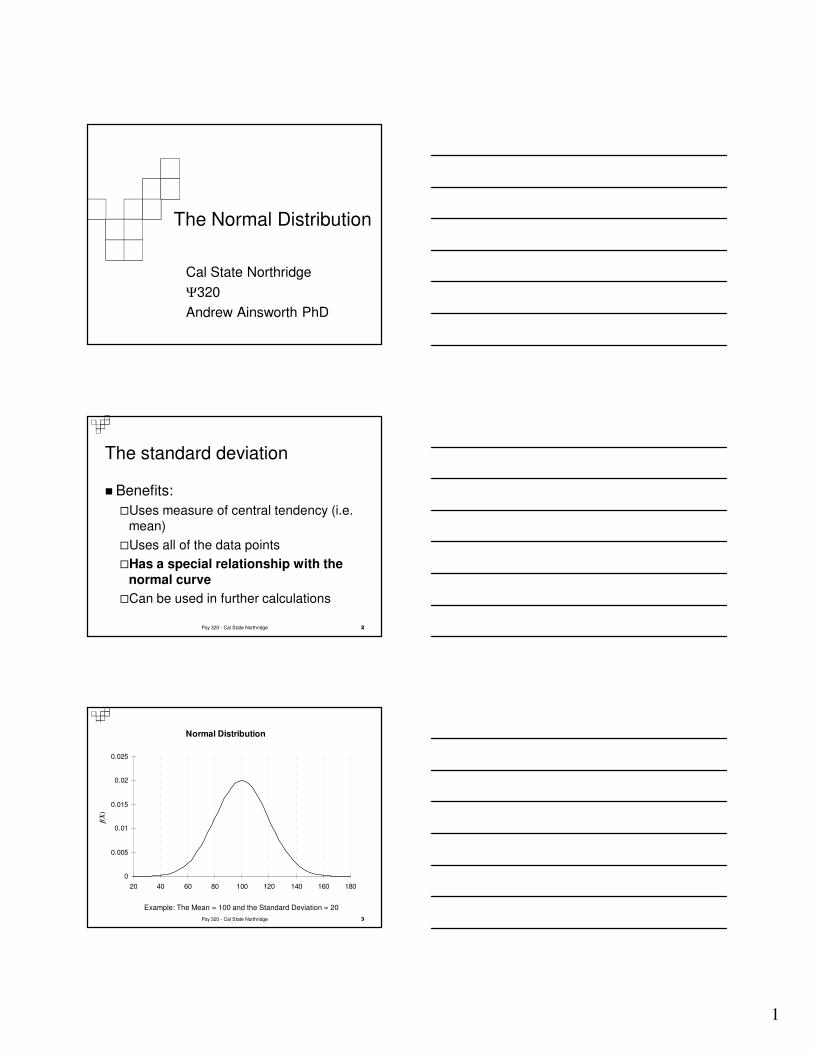
The standard deviation
� Benefits:
�Uses measure of central tendency (i.e. mean)
�Uses all of the data points
�Has a special relationship with the
normal curve
�Can be used in further calculations
2Psy 320 - Cal State Northridge
Normal Distribution
0
0.005
0.01
0.015
0.02
0.025
20 40 60 80 100 120 140 160 180
f(X
)
Example: The Mean = 100 and the Standard Deviation = 20
3Psy 320 - Cal State Northridge
2
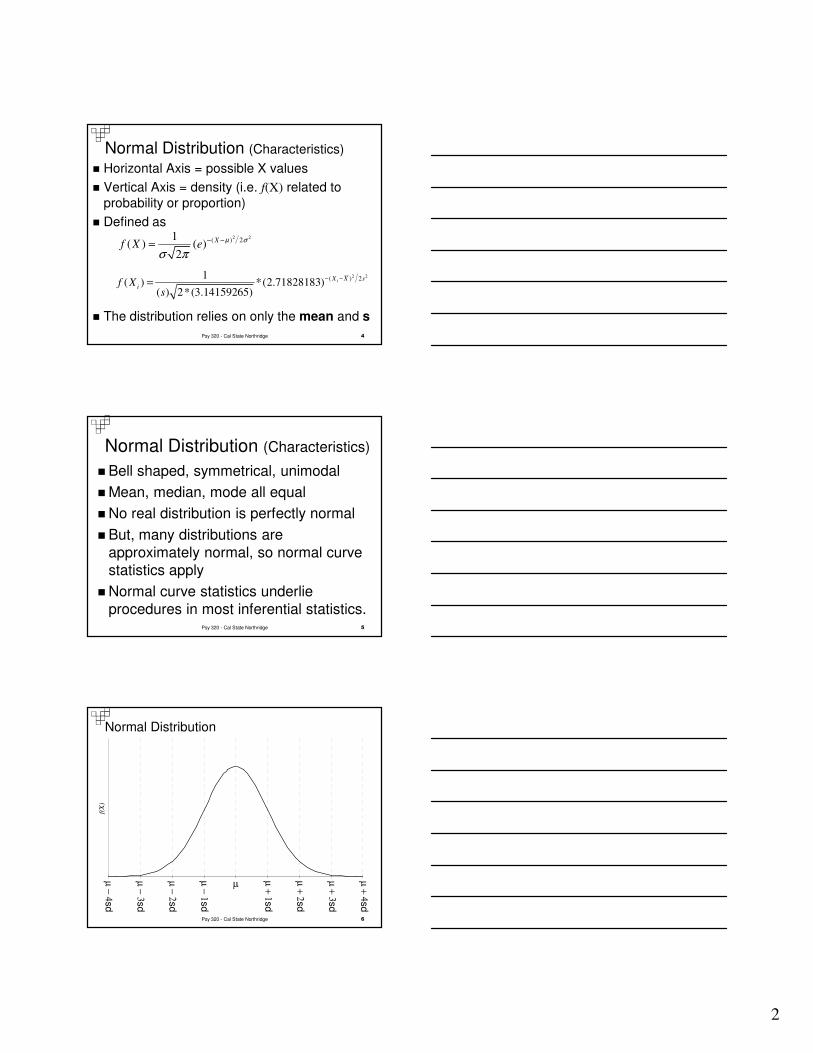
Normal Distribution (Characteristics)
� Horizontal Axis = possible X values
� Vertical Axis = density (i.e. f(X) related to
probability or proportion)
� Defined as
� The distribution relies on only the mean and s
2 2( ) 21
( ) ( )2
Xf X e
µ σ
σ π
− −=
2 2( ) 21
( ) *(2.71828183)( ) 2*(3.14159265)
iX X s
if X
s
− −=
4Psy 320 - Cal State Northridge
Normal Distribution (Characteristics)
� Bell shaped, symmetrical, unimodal
� Mean, median, mode all equal
� No real distribution is perfectly normal
� But, many distributions are
approximately normal, so normal curve
statistics apply
� Normal curve statistics underlie
procedures in most inferential statistics.5Psy 320 - Cal State Northridge
Normal Distribution
f(X
)
µ
µ +
1sd
µ +
2sd
µ +
3sd
µ −
3sd
µ −
2sd
µ −
1sd
µ +
4sd
µ −
4sd
6Psy 320 - Cal State Northridge
3
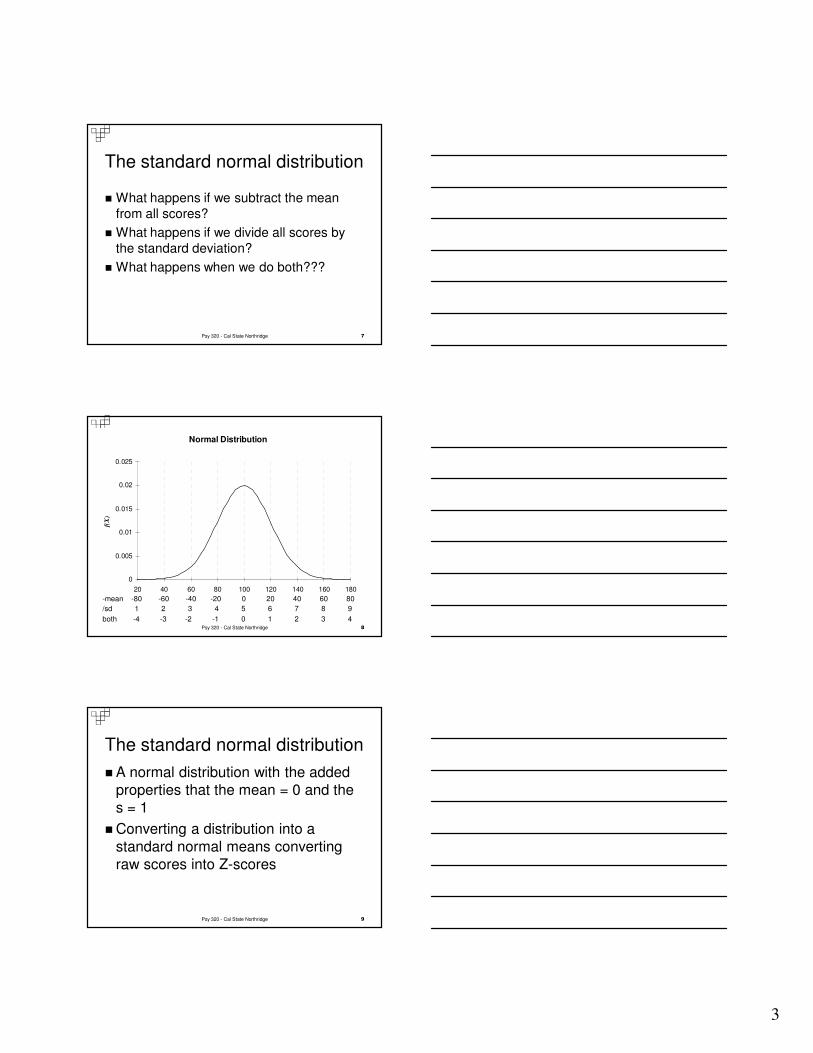
The standard normal distribution
� What happens if we subtract the mean
from all scores?
� What happens if we divide all scores by
the standard deviation?
� What happens when we do both???
7Psy 320 - Cal State Northridge
Normal Distribution
0
0.005
0.01
0.015
0.02
0.025
20 40 60 80 100 120 140 160 180
f(X
)
-mean -80 -60 -40 -20 0 20 40 60 80
/sd 1 2 3 4 5 6 7 8 9
both -4 -3 -2 -1 0 1 2 3 48Psy 320 - Cal State Northridge
The standard normal distribution
� A normal distribution with the added
properties that the mean = 0 and the
s = 1
� Converting a distribution into a
standard normal means converting
raw scores into Z-scores
9Psy 320 - Cal State Northridge
4
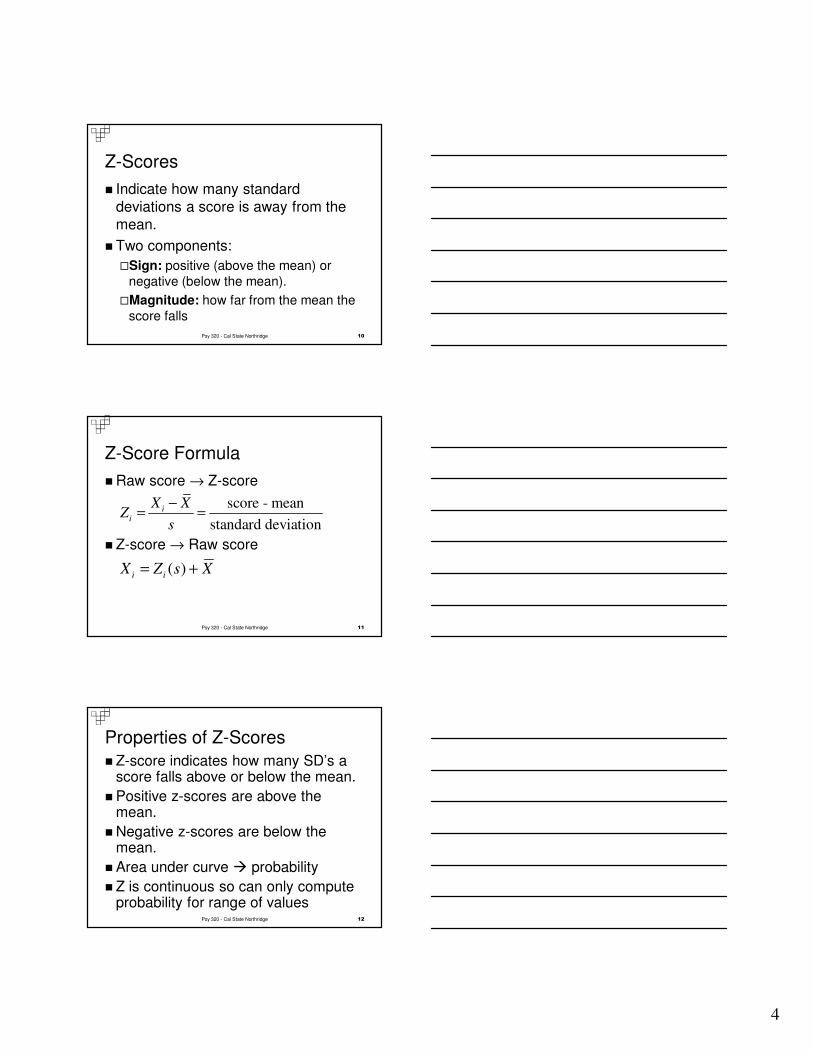
Z-Scores
� Indicate how many standard
deviations a score is away from the
mean.
� Two components:
�Sign: positive (above the mean) or
negative (below the mean).
�Magnitude: how far from the mean the
score falls
10Psy 320 - Cal State Northridge
Z-Score Formula
� Raw score → Z-score
� Z-score → Raw score
score - mean
standard deviation
ii
X XZ
s
−= =
( )i iX Z s X= +
11Psy 320 - Cal State Northridge
Properties of Z-Scores
� Z-score indicates how many SD’s a score falls above or below the mean.
� Positive z-scores are above the mean.
� Negative z-scores are below the mean.
� Area under curve � probability
� Z is continuous so can only compute probability for range of values
12Psy 320 - Cal State Northridge
5
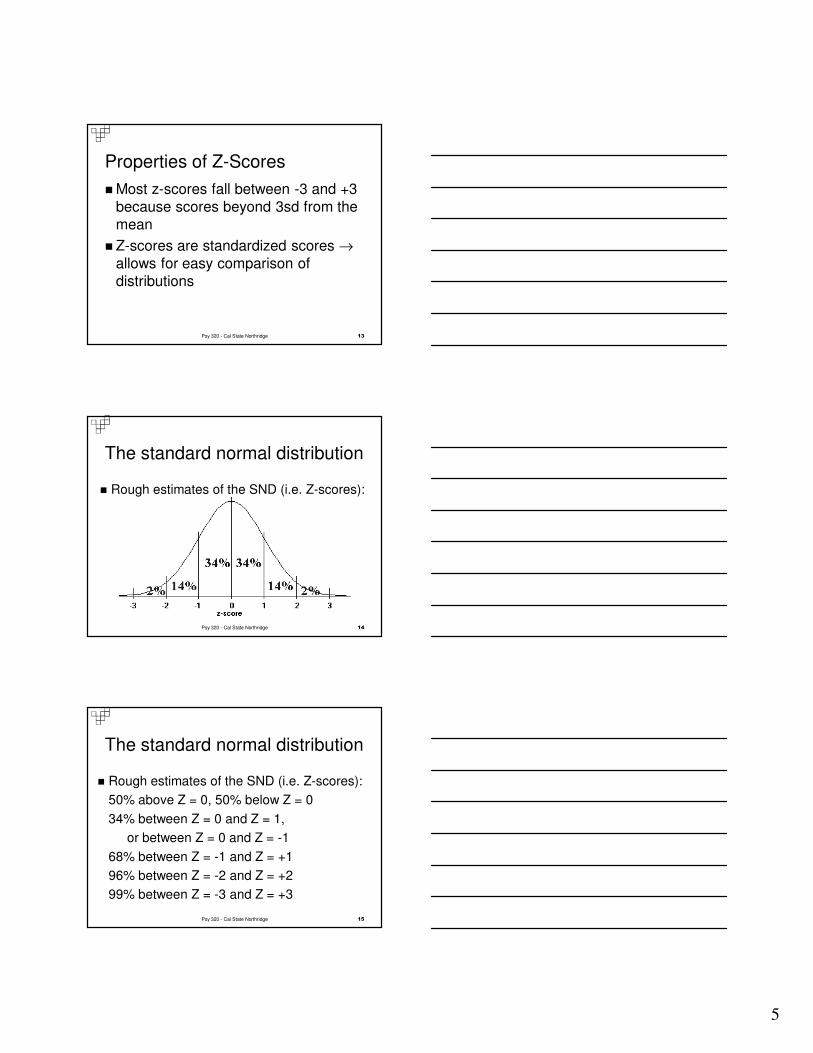
Properties of Z-Scores
� Most z-scores fall between -3 and +3
because scores beyond 3sd from the
mean
� Z-scores are standardized scores →
allows for easy comparison of
distributions
13Psy 320 - Cal State Northridge
The standard normal distribution
� Rough estimates of the SND (i.e. Z-scores):
14Psy 320 - Cal State Northridge
The standard normal distribution
� Rough estimates of the SND (i.e. Z-scores):
50% above Z = 0, 50% below Z = 0
34% between Z = 0 and Z = 1,
or between Z = 0 and Z = -1
68% between Z = -1 and Z = +1
96% between Z = -2 and Z = +2
99% between Z = -3 and Z = +3
15Psy 320 - Cal State Northridge
6
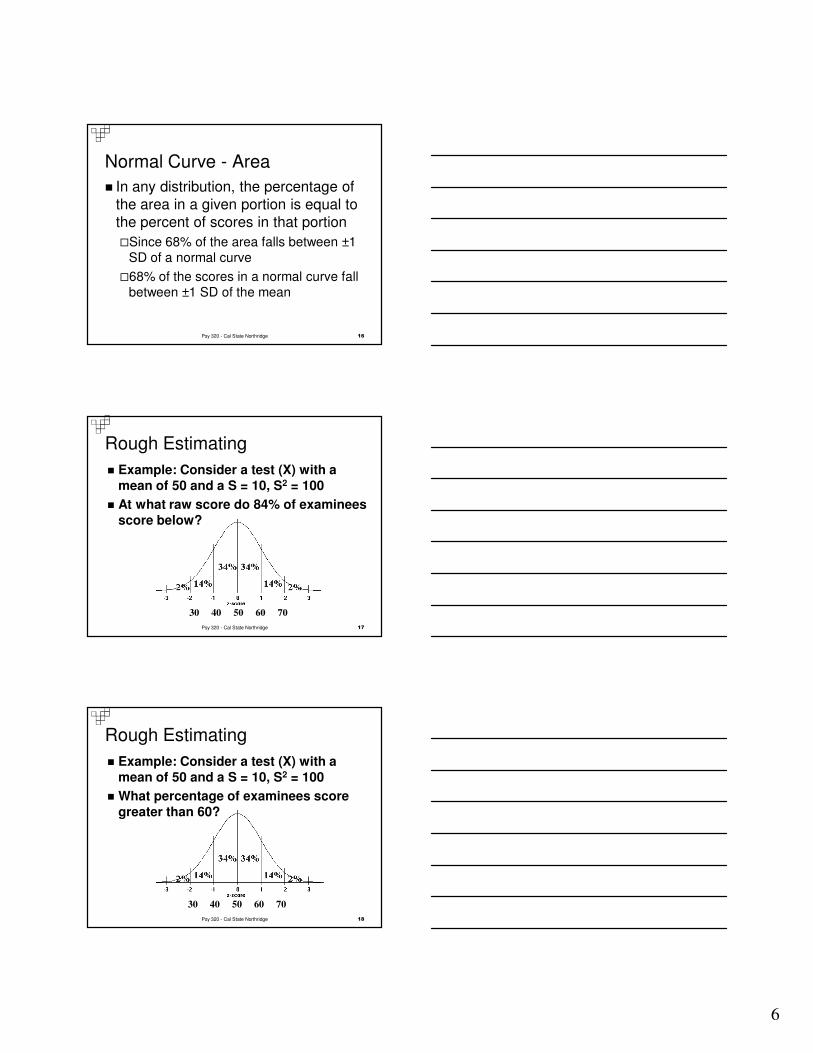
Normal Curve - Area
� In any distribution, the percentage of
the area in a given portion is equal to
the percent of scores in that portion
�Since 68% of the area falls between ±1 SD of a normal curve
�68% of the scores in a normal curve fall between ±1 SD of the mean
16Psy 320 - Cal State Northridge
Rough Estimating
� Example: Consider a test (X) with a
mean of 50 and a S = 10, S2 = 100
� At what raw score do 84% of examinees
score below?
30 40 50 60 70
17Psy 320 - Cal State Northridge
Rough Estimating
� Example: Consider a test (X) with a
mean of 50 and a S = 10, S2 = 100
� What percentage of examinees score
greater than 60?
30 40 50 60 70
18Psy 320 - Cal State Northridge
7
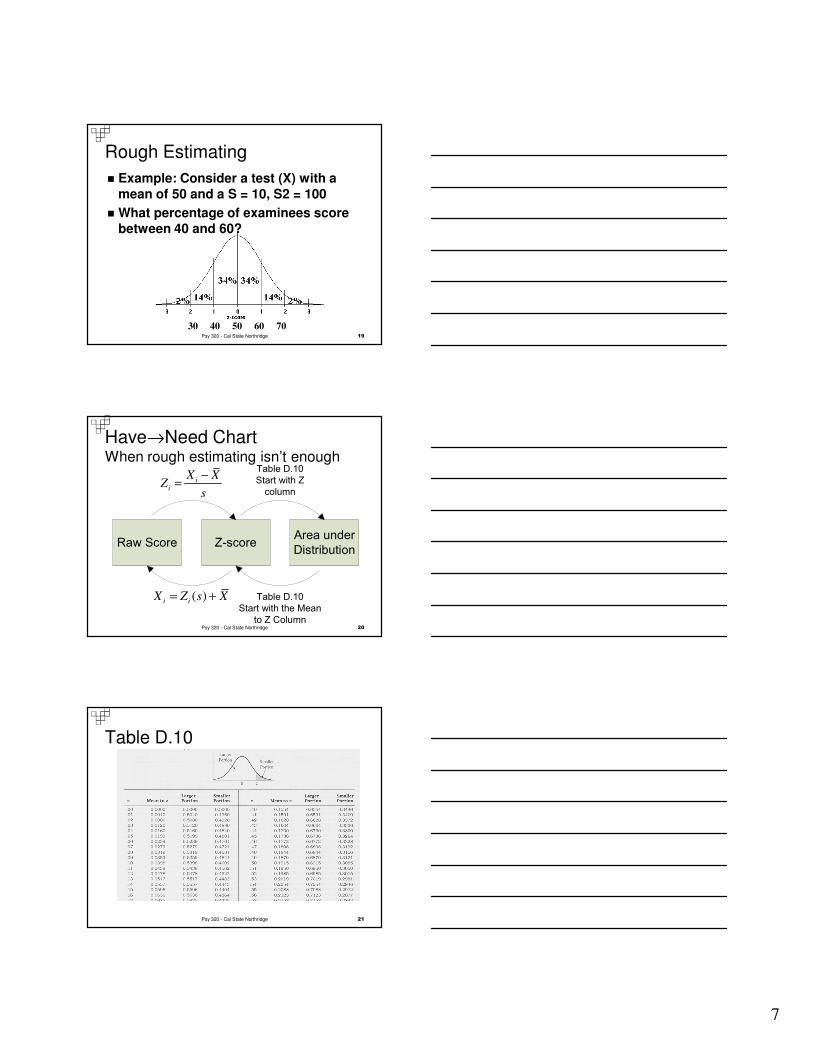
Rough Estimating
� Example: Consider a test (X) with a
mean of 50 and a S = 10, S2 = 100
� What percentage of examinees score
between 40 and 60?
30 40 50 60 70 19Psy 320 - Cal State Northridge
Have→Need ChartWhen rough estimating isn’t enough
Raw ScoreArea under
DistributionZ-score
ii
X XZ
s
−=
( )i i
X Z s X= +
Table D.10
Start with Z
column
Table D.10
Start with the Mean
to Z Column20Psy 320 - Cal State Northridge
Table D.10
21Psy 320 - Cal State Northridge
8
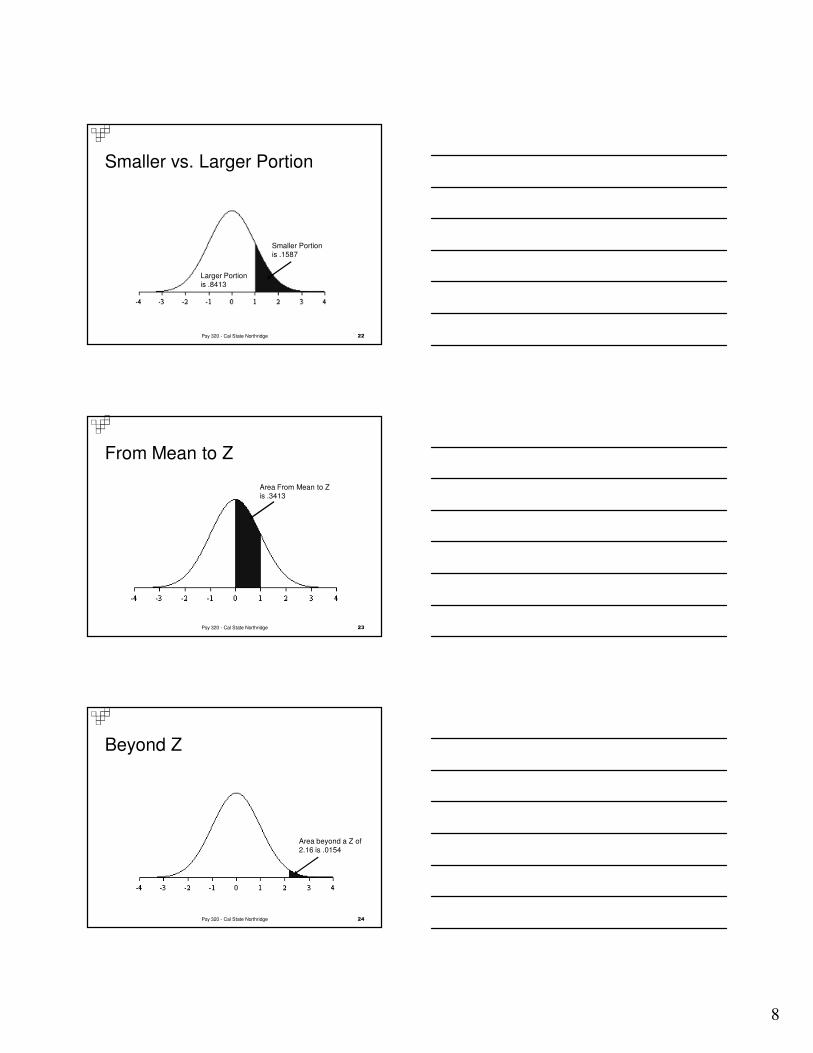
Smaller vs. Larger Portion
Larger Portion is .8413
Smaller Portion is .1587
22Psy 320 - Cal State Northridge
From Mean to Z
Area From Mean to Z is .3413
23Psy 320 - Cal State Northridge
Beyond Z
Area beyond a Z of 2.16 is .0154
24Psy 320 - Cal State Northridge
9
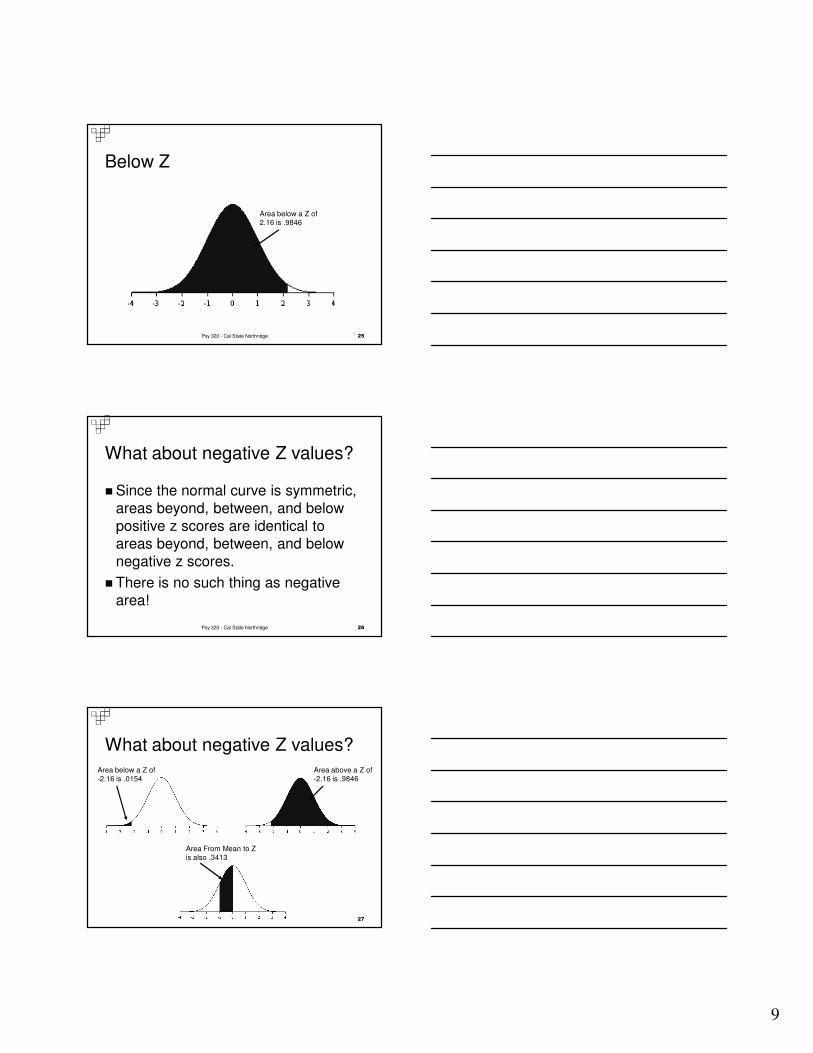
Below Z
Area below a Z of 2.16 is .9846
25Psy 320 - Cal State Northridge
What about negative Z values?
� Since the normal curve is symmetric,
areas beyond, between, and below
positive z scores are identical to
areas beyond, between, and below
negative z scores.
� There is no such thing as negative
area!
26Psy 320 - Cal State Northridge
What about negative Z values?
Area above a Z of -2.16 is .9846
Area below a Z of -2.16 is .0154
Area From Mean to Z is also .3413
27

10
Keep in mind that…
� total area under the curve is 100%.
� area above or below the mean is 50%.
� your numbers should make sense.
�Does your area make sense? Does it
seem too big/small??
28Psy 320 - Cal State Northridge
Tips to remember!!!
1. Always draw a picture first
2. Percent of area above a negative or
below a positive z score is the
“larger portion”.
3. Percent of area below a negative or
above a positive z score is the
“smaller portion”.
4. Always draw a picture first!29Psy 320 - Cal State Northridge
Tips to remember!!!
5. Always draw a picture first!!
6. Percent of area between two
positive or two negative z-scores is
the difference of the two “mean to z”
areas.
7. Always draw a picture first!!!
30Psy 320 - Cal State Northridge
11
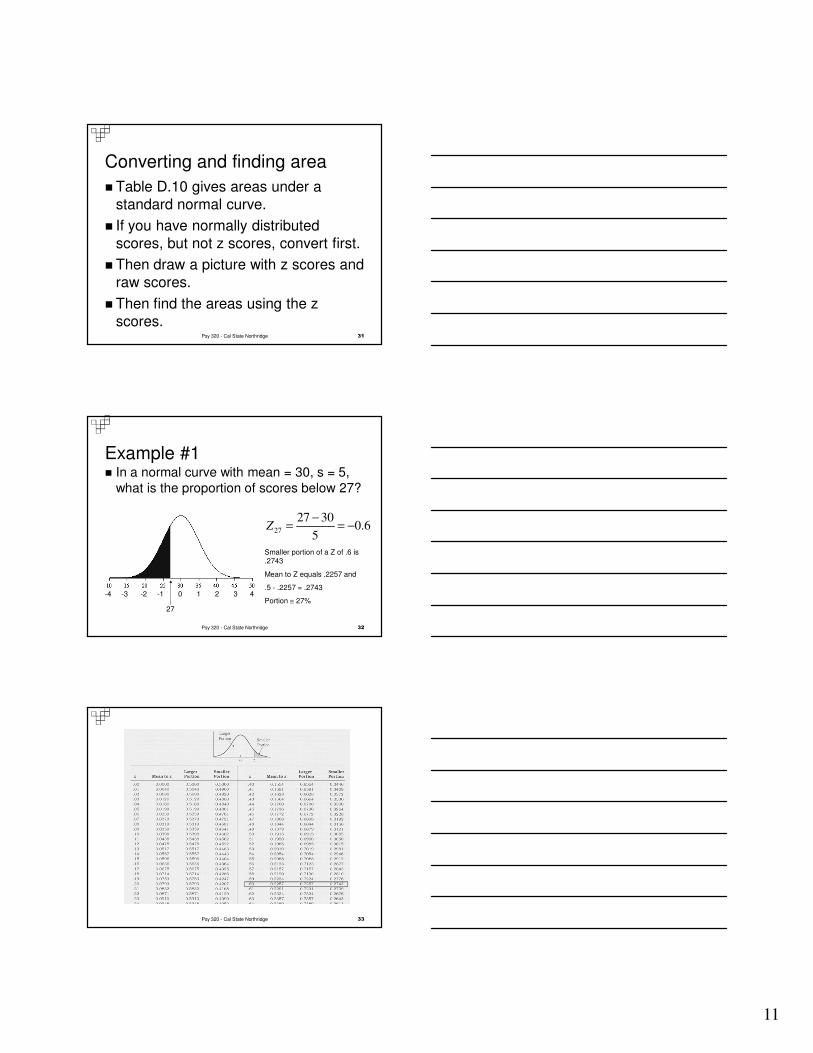
Converting and finding area
� Table D.10 gives areas under a
standard normal curve.
� If you have normally distributed
scores, but not z scores, convert first.
� Then draw a picture with z scores and
raw scores.
� Then find the areas using the z
scores.31Psy 320 - Cal State Northridge
Example #1� In a normal curve with mean = 30, s = 5,
what is the proportion of scores below 27?
27
-4 -3 -2 -1 0 1 2 3 4
27
27 300.6
5Z
−= = −
Smaller portion of a Z of .6 is .2743
Mean to Z equals .2257 and
.5 - .2257 = .2743
Portion ≅ 27%
32Psy 320 - Cal State Northridge
33Psy 320 - Cal State Northridge
12
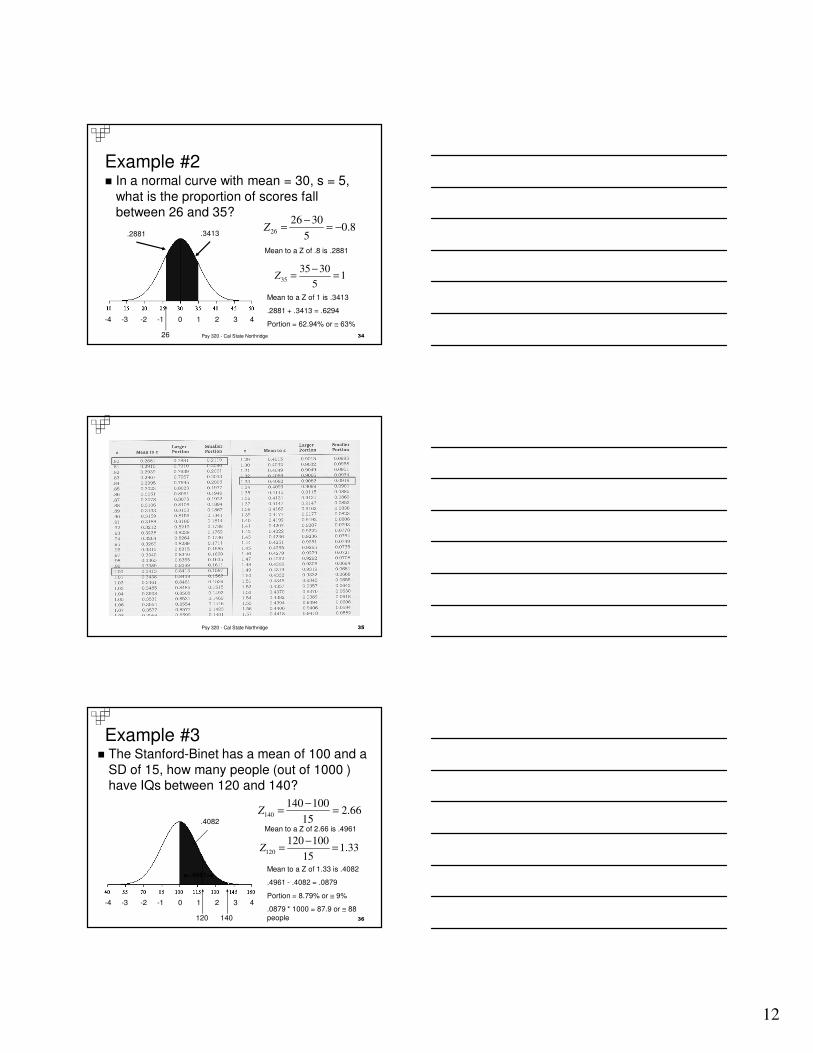
Example #2� In a normal curve with mean = 30, s = 5,
what is the proportion of scores fall between 26 and 35?
26
-4 -3 -2 -1 0 1 2 3 4
26
26 300.8
5Z
−= = −
Mean to a Z of .8 is .2881
35
35 301
5Z
−= =
Mean to a Z of 1 is .3413
.2881 + .3413 = .6294
Portion = 62.94% or ≅ 63%
.3413.2881
34Psy 320 - Cal State Northridge
35Psy 320 - Cal State Northridge
Example #3� The Stanford-Binet has a mean of 100 and a
SD of 15, how many people (out of 1000 ) have IQs between 120 and 140?
120
-4 -3 -2 -1 0 1 2 3 4
140
140 1002.66
15Z
−= =
Mean to a Z of 2.66 is .4961
120
120 1001.33
15Z
−= =
Mean to a Z of 1.33 is .4082
.4961 - .4082 = .0879
Portion = 8.79% or ≅ 9%
.0879 * 1000 = 87.9 or ≅ 88 people140
.4082
←←←←.4961→→→→
36
13
37Psy 320 - Cal State Northridge
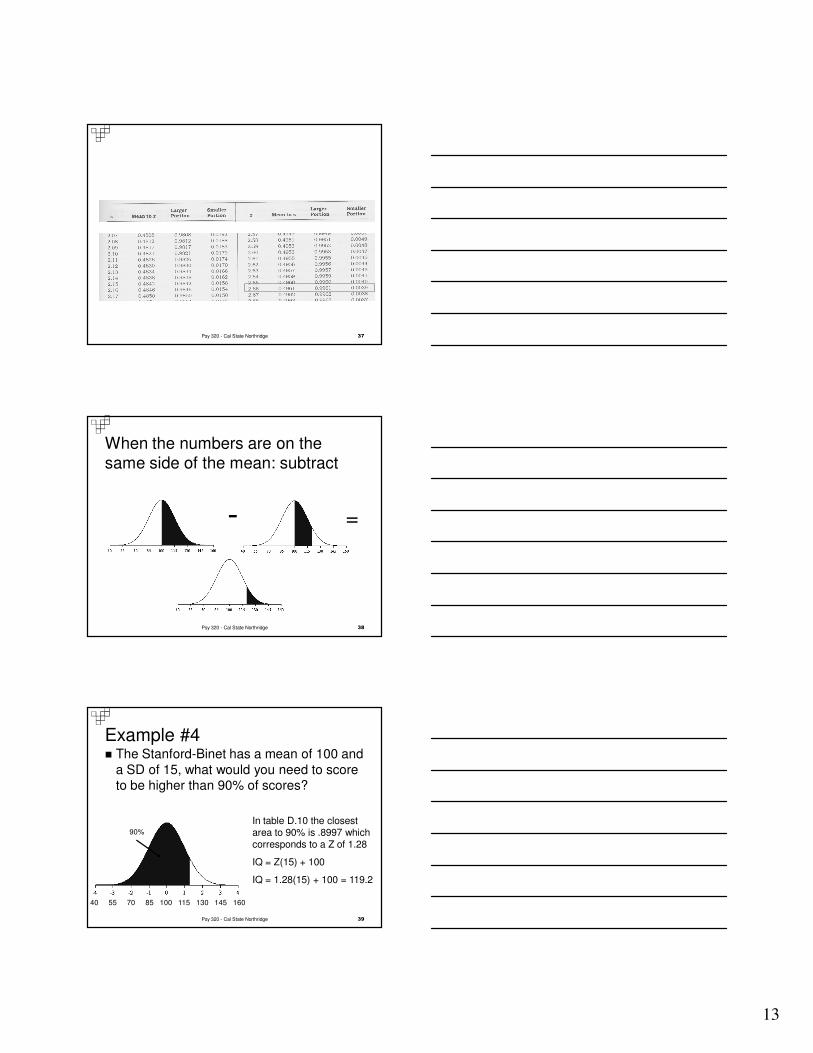
When the numbers are on the same side of the mean: subtract
=-
38Psy 320 - Cal State Northridge
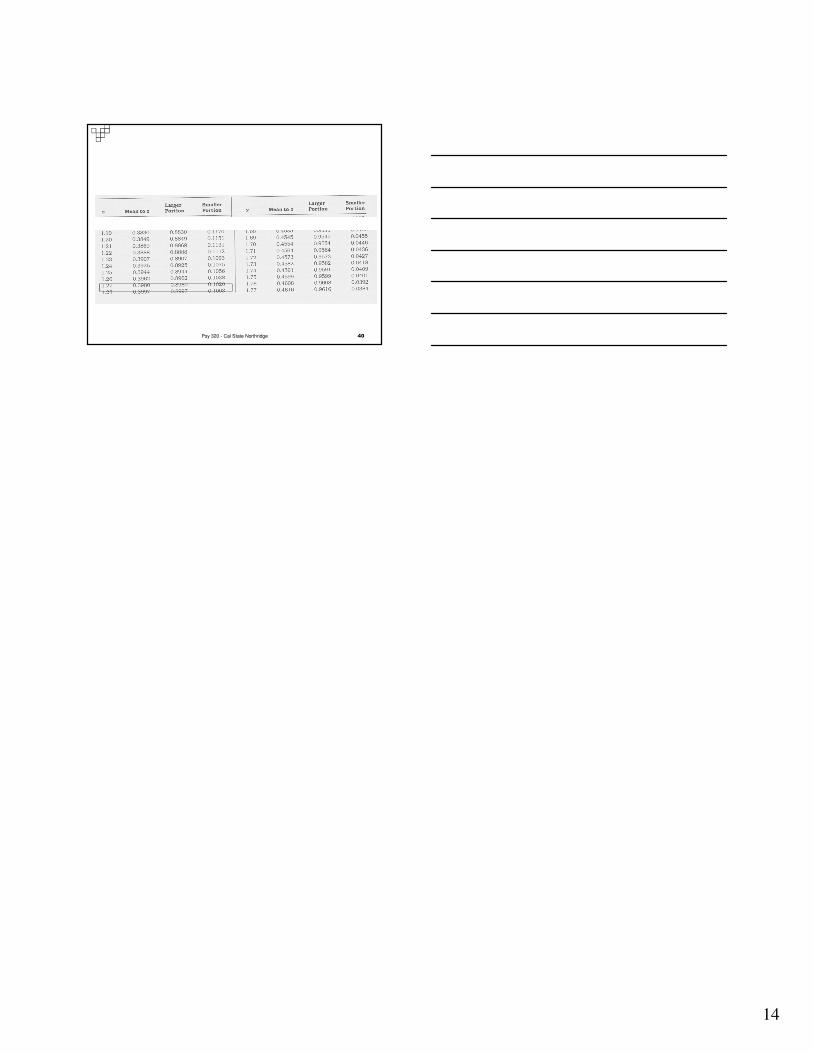
Example #4� The Stanford-Binet has a mean of 100 and
a SD of 15, what would you need to score to be higher than 90% of scores?
In table D.10 the closest area to 90% is .8997 which corresponds to a Z of 1.28
IQ = Z(15) + 100
IQ = 1.28(15) + 100 = 119.2
90%
40 55 70 85 100 115 130 145 160
39Psy 320 - Cal State Northridge
14
40Psy 320 - Cal State Northridge