solucionario mecanica vectorial para ingenieros - beer & johnston (dinamica) 7ma edicion Cap 19
Page 1 of 4
The Half-Life of Beer Foam
Dr. Mark Headlee, United World College USA, Montezuma, NM
This article describes a simply and reliable method to measure the half-life of beer foam.
Investigating the exponential decay of beer foam is not a new. Leike1 popularized this but his
method is complex and not suitable for higher school students. Revised techniques for measuring
the decay of beer foam have been offered by Fisher2 and Hackbarth3 but again their methods are
complicated.
My method was been used for many years by high school students and has proven to be
easy and successful. I suggest that you use room temperature non-alcoholic beer. Peanuts and
pretzels are optional. With just a measuring cylinder and a stopwatch students can easily get the
required data to demonstrate the exponential decay and half-life of beer foam.
You will need a 500 mL measuring cylinder, masking tape, a centimeter ruler, a stopwatch,
and a bottle of non-alcoholic beer (with a twist-off top). Put a strip of masking tape along the
vertical scale of the measuring cylinder. You will mark the beer liquid level on the tape at equal
time intervals. After the experiment you will measure the beer height that is marked on the tape,
and then record the height and the time for each mark on the tape.
First, pour beer into the measuring cylinder until the foam nearly reaches the top. Now
quickly mark the beer liquid level on the tape and start the stopwatch. Mark the beer level every
5 seconds. Do this for as long as you can, up to two minutes. When you no longer notice any
change in beer liquid level, continue waiting for another two to three minutes until as much foam
turns into liquid as possible. Some beer foam will remain on the inside of the measuring cylinder.
Now record the maximum beer liquid height on the tape.
You now have data for beer liquid height as a function of time, and the maximum beer
liquid height. Assuming no beer was drunk we can say that the total mass of the beer remains
constant. The sum of all beer mass changes (foam decreasing, liquid increasing) is zero,
∑Δm = 0 , that is, Δmfoam + Δmliquid = 0 . As the beer foam mass decreases, the beer liquid mass
increases; the decrease in one equals the increase in the other: −Δmfoam = Δmliquid . This principle
is known as the Conservation of Libation.
Page 2 of 4
We assume that the mass of beer foam is directly proportional to the volume of beer foam,
just as the mass of beer liquid is directly proportional to the volume of beer liquid. The heights of
liquid and of foam are also directly proportional to their respective volumes (because the
measuring cylinder is uniform). The height is proportional to volume, and volume is proportional
to mass; hence the height is proportional to the mass. We can then say that (at any given time)
the beer foam is equal (in terms proportional to mass) to the maximum beer liquid height minus
the beer liquid height (at the given time): Foam(t) = hliquidmax. − hliquid(t) . It is nearly impossible to
directly measure the volume or height of beer foam, but it is safe to assume that the amount of
beer foam is proportional to the mass of beer foam (assuming uniform foam density).
A graph of the beer liquid level against time shows an increasing level (as we would expect
because more foam becomes liquid) and a gradient decreasing with time (because less foam
remains to turn into liquid). The decreasing gradient suggests that the decay of foam may be
exponential—there is less foam remaining, there is less beer mass per unit time that changes
from foam to liquid.
If we then calculate the effective amount of beer foam as a function of time (for each
measured 5 second interval) and graph this against time, we find a decreasing amount of foam
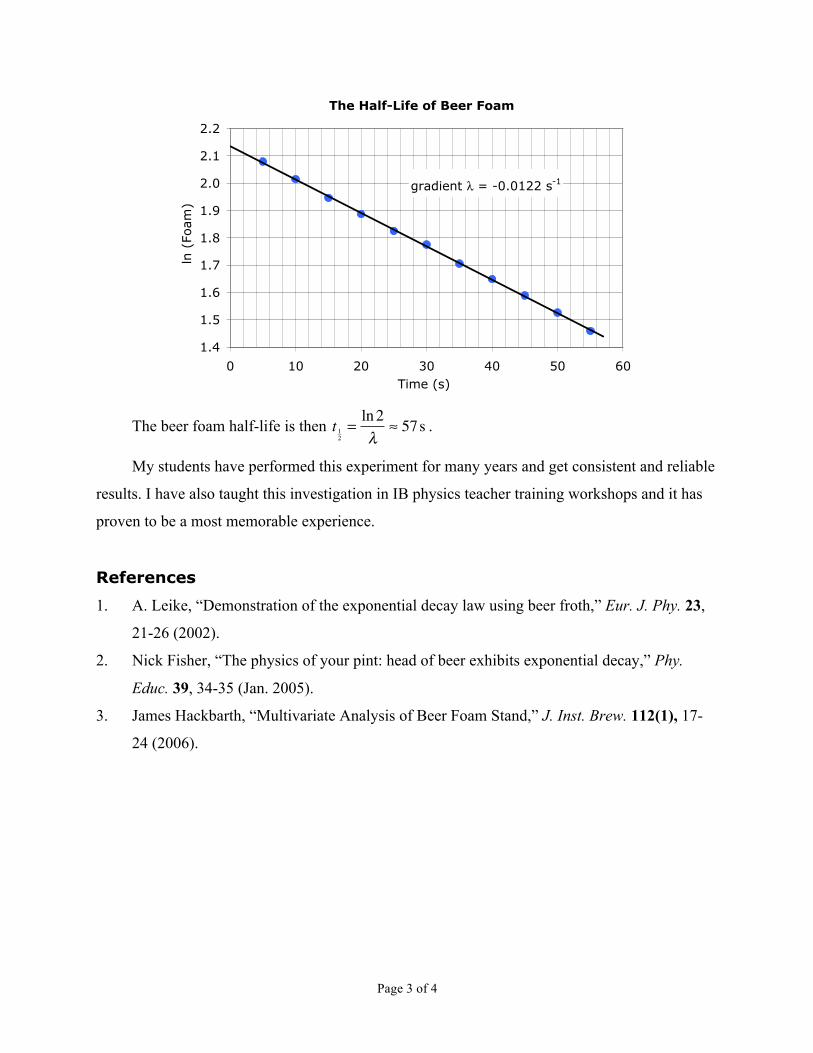
with a decreasing negative gradient. It should look like exponential decay. A graph of the natural
logarithm of beer foam against time nicely reveals the exponential decay and gives the decay
constant λ = −0.0122s−1 .
Page 3 of 4
The Half-Life of Beer Foam
gradient λ = -0.0122 s-1
1.4
1.5
1.6
1.7
1.8
1.9
2.0
2.1
2.2
0 10 20 30 40 50 60Time (s)
ln (
Foam
)
The beer foam half-life is then t 12=ln2λ
≈ 57s .
My students have performed this experiment for many years and get consistent and reliable
results. I have also taught this investigation in IB physics teacher training workshops and it has
proven to be a most memorable experience.
References
1. A. Leike, “Demonstration of the exponential decay law using beer froth,” Eur. J. Phy. 23,
21-26 (2002).
2. Nick Fisher, “The physics of your pint: head of beer exhibits exponential decay,” Phy.
Educ. 39, 34-35 (Jan. 2005).
3. James Hackbarth, “Multivariate Analysis of Beer Foam Stand,” J. Inst. Brew. 112(1), 17-
24 (2006).
Page 4 of 4
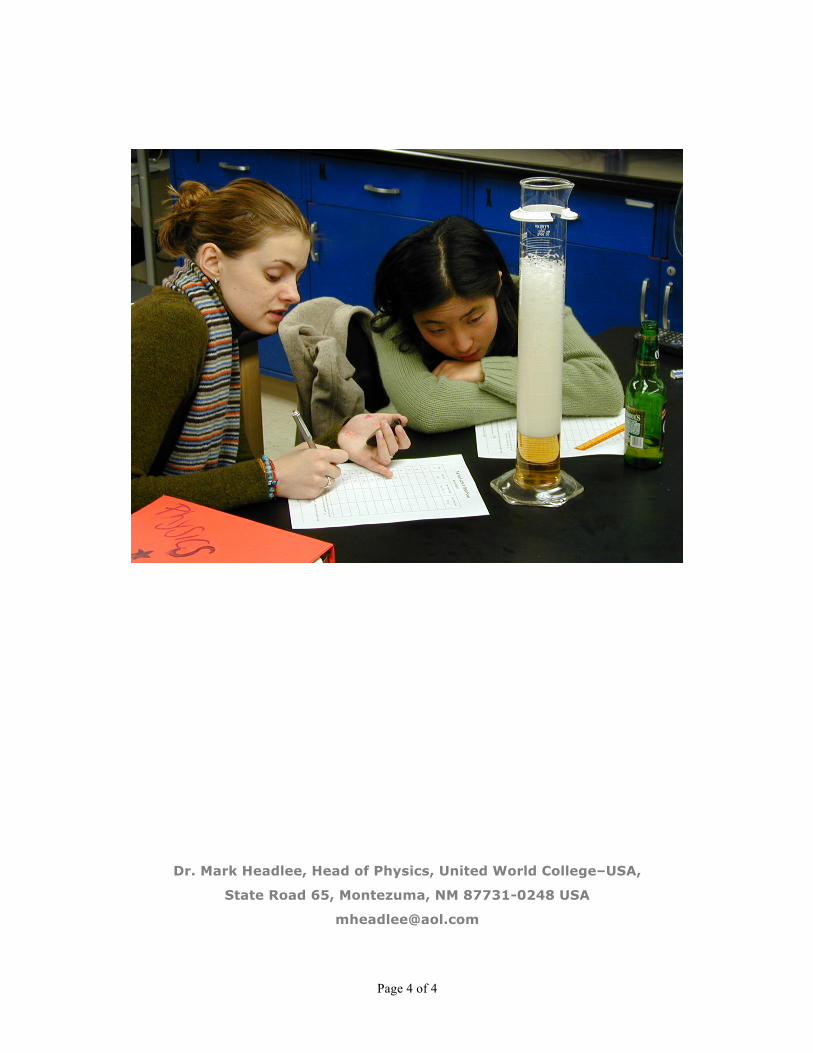
Dr. Mark Headlee, Head of Physics, United World College–USA,
State Road 65, Montezuma, NM 87731-0248 USA