The Effect of Loops on the Structural Organization of α ... · PDF fileThe Effect of...
14
The Effect of Loops on the Structural Organization of a-Helical Membrane Proteins Oznur Tastan, † Judith Klein-Seetharaman, †‡ and Hagai Meirovitch § * † Language Technologies Institute, Carnegie Mellon University, Pittsburgh, Pennsylvania; and ‡ Department of Structural Biology and § Department of Computational Biology, University of Pittsburgh School of Medicine, Pittsburgh, Pennsylvania ABSTRACT Loops connecting the transmembrane (TM) a-helices in membrane proteins are expected to affect the structural organization of the thereby connected helices and the helical bundles as a whole. This effect, which has been largely ignored previously, is studied here by analyzing the x-ray structures of 41 a-helical membrane proteins. First we define the loop flexibility ratio, R, and find that 53% of the loops are stretched, where a stretched loop constrains the distance between the two connected helices. The significance of this constraining effect is supported by experiments carried out with bacteriorhodopsin and rhodopsin, in which cutting or eliminating their (predominately stretched) loops has led to a decrease in protein stability, and for rhodopsin, in most cases, also to the destruction of the structure. We show that for nonstretched loops in the extramembra- nous regions, the fraction of hydrophobic residues is comparable to that for soluble proteins; furthermore (as is also the case for soluble proteins), the hydrophobic residues in these regions are preferentially buried. This is expected to lead to the compact structural organization of the loops, which is transferred to the TM helices, causing them to assemble. We argue that a soluble protein complexed with a membrane protein similarly promotes compactness; other properties of such complexes are also studied. We calculate complementary attractive interactions between helices, including hydrogen bonds and van der Waals inter- actions of sequential motifs, such as GXXXG. The relative and combined effects of all these factors on the association of the TM helices are discussed and protein structures with only a few of these factors are analyzed. Our study emphasizes the need for classifying membrane proteins into groups according to structural organization. This classification should be considered when procedures for structural analysis or prediction are developed and applied. Detailed analysis of each structure is provided at http://flan.blm.cs.cmu.edu/memloop/ INTRODUCTION Understanding (and predicting) the structure, dynamics, and function of membrane proteins (in particular a-helical membrane proteins) by experimental and computational methods has been a central goal of extensive research during the last 30 years (1–7). Although considerable effort has been devoted to elucidate the origin of the forces that deter- mine the 3D structural organization of the transmembrane (TM) helices, these forces are still not well understood (8). The focus in previous studies has been on identifying inter- and intrahelical interactions, such as polar-polar attractions (hydrogen bonds), salt bridges, or van der Waals interactions (1–11). The effect of interhelical loops on the structural organization and stability of membrane proteins has been recognized generally (3,12,13), but specific research into this effect has been limited. A recent statistical study based on 56 chains from 27 x-ray structures focused mainly on structure/sequence properties of the water-interface region (14). In this study, focusing on a-helical membrane proteins, we systematically investigate the contribution of loops to the assembly of TM helices, and compare it to the comple- mentary effect of specific interactions between helices. Our study is based on 41 a-helical membrane protein structures with <30% sequence identity retrieved from the protein data bank of TM proteins (PDB_TM) (15). Detailed analysis of each structure is provided at http://flan.blm.cs.cmu.edu/ memloop/. Some of our results (and assumptions) are compared with experimental data available for two membrane proteins, bacteriorhodopsin and bovine rhodopsin. MATERIALS AND METHODS Data sets of membrane protein structures We retrieved the crystal structures (3.5 A ˚ resolution or better) of the a- helical TM proteins from the Protein Data Bank of TM Proteins (PDB_TM) (February 15 2007 release) (15). Each of these proteins may consist of several TM chains and non-TM (soluble) chains. Using the blastclust program of the standalone BLAST package (16) we selected a set of 41 proteins, where the sequence identity between TM chains of any protein pair is less than 30% (see Table 2). Each protein can contain similar chains. To calculate the frequencies of R values one needs to consider only the nonredundant chains of each protein. Thus, we have compiled a subset of 70 nonredundant TM chains using the 30% sequence identity criterion. Notice that each of the 41 protein structures is in the biological oligomeric state, as retrieved from PDB_TM (15). The structures taken from the PDB_TM (15) are already rotated and trans- lated according to a predicted membrane normal, which determines the z axis, where z ¼ 0 is the middle of the bilayer. We consider a (15,15 A ˚ ) slab as the central layer. The topologies of proteins in the membrane bilayer were taken from the Orientation of Membrane Protein Database (17). For a plasma membrane, IN and OUT refer to the intracellular and extracellular parts of the proteins, respectively. All other topology definitions follow Mptopo (18). Submitted April 8, 2008, and accepted for publication December 1, 2008. *Correspondence: [email protected] Editor: Thomas J. McIntosh. Ó 2009 by the Biophysical Society 0006-3495/09/03/2299/14 $2.00 doi: 10.1016/j.bpj.2008.12.3894 Biophysical Journal Volume 96 March 2009 2299–2312 2299
Transcript of The Effect of Loops on the Structural Organization of α ... · PDF fileThe Effect of...
Biophysical Journal Volume 96 March 2009 2299–2312 2299
The Effect of Loops on the Structural Organization of a-HelicalMembrane Proteins
Oznur Tastan,† Judith Klein-Seetharaman,†‡ and Hagai Meirovitch§*†Language Technologies Institute, Carnegie Mellon University, Pittsburgh, Pennsylvania; and ‡Department of Structural Biologyand §Department of Computational Biology, University of Pittsburgh School of Medicine, Pittsburgh, Pennsylvania
ABSTRACT Loops connecting the transmembrane (TM) a-helices in membrane proteins are expected to affect the structuralorganization of the thereby connected helices and the helical bundles as a whole. This effect, which has been largely ignoredpreviously, is studied here by analyzing the x-ray structures of 41 a-helical membrane proteins. First we define the loop flexibilityratio, R, and find that 53% of the loops are stretched, where a stretched loop constrains the distance between the two connectedhelices. The significance of this constraining effect is supported by experiments carried out with bacteriorhodopsin andrhodopsin, in which cutting or eliminating their (predominately stretched) loops has led to a decrease in protein stability, andfor rhodopsin, in most cases, also to the destruction of the structure. We show that for nonstretched loops in the extramembra-nous regions, the fraction of hydrophobic residues is comparable to that for soluble proteins; furthermore (as is also the case forsoluble proteins), the hydrophobic residues in these regions are preferentially buried. This is expected to lead to the compactstructural organization of the loops, which is transferred to the TM helices, causing them to assemble. We argue that a solubleprotein complexed with a membrane protein similarly promotes compactness; other properties of such complexes are alsostudied. We calculate complementary attractive interactions between helices, including hydrogen bonds and van der Waals inter-actions of sequential motifs, such as GXXXG. The relative and combined effects of all these factors on the association of the TMhelices are discussed and protein structures with only a few of these factors are analyzed. Our study emphasizes the need forclassifying membrane proteins into groups according to structural organization. This classification should be considered whenprocedures for structural analysis or prediction are developed and applied. Detailed analysis of each structure is provided athttp://flan.blm.cs.cmu.edu/memloop/
INTRODUCTION
Understanding (and predicting) the structure, dynamics, and
function of membrane proteins (in particular a-helical
membrane proteins) by experimental and computational
methods has been a central goal of extensive research during
the last 30 years (1–7). Although considerable effort has
been devoted to elucidate the origin of the forces that deter-
mine the 3D structural organization of the transmembrane
(TM) helices, these forces are still not well understood (8).
The focus in previous studies has been on identifying inter-
and intrahelical interactions, such as polar-polar attractions
(hydrogen bonds), salt bridges, or van der Waals interactions
(1–11). The effect of interhelical loops on the structural
organization and stability of membrane proteins has been
recognized generally (3,12,13), but specific research into
this effect has been limited. A recent statistical study based
on 56 chains from 27 x-ray structures focused mainly on
structure/sequence properties of the water-interface region
(14).
In this study, focusing on a-helical membrane proteins,
we systematically investigate the contribution of loops to
the assembly of TM helices, and compare it to the comple-
mentary effect of specific interactions between helices. Our
study is based on 41 a-helical membrane protein structures
Submitted April 8, 2008, and accepted for publication December 1, 2008.
*Correspondence: [email protected]
Editor: Thomas J. McIntosh.
� 2009 by the Biophysical Society
0006-3495/09/03/2299/14 $2.00
with <30% sequence identity retrieved from the protein
data bank of TM proteins (PDB_TM) (15). Detailed analysis
of each structure is provided at http://flan.blm.cs.cmu.edu/
memloop/. Some of our results (and assumptions) are
compared with experimental data available for two membrane
proteins, bacteriorhodopsin and bovine rhodopsin.
MATERIALS AND METHODS
Data sets of membrane protein structures
We retrieved the crystal structures (3.5 A resolution or better) of the a-
helical TM proteins from the Protein Data Bank of TM Proteins (PDB_TM)
(February 15 2007 release) (15). Each of these proteins may consist of
several TM chains and non-TM (soluble) chains. Using the blastclust
program of the standalone BLAST package (16) we selected a set of 41
proteins, where the sequence identity between TM chains of any protein
pair is less than 30% (see Table 2). Each protein can contain similar chains.
To calculate the frequencies of R values one needs to consider only the
nonredundant chains of each protein. Thus, we have compiled a subset of
70 nonredundant TM chains using the 30% sequence identity criterion.
Notice that each of the 41 protein structures is in the biological oligomeric
state, as retrieved from PDB_TM (15).
The structures taken from the PDB_TM (15) are already rotated and trans-
lated according to a predicted membrane normal, which determines the z
axis, where z ¼ 0 is the middle of the bilayer. We consider a (�15,15 A)
slab as the central layer. The topologies of proteins in the membrane bilayer
were taken from the Orientation of Membrane Protein Database (17). For
a plasma membrane, IN and OUT refer to the intracellular and extracellular
parts of the proteins, respectively. All other topology definitions follow
Mptopo (18).
doi: 10.1016/j.bpj.2008.12.3894
2300 Tastan et al.
Grouping of membrane proteins
For ease of reference, we have given to the groups of proteins descriptive
names. Thus, proteins with a single chain are referred to as ‘‘one chain’’.
The ‘‘crowns’’ consist of proteins with multiple helical chains (with or
without one loop) arranged together perpendicular to the membrane in
a circle forming a central pore. The ‘‘long-terminus’’ proteins have short
loops, but at least one of their N- or C-terminals is very long, creating
a compact structure on one side of the membrane that interacts with the
membrane and with other segments of the protein. Another category,
‘‘soluble’’, consists of membrane proteins forming a stable complex with
a non-TM protein. We refer to two proteins with one or more extremely large
loops that form a group as ‘‘long beard’’. Finally, the ‘‘multiple chains’’
group contains proteins that are assemblies that consist of more than one
chain (but do not pertain to the above categories). Notice, however, that
even this classification is not comprehensive. For example, most of the
proteins that pertain to ‘‘soluble’’, ‘‘crown’’, or ‘‘long terminus’’ consist
of multiple chains, the outer membrane lipoprotein Wza (2j58) is a crown
protein with a long terminus, and formate dehydrogenase (1kqf) interacts
with soluble proteins and has a long terminus.
Hydrophobicity scale used
The results reported in this article are based on a hydrophobicity scale, where
Ile, Leu, Val, Phe, Trp, Met, Pro, Ala, and Tyr are defined as hydrophobic
(H) and the remaining amino acids as polar (19). This set of H residues
has been chosen as the preferred set in ref (20) by applying six different
hydrophobicity scales to a set of 103 soluble proteins.
TM helices and hydrogen bonds
All helices were assigned initially using the STRIDE software (21), which
does not distinguish between TM helices and loop helices, and sometimes
might introduce helix breaks in the middle due to helix kinks. We therefore
identified the TM helix boundaries automatically using STRIDE assign-
ments together with information from PDB_TM. These assignments were
verified further by visual inspection of the structures using the Chimera soft-
ware (22), where incorrect cases were reassigned manually.
Hydrogen bonds (HBs) were detected using the HBPLUS v3.15 software
(23) using default parameters and allowing exchange of the nearly symmet-
rical side chains of His, Gln, and Asn. All ligands and water molecules were
removed from the structures. fTM, the fraction of H residues, is based only on
helical segments that lie within the central layer (�15,15 A), whereas for
calculating helix-helix and loop-helix HBs the entire helix is considered
even if it goes beyond the central layer. Also, a loop-helix HB is defined
only for a loop residue that is at least six residues apart from the helix.
RESULTS AND DISCUSSION
An essential factor affecting the structural organization of the
loops and the TM helices is the hydrophobic interaction.
Therefore, we first discuss general aspects of hydrophobicity
related to soluble and membrane proteins.
Hydrophobicity in soluble and membrane proteins
The ability of a globular (soluble) protein to organize its chain
in a compact stable structure is expected to depend strongly
on the fraction, f, of H residues. For small f (say f < 0.1) of
randomly distributed H residues, an H residue could become
‘‘wrapped’’ locally by several polar (P) residues to form
Biophysical Journal 96(6) 2299–2312
a ‘‘blob’’. This would lead to an effectively shorter random
coil chain of blobs connected by flexible segments, which
gains further stability from its high entropy. However,
when f is large enough, the local coverage of the H residues
can no longer be achieved, and the only other thermodynamic
way to avoid contact with water is to be buried in the interior
of a compact chain structure. If f is too large, the molecule will
precipitate and therefore the optimal value observed in real
proteins constitutes a balance between these effects and other
interactions. Correspondingly, for soluble proteins it has been
shown that f calculated around the center of mass is larger
than f of the entire protein, and f decreases significantly in
concentric spherical layers of increasing radii (20,24).
A membrane protein, on the other hand, resides in a non-
homogenous environment consisting of a central hydro-
phobic membrane layer (~30 A in width) created by the lipid
bilayer and flanked from both sides by polar headgroup
layers (each of 10–15 A width), which interact with water.
Therefore, a membrane protein can accommodate a larger
fraction of H residues than a soluble protein, where the high-
est fraction, fcentral is in the central hydrophobic layer
(defined as a (�15,15 A) slab along the z axis of the
membrane). This indeed is observed in membrane protein
structures (see below), and to gain further stability (lower
free energy), the polymer chain in this region is typically
organized in several TM a-helices, which are assembled
by various interactions. In this article, amino acid residues
on the outer (inner) side of the membrane (beyond the
central (�15,15 A) slab) are referred to as OUT (IN); see
Materials and Methods.
The TM helices might be connected by long loops (which
in some cases are extremely long, consisting of 400 residues
and more) that can span the headgroup layers and penetrate
into the surrounding water, where the contribution of their
intramolecular interactions to protein stability must also be
taken into account. Thus, if the fraction of H residues in these
loops was large, floops R fcentral, one would expect the protein
to precipitate, whereas very small floops (i.e., a high fraction
of P residues) will cause the loops to separate due to strong
interaction with water; this separation might destroy the
assembly of TM helices in the central layer. On the other
hand, for floops z fsoluble (where fsoluble is the fraction of H
residues in soluble proteins), one would expect the loops
to organize (like soluble proteins) in a compact structure
where the H residues are concentrated more in the interior
to avoid contact with water. This compactness by itself
would be expected to bring the TM helices together and
thus to constitute an important factor in their specific struc-
tural organization. The results in Table 1 support part of
this picture, where fentire membrane ¼ 0.56 (� 0.01) calculated
for our set of 41 a-helical membrane proteins is larger than
fsoluble ¼ 0.44 (� 0.006) obtained in Miao et al. (20) for
103 soluble proteins (one-sided t-test, p < 0.001). Also,
for the TM helices, fTM ¼ fcentral ¼ 0.69 (� 0.01) is signifi-
cantly larger than floops ¼ 0.47 (� 0.01) (one-sided t-test,
Loops in Membrane Protein Structures 2301
p < 0.001), which is an average of fOUT ¼ 0.48 (� 0.02) and
fIN ¼ 0.45 (� 0.01); the latter fractions are indeed close to
fsoluble ¼ 0.44. These results are based on a hydrophobicity
scale (19) defined in Methods.
The names and the PDB codes of the 41 a-helical
membrane proteins studied appear in Table 2, which also
provides the specific fractions of H residues in the TM region
and on both sides of the membrane; these results show that
the fluctuations around the average fractions of H residues
can be significant (Table 1). In Table 2, we also present
the number of residues in the three regions, the topology,
and the number of chains in a protein. As is emphasized later,
unlike soluble proteins, the loops are not organized (in most
cases) in a spherical structure, but appear in various geomet-
rical shapes. Therefore, our analysis requires classifying the
membrane proteins into groups according to their structural
organization in the IN and OUT loop regions. The six groups
are called ‘‘one chain’’, ‘‘multiple chains’’, ‘‘long beard’’,
‘‘long terminus’’, ‘‘soluble’’, and ‘‘crown’’, and they are
described in Methods; representative structures of these
groups appear in Fig. 1. The results in Table 2 (see also Table
4) are presented according to these groups (see also our web
site at http://flan.blm.cs.cmu.edu/memloop/).
Before elaborating further on the effect of hydrophobicity,
we will discuss the expected contribution of stretched loops
to the structural organization of the TM helices.
Stretched loops
For our discussion, it is convenient to assume that a-helices
are generated first, then inserted into the membrane, where
their assembly occurs in a later stage due to attracting forces;
clearly, without these forces the helices would not assemble
but would move freely in the inner membrane (subject to
constraints imposed by stretched loops) to maximize the
protein’s entropy. Loops that are stretched in the native struc-
ture impose geometrical constraints on the corresponding
helices to remain close to each other.
More specifically, a stretched loop is identified by its flex-
ibility ratio, R ¼ l/d, where d is the distance between the a-
carbons of the first and last residues of the loop in the x-ray
structure, and l is the length of the loop segment if it were
TABLE 1 Average fractions hf i of H residues in soluble
proteins and in different regions of membrane proteins
Entire membrane
proteins TM
Loops
entire
Loops
OUT
Loops
IN
Soluble
proteins
h f i 0.56 (1) 0.69 (1) 0.47 (1) 0.48 (2) 0.45 (1) 0.44
Results for soluble proteins are taken from Table 2 of Miao et al. (20). The
TM region (central layer) is a (�15,15 A) slab along the z axis. The set of H
residues (19) is defined in Materials and Methods. The statistical errors are
(1 SD)/N1/2, where N is 103 and 41 for the soluble and membrane proteins,
respectively. The results for the membrane proteins are averages of results
appearing in Table 2. The errors of the last digit are denoted by parentheses,
e.g., 0.56 (1) ¼ 0.56 � 0.01. The error for soluble proteins is <0.006.
removed from the protein and maximally stretched, i.e.,
arranged in its extended conformation (25). l (in A) is calcu-
lated using the expressions a(n/2� 1)þ b and a(n� 1)/2 for
even and odd n (number of residues), respectively; a¼ 6.046
and b¼ 3.46 A are parameters taken from Flory’s book (26),
where the geometrical constraints of a peptide backbone in
the extended conformation are described. Thus, for a fully
stretched loop, R should be 1, but has been found in calcula-
tions to be slightly different, even smaller than 1, due to
a nonperfect fit between the above parameters and x-ray
structures. The larger is R, the higher is the expected confor-
mational freedom of the loop’s backbone (ignoring geomet-
rical restrictions imposed by neighboring residues).
Notice, however, that bulky side chains can decrease
significantly the flexibility of a loop, even for R > 1,
inducing thereby restrictions on the mutual movements of
the related helices. To illustrate this effect, imagine an
extreme case of an OUT side loop with close ends, i.e.,
with a distance, d, equal to the length of a stretched backbone
of two or three residues; the loop includes two consecutive
bulky side chains, such as Arg. Now, assume that the Arg
side chains point toward the central layer but are not allowed
to penetrate it. Under these circumstances, the Arg residues
must be flanked by two or three residues on either side,
which will enable the loop (of five to seven residues) to bulge
out, leaving space for the Arg side chains; this would lead to
a nonflexible loop, although R ranges from 3 to 4. Although
such effects of the side chains on loop rigidity are expected
to decrease as n increases, they should be considered
(together with the inaccuracy in the above Flory’s parame-
ters), and we thus adopt R % 2 as a reasonable criterion
for a stretched loop.
The R values obtained with our set of 41 proteins are
shown in Table 3. Because some membrane proteins contain
multiple copies of the same chain, and some contain multiple
different chains, we created a subset of single chains from
the 41 proteins, which resulted in 70 nonredundant chains.
The frequency of loops with R % 2 (obtained from the 70
chains) is 0.53 (0.12 % 1; 1 < 0.41 % 2), showing that
stretched loops are very common in our dataset. Notice
that loops with 1 % R % 2 are not necessarily short due
to possible large d values. On average they consist of n ¼7.3 residues where the longest loop in the set is of n ¼ 24
(Table 3).
In Table 4 (second column), we present for each protein
the ratio NR/Nloop, where NR is the number of stretched loops
(on both sides) and Nloop is the total number of loops in the
entire protein complex. It should be noted that the three
crown proteins, 1lgh, 1nkz, and 2j58, consist of individual
chains with a single TM helix and do not have loops at all;
their non-TM segments are composed exclusively of termini.
For some proteins, all loops are stretched (1yce, 1p49, 2hyd,
and 1yq3), whereas for others no stretched loops exist (2ahy,
2oar, 1kqf, and 2bhw); for the rest of the proteins, NR/Nloop
takes intermediate values between these extreme cases.
Biophysical Journal 96(6) 2299–2312
2302 Tastan et al.
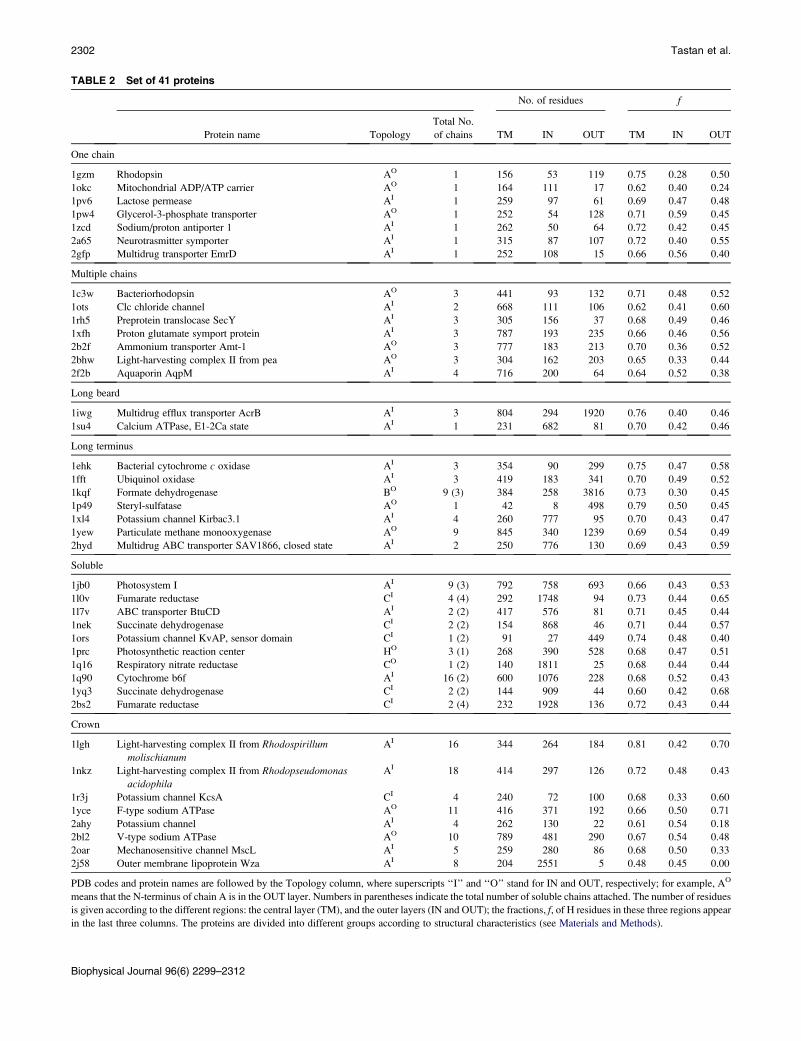
TABLE 2 Set of 41 proteins
No. of residues f
Protein name Topology
Total No.
of chains TM IN OUT TM IN OUT
One chain
1gzm Rhodopsin AO 1 156 53 119 0.75 0.28 0.50
1okc Mitochondrial ADP/ATP carrier AO 1 164 111 17 0.62 0.40 0.24
1pv6 Lactose permease AI 1 259 97 61 0.69 0.47 0.48
1pw4 Glycerol-3-phosphate transporter AO 1 252 54 128 0.71 0.59 0.45
1zcd Sodium/proton antiporter 1 AI 1 262 50 64 0.72 0.42 0.45
2a65 Neurotrasmitter symporter AI 1 315 87 107 0.72 0.40 0.55
2gfp Multidrug transporter EmrD AI 1 252 108 15 0.66 0.56 0.40
Multiple chains
1c3w Bacteriorhodopsin AO 3 441 93 132 0.71 0.48 0.52
1ots Clc chloride channel AI 2 668 111 106 0.62 0.41 0.60
1rh5 Preprotein translocase SecY AI 3 305 156 37 0.68 0.49 0.46
1xfh Proton glutamate symport protein AI 3 787 193 235 0.66 0.46 0.56
2b2f Ammonium transporter Amt-1 AO 3 777 183 213 0.70 0.36 0.52
2bhw Light-harvesting complex II from pea AO 3 304 162 203 0.65 0.33 0.44
2f2b Aquaporin AqpM AI 4 716 200 64 0.64 0.52 0.38
Long beard
1iwg Multidrug efflux transporter AcrB AI 3 804 294 1920 0.76 0.40 0.46
1su4 Calcium ATPase, E1-2Ca state AI 1 231 682 81 0.70 0.42 0.46
Long terminus
1ehk Bacterial cytochrome c oxidase AI 3 354 90 299 0.75 0.47 0.58
1fft Ubiquinol oxidase AI 3 419 183 341 0.70 0.49 0.52
1kqf Formate dehydrogenase BO 9 (3) 384 258 3816 0.73 0.30 0.45
1p49 Steryl-sulfatase AO 1 42 8 498 0.79 0.50 0.45
1xl4 Potassium channel Kirbac3.1 AI 4 260 777 95 0.70 0.43 0.47
1yew Particulate methane monooxygenase AO 9 845 340 1239 0.69 0.54 0.49
2hyd Multidrug ABC transporter SAV1866, closed state AI 2 250 776 130 0.69 0.43 0.59
Soluble
1jb0 Photosystem I AI 9 (3) 792 758 693 0.66 0.43 0.53
1l0v Fumarate reductase CI 4 (4) 292 1748 94 0.73 0.44 0.65
1l7v ABC transporter BtuCD AI 2 (2) 417 576 81 0.71 0.45 0.44
1nek Succinate dehydrogenase CI 2 (2) 154 868 46 0.71 0.44 0.57
1ors Potassium channel KvAP, sensor domain CI 1 (2) 91 27 449 0.74 0.48 0.40
1prc Photosynthetic reaction center HO 3 (1) 268 390 528 0.68 0.47 0.51
1q16 Respiratory nitrate reductase CO 1 (2) 140 1811 25 0.68 0.44 0.44
1q90 Cytochrome b6f AI 16 (2) 600 1076 228 0.68 0.52 0.43
1yq3 Succinate dehydrogenase CI 2 (2) 144 909 44 0.60 0.42 0.68
2bs2 Fumarate reductase CI 2 (4) 232 1928 136 0.72 0.43 0.44
Crown
1lgh Light-harvesting complex II from Rhodospirillum
molischianum
AI 16 344 264 184 0.81 0.42 0.70
1nkz Light-harvesting complex II from Rhodopseudomonasacidophila
AI 18 414 297 126 0.72 0.48 0.43
1r3j Potassium channel KcsA CI 4 240 72 100 0.68 0.33 0.60
1yce F-type sodium ATPase AO 11 416 371 192 0.66 0.50 0.71
2ahy Potassium channel AI 4 262 130 22 0.61 0.54 0.18
2bl2 V-type sodium ATPase AO 10 789 481 290 0.67 0.54 0.48
2oar Mechanosensitive channel MscL AI 5 259 280 86 0.68 0.50 0.33
2j58 Outer membrane lipoprotein Wza AI 8 204 2551 5 0.48 0.45 0.00
PDB codes and protein names are followed by the Topology column, where superscripts ‘‘I’’ and ‘‘O’’ stand for IN and OUT, respectively; for example, AO
means that the N-terminus of chain A is in the OUT layer. Numbers in parentheses indicate the total number of soluble chains attached. The number of residues
is given according to the different regions: the central layer (TM), and the outer layers (IN and OUT); the fractions, f, of H residues in these three regions appear
in the last three columns. The proteins are divided into different groups according to structural characteristics (see Materials and Methods).
Biophysical Journal 96(6) 2299–2312
Loops in Membrane Protein Structures 2303
The fraction NR/Nloop is a meaningful parameter that can be
compared among proteins (see below).
Although stretched loops can help to keep the helices
together, they only operate on successive TM helices along
the chain (we call interactions between successive TM
helices ‘‘short-range’’ and interactions between nonsucces-
sive helices, or between helices and loops, ‘‘long-range’’).
Thus, even with a relatively large fraction of stretched loops
(53%), the conformational freedom of the helices might still
be considerable, and long-range interactions (such as the
hydrophobic interaction discussed in detail below) are
imperative for their assembly.
Hydrophobicity in the loop regions
Verifying the hydrophobic effect on the (long) loops is not
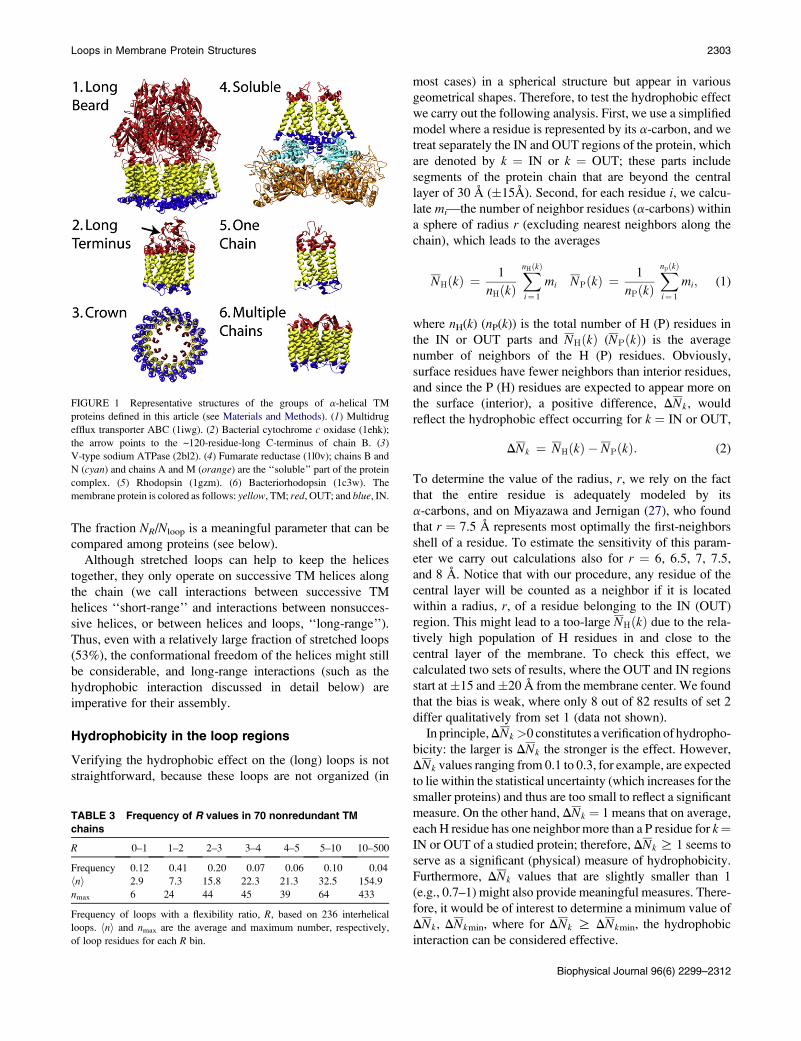
straightforward, because these loops are not organized (in
FIGURE 1 Representative structures of the groups of a-helical TM
proteins defined in this article (see Materials and Methods). (1) Multidrug
efflux transporter ABC (1iwg). (2) Bacterial cytochrome c oxidase (1ehk);
the arrow points to the ~120-residue-long C-terminus of chain B. (3)
V-type sodium ATPase (2bl2). (4) Fumarate reductase (1l0v); chains B and
N (cyan) and chains A and M (orange) are the ‘‘soluble’’ part of the protein
complex. (5) Rhodopsin (1gzm). (6) Bacteriorhodopsin (1c3w). The
membrane protein is colored as follows: yellow, TM; red, OUT; and blue, IN.
TABLE 3 Frequency of R values in 70 nonredundant TM
chains
R 0–1 1–2 2–3 3–4 4–5 5–10 10–500
Frequency 0.12 0.41 0.20 0.07 0.06 0.10 0.04
hni 2.9 7.3 15.8 22.3 21.3 32.5 154.9
nmax 6 24 44 45 39 64 433
Frequency of loops with a flexibility ratio, R, based on 236 interhelical
loops. hni and nmax are the average and maximum number, respectively,
of loop residues for each R bin.
most cases) in a spherical structure but appear in various
geometrical shapes. Therefore, to test the hydrophobic effect
we carry out the following analysis. First, we use a simplified
model where a residue is represented by its a-carbon, and we
treat separately the IN and OUT regions of the protein, which
are denoted by k ¼ IN or k ¼ OUT; these parts include
segments of the protein chain that are beyond the central
layer of 30 A (�15A). Second, for each residue i, we calcu-
late mi—the number of neighbor residues (a-carbons) within
a sphere of radius r (excluding nearest neighbors along the
chain), which leads to the averages
NHðkÞ ¼1
nHðkÞXnHðkÞ
i¼ 1
mi NPðkÞ ¼1
nPðkÞXnpðkÞ
i¼ 1
mi; (1)
where nH(k) (nP(k)) is the total number of H (P) residues in
the IN or OUT parts and NHðkÞ (NPðkÞ) is the average
number of neighbors of the H (P) residues. Obviously,
surface residues have fewer neighbors than interior residues,
and since the P (H) residues are expected to appear more on
the surface (interior), a positive difference, DNk, would
reflect the hydrophobic effect occurring for k ¼ IN or OUT,
DNk ¼ NHðkÞ � NPðkÞ: (2)
To determine the value of the radius, r, we rely on the fact
that the entire residue is adequately modeled by its
a-carbons, and on Miyazawa and Jernigan (27), who found
that r ¼ 7.5 A represents most optimally the first-neighbors
shell of a residue. To estimate the sensitivity of this param-
eter we carry out calculations also for r ¼ 6, 6.5, 7, 7.5,
and 8 A. Notice that with our procedure, any residue of the
central layer will be counted as a neighbor if it is located
within a radius, r, of a residue belonging to the IN (OUT)
region. This might lead to a too-large NHðkÞ due to the rela-
tively high population of H residues in and close to the
central layer of the membrane. To check this effect, we
calculated two sets of results, where the OUT and IN regions
start at�15 and�20 A from the membrane center. We found
that the bias is weak, where only 8 out of 82 results of set 2
differ qualitatively from set 1 (data not shown).
In principle, DNk >0 constitutes a verification of hydropho-
bicity: the larger is DNk the stronger is the effect. However,
DNk values ranging from 0.1 to 0.3, for example, are expected
to lie within the statistical uncertainty (which increases for the
smaller proteins) and thus are too small to reflect a significant
measure. On the other hand, DNk ¼ 1 means that on average,
each H residue has one neighbor more than a P residue for k¼IN or OUT of a studied protein; therefore, DNk R 1 seems to
serve as a significant (physical) measure of hydrophobicity.
Furthermore, DNk values that are slightly smaller than 1
(e.g., 0.7–1) might also provide meaningful measures. There-
fore, it would be of interest to determine a minimum value of
DNk, DNkmin, where for DNk R DNkmin, the hydrophobic
interaction can be considered effective.
Biophysical Journal 96(6) 2299–2312
2304 Tastan et al.
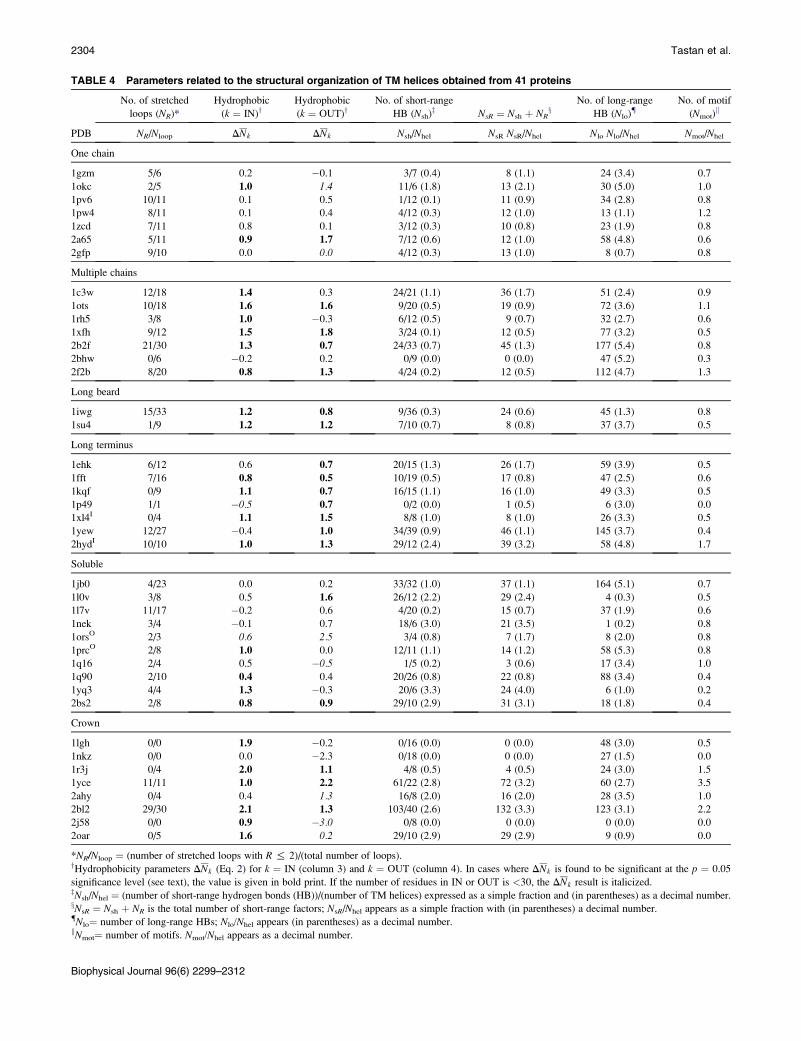
TABLE 4 Parameters related to the structural organization of TM helices obtained from 41 proteins
PDB
No. of stretched
loops (NR)*
Hydrophobic
(k ¼ IN)yHydrophobic
(k ¼ OUT)yNo. of short-range
HB (Nsh)z NsR ¼ Nsh þ NRx
No. of long-range
HB (Nlo){No. of motif
(Nmot)k
NR/Nloop DNk DNk Nsh/Nhel NsR NsR/Nhel Nlo Nlo/Nhel Nmot/Nhel
One chain
1gzm 5/6 0.2 �0.1 3/7 (0.4) 8 (1.1) 24 (3.4) 0.7
1okc 2/5 1.0 1.4 11/6 (1.8) 13 (2.1) 30 (5.0) 1.0
1pv6 10/11 0.1 0.5 1/12 (0.1) 11 (0.9) 34 (2.8) 0.8
1pw4 8/11 0.1 0.4 4/12 (0.3) 12 (1.0) 13 (1.1) 1.2
1zcd 7/11 0.8 0.1 3/12 (0.3) 10 (0.8) 23 (1.9) 0.8
2a65 5/11 0.9 1.7 7/12 (0.6) 12 (1.0) 58 (4.8) 0.6
2gfp 9/10 0.0 0.0 4/12 (0.3) 13 (1.0) 8 (0.7) 0.8
Multiple chains
1c3w 12/18 1.4 0.3 24/21 (1.1) 36 (1.7) 51 (2.4) 0.9
1ots 10/18 1.6 1.6 9/20 (0.5) 19 (0.9) 72 (3.6) 1.1
1rh5 3/8 1.0 �0.3 6/12 (0.5) 9 (0.7) 32 (2.7) 0.6
1xfh 9/12 1.5 1.8 3/24 (0.1) 12 (0.5) 77 (3.2) 0.5
2b2f 21/30 1.3 0.7 24/33 (0.7) 45 (1.3) 177 (5.4) 0.8
2bhw 0/6 �0.2 0.2 0/9 (0.0) 0 (0.0) 47 (5.2) 0.3
2f2b 8/20 0.8 1.3 4/24 (0.2) 12 (0.5) 112 (4.7) 1.3
Long beard
1iwg 15/33 1.2 0.8 9/36 (0.3) 24 (0.6) 45 (1.3) 0.8
1su4 1/9 1.2 1.2 7/10 (0.7) 8 (0.8) 37 (3.7) 0.5
Long terminus
1ehk 6/12 0.6 0.7 20/15 (1.3) 26 (1.7) 59 (3.9) 0.5
1fft 7/16 0.8 0.5 10/19 (0.5) 17 (0.8) 47 (2.5) 0.6
1kqf 0/9 1.1 0.7 16/15 (1.1) 16 (1.0) 49 (3.3) 0.5
1p49 1/1 �0.5 0.7 0/2 (0.0) 1 (0.5) 6 (3.0) 0.0
1xl4I 0/4 1.1 1.5 8/8 (1.0) 8 (1.0) 26 (3.3) 0.5
1yew 12/27 �0.4 1.0 34/39 (0.9) 46 (1.1) 145 (3.7) 0.4
2hydI 10/10 1.0 1.3 29/12 (2.4) 39 (3.2) 58 (4.8) 1.7
Soluble
1jb0 4/23 0.0 0.2 33/32 (1.0) 37 (1.1) 164 (5.1) 0.7
1l0v 3/8 0.5 1.6 26/12 (2.2) 29 (2.4) 4 (0.3) 0.5
1l7v 11/17 �0.2 0.6 4/20 (0.2) 15 (0.7) 37 (1.9) 0.6
1nek 3/4 �0.1 0.7 18/6 (3.0) 21 (3.5) 1 (0.2) 0.8
1orsO 2/3 0.6 2.5 3/4 (0.8) 7 (1.7) 8 (2.0) 0.8
1prcO 2/8 1.0 0.0 12/11 (1.1) 14 (1.2) 58 (5.3) 0.8
1q16 2/4 0.5 �0.5 1/5 (0.2) 3 (0.6) 17 (3.4) 1.0
1q90 2/10 0.4 0.4 20/26 (0.8) 22 (0.8) 88 (3.4) 0.4
1yq3 4/4 1.3 �0.3 20/6 (3.3) 24 (4.0) 6 (1.0) 0.2
2bs2 2/8 0.8 0.9 29/10 (2.9) 31 (3.1) 18 (1.8) 0.4
Crown
1lgh 0/0 1.9 �0.2 0/16 (0.0) 0 (0.0) 48 (3.0) 0.5
1nkz 0/0 0.0 �2.3 0/18 (0.0) 0 (0.0) 27 (1.5) 0.0
1r3j 0/4 2.0 1.1 4/8 (0.5) 4 (0.5) 24 (3.0) 1.5
1yce 11/11 1.0 2.2 61/22 (2.8) 72 (3.2) 60 (2.7) 3.5
2ahy 0/4 0.4 1.3 16/8 (2.0) 16 (2.0) 28 (3.5) 1.0
2bl2 29/30 2.1 1.3 103/40 (2.6) 132 (3.3) 123 (3.1) 2.2
2j58 0/0 0.9 �3.0 0/8 (0.0) 0 (0.0) 0 (0.0) 0.0
2oar 0/5 1.6 0.2 29/10 (2.9) 29 (2.9) 9 (0.9) 0.0
*NR/Nloop ¼ (number of stretched loops with R % 2)/(total number of loops).yHydrophobicity parameters DNk (Eq. 2) for k ¼ IN (column 3) and k ¼ OUT (column 4). In cases where DNk is found to be significant at the p ¼ 0.05
significance level (see text), the value is given in bold print. If the number of residues in IN or OUT is <30, the DNk result is italicized.zNsh/Nhel ¼ (number of short-range hydrogen bonds (HB))/(number of TM helices) expressed as a simple fraction and (in parentheses) as a decimal number.xNsR ¼ Nsh þ NR is the total number of short-range factors; NsR/Nhel appears as a simple fraction with (in parentheses) a decimal number.{Nlo¼ number of long-range HBs; Nlo/Nhel appears (in parentheses) as a decimal number.kNmot¼ number of motifs. Nmot/Nhel appears as a decimal number.
Biophysical Journal 96(6) 2299–2312
Loops in Membrane Protein Structures 2305
To determine the statistically significant DNk values, and
in particular DNkmin, we carried out a randomization test.
For each protein side, k (IN or OUT, starting at �15 A),
the H (P) residues were distributed randomly over the struc-
ture (keeping nH(k) (nP(k)) of Eq. 1 constant), where the cor-
responding DNk (Eq. 2) was calculated for r ¼ 7.5 A. This
experiment was carried out 104 times for each side of the
membrane, leading to a distribution of theDNk values around
zero. Our null hypothesis is that the value of DNk is as large
as what would be expected if the H residues were distributed
by chance in the studied part of the protein structure. This
hypothesis is rejected if the actual values of DNk are
>95% of the 104 randomized results for DNk(one-sided
test, p ¼ 0.05).
The actual results for DNk (r ¼ 7.5 A) for the two
membrane sides appear in Table 4 (columns 3 and 4), where
a value is bold-faced when it is statistically significant at the
p ¼ 0.05 level. The thresholds r ¼ 6.5, 7, and 8 A yield
similar results (see below). It would be difficult for short
loops to arrange themselves according to the hydrophobic
forces; therefore, we have not analyzed cases where the
number of residues in an outer part (excluding the soluble
chains) is <30 (still, their DNk values appear in italics in
Table 4). Among the 41 proteins, there are two and seven
such cases for the IN and OUT sides, respectively (altogether
eight proteins), where both sides of 1ors have short loops
(<30 residues). Table 4 shows that the statistical criterion
is satisfied by 24 of the 39 proteins for k ¼ IN and 19 of
35 proteins for k ¼ OUT. For 15 proteins, the criterion is
satisfied for both sides, i.e., hydrophobicity is predicted to
affect the structural organization of 28 of the 41 proteins
studied (70% excluding 1ors, where both sides have <30
residues). Interestingly, six of the eight crown proteins
(which have few or no interhelical loops) belong to this
group; here, in most cases, the hydrophobicity is contributed
by the N- or C-terminus.
The number of proteins satisfying the statistical criterion is
not very sensitive to the significance level used, as can be
learned from Table 5, where results for significance-level
probabilities ranging from 0.01 to 0.07 for r ¼ 7 and
7.5 A are presented. Such sets of results are expected (and
found) to increase slightly as r increases from 6.5 to 8 A,
TABLE 5 Number of proteins satisfying the statistical criterion
of hydrophobicity for different significance level probabilities, p
r ¼ 7 A* r ¼ 7.5 A*
p IN OUT IN OUT
0.01 19 16 21 15
0.02 21 17 23 15
0.04 23 21 24 18
0.05 23 21 24 19
0.06 24 21 24 19
0.07 24 21 24 20
*r is the radius defining the sphere of nearest-neighbor residues (Ca) around
each residue. The results for p ¼ 0.05 are in bold print.
where the average results obtained for r ¼ 7 and 8 A are
very close to those obtained for r ¼ 7.5 (data not shown).
In these calculations the loops of all of the protein’s chains
are considered. In the calculations of the ‘‘soluble’’ group
of proteins, the soluble chains are excluded, and for the
‘‘long-terminus’’ group, both the loops and the long terminus
are taken into account.
For the ‘‘long-terminus’’ group, when the OUT (IN) side
is dominated by an extremely long N- or C-terminus, this
terminus is typically compact due to hydrophobicity. Thus,
for the two proteins of this category, 1xl4 and 2hyd, the
long terminus is located on the IN side and it is found that
the hydrophobic effect is satisfied (denoted in Table 4 by
a superscript ‘‘I’’ above their names) and for them, DNkIN
> 0.7 and the results are in bold print. For the other proteins,
the long terminus is located in the OUT side, and for all of
these, DNkOUT is given in bold print, meaning that hydropho-
bicity affects all of the long termini (and the corresponding
loops)—in accord with their observed compact structures.
Also, Table 4 reveals that (excluding the italicized results)
only in two cases are the bold-faced values <0.7 (DNk ¼0.5 and 0.4), and two results satisfying DNk R 0.7 (0.8,
0.7) are not in bold print. Thus, DNk ¼ 0.7 constitutes a suit-
able value for DNkmin discussed earlier, i.e., hydrophobicity
is significant for DNk R DNkmin ¼ 0.7.
In summary, our results demonstrate that for most of the
41 proteins the H residues in the extramembranous regions
show a clear preference to avoid the surface, i.e., the contact
with water; this is expected to lead to the loops’ collapse and
to the assembly of TM helices.
Interactions between membrane proteinsand soluble proteins
A complex of a membrane protein with one or more soluble
proteins can affect the association of the TM helices. To
illustrate this effect, we return to the basic assumption that
a-helices are generated first, inserted into the membrane,
and (without the effect of attracting forces) move freely in
the inner membrane (subject to constraints imposed by
stretched loops); in this scenario, the protein will exhibit
an open structure of low density in the central, IN, and
OUT layers. A soluble protein, on the other hand, is typically
compact and, due to its globular shape, would have a rela-
tively small interacting interface with the loops of
a membrane protein. To enhance this interaction, the density
of loops in the (small) interface should increase where this
aggregation is expected to be an additional factor contrib-
uting to the assembly of the TM helices. The discussion
below supports this theory, where evidence is provided
that the interfaces are small, the density of both proteins in
an interface is similar, and most of the complexes are
‘‘held’’ predominately by the hydrophobic interaction.
First, we defined a set of common interfaces consisting
of a-carbon pairs of both proteins with a distance <r, where
Biophysical Journal 96(6) 2299–2312
2306 Tastan et al.
r ¼ 5, 5.5, 6, 6.5, 7, 7.5, and 8 A. For each interface,
we calculated the corresponding fractions of H residues,
finterface-soluble and finterface-loops (see Table 6S in the Support-
ing Material). In principle, an interface defined by a small r is
the most adequate, since it is expected to consist mainly of
the surface residues most likely to participate in protein-
protein interactions. However, small r might be inadequate
when the two proteins are distant from each other, and their
interface would contain a small number of residues. There-
fore, for each pair of a membrane and a soluble protein,
we define an ‘‘optimal’’ r—the lowest value of r for which
each protein contributes to the interface at least ~20 H resi-
dues; this relatively large number is needed to avoid strong
statistical fluctuations in the above fractions for a small
change in the number of H residues.
Eleven membrane/soluble protein pairs are studied,
including 1kqf, which appears in the long-terminus group.
However, 1nek and 1ors and their soluble counterparts do
not satisfy the ~20 H condition, even for r ¼ 8 A (the corre-
sponding numbers of H residues are 9,19 and 4,5); therefore,
results for these proteins are not provided in Table 6 (but
appear in Table 6S), meaning that only nine protein pairs
are analyzed. Table 6 shows that the optimal r varies within
the entire range of 5–8 A, and the results for each pair of
proteins (which are given for the optimal r) are not changed
significantly for a relatively wide range of r values.
For our analysis, we also calculate fentire-soluble and
fentire-loops—the fractions of H residues in the entire soluble
protein and in the entire loops region (of the membrane
protein), respectively. Finally, we define fouter-shell-soluble
and fouter-shell-loops—the fractions of H residues in the outer
spherical shells of the soluble protein and in the loops region
of the membrane protein. fouter-shell-soluble is obtained by
Biophysical Journal 96(6) 2299–2312
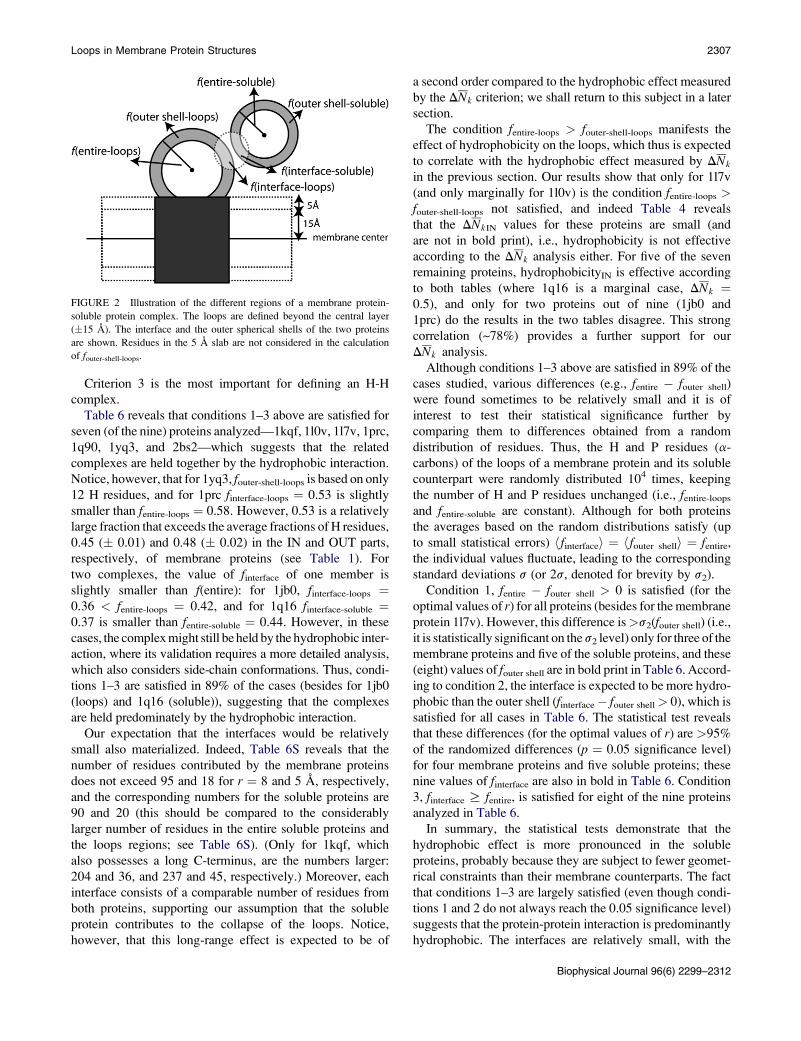
defining two concentric spherical shells around the center
of mass of the protein. The radius R of the inner shell is
adjusted (for each protein) such that the number of H resi-
dues (a-carbons) in the outer shell (R,N) is ~20. In the
same way we calculate the center of mass of the residues
of the loops’ region of the membrane protein; however, to
eliminate the effect of the predominantly hydrophobic resi-
dues in the (nonsurface) interior, a slab of residues that is
parallel and close to the central layer (TM part) is ignored
(see Fig. 2).
Notice that for most proteins, the soluble part consists of
a complex of two or three soluble chains lumped together;
in this case fentire-soluble, fouter-shell-soluble, and finterface-soluble
are calculated with respect to the soluble complex. Also,
for 1l0v and 1q90, the complex consists of two symmetric
(or close-to-symmetric) parts, where the (symmetric) soluble
parts are positioned relatively far from each other. In these
cases, the calculations are based on one part only (where
the results obtained from the second part are identical).
Therefore, the occupancy (in Table 6) of the outer shells
and interfaces of these proteins is relatively low.
In accord with our finding in the previous section, one
would have the following expectations:
1. fentire > fouter shell, i.e., the outer (spherical) shell of both
proteins is less hydrophobic than the entire protein
(entire loops’ region for the membrane protein).
2. For an H-H complex, finterface> fouter shell, for both proteins,
the interface will be more hydrophobic than the outer
shell.
3. For an H-H complex, finterface should be relatively large,
and we require that finterface-soluble R fentire-soluble and
finterface-loops R fentire-loops.
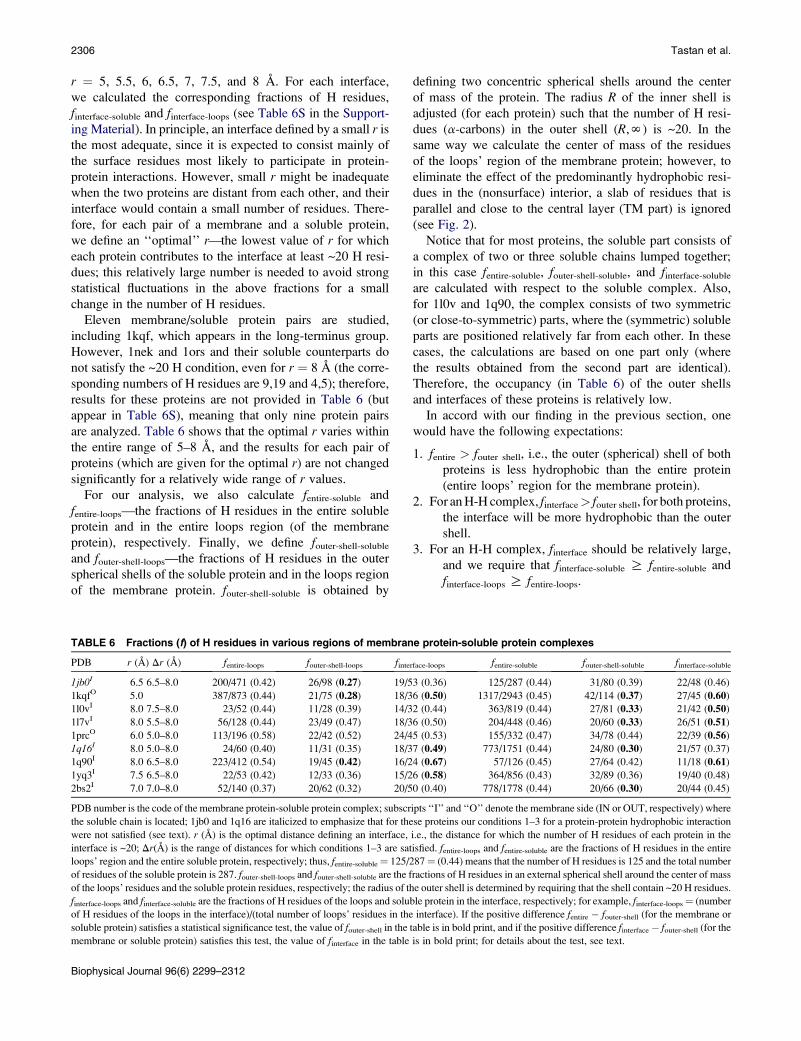
TABLE 6 Fractions (f) of H residues in various regions of membrane protein-soluble protein complexes
PDB r (A) Dr (A) fentire-loops fouter-shell-loops finterface-loops fentire-soluble fouter-shell-soluble finterface-soluble
1jb0I 6.5 6.5–8.0 200/471 (0.42) 26/98 (0.27) 19/53 (0.36) 125/287 (0.44) 31/80 (0.39) 22/48 (0.46)
1kqfO 5.0 387/873 (0.44) 21/75 (0.28) 18/36 (0.50) 1317/2943 (0.45) 42/114 (0.37) 27/45 (0.60)
1l0vI 8.0 7.5–8.0 23/52 (0.44) 11/28 (0.39) 14/32 (0.44) 363/819 (0.44) 27/81 (0.33) 21/42 (0.50)
1l7vI 8.0 5.5–8.0 56/128 (0.44) 23/49 (0.47) 18/36 (0.50) 204/448 (0.46) 20/60 (0.33) 26/51 (0.51)
1prcO 6.0 5.0–8.0 113/196 (0.58) 22/42 (0.52) 24/45 (0.53) 155/332 (0.47) 34/78 (0.44) 22/39 (0.56)
1q16I 8.0 5.0–8.0 24/60 (0.40) 11/31 (0.35) 18/37 (0.49) 773/1751 (0.44) 24/80 (0.30) 21/57 (0.37)
1q90I 8.0 6.5–8.0 223/412 (0.54) 19/45 (0.42) 16/24 (0.67) 57/126 (0.45) 27/64 (0.42) 11/18 (0.61)
1yq3I 7.5 6.5–8.0 22/53 (0.42) 12/33 (0.36) 15/26 (0.58) 364/856 (0.43) 32/89 (0.36) 19/40 (0.48)
2bs2I 7.0 7.0–8.0 52/140 (0.37) 20/62 (0.32) 20/50 (0.40) 778/1778 (0.44) 20/66 (0.30) 20/44 (0.45)
PDB number is the code of the membrane protein-soluble protein complex; subscripts ‘‘I’’ and ‘‘O’’ denote the membrane side (IN or OUT, respectively) where
the soluble chain is located; 1jb0 and 1q16 are italicized to emphasize that for these proteins our conditions 1–3 for a protein-protein hydrophobic interaction
were not satisfied (see text). r (A) is the optimal distance defining an interface, i.e., the distance for which the number of H residues of each protein in the
interface is ~20; Dr(A) is the range of distances for which conditions 1–3 are satisfied. fentire-loops and fentire-soluble are the fractions of H residues in the entire
loops’ region and the entire soluble protein, respectively; thus, fentire-soluble¼ 125/287¼ (0.44) means that the number of H residues is 125 and the total number
of residues of the soluble protein is 287. fouter-shell-loops and fouter-shell-soluble are the fractions of H residues in an external spherical shell around the center of mass
of the loops’ residues and the soluble protein residues, respectively; the radius of the outer shell is determined by requiring that the shell contain ~20 H residues.
finterface-loops and finterface-soluble are the fractions of H residues of the loops and soluble protein in the interface, respectively; for example, finterface-loops¼ (number
of H residues of the loops in the interface)/(total number of loops’ residues in the interface). If the positive difference fentire � fouter-shell (for the membrane or
soluble protein) satisfies a statistical significance test, the value of fouter-shell in the table is in bold print, and if the positive difference finterface� fouter-shell (for the
membrane or soluble protein) satisfies this test, the value of finterface in the table is in bold print; for details about the test, see text.
Loops in Membrane Protein Structures 2307
Criterion 3 is the most important for defining an H-H
complex.
Table 6 reveals that conditions 1–3 above are satisfied for
seven (of the nine) proteins analyzed—1kqf, 1l0v, 1l7v, 1prc,
1q90, 1yq3, and 2bs2—which suggests that the related
complexes are held together by the hydrophobic interaction.
Notice, however, that for 1yq3, fouter-shell-loops is based on only
12 H residues, and for 1prc finterface-loops ¼ 0.53 is slightly
smaller than fentire-loops ¼ 0.58. However, 0.53 is a relatively
large fraction that exceeds the average fractions of H residues,
0.45 (� 0.01) and 0.48 (� 0.02) in the IN and OUT parts,
respectively, of membrane proteins (see Table 1). For
two complexes, the value of finterface of one member is
slightly smaller than f(entire): for 1jb0, finterface-loops ¼0.36 < fentire-loops ¼ 0.42, and for 1q16 finterface-soluble ¼0.37 is smaller than fentire-soluble ¼ 0.44. However, in these
cases, the complex might still be held by the hydrophobic inter-
action, where its validation requires a more detailed analysis,
which also considers side-chain conformations. Thus, condi-
tions 1–3 are satisfied in 89% of the cases (besides for 1jb0
(loops) and 1q16 (soluble)), suggesting that the complexes
are held predominately by the hydrophobic interaction.
Our expectation that the interfaces would be relatively
small also materialized. Indeed, Table 6S reveals that the
number of residues contributed by the membrane proteins
does not exceed 95 and 18 for r ¼ 8 and 5 A, respectively,
and the corresponding numbers for the soluble proteins are
90 and 20 (this should be compared to the considerably
larger number of residues in the entire soluble proteins and
the loops regions; see Table 6S). (Only for 1kqf, which
also possesses a long C-terminus, are the numbers larger:
204 and 36, and 237 and 45, respectively.) Moreover, each
interface consists of a comparable number of residues from
both proteins, supporting our assumption that the soluble
protein contributes to the collapse of the loops. Notice,
however, that this long-range effect is expected to be of
FIGURE 2 Illustration of the different regions of a membrane protein-
soluble protein complex. The loops are defined beyond the central layer
(�15 A). The interface and the outer spherical shells of the two proteins
are shown. Residues in the 5 A slab are not considered in the calculation
of fouter-shell-loops.
a second order compared to the hydrophobic effect measured
by the DNk criterion; we shall return to this subject in a later
section.
The condition fentire-loops > fouter-shell-loops manifests the
effect of hydrophobicity on the loops, which thus is expected
to correlate with the hydrophobic effect measured by DNk
in the previous section. Our results show that only for 1l7v
(and only marginally for 1l0v) is the condition fentire-loops >fouter-shell-loops not satisfied, and indeed Table 4 reveals
that the DNkIN values for these proteins are small (and
are not in bold print), i.e., hydrophobicity is not effective
according to the DNk analysis either. For five of the seven
remaining proteins, hydrophobicityIN is effective according
to both tables (where 1q16 is a marginal case, DNk ¼0.5), and only for two proteins out of nine (1jb0 and
1prc) do the results in the two tables disagree. This strong
correlation (~78%) provides a further support for our
DNk analysis.
Although conditions 1–3 above are satisfied in 89% of the
cases studied, various differences (e.g., fentire � fouter shell)
were found sometimes to be relatively small and it is of
interest to test their statistical significance further by
comparing them to differences obtained from a random
distribution of residues. Thus, the H and P residues (a-
carbons) of the loops of a membrane protein and its soluble
counterpart were randomly distributed 104 times, keeping
the number of H and P residues unchanged (i.e., fentire-loops
and fentire-soluble are constant). Although for both proteins
the averages based on the random distributions satisfy (up
to small statistical errors) h finterfacei ¼ h fouter shelli ¼ fentire,
the individual values fluctuate, leading to the corresponding
standard deviations s (or 2s, denoted for brevity by s2).
Condition 1, fentire � fouter shell > 0 is satisfied (for the
optimal values of r) for all proteins (besides for the membrane
protein 1l7v). However, this difference is>s2(fouter shell) (i.e.,
it is statistically significant on the s2 level) only for three of the
membrane proteins and five of the soluble proteins, and these
(eight) values of fouter shell are in bold print in Table 6. Accord-
ing to condition 2, the interface is expected to be more hydro-
phobic than the outer shell (finterface� fouter shell> 0), which is
satisfied for all cases in Table 6. The statistical test reveals
that these differences (for the optimal values of r) are >95%
of the randomized differences (p ¼ 0.05 significance level)
for four membrane proteins and five soluble proteins; these
nine values of finterface are also in bold in Table 6. Condition
3, finterface R fentire, is satisfied for eight of the nine proteins
analyzed in Table 6.
In summary, the statistical tests demonstrate that the
hydrophobic effect is more pronounced in the soluble
proteins, probably because they are subject to fewer geomet-
rical constraints than their membrane counterparts. The fact
that conditions 1–3 are largely satisfied (even though condi-
tions 1 and 2 do not always reach the 0.05 significance level)
suggests that the protein-protein interaction is predominantly
hydrophobic. The interfaces are relatively small, with the
Biophysical Journal 96(6) 2299–2312
2308 Tastan et al.
densities of both proteins comparable, reflecting the loops’
aggregation, which helps the assembly of the TM helices.
Other helix-helix interactions
It is of interest to relate the long-range hydrophobic effect to
other interactions that affect the assembly of the TM helices,
such as hydrogen bonds and van der Waals interactions.
First, we identified the hydrogen bonds (HBs) and divided
them into two categories, ‘‘short-range’’ and ‘‘long-range’’,
where the first group includes HBs between consecutive
TM helices (along the chain) and the second group consists
of HBs between nonconsecutive TM helices (and also
between TM helices and loops). The numbers of HBs (for
each protein) are denoted by Nsh (short) and Nlo (long).
The short-range HBs (like stretched loops) can potentially
bring consecutive helices together, but cannot lead by them-
selves to the 3D assembly of the TM helices. In Table 4,
column 5, we provide Nsh/Nhel, where Nhel is the total number
of TM helices for a protein. In parentheses, we present the
result of this ratio (decimal number), which makes it possible
to compare the results for the number of HBs per helix
among different proteins. In column 6, results for NsR ¼Nsh þ NR (and for NsR/Nhel (in decimal numbers)) are pre-
sented as a combined measure of the short-range effect.
We have also added to NsR the number of short-range disul-
fide bonds, which exist only for 1ors. In column 7, the
numbers of long-range HBs, Nlo (and Nlo/Nhel (in decimal
numbers)) are provided, which for 1p49 and 1gzm also
include one and two long-range disulfide bonds,
respectively.
Next, we identified the sequence motifs, GXXXG, GX
XXA, AXXXA, IXXXI, [GAS]XXXGXXXG, GXXXGXX
X[GST], GXXGXXX[GST], and SXXXSSXXT, and calcu-
lated their number, Nmot, where a long motif is counted as
two; these motifs are expected to lead to strong van der
Waals attractions between TM helices (28–30). In Table 4,
column 8, we provide the ratios Nmot/Nhel as decimal
numbers. It should be noted that this set of motifs is not
complete, and we have not grouped them according to their
short- or long-range interactions, because we have not iden-
tified their counterpart segments.
The combined effect of various interactionson the assembly of TM helices
The ratios discussed above can be compared for a specific
protein as well as for different proteins. Although the magni-
tude of each ratio reflects its potential contribution to the
organization of the TM helices, the effect of all ratios would
provide a more complete picture. Table 4 reveals that for
1yce, 2bl2 (crowns), and 2hyd (long terminus), all of these
ratios are relatively high. On the other hand, for 1nkz, 2j58
(crowns), and 1gfp (one chain), very low ratios are observed,
and it is intriguing to reveal whether other factors govern the
structure of their TM helices.
Biophysical Journal 96(6) 2299–2312
However, combining these ratios into a single measure
would require experimental data (currently unavailable)
about their relative effect on the folding and stability of
membrane proteins. Still, long-range interactions are ex-
pected to be more important than short-range ones, and
because the typical energy of HBs and van der Waals
sequence motifs lies within a range of ~4 kcal/mol, their
weights (w) should be comparable. However, Nmot also
consists of short-range motifs, so one would expect w(Nlo/
Nhel) > w(Nmot/Nhel) > w(NsR/Nhel). Although it is difficult
to estimate the relative contribution of the hydrophobic inter-
action, it is expected to be significant, and doubled if
DNkR0:7 on both sides of the membrane. On the other
hand, the effect of a soluble protein is small, in particular,
when the complex is on the side of the membrane where
the loops are affected by hydrophobicity (i.e., the value of
DNk is in bold print in Table 4).
It is of interest to examine the cases mentioned above,
where only a few interactions are operative. This category
includes 1nkz, a (crown) nonamer of dimers consisting of
18 nonconnected helices in total, where hydrophobicity is
not effective, and it has been pointed out before that no direct
helix-helix interactions exist within the TM helices (31). We
observed 27 HBs formed between the intracellular end of
a helix and the N-terminus of a neighbor helix, as has already
been observed by others (31). For this protein, however,
essential ‘‘glue’’ that holds the chains together is provided
by three chlorophyll and two caretonoid molecules per dimer
that are bound noncovalently to each dimer. Mutation studies
have shown that in the absence of caretonoid the protein fails
to assemble (32). Moreover, time-resolved fluorescence
experiments showed that chlorophyll a is essential in the
early steps of the protein’s folding (33).
The second protein is Wza (2j58)—a (crown) octamer
forming a ring structure surrounding a central cavity used
for export. Each monomer has a single TM helix at the
C-terminus (345–376), and a bulky OUT ‘‘tail’’. It appears
that the hydrophobicity of the helices plays an important
role in the assembly of this protein. First, fTM ¼ 0.48
(Table 2) is significantly smaller than the average fraction,
fTM ¼ 0.69 (Table 1)—in accord with the formation of an
open cavity. Indeed, the surface of the helices facing the
cavity has been found to be highly polar (34), leading to
protection of the H residues from water. However, this effect
is not taken into account by our five interactions. Thus, the
hydrophobic effect (DNk ¼ 0.9) observed for the tails,
constitutes only a partial contribution to the structural orga-
nization of the TM helices.
An interesting case is the (long-terminus) protein steryl-
sulfatase (1p49). This protein is composed of two TM helices
connected by a six-residue stretched loop, where the other
end of the helices is linked by a disulfide bridge between
Cys170 and Cys242 and a single HB exists between the loop
and one of these helices. Furthermore, the helices are tightly
packed by bringing together side chains of Ile, Val, Ala, and
Loops in Membrane Protein Structures 2309
Phe (35). For this unusual protein with only two TM helices,
these interhelical constraints alone would probably be insuf-
ficient to lock the helices nearby, which thus is being
‘‘helped’’ by the effect of hydrophobicity on the OUT side
of the membrane (DNk ¼ 0.7 (Table 4)).
Are structural constraints imposed by loopsobserved experimentally?
One of our assumptions is that stretched loops provide
a short-range constraint that helps bring the connected
helices together. In this section, we address the question of
whether this constraint is observed experimentally. Exten-
sive experimental studies on the effect of loops on the asso-
ciation and stability of TM helices have been carried out for
bacteriorhodopsin (BR) and, to a lesser extent, mammalian
rhodopsin, both of which are bundles composed of seven
TM helices, denoted A–G. They are particularly suitable
systems for such investigations, because loops 4 and 5 of
their six loops are stretched, respectively; also, hydropho-
bicity does not play a role in rhodopsin and is effective
only slightly in BR, where the main part involved is the
C-terminus (IN). In these experimental studies, a loop was
cut, eliminated, or replaced by a mutation, where two or
more complementary fragments were either coexpressed
or separated, denatured, and reconstituted again in vesicles
or micelles. Most of these studies have led to the conclusion
that with the presence of the retinal ligand the function of the
associated (noncovalently bonded) fragments is similar to
that of the intact protein, suggesting that the corresponding
structures are similar as well; in some studies with BR, the
identity of these structures was validated by x-ray crystallog-
raphy. However, in most cases, the stability of the associated
fragments has been found to be lower than that of the wild-
type (WT). Furthermore, most complementary fragments of
rhodopsin studied were not able to fold correctly, even
though the fragments were coexpressed in vivo. These
experimental results demonstrate collectively that the
geometrical constraints imposed by loops can affect the asso-
ciation and stability of the TM helices. Below we compare in
detail the structural factors for BR and rhodopsin in relation-
ship to these experiments.
First, we discuss fragment complementation studies in
BR. The earliest work by the Khorana and Engelman groups
(36–41) targeted the BC loop, where the fragment pair
AB�CDEFG (with and without the retinal) was studied.
(The symbol ‘‘�’’ indicates the position of a cut in the loop
connecting two helices, e.g., A�B means that no covalent
bond connects helices A and B.) The structure of
AB�CDEFG was found to be similar to the WT structure.
BR was also divided into three fragments, A�B�CDEFG,
targeting the AB loop in addition to the BC loop. The WT
structure still formed, but the yield and stability was drasti-
cally reduced (40,42). Marti later reconstituted in micelles
all possible complementary pairs of BR fragments and
confirmed that loops are not essential for the correct associ-
ation of the TM helices, but that reconstituted fragments
display decreased stability (43). In particular, covalent link-
ages in the BC and DE loops were found to be least impor-
tant for BR stability (43). BR loops were also subjected to
sequence replacements, insertions, and deletions. For
example, replacements of the CD, EF, and FG loops with
glycine-serine containing sequences were found to affect
folding kinetics (44), and the CD and EF replacement
mutants were also biochemically the least stable (45). Even
more drastic changes in the sequence of each BR loop
were introduced by Teufel et al. (46). Only the sequence
alteration of the AB and FG loops resulted in a loss of func-
tion, most plausibly due to folding defects of the respective
proteins (46). In BC and EF loop deletion experiments, again
the structures of all associated fragments were similar to that
of WT, but their stability was reduced (41).
Similar studies were carried out also for rhodopsin (47–
50) and references therein). In the earliest work (e.g.,
(49,51)), proteolytically cleaved but otherwise intact
rhodopsin was studied with absorbance spectroscopy and
circular dichroism. The major conclusion from these and
similar studies was that in the membrane and upon solubili-
zation with detergent, the rhodopsin structure remains intact.
Recent differential scanning calorimetry of the proteolyti-
cally cleaved rhodopsin proteins showed that the CD and
EF loops are important for rhodopsin stability (52). The
role of the loops in folding was also assessed through coex-
pression experiments (47,50). First, five bovine opsin gene
fragments cut in the CD and EF loops were studied (47).
The sites were chosen based on the known proteolytic
cleavage sites. When two or three of the complementary
fragments were coexpressed in mammalian cells and retinal
was added, ABC�DEFG, ABCE�FG, and ABC�DE�FG
formed pigments with spectral properties similar to those
of WT rhodopsin, i.e., the associated fragments kept the
structure of the intact protein. In a later article (50), of 10
possible additional pairs of fragment combinations testing
AB, DE, EF, and FG loops, only fragments 1–194 and
195–348 (ABCD�EFG) and 1–248 and 249–348 (ABC-
DE�FG) were stably associated to a noncovalently-linked
rhodopsin. Still, the yield of the DE loop cut was only
10%. Thus, the two studies showed that only the CD and
EF loops are dispensable for rhodopsin folding and only
when cut at certain positions. Furthermore, unlike most exper-
iments with BR, the rhodopsin fragments studied were not
removed and reconstituted in micelles or liposomes sepa-
rately before combining fragments, but were present simulta-
neously inside the cell during folding. Thus, it cannot be
excluded that partially folded intermediates associate and
that final folding requires tertiary interactions across
fragments.
In summary, although stretched loops only provide
a short-range effect, the above experimental studies suggest
that this effect on protein structure and stability cannot be
Biophysical Journal 96(6) 2299–2312
2310 Tastan et al.
ignored. For BR, most of the loops are dispensable as regards
folding, but typically contribute to protein stability. This is in
marked contrast to rhodopsin, whose folding appears to be
severely compromised by the vast majority of cuts in its
loop regions, with the exception of the cytoplasmic CD
and EF loops, which are nonetheless critical for rhodopsin
stability.
SUMMARY
The objective of this article has been twofold: to study the
effect of loops (in particular their hydrophobicity) on the
assembly of TM helices and to understand this assembly
from a global perspective, where the effect of loops is
combined with interhelical interactions such as hydrogen
bonds and sequence motifs. However, unlike globular
proteins, which are largely spherical, the structural organiza-
tion of membrane proteins varies significantly, in particular
in the non-TM regions; therefore, our analysis required
dividing the proteins into different groups.
Our working assumption is that a-helices are generated
first, then inserted into the membrane, and that without the
existence of attracting forces, they would not assemble but
would move freely in the inner membrane (subject to
constraints imposed by stretched loops) to maximize entropy.
Correspondingly, we defined the loop flexibility ratio, R, and
showed that a significant fraction—53% of the loops in a set
of 41 proteins—are stretched, where a stretched loop
constrains the distance between the two connected helices.
Experimental data demonstrate that this limited (short-range)
effect cannot be ignored. Thus, when the (mostly stretched)
loops of BR were cut, eliminated, or replaced by a mutation,
BR stability in most cases was decreased (even though the
structure was not affected). On the other hand, in related
studies of bovine rhodopsin the majority of loops were found
to be critical for the formation of the structure.
Nonstretched (long) loops that span the headgroup region
and the surrounding water (on each side of the membrane)
tend to collapse (like soluble proteins) to protect their H resi-
dues from contact with water and this ‘‘togetherness’’ may
be transferred to the TM helices, causing them to assemble.
To check whether this hydrophobicity effect exists in known
membrane protein structures, we calculated the average
occupancy, NHðkÞ and NPðkÞ of residues (in spheres of
different radii) around H and P residues, respectively, where
a higher average occupancy is expected for the H residues
that are located in the interior of a loop region; thus, a positive
difference in occupancy, DNk ¼ NHðkÞ � NPðkÞ, above
some threshold constitutes a significant measure of hydro-
phobicity (k is IN or OUT). Through a randomization test,
we identified DNk values that are significantly larger than
would be expected by chance, finding that for 70% of the
proteins, at least one side of the membrane is affected signif-
icantly by hydrophobicity (at significance level p ¼ 0.05);
this statistical test is equivalent (approximately) to a (phys-
Biophysical Journal 96(6) 2299–2312
ical) criterion based on DNkmin ¼ 0.7, where forDNk RDNkmin, the hydrophobic interaction is significant. This
aggregation of loops is a long-range type of interaction,
which is expected to affect the assembly of all helices (not
only consecutive ones).
We have demonstrated that a complex of a membrane
protein and a soluble protein is characterized by a relatively
small interface at which the density of both proteins is
similar, meaning that the loops undergo aggregation, which
would be expected to constrain the TM helices as well. We
have also shown that the interaction between these proteins
is predominantly hydrophobic. However, this long-range
effect is expected to be weaker than the structural organiza-
tion of loops due to their hydrophobicity, which is expressed
by the DNk criterion.
To take into account the combined effect of various inter-
actions, we divide them (as mentioned above) into short- and
long-range, where the latter have the stronger influence on
the assembly of the TM helices. More specifically, the
number of occurrences of each interaction is divided by
the number of TM helices, Nhel, where the corresponding
ratios for different proteins can be compared. Although we
do not assign values to the weights (w), we expect them to
satisfy w(Nlo/Nhel) > w(Nmot/Nhel) > w(NsR/Nhel), where
Nlo is the number of long-range HBs, Nmot is the number
of van der Waals sequence motifs, and NsR is the combined
number of stretched loops and short-range HBs. In addition,
we expect the weight of hydrophobicity (which is expected
to lead to the compactness of the longer loops) to be signif-
icant. It is of interest to understand the structure and stability
of proteins with extremely low ratios. A close examination of
such proteins has shown that additional factors, such as
protein-ligand interactions, might be important and should
be taken into account. Finally, one hopes that understanding
the relative contribution of various interactions will provide
better insight into protein structure and might lead to
improved algorithms for structure prediction of membrane
proteins.
SUPPORTING MATERIAL
Table 6S is available at http://www.biophysj.org/biophysj/supplemental/
S0006-3495(09)00307-5.
This work was supported in part by the Sofya Kovalevskaya Prize of the Hum-
boldt Foundation, Germany/Zukunftsinvestitionsprogramm der Bundesre-
gierung Deutschland, by National Science Foundation grants EIA0225636/
EIA0225656 and CAREER CC044917, National Institutes of Health grants
NLM108730 and 2-R01 GM066090-4 A2, and by the Pennsylvania Depart-
ment of Health.
REFERENCES
1. Curran, A. R., and D. M. Engelman. 2003. Sequence motifs, polar inter-actions and conformational changes in helical membrane proteins. Curr.Opin. Struct. Biol. 13:412–417.
Loops in Membrane Protein Structures 2311
2. White, S. H., and W. C. Wimley. 1999. Membrane protein folding andstability: physical principles. Annu. Rev. Biophys. Biomol. Struct.28:319–365.
3. Popot, J. L., and D. M. Engelman. 2000. Helical membrane proteinfolding, stability, and evolution. Annu. Rev. Biochem. 69:881–922.
4. Senes, A., I. Ubarretxena-Belandia, and D. M. Engelman. 2001. TheCa-H.O hydrogen bond: a determinant of stability and specificity intransmembrane helix interactions. Proc. Natl. Acad. Sci. USA. 98:9056–9061.
5. Bowie, J. U. 2005. Solving the membrane protein folding problem.Nature. 438:581–589.
6. Fleishman, S. J., and N. Ben-Tal. 2006. Progress in structure predic-tion of a-helical membrane proteins. Curr. Opin. Struct. Biol. 16:496–504.
7. Mackenzie, K. R. 2006. Folding and stability of alpha-helical integralmembrane proteins. Chem. Rev. 106:1931–1977.
8. Gratkowski, H., J. D. Lear, and W. F. DeGrado. 2001. Polar side chainsdrive the association of model transmembrane peptides. Proc. Natl.Acad. Sci. USA. 98:880–885.
9. Adamian, L., and J. Liang. 2002. Interhelical hydrogen bonds andspatial motifs in membrane proteins: polar clamps and serine zippers.Proteins. 47:209–218.
10. White, S. H. 2005. How hydrogen bonds shape membrane protein struc-ture. Adv. Protein Chem. 72:157–172.
11. Hildebrand, P. W., S. Gunther, A. Goede, L. Forrest, C. Frommel, et al.2008. Hydrogen-bonding and packing features of membrane proteins:functional implications. Biophys. J. 94:1945–1953.
12. Liang, J., L. Adamian, and R. Jackups, Jr. 2005. The membrane-waterinterface r region of membrane proteins: structural bias and the anti-snorkeling effect. Trends Biochem. Sci. 30:355–357.
13. Klein-Seetharaman, J. 2005. Dual role of interactions between membra-nous and soluble portions of helical membrane receptors for folding andsignaling. Trends Pharmacol. Sci. 26:183–189.
14. Granseth, E., G. von Heijne, and A. Elofsson. 2005. A study of themembrane-water interface region of membrane proteins. J. Mol. Biol.346:377–385.
15. Tusnady, G. E., Z. Dosztanyi, and I. Simon. 2004. Transmembraneproteins in the Protein Data Bank: identification and classification. Bio-informatics. 20:2964–2972.
16. Altschul, S. F., T. L. Madden, A. A. Schaffer, J. Zhang, Z. Zhang, et al.1997. Gapped BLAST and PSI-BLAST: a new generation of proteindatabase search programs. Nucleic Acids Res. 25:3389–3402.
17. Lomize, M. A., A. L. Lomize, I. D. Pogozheva, and H. I. Mosberg.2006. OPM: orientations of proteins in membranes database. Bioinfor-matics. 22:623–625.
18. Jayasinghe, S., K. Hristova, and S. H. White. 2001. MPtopo: a databaseof membrane protein topology. Protein Sci. 10:455–458.
19. Schwartz, R., S. Istrail, and J. King. 2001. Frequencies of amino acidstrings in globular protein sequences indicate suppression of blocks ofconsecutive hydrophobic residues. Protein Sci. 10:1023–1031.
20. Miao, J., J. Klein-Seetharaman, and H. Meirovitch. 2004. The optimalfraction of hydrophobic residues required to ensure protein collapse.J. Mol. Biol. 344:797–811.
21. Heinig, M., and D. Frishman. 2004. STRIDE: a web server forsecondary structure assignment from known atomic coordinates ofproteins. Nucleic Acids Res. 32:W500–W502.
22. Pettersen, E. F., T. D. Goddard, C. C. Huang, G. S. Couch,D. M. Greenblatt, et al. 2004. UCSF Chimera—a visualization systemfor exploratory research and analysis. J. Comput. Chem. 25:1605–1612.
23. McDonald, I. K., and J. M. Thornton. 1994. Satisfying hydrogenbonding potential in proteins. J. Mol. Biol. 238:777–793.
24. Meirovitch, H. S., and H. A. Scheraga. 1980. Empirical studies ofhydrophobicity. 2. Distribution of the hydrophobic, hydrophilic,neutral, and ambivalent amino acids in the interior and exterior layersof native proteins. Macromolecules. 13:1406–1414.
25. Das, B., and H. Meirovitch. 2001. Optimization of solvation models forpredicting the structure of surface loops in proteins. Proteins. 43:303–314.
26. Flory, P. 1998. Statistical Mechanics of Chain Molecules. Hanser,New York.
27. Miyazawa, S., and R. L. Jernigan. 1985. Estimation of effective inter-residue contact energies from protein crystal structures: quasi-chemicalapproximation. Macromolecules. 18:534–552.
28. Dawson, J. P., J. S. Weinger, and D. M. Engelman. 2002. Motifs ofserine and threonine can drive association of transmembrane helices.J. Mol. Biol. 316:799–805.
29. Kleiger, G., R. Grothe, P. Mallick, and D. Eisenberg. 2002. GXXXGand AXXXA: common a-helical interaction motifs in proteins, particu-larly in extremophiles. Biochemistry. 41:5990–5997.
30. Kim, S., T. J. Jeon, A. Oberai, D. Yang, J. J. Schmidt, et al. 2005. Trans-membrane glycine zippers: physiological and pathological roles inmembrane proteins. Proc. Natl. Acad. Sci. USA. 102:14278–14283.
31. Law, C. J., A. W. Roszak, J. Southall, A. T. Gardiner, N. W. Isaacs,et al. 2004. The structure and function of bacterial light-harvestingcomplexes. Mol. Membr. Biol. 21:183–191.
32. Zurdo, J., C. Fernandez-Cabrera, and J. M. Ramirez. 1993. A structuralrole of the carotenoid in the light-harvesting II protein of Rhodobactercapsulatus. Biochem. J. 290:531–537.
33. Horn, R., and H. Paulsen. 2004. Early steps in the assembly of light-har-vesting chlorophyll a/b complex: time-resolved fluorescence measure-ments. J. Biol. Chem. 279:44400–44406.
34. Dong, C., K. Beis, J. Nesper, A. L. Brunkan-Lamontagne, B. R. Clarke,et al. 2006. Wza the translocon for E. coli capsular polysaccharidesdefines a new class of membrane protein. Nature. 444:226–229.
35. Hernandez-Guzman, F. G., T. Higashiyama, W. Pangborn, Y. Osawa,and D. Ghosh. 2003. Structure of human estrone sulfatase suggestsfunctional roles of membrane association. J. Biol. Chem. 278:22989–22997.
36. Huang, K. S., H. Bayley, M. J. Liao, E. London, and H. G. Khorana.1981. Refolding of an integral membrane protein. Denaturation, rena-turation, and reconstitution of intact bacteriorhodopsin and two proteo-lytic fragments. J. Biol. Chem. 256:3802–3809.
37. Liao, M. J., E. London, and H. G. Khorana. 1983. Regeneration of thenative bacteriorhodopsin structure from two chymotryptic fragments. J.Biol. Chem. 258:9949–9955.
38. Popot, J. L., S. E. Gerchman, and D. M. Engelman. 1987. Refolding ofbacteriorhodopsin in lipid bilayers. A thermodynamically controlledtwo-stage process. J. Mol. Biol. 198:655–676.
39. Kahn, T. W., and D. M. Engelman. 1992. Bacteriorhodopsin can be re-folded from two independently stable transmembrane helices and thecomplementary five-helix fragment. Biochemistry. 31:6144–6151.
40. Kahn, T. W., J. M. Sturtevant, and D. M. Engelman. 1992. Thermody-namic measurements of the contributions of helix-connecting loops andof retinal to the stability of bacteriorhodopsin. Biochemistry. 31:8829–8839.
41. Gilles-Gonzalez, M. A., D. M. Engelman, and H. G. Khorana. 1991.Structure-function studies of bacteriorhodopsin XV. Effects of deletionsin loops B-C and E-F on bacteriorhodopsin chromophore and structure.J. Biol. Chem. 266:8545–8550.
42. Liao, M. J., K. S. Huang, and H. G. Khorana. 1984. Regeneration ofnative bacteriorhodopsin structure from fragments. J. Biol. Chem.259:4200–4204.
43. Marti, T. 1998. Refolding of bacteriorhodopsin from expressed poly-peptide fragments. J. Biol. Chem. 273:9312–9322.
44. Allen, S. J., J. M. Kim, H. G. Khorana, H. Lu, and P. J. Booth.2001. Structure and function in bacteriorhodopsin: the effect of theinterhelical loops on the protein folding kinetics. J. Mol. Biol.308:423–435.
45. Kim, J. M., P. J. Booth, S. J. Allen, and H. G. Khorana. 2001. Structureand function in bacteriorhodopsin: the role of the interhelical loops in
Biophysical Journal 96(6) 2299–2312
2312 Tastan et al.
the folding and stability of bacteriorhodopsin. J. Mol. Biol. 308:409–422.
46. Teufel, M., M. Pompejus, B. Humbel, K. Friedrich, and H. J. Fritz.1993. Properties of bacteriorhodopsin derivatives constructed by inser-tion of an exogenous epitope into extra-membrane loops. EMBO J.12:3399–3408.
47. Ridge, K. D., S. S. Lee, and L. L. Yao. 1995. In vivo assembly ofrhodopsin from expressed polypeptide fragments. Proc. Natl. Acad.Sci. USA. 92:3204–3208.
48. Litman, B. J. 1979. Rhodopsin: its molecular substructure and phospho-lipid interactions. Photochem. Photobiol. 29:671–677.
Biophysical Journal 96(6) 2299–2312
49. Albert, A. D., and B. J. Litman. 1978. Independent structural domains inthe membrane protein bovine rhodopsin. Biochemistry. 17:3893–3900.
50. Ridge, K. D., S. S. Lee, and N. G. Abdulaev. 1996. Examiningrhodopsin folding and assembly through expression of polypeptide frag-ments. J. Biol. Chem. 271:7860–7867.
51. Pober, J. S., and L. Stryer. 1975. Letter to the editor: Light dissociatesenzymatically-cleaved rhodopsin into two different fragments. J. Mol.Biol. 95:477–481.
52. Landin, J. S., M. Katragadda, and A. D. Albert. 2001. Thermal destabi-lization of rhodopsin and opsin by proteolytic cleavage in bovine rodouter segment disk membranes. Biochemistry. 40:11176–11183.


![High optical and structural quality of GaN epilayers grown ...projects.itn.pt/marco_fct/[4]High optical and structural quality of GaN... · High optical and structural quality of](https://static.fdocument.org/doc/165x107/5e880c2016bca472f2564feb/high-optical-and-structural-quality-of-gan-epilayers-grown-4high-optical-and.jpg)


![(Reference [2]) LINEAR PHASE LOCKED LOOPS - CONTINUED …pallen.ece.gatech.edu/Academic/ECE_6440/Summer_2003/L060-LPLL-II(2UP).pdf(Reference [2]) LINEAR PHASE LOCKED LOOPS - CONTINUED](https://static.fdocument.org/doc/165x107/6016ce84e4e4bb557426a4e4/reference-2-linear-phase-locked-loops-continued-2uppdf-reference-2-linear.jpg)