
Field Effect Transistor MOS-FET, J-FET · 2019-06-20 · Φʑσική λειʐοʑργία mos-fet 0
Upload
nguyenngocCategory
view
220download
0
The E-Model, R Factor and MOS Overview

The E-Model, R Factor and MOS
The Basic Formula
The basic formula for the E-Model is below.
R Factor = Ro - Is - Id - Ie + A
R Factor: Overall network quality rating (ranges between 0 and 100)
Ro: Signal to noise ratio
Is: Impairments simultaneous to voice signal transmission
Id: Impairments delayed after voice signal transmission
Ie: Effects of Equipment (e.g. codecs)
A: Advantage factor (attempts to account for caller expectations)
In simple terms, the overall quality (R Factor) is calculated by estimating the signal to noise ratio of a connection (Ro) and subtracting the network impairments (Is, Id, Ie) that in turn are offset by any expectations of quality had by the caller (A).
The E-Model, R Factor and MOS
Σ
CalcRo
CalcId
CalcIs
A-factor
Ro and Impairment calculations
Loudness ratingsSensitivitiesNoise estimates
Ie
Loudness ratingsSidetone valuesEcho information
Delay measuresEcho InformationSidetone values
R-factor(1 to 100)
reference tables
Σ
CalcRo
CalcId
CalcIs
A-factor
Ro and Impairment calculations
Loudness ratingsSensitivitiesNoise estimates
Loudness ratingsSensitivitiesNoise estimates
Ie
Loudness ratingsSidetone valuesEcho information
Loudness ratingsSidetone valuesEcho information
Delay measuresEcho InformationSidetone values
R-factor(1 to 100)
reference tables
reference tables
Using the E-Model for Estimating Voice Quality
While a network is still on paper, a network planner can use the E Model to estimate its likely quality. The engineer gathers input information from reference tables, enters it into the E-Model, and calculates the resulting Transmission Quality Rating (R Factor).
The table below shows how R Factor values may be interpreted:
User Satisfaction R Factor Value Range
Very Satisfied 90-100
Satisfied 80-89
Some Users Dissatisfied 70-79
Many Users Dissatisfied 60-69
Nearly all Users Dissatisfied 50-59
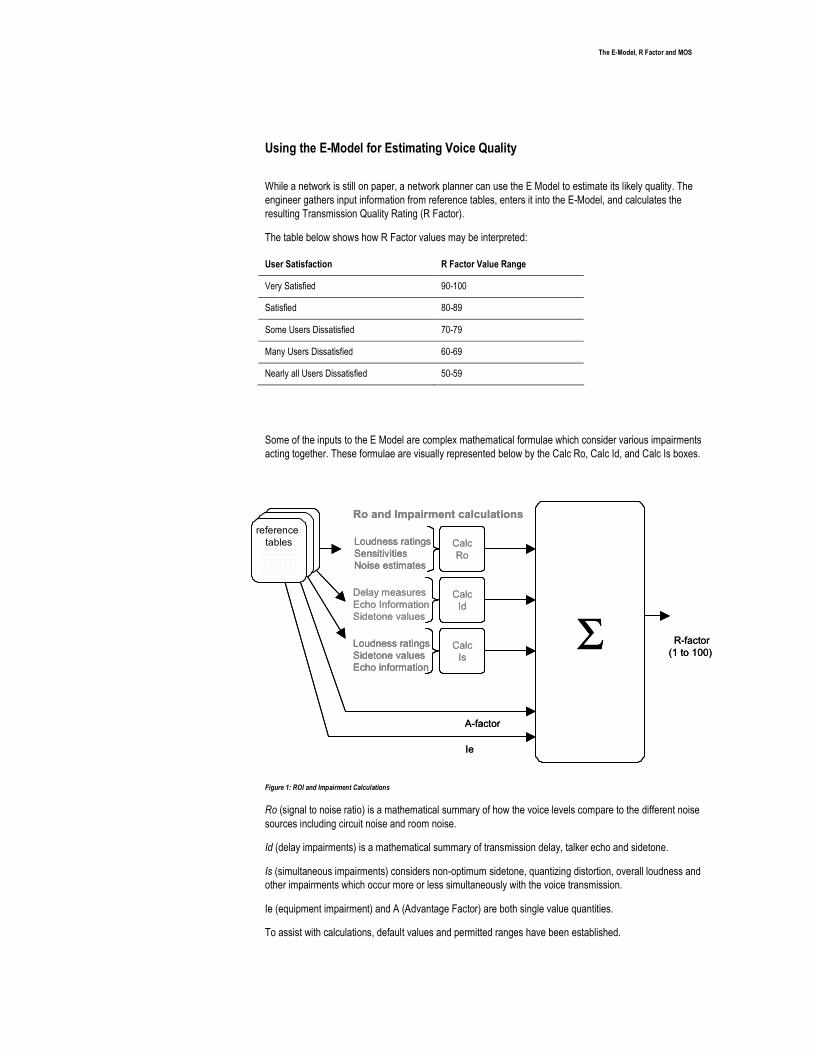
Some of the inputs to the E Model are complex mathematical formulae which consider various impairments acting together. These formulae are visually represented below by the Calc Ro, Calc Id, and Calc Is boxes.
Figure 1: ROI and Impairment Calculations
Ro (signal to noise ratio) is a mathematical summary of how the voice levels compare to the different noise sources including circuit noise and room noise.
Id (delay impairments) is a mathematical summary of transmission delay, talker echo and sidetone.
Is (simultaneous impairments) considers non-optimum sidetone, quantizing distortion, overall loudness and other impairments which occur more or less simultaneously with the voice transmission.
Ie (equipment impairment) and A (Advantage Factor) are both single value quantities.
To assist with calculations, default values and permitted ranges have been established.
The E-Model, R Factor and MOS
Using the E-Model to Measure Live Networks
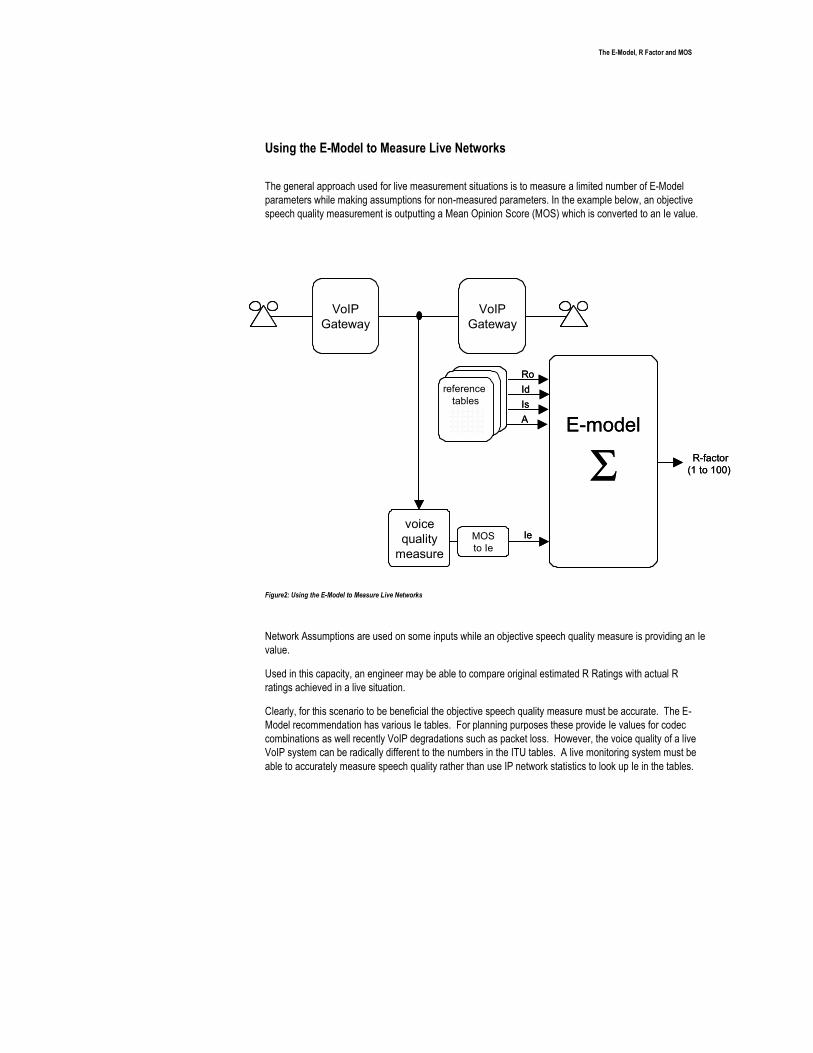
The general approach used for live measurement situations is to measure a limited number of E-Model parameters while making assumptions for non-measured parameters. In the example below, an objective speech quality measurement is outputting a Mean Opinion Score (MOS) which is converted to an Ie value.
Figure2: Using the E-Model to Measure Live Networks
Network Assumptions are used on some inputs while an objective speech quality measure is providing an Ie value.
Used in this capacity, an engineer may be able to compare original estimated R Ratings with actual R ratings achieved in a live situation.
Clearly, for this scenario to be beneficial the objective speech quality measure must be accurate. The E-Model recommendation has various Ie tables. For planning purposes these provide Ie values for codec combinations as well recently VoIP degradations such as packet loss. However, the voice quality of a live VoIP system can be radically different to the numbers in the ITU tables. A live monitoring system must be able to accurately measure speech quality rather than use IP network statistics to look up Ie in the tables.
E-model
Σ
RoIdIsA
Ie
R-factor(1 to 100)
reference tables
MOSto Ie
voicequality
measure
VoIPGateway
VoIPGateway
E-model
Σ
RoIdIsA
Ie
R-factor(1 to 100)
reference tables
reference tables
MOSto Ie
voicequality
measure
VoIPGateway
VoIPGateway
VoIPGateway
VoIPGateway

The E-Model, R Factor and MOS
Accuracy of the E-Model
The E-Model was designed to provide estimated network quality and has shown to be reasonably accurate for this purpose. It has not been accepted as a valid measurement tool for live networks.
Increasingly, and against ITU recommendations, the E-Model is being marketed to the industry as a live voice quality measurement tool. The ITU-T G.107 Recommendation states at the beginning of the document that
“Such estimates are only made for transmission planning purposes and not for actual customer opinion prediction (for which there is no agreed-upon model recommended by the ITU-T). “
It also provides a caution with the following paragraph.
“The E-Model has not been fully verified by field surveys or laboratory tests for the very large number of possible combinations of input parameters. For many combinations of high importance to transmission planners, the E-Model can be used with confidence, but for other parameter combinations, E-Model predictions have been questioned and are currently under study.
Accordingly, caution must be exercised when using the E-Model for some conditions; for example, the E-Model may give inaccurate results for combinations of certain types of impairments. Annex A provides further information in this regard.”