THE DUST CLOUD AROUND THE WHITE DWARF G 29-38. II ...
16
The Astrophysical Journal, 693:697–712, 2009 March 1 doi:10.1088/0004-637X/693/1/697 C 2009. The American Astronomical Society. All rights reserved. Printed in the U.S.A. THE DUST CLOUD AROUND THE WHITE DWARF G 29-38. II. SPECTRUM FROM 5 TO 40 μm AND MID-INFRARED PHOTOMETRIC VARIABILITY William T. Reach 1 , Carey Lisse 2 , Ted von Hippel 3 ,4 ,6 , and Fergal Mullally 5 1 Infrared Processing and Analysis Center, MS 220-6, California Institute of Technology, Pasadena, CA 91125, USA; [email protected] 2 Planetary Exploration Group, Space Department, Johns Hopkins University, Applied Physics Laboratory, Laurel, MD, USA 3 Physics Department, Siena College, 515 Loudon Road, Loudonville, NY 12211, USA 4 Department of Physics, Florida International University, 11200 SW 8th Street, Miami, FL 33199, USA 5 Department of Astronomy, University of Texas, 1 University Station, C1400, Austin, TX 78712, USA Received 2008 August 12; accepted 2008 August 21; published 2009 March 3 ABSTRACT We model the mineralogy and distribution of dust around the white dwarf G29-39 using the infrared spectrum from 1 to 35 μm. The spectral model for G29-38 dust combines a wide range of materials based on spectral studies of comets and debris disks. In order of their contribution to the mid-infrared emission, the most abundant minerals around G29-38 are amorphous carbon (λ< 8 μm), amorphous and crystalline silicates (5–40 μm), water ice (10–15 and 23–35 μm), and metal sulfides (18–28 μm). The amorphous C can be equivalently replaced by other materials (like metallic Fe) with featureless infrared spectra. The best-fitting crystalline silicate is Fe-rich pyroxene. In order to absorb enough starlight to power the observed emission, the disk must either be much thinner than the stellar radius (so that it can be heated from above and below) or it must have an opening angle wider than 2 ◦ . A “moderately optically thick” torus model fits well if the dust extends inward to 50 times the white dwarf radius, all grains hotter than 1100 K are vaporized, the optical depth from the star through the disk is τ = 5, and the radial density profile ∝ r −2.7 ; the total mass of this model disk is 2 × 10 19 g. A physically thin (less than the white dwarf radius) and optically thick disk can contribute to the near- infrared continuum only; such a disk cannot explain the longer-wavelength continuum or strong emission features. The combination of a physically thin, optically thick inner disk and an outer, physically thick and moderately optically thin cloud or disk produces a reasonably good fit to the spectrum and requires only silicates in the outer cloud. We discuss the mineralogical results in comparison to planetary materials. The silicate composition contains minerals found from cometary spectra and meteorites, but Fe-rich pyroxene is more abundant than enstatite (Mg-rich pyroxene) or forsterite (Mg-rich olivine) in G29-38 dust, in contrast to what is found in most comet or meteorite mineralogies. Enstatite meteorites may be the most similar solar system materials to G29-38 dust. Finally, we suggest the surviving core of a “hot Jupiter” as an alternative (neither cometary nor asteroidal) origin for the debris, though further theoretical work is needed to determine if this hypothesis is viable. Key words: infrared: stars – stars: individual (G29-38, WD 2326+049) – white dwarfs Online-only material: color figures 1. INTRODUCTION The end state of stellar evolution for most types of star is a white dwarf. Planetary material is common around main- sequence stars (Backman & Paresce 1993; Rhee et al. 2007; Trilling et al. 2008). Part of the planetary system is expected to survive the violent, late stages of stellar evolution (Debes & Sigurdsson 2002). Thus, it is to be expected that planetary ma- terials are present around white dwarfs. But since white dwarfs are so underluminous, this material is normally impossible to detect via reflected light or thermal emission if it is distributed like the solar system (with its inner portion destroyed out to at least the maximum radius of the red giant/asymptotic giant branch (AGB) photosphere). Young, hot white dwarfs, where debris can be detected even at 100 AU from the star (Su et al. 2007), are the exception to this rule. Planetary material can become detectable if it moves sufficiently close to a star, for example via gravitational perturbations such as produce comets in the inner solar system (from their Kuiper Belt or Oort Cloud homes) and meteorites on the surface of Earth (from their as- teroid belt homes). Jura (2003) explained how an asteroid can 6 Visiting Research Scientist at Florida International University. pass sufficiently close to a white dwarf to be tidally disrupted, leaving a disk of dust near the star. Sun-grazing comets in the solar system pass within similar distances. The new and grow- ing class of dusty, metal-rich white dwarfs (classified as DAZd, where D = white dwarf, A = mostly hydrogen atmosphere, Z = trace atmospheric metals, d = dusty) allow a unique win- dow into planetary systems (von Hippel et al. 2007). The first-known DAZd star, and the one with the brightest infrared excess, is Giclas 29-38 (WD 2326+049; G29-38 here- after). Its effective temperature has been estimated in the range 11,800–12,100 K with surface gravity log g in the range 8.14– 7.90 (e.g., Bergeron et al. 2004; Koester et al. 2005). In Holberg & Bergeron (2006), the model corresponding to the lowest esti- mated T and highest g has radius 8100 km and mass 0.69 M , while the model corresponding to the highest T and lowest g has radius 9650 km and mass 0.55 M . At wavelengths longer than 2.5 μm the spectrum is completely dominated by non- photospheric thermal emission with color temperatures 300– 900 K. In Paper I (Reach et al. 2005a), we measured the spectrum of this star from 5.5 to 14 μm, revealing a remarkably strong emission feature from 9 to 11 μm that is typical of small (less than 2 μm radius) silicate grains. The brightness of the disk permits spectroscopy at sufficient signal-to-noise ratio (S/N) to study the dust mineralogy. We have now measured the 697
Transcript of THE DUST CLOUD AROUND THE WHITE DWARF G 29-38. II ...
The Astrophysical Journal, 693:697–712, 2009 March 1 doi:10.1088/0004-637X/693/1/697C© 2009. The American Astronomical Society. All rights reserved. Printed in the U.S.A.
THE DUST CLOUD AROUND THE WHITE DWARF G 29-38. II. SPECTRUM FROM 5 TO 40 μm ANDMID-INFRARED PHOTOMETRIC VARIABILITY
William T. Reach1, Carey Lisse
2, Ted von Hippel
3,4,6, and Fergal Mullally
51 Infrared Processing and Analysis Center, MS 220-6, California Institute of Technology, Pasadena, CA 91125, USA; [email protected]
2 Planetary Exploration Group, Space Department, Johns Hopkins University, Applied Physics Laboratory, Laurel, MD, USA3 Physics Department, Siena College, 515 Loudon Road, Loudonville, NY 12211, USA
4 Department of Physics, Florida International University, 11200 SW 8th Street, Miami, FL 33199, USA5 Department of Astronomy, University of Texas, 1 University Station, C1400, Austin, TX 78712, USA
Received 2008 August 12; accepted 2008 August 21; published 2009 March 3
ABSTRACT
We model the mineralogy and distribution of dust around the white dwarf G29-39 using the infrared spectrumfrom 1 to 35 μm. The spectral model for G29-38 dust combines a wide range of materials based on spectralstudies of comets and debris disks. In order of their contribution to the mid-infrared emission, the most abundantminerals around G29-38 are amorphous carbon (λ < 8 μm), amorphous and crystalline silicates (5–40 μm), waterice (10–15 and 23–35 μm), and metal sulfides (18–28 μm). The amorphous C can be equivalently replacedby other materials (like metallic Fe) with featureless infrared spectra. The best-fitting crystalline silicate isFe-rich pyroxene. In order to absorb enough starlight to power the observed emission, the disk must eitherbe much thinner than the stellar radius (so that it can be heated from above and below) or it must have anopening angle wider than 2◦. A “moderately optically thick” torus model fits well if the dust extends inwardto 50 times the white dwarf radius, all grains hotter than 1100 K are vaporized, the optical depth from thestar through the disk is τ‖ = 5, and the radial density profile ∝ r−2.7; the total mass of this model disk is2 × 1019 g. A physically thin (less than the white dwarf radius) and optically thick disk can contribute to the near-infrared continuum only; such a disk cannot explain the longer-wavelength continuum or strong emission features.The combination of a physically thin, optically thick inner disk and an outer, physically thick and moderatelyoptically thin cloud or disk produces a reasonably good fit to the spectrum and requires only silicates in theouter cloud. We discuss the mineralogical results in comparison to planetary materials. The silicate compositioncontains minerals found from cometary spectra and meteorites, but Fe-rich pyroxene is more abundant thanenstatite (Mg-rich pyroxene) or forsterite (Mg-rich olivine) in G29-38 dust, in contrast to what is found inmost comet or meteorite mineralogies. Enstatite meteorites may be the most similar solar system materials toG29-38 dust. Finally, we suggest the surviving core of a “hot Jupiter” as an alternative (neither cometary norasteroidal) origin for the debris, though further theoretical work is needed to determine if this hypothesis is viable.
Key words: infrared: stars – stars: individual (G29-38, WD 2326+049) – white dwarfs
Online-only material: color figures
1. INTRODUCTION
The end state of stellar evolution for most types of star isa white dwarf. Planetary material is common around main-sequence stars (Backman & Paresce 1993; Rhee et al. 2007;Trilling et al. 2008). Part of the planetary system is expectedto survive the violent, late stages of stellar evolution (Debes &Sigurdsson 2002). Thus, it is to be expected that planetary ma-terials are present around white dwarfs. But since white dwarfsare so underluminous, this material is normally impossible todetect via reflected light or thermal emission if it is distributedlike the solar system (with its inner portion destroyed out toat least the maximum radius of the red giant/asymptotic giantbranch (AGB) photosphere). Young, hot white dwarfs, wheredebris can be detected even at 100 AU from the star (Su et al.2007), are the exception to this rule. Planetary material canbecome detectable if it moves sufficiently close to a star, forexample via gravitational perturbations such as produce cometsin the inner solar system (from their Kuiper Belt or Oort Cloudhomes) and meteorites on the surface of Earth (from their as-teroid belt homes). Jura (2003) explained how an asteroid can
6 Visiting Research Scientist at Florida International University.
pass sufficiently close to a white dwarf to be tidally disrupted,leaving a disk of dust near the star. Sun-grazing comets in thesolar system pass within similar distances. The new and grow-ing class of dusty, metal-rich white dwarfs (classified as DAZd,where D = white dwarf, A = mostly hydrogen atmosphere,Z = trace atmospheric metals, d = dusty) allow a unique win-dow into planetary systems (von Hippel et al. 2007).
The first-known DAZd star, and the one with the brightestinfrared excess, is Giclas 29-38 (WD 2326+049; G29-38 here-after). Its effective temperature has been estimated in the range11,800–12,100 K with surface gravity log g in the range 8.14–7.90 (e.g., Bergeron et al. 2004; Koester et al. 2005). In Holberg& Bergeron (2006), the model corresponding to the lowest esti-mated T and highest g has radius 8100 km and mass 0.69 M�,while the model corresponding to the highest T and lowest ghas radius 9650 km and mass 0.55 M�. At wavelengths longerthan 2.5 μm the spectrum is completely dominated by non-photospheric thermal emission with color temperatures 300–900 K. In Paper I (Reach et al. 2005a), we measured the spectrumof this star from 5.5 to 14 μm, revealing a remarkably strongemission feature from 9 to 11 μm that is typical of small (lessthan 2 μm radius) silicate grains. The brightness of the diskpermits spectroscopy at sufficient signal-to-noise ratio (S/N)to study the dust mineralogy. We have now measured the
697
698 REACH ET AL. Vol. 693
Table 1Spitzer Observing log for G29-38
Date AORID Instrument Wavelengths
2004 Nov 26 10119424 IRAC 4.5, 8 μm2005 Nov 26 11124224 IRAC 3.6, 4.5, 5.8, 8 μm2004 Dec 2 10149376 MIPS 24 μm2004 Dec 8 10184192 IRS 5.2–14.2 μm2005 Dec 23 13835264 IRAC 3.6, 4.5, 5.8, 8 μm2006 Jun 30 13828096 IRS 5.2–36 μm
Table 2Mid-infrared Fluxes of G29-39 (mJy)a
2004 Nov 26 2004 Nov 26 2005 Dec 2310:54 10:58 23:23
3.6 μm 8.37 ± 0.01 8.10 ± 0.034.5 μm 8.88 ± 0.02 8.87 ± 0.015.8 μm 8.37 ± 0.02 8.28 ± 0.078.0 μm 8.73 ± 0.03 8.72 ± 0.02
Note. a Uncertainties are statistical uncertainty in the weighted mean of the fluxmeasurements from all frames taken during each observing sequence.
infrared spectrum out to 35 μm, and in this paper we discussdust cloud models and compositions in more detail.
After presenting the new observations, analyzing the variabil-ity, and compiling the spectral energy distribution in Section 2,we model the disk in several different ways. In Section 3, we usea wide mix of minerals and a simple temperature distributionto determine likely constituents of the disk based on spectralfeatures. In Section 4, we present optically thin shell, moder-ately optically thick disk, and optically thick thin disk models.In Section 5, we present constraints based on variability. InSection 6, we tie together the evidence gleaned from comparingthe models to the observations.
2. OBSERVATIONS
Table 1 shows a log of observations with the Spitzer SpaceTelescope (Werner et al. 2004). The Infrared Spectrograph (IRS;Houck et al. 2004) observations were performed in “staring”mode, wherein the source was placed on each of two nodpositions on each of the slits and orders. IRS data were pro-cessed with the S16 pipeline (with backgrounds subtracted bydifferencing nods) and extracted using optimal extraction inthe Spitzer Science Center’s data analysis tool SPICE. The4.5, 8, and 24 μm observations described in Paper I were sup-plemented by archival Infrared Array Camera (IRAC; Fazioet al. 2004) 3.6, 4.5, 5.8, and 8 μm observations. Annu-lar aperture photometry was performed on each IRAC ba-sic calibrated image with a 4 pixel on-source radius and 8–20 pixel background annulus; array-location-dependent,aperture-loss, and pixel-phase photometric corrections were ap-plied; and the uncertainty of each image’s photometry was de-termined by combining uncertainties due to photon statisticsand background removal (see Reach et al. 2005b).
2.1. Variability of the Mid-infrared Flux
The variability of the mid-infrared flux of G29-38 can beconstrained with the IRAC photometry.7 Fluxes are shown inTable 2. The brightness of the star on each basic calibrated
7 We tested the IRS observations for variability, but there was no clearevidence. The IRS observing strategy provided six samples along 60 s rampsin each subslit. The flux varied by less than 4% among the shortest wavelengthspectra, with no wavelength dependence detectable above the noise.
image from each observing sequence was measured, correctedfor the array-location-dependent response, then a weightedmean and statistical uncertainty in weighted mean computed.The absolute calibration uncertainties are not included becausewe are comparing fluxes from the same instrument; IRACphotometry has been shown to be stable to better than 1%(Reach et al. 2005b). To obtain the highest S/N from eachimage for repeatability, we found that an aperture radius of 4pixel was optimal. The S/N was 230, 2008, 90, and 130 at 3.6,4.5, 5.8, and 8 μm, respectively. At 4.5 and 8 μm, the star wasobserved in two independent observations just a few minutesapart, yielding identical mean fluxes; the flux differences are−0.1% ± 0.2% and −0.1% ± 0.3%, respectively. At 3.6 and5.8 μm, the star was observed with different AstronomicalObserving Requests (AORs) separated by 13 months. The starwas fainter in the second epoch by −3.3% ± 0.4% at 3.6 μm(and a statistically insignificant −1.0% ± 0.8% at 5.8 μm).The brightness difference at 3.6 μm is likely due to short-termfluctuations in the star, to which we turn now.
The variability of the mid-infrared flux over shorter timescalescan be assessed from the individual images taken in 2004November. By the design of IRAC (Fazio et al. 2004), the 3.6and 5.8 μm channels observe simultaneously, as do the 4.5 and8 μm channels. The sequence of events was as follows, withtimes given relative to the first image at 2004 November 2610:54:11.8 UT:
00:00 the star is placed in the 4.5 + 8 μm field of view and ashort (1.2 s) frame is taken;
00:03 five consecutive dithers, consisting of a 30 s frame and ashort telescope slew, are performed;
04:34 the telescope is moved to re-center the star in the 4.5 +8 μm field of view and a short (1.2 s) frame is taken;
04:37 19 consecutive dithers, consisting of a 30 s frame and ashort telescope slew, are performed;
18:22 the telescope is moved to center the star in the 3.6 + 5.8 μmfield of view;
18:22 19 consecutive dithers, consisting of a 30 s frame and ashort telescope slew, are performed; then
30:51 the sequence is complete.
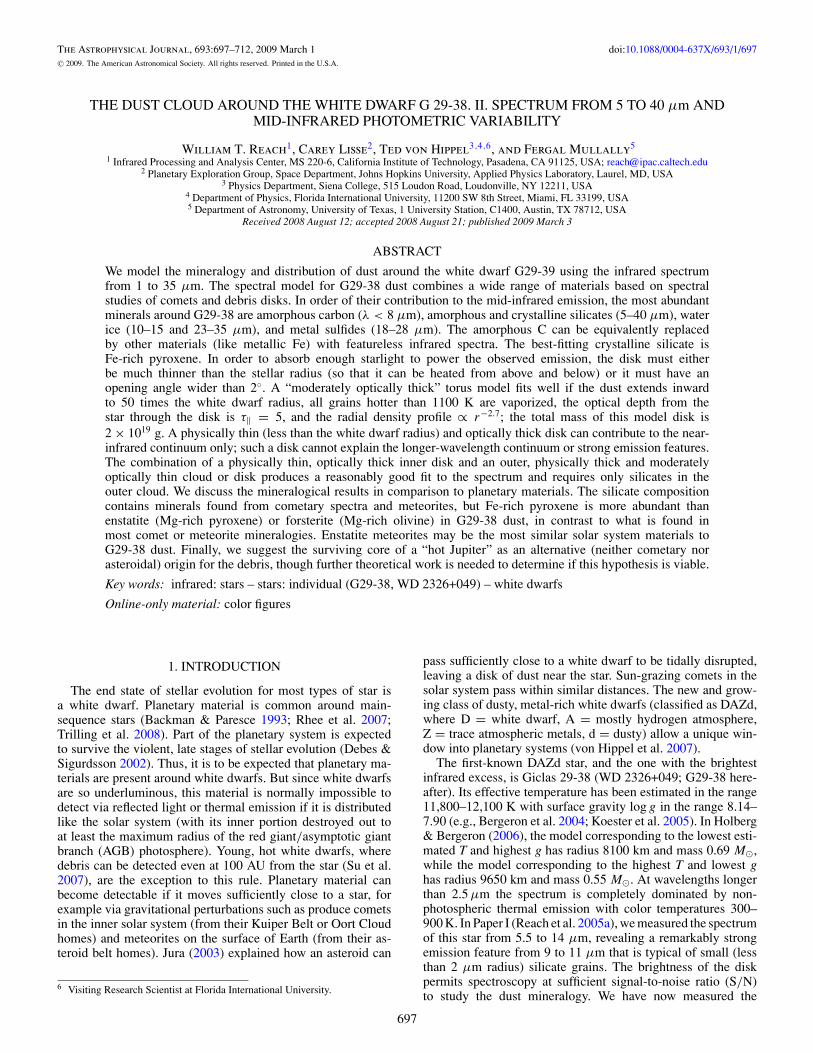
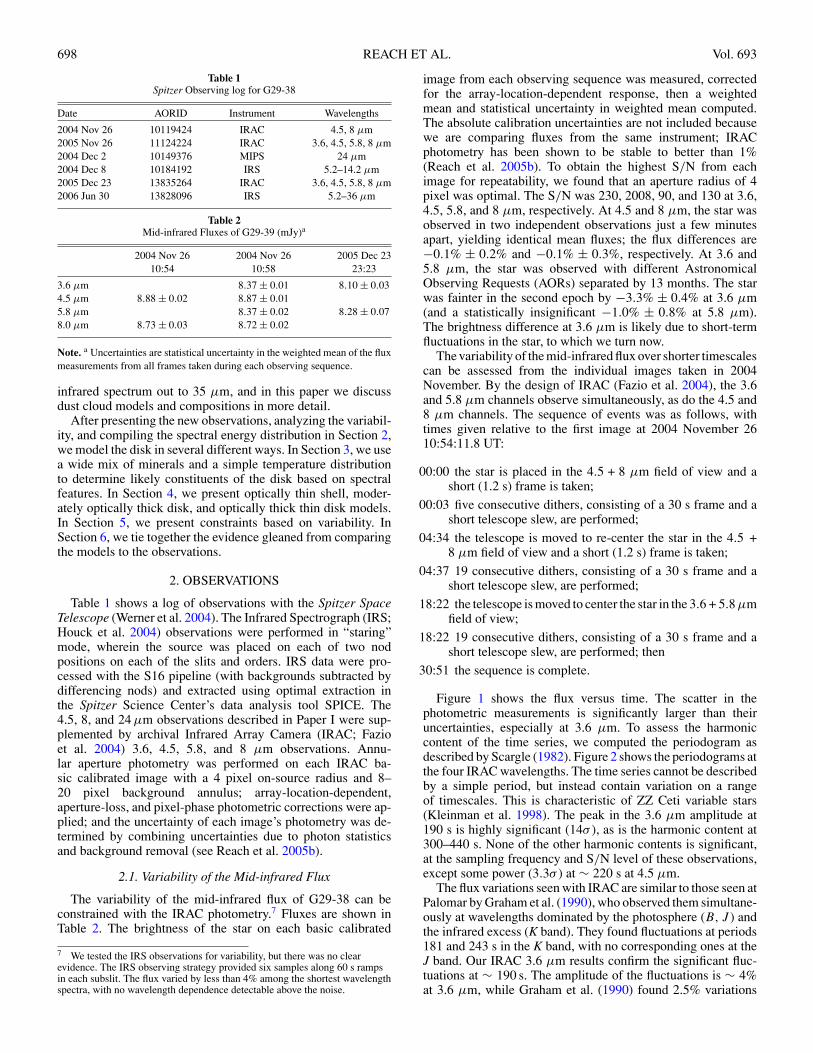
Figure 1 shows the flux versus time. The scatter in thephotometric measurements is significantly larger than theiruncertainties, especially at 3.6 μm. To assess the harmoniccontent of the time series, we computed the periodogram asdescribed by Scargle (1982). Figure 2 shows the periodograms atthe four IRAC wavelengths. The time series cannot be describedby a simple period, but instead contain variation on a rangeof timescales. This is characteristic of ZZ Ceti variable stars(Kleinman et al. 1998). The peak in the 3.6 μm amplitude at190 s is highly significant (14σ ), as is the harmonic content at300–440 s. None of the other harmonic contents is significant,at the sampling frequency and S/N level of these observations,except some power (3.3σ ) at ∼ 220 s at 4.5 μm.
The flux variations seen with IRAC are similar to those seen atPalomar by Graham et al. (1990), who observed them simultane-ously at wavelengths dominated by the photosphere (B, J ) andthe infrared excess (K band). They found fluctuations at periods181 and 243 s in the K band, with no corresponding ones at theJ band. Our IRAC 3.6 μm results confirm the significant fluc-tuations at ∼ 190 s. The amplitude of the fluctuations is ∼ 4%at 3.6 μm, while Graham et al. (1990) found 2.5% variations
No. 1, 2009 THE DUST CLOUD AROUND THE WHITE DWARF G 29-38. II 699
Figure 1. Flux vs. time for each of the IRAC channels (from top to bottom: 3.6, 4.5, 5.8, and 8 μm wavelength). The time begins with the first frame of the entiresequence (which combines two AORs) at 2004 November 26 10:54:11.28 UT. Each point is a flux measurement from a single image, with the statistical uncertaintyof the aperture photometry performed as described by the IRAC calibration procedure (Reach et al. 2005b). Line segments simply connect the data points. The higherror points at 4.5 and 8 μm are the short frames taken just at the beginning of each of the two AORs. All four plots are scaled to show the same dynamic range (from−6% to +8.4%, centered on the median).
Figure 2. Scargle periodograms of the time series from the IRAC 2004 November 26 observations. Each panel has the same scale both horizontally and vertically; the3.6 μm panel is twice as large because the amplitudes are much higher. The periods (2π/ω, where ω is the angular frequency) are displayed on a logarithmic stretch.
700 REACH ET AL. Vol. 693
at 2.2 μm. The stellar photosphere must be subtracted beforeinterpreting these results. At 2.2 (3.6) μm, the photosphere con-tributes 66% (18%) of the total flux. If we assume the infraredphotosphere is constant, and the fluctuations are due to the disk,then the amplitude of disk fluctuations at 2.2 (3.6) μm is 7%(5%), i.e., very similar, with K band possibly slightly higher inamplitude. Fluctuations at 4.5, 5.8, and 8 μm are not detectedin the periodogram, with upper limit ∼ 5%, 5%, and 3% ofthe total flux, or 5%, 5%, and 3% of the infrared excess abovephotosphere (2σ limits). The upper limit at 8 μm, and the trendsuch that fluctuations are most significant at 2.2 and 3.6 μmwith a rapid decrease in amplitude at longer wavelengths, aresignificant and indicate that the fluctuations are due to an emit-ting region with a relatively high (greater than 1000 K) colortemperature.
2.2. Compilation of the Spectral Energy Distribution
In order to model the mineralogy and dust distribution aroundG29-38, we need to combine the observed data from the near-infrared through mid-infrared, correcting for calibration errorsas well as source variability. This is in fact not possible, sincethe temporal sampling of the photometry is inadequate, andthe observations are not contemporaneous. We therefore mustassemble the various portions of the spectrum in such a way asto make them most plausibly “connected.” In principle, thereis a scale factor for each wavelength range that depends onthe epoch. The amplitude of the scale factor, due to sourcevariability, may reach up to ∼ 10% in the near-infrared andshould be less than 5% at longer wavelengths. Calibrationuncertainties range from ∼ 3% in the optical to 5% for IRACand MIPS to 10% for IRS. The range of plausible scale factorsis then 5%–10% across all wavelengths.
We first ensured that the spectroscopy and photometry werein accord. The IRAC fluxes must be corrected for the spectralshape of the source first. For the IRAC 8 μm channel, whichis fully covered by the IRS spectrum, we integrated the IRSspectrum appropriately (Reach et al. 2005b) over the passbandto calculate the color correction K = 1.16 (where the correctedflux is the “observed” flux from the IRAC calibration dividedby K) and applied this correction to the photometry. The IRAC8 μm flux density can then be compared directly to the IRSspectrum: the flux at the nominal wavelength 7.872 μm is7.19 mJy from IRAC and 7.30 mJy from IRS, a deviation ofonly 1.5%, well within the calibration error budget. The IRAC3.6, 4.5, and 5.8 μm flux density required only very small colorcorrections: the spectrum has a color temperature ∼ 1100 K atthese wavelengths, for which the corrections are 0.995, 0.996,and 0.996, respectively. The absolute fluxes from IRAC and IRSat 5.831 μm are 7.76 and 7.54 mJy, showing that the instrumentcross-calibration is good. The observed MIPS 24 μm flux wasdivided by a color correction of 0.97 to account for the widespectral response of the filter and detector. For IRAC and IRS,we therefore find that there is no need for a relative rescaling;that is, the measured flux densities averaged over their exposuretimes at their epoch of observation agree well, whether due toaveraging of or lack of variability.
To remove the white dwarf photosphere from the spectra,we use a model atmosphere for T = 12,000 K and log g =8 covering 0.35–60 μm (courtesy D. Koester 2005, privatecommunication), normalized using Two Micron All Sky Survey(2MASS) photometry (J = 13.132 ± 0.029, H = 13.075 ±0.022, Ks = 12.689 ± 0.029) and optical spectrophotometryfrom Palomar (Greenstein & Liebert 1990). In fact, the optical
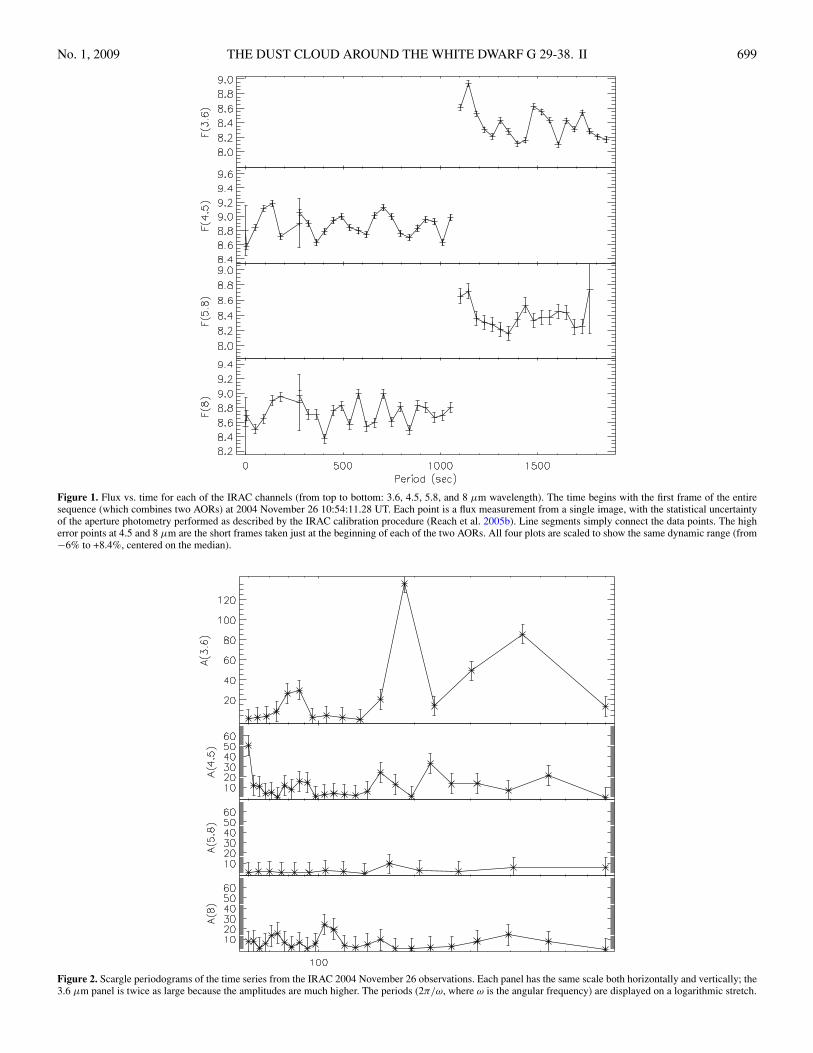
Figure 3. Combined spectra and photometry (using 2MASS, IRTF, IRAC,MIPS, and IRS) of G29-38 with stellar photosphere removed.
and 2MASS photometry cannot both agree with the modelspectrum. If we normalize the white dwarf model at the 2MASSJ band, then the model would underpredict the visible flux by8%. The near-infrared spectrum obtained by Kilic et al. (2006)with the Infrared Telescope Facility (IRTF) also disagrees withthe 2MASS photometry; if we normalize the white dwarf modelby the 2MASS J-band flux, then we underpredict the IRTFspectrum by 18%. The low flux observed by 2MASS is likelydue to the variability of the white dwarf. The shape of the IRTFspectrum follows the model closely at wavelengths shorter than1.6 μm; the infrared excess is evident at wavelengths beyond1.7 μm. To obtain a joined spectral energy distribution weproceed as follows: (1) normalize the white dwarf model tomatch the optical photometry; (2) scale the 2MASS photometryby a factor of 1.087 to match the model at J band; (3) rescalethe IRTF spectrum by 0.92 to match the white dwarf modelat 0.8–1.3 μm; and (4) rescale the 2MASS photometry andIRTF spectra by a factor of 1.2 so that the red end of the IRTFspectrum (2.4 μm) is plausibly consistent with the IRAC 3.6 μmphotometry. Plausible consistency here was defined as allowinga blackbody to pass through the IRAC 3.6 μm and 2MASSKs photometry for color temperatures 800–1200 K to withinthe error bars, and keeping the IRTF and 2MASS photometryconsistent at 2.17 μm. The uncertainties were taken to be a root-sum-square combination of the measurement uncertainties and10% of the brightness of the photosphere, to account for scalinguncertainties in the photospheric subtraction.
Figure 3 shows the combined spectrum of the infraredemission after subtracting the stellar photospheric emission. Thecombined scalings yield near-infrared photometry and spectrumeffectively at the same epoch (in terms of variability) as the mid-infrared photometry.
3. MINERALOGY
The composition of the dust around G29-38 was determinedby comparing the spectra to those of a set of constituentmaterials, using a fitting method that has been used for cometHale–Bopp, the Deep Impact ejecta from comet 9P/Tempel 1,and the dust around the stars HD 100546, HD 69380, andHD 113766 (Lisse et al. 2006, 2007a, 2007b, 2008). Detailsof this model are given in Lisse et al. (2008). In this section,we model the emitting region as an optically thin dust torus. Weapply this simple model to G29-38 to allow direct comparison
No. 1, 2009 THE DUST CLOUD AROUND THE WHITE DWARF G 29-38. II 701
to dust in other astronomical systems, but we will revisit themineralogy below when testing more sophisticated models.
3.1. Particle Sizes and Temperatures
A toroidal model is motivated by the single temperaturedistributions found for many of the stars studied by Beichmanet al. (2006) and Chen et al. (2006) as well as the narrow duststructures found in many of the Hubble Space Telescope imagesof debris disks (Kalas et al. 2005, 2006). The best-fit temperatureof the smallest dust particles (0.1–1 μm), which superheatsubstantially above Local Thermal Equilibrium (LTE), is Tmax =890 K for the olivines, 850–890 K for the pyroxenes, and930 K for the amorphous carbon. The largest particles in ourcalculation, with radius 1000 μm, are set to TLTE = 600 K, anddust of intermediate size is scaled between the two extremes(Lisse et al. 2006). Using the Tempel 1 ejecta temperatures asa guide (where we found olivines at 340 K and amorphouscarbon at 390 K at 1.51 AU from the Sun, where TLTE =230 K), and allowing for an G29-38 stellar luminosity that is2×10−3 L�, we estimate a location for the hot dust ∼ 150 stellarradii from the white dwarf. The location of colder dust, capableof supporting a stable water ice component at 200 K, is at > 103
stellar radii (> 8 × 1011 cm). While differing by at least a factorof 9, this range of distances is still small, suggesting materialin tight orbit around the WD. The best-fit single continuumtemperature to the 7–35 μm Spitzer spectrum is 950 K, closeto the amorphous carbon temperature. As seen in the Tempel 1ejecta from the Deep Impact experiment (Lisse et al. 2006),the amorphous carbon dominates the continuum behavior asit has a featureless emissivity and is the hottest material, thuscontributing most to the short-wavelength emission.
The best-fit size distribution dn/da ∝ a−3.7±0.2 argues fordust surface area dominated by small particles, but dust massdominated by large particles. A system in collisional equilibriumwould demonstrate a PSD ∝ a−3.5 (Dohnanyi 1969; Durda& Dermott 1997); for “real” systems a size distribution evensteeper than a−3.5 at small sizes is expected in a collisionalcascade because of the dependence of particle strength on size(O’Brien & Greenberg 2003).
The total dust mass required to explain the Spitzer IRSspectrum (i.e., mass in particles of 0.1–10 μm in size thatcontribute appreciably to the χ2
ν value of the fit to the infraredspectrum) is ∼ 2 × 10¹⁹ g. Extrapolating (using the best-fit sizedistribution) from a maximum size of 10 μm to 1 cm wouldincrease the mass by a factor of 8. A total cloud mass oforder 1019 g compressed into a solid sphere of average density2.5 g cm−3 (i.e., rocky silicate material) would have a radius of10 km, equivalent to a single, small asteroid or large comet. Thesurface area of detected particles is 5 × 1022 cm2. If this dust isin an annulus of inner radius 7 × 1010 cm (90R∗) extending totwice that radius, then the areal filling factor of grains viewedfrom above the disk is of order unity. The optically thin model isthus unlikely to apply, although most of the observed emission(in particular the spectral features) must arise from the opticallythin parts of the disk. We address the optical depth effects in themodeling sections, but we proceed first (with caution) to discussthe mineralogy from the optically thin fits.
3.2. Dust Composition
Over 80 different species were tested for their presence inthe spectra. The material spectra were selected by their reportedpresence in meteorites, in situ comet measurements, YSOs, and
debris disks (Lisse et al. 2006). Consultations with membersof the Stardust team and examination of the interplanetary dustparticle (see review by Bradley 2002) and the astrominerologi-cal literature (see review by Molster & Waters 2003) pointed tothe most likely mineralogical candidates to be found in thedust. Materials with emissions matching the strong featuresin the Spitzer emissivity spectra were also tested. The list ofmaterials tested against the Spitzer spectra included multiplesilicates in the olivine and pyroxene class (forsterite, fayalite,clino- and orth-enstatite, augite, anorthite, bronzite, diopside,and ferrosilite); phyllosilicates (saponite, serpentine, smectite,montmorillonite, and chlorite); sulfates (gypsum, ferrosulfate,and magnesium sulfate); oxides (various aluminas, spinels, hi-bonite, magnetite, and hematite); Mg/Fe sulfides (pyrrohtite,troilite, pyrite, and niningerite); carbonate minerals (calcite,aragonite, dolomite, magnesite, and siderite); water ice, cleanand with carbon dioxide, carbon monoxide, methane, and am-monia clathrates; carbon dioxide ice; graphitic and amorphouscarbon; and polycyclic aromatic hydrocarbons (PAH). Of thesematerials, a small, unique subset was found necessary to prop-erly fit the Spitzer data. Sources for the data included: for sili-cates, the Jena Database of Optical Constants for Cosmic Dust8
(Dorschner et al. 1995; Jager et al. 1998, 2003), the Mars GlobalSurveyor Thermal Emission Spectrometer database9, andW. Glaccum (2007, private communication), as well as emis-sion spectra from Koike et al. (2003) and Chihara et al. (2002);for carbonates, Kemper et al. (2002); for sulfides, Keller et al.(2002) and Kimura et al. (2005); for amorphous carbon, Edoh(1983); for PAH, Li & Draine (2001).
We determined the reduced χ2 for the model fit to the data forthousands of combinations of minerals. All models with reducedχ2 values large than the 95% confidence limit were excludedfrom consideration. The range of constituent abundances wasdetermined by varying the amount of a material and findingwhere the model exceeded the 95% confidence limit. Onlyconstituents with abundances significantly above zero wereincluded in the final best fit. Table 3 shows the compositionof the best-fit model. For each entry, we also show the reducedχ2 for the model if that constituent is deleted. Upper limits fornondetected species are included in Table 3 based on the 95%confidence level amplitude of the constituent when it is includedin the fit.
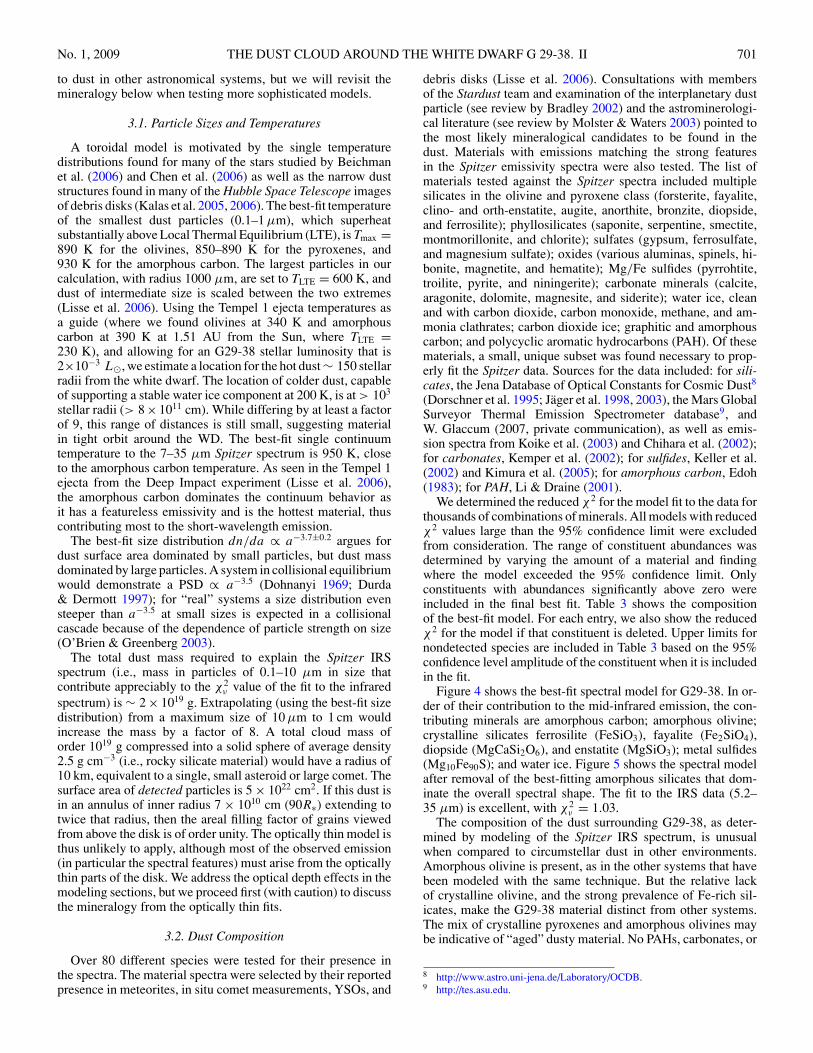
Figure 4 shows the best-fit spectral model for G29-38. In or-der of their contribution to the mid-infrared emission, the con-tributing minerals are amorphous carbon; amorphous olivine;crystalline silicates ferrosilite (FeSiO3), fayalite (Fe2SiO4),diopside (MgCaSi2O6), and enstatite (MgSiO3); metal sulfides(Mg10Fe90S); and water ice. Figure 5 shows the spectral modelafter removal of the best-fitting amorphous silicates that dom-inate the overall spectral shape. The fit to the IRS data (5.2–35 μm) is excellent, with χ2
ν = 1.03.The composition of the dust surrounding G29-38, as deter-
mined by modeling of the Spitzer IRS spectrum, is unusualwhen compared to circumstellar dust in other environments.Amorphous olivine is present, as in the other systems that havebeen modeled with the same technique. But the relative lackof crystalline olivine, and the strong prevalence of Fe-rich sil-icates, make the G29-38 material distinct from other systems.The mix of crystalline pyroxenes and amorphous olivines maybe indicative of “aged” dusty material. No PAHs, carbonates, or
8 http://www.astro.uni-jena.de/Laboratory/OCDB.9 http://tes.asu.edu.
702 REACH ET AL. Vol. 693
Figure 4. Emissivity spectrum of the dust around G29-38. The observed spectrum has been divided by a 930 K blackbody and fitted with a linear combination of12 minerals. The shape of each mineral’s emissivity, normalized by its fitted amplitude to the G29-38 emissivity, is shown separately by a colored line (offset verticallyfor clarity): red = amorphous carbon, bright green = carbonates (zero amplitude), yellow = PAH (zero amplitude), light orange = water vapor (zero amplitude), deeporange = water ice, olive green = sulfides, represented here by niningerite, blue = phyllosilicates (zero amplitude), light blue = crystalline pyroxenes (ferrosilite,diopside, and orthoenstatite, in order of 20 μm amplitude), purple = amorphous olivine, and dark blue = crystalline olivines (forsterite and fayalite, in order of 20 μmamplitude).
(A color version of this figure is available in the online journal.)
Table 3Composition of the Best-Fit Modela to the Spitzer/IRS G29-38 Spectrum
Species Weightedb Density Mol. Wt. Nmolesc Td
max χ2 ifSurface Area (g cm−3) (Relative) (K) Excluded
Detections
Amorph Olivine (MgFeSiO4) 0.33 3.6 172 0.69 890 90.6Fayalite (Fe2SiO4) 0.08 4.3 204 0.17 890 2.91FerroSilite (Fe2Si2O6) 0.11 4.0 264 0.17 890 9.85Diopside (CaMgSi2O6) 0.05 3.3 216 0.076 890 2.05OrthoEnstatite (Mg2Si2O6) 0.04 3.2 200 0.064 890 1.98Niningerite (Mg10Fe90S)e 0.10 4.5 84 0.53 890 1.49Amorph Carbon (C) 0.28 2.5 12 5.83 930 >100Water Ice (H2O) 0.29 1.0 18 1.61 220 5.82
Upper Limits and Nondetections
Forsterite[Koike](Mg2SiO4) 0.02 3.2 140 0.046 890 1.15Amorph Pyroxene (MgFeSi2O6) 0.00 3.5 232 0.09 890 1.04Smectite/Notronitef 0.00 2.3 496 0.03 890 1.04Water Gas (H2O) 0.01 1.0 18 � 0.00 220 1.04Magnesite (MgCO3) 0.00 3.1 84 � 0.00 890 1.04Siderite (FeCO3) 0.00 3.9 116 � 0.00 890 1.04PAH (C10H14) 0.00 1.0 (178) � 0.011 N/A 1.04
Notes.a Best-fit model χ2
ν = 1.04 with power-law particle size distribution dn/da ∝ a−3.7, 5–35 μm range of fit, 336degrees of freedom (dof).b Weight of the emissivity spectrum of each dust species required to match the G29-38 emissivity spectrum.c Nmoles(i) is the Density/Molecular Weight × Normalized Surface Area for mineral i. Errors are ±15% (1σ ).d All temperatures are ±20 K (1σ ).e We use the name niningerite to refer to MgxFe1−xS. A niningerite composition of Mg25Fe75S may fit the databetter.f Na0.33Fe2(Si,Al)4O10(OH)2 · 3H2O.
No. 1, 2009 THE DUST CLOUD AROUND THE WHITE DWARF G 29-38. II 703
Wavelength (μm)
Re
sid
ua
l em
issi
vit
y (O
bs/
Bν-
silic
ate
-ca
rbo
n)
5 10 3015 20 25
0.0
0.1
0.2
0.3
0.4
35
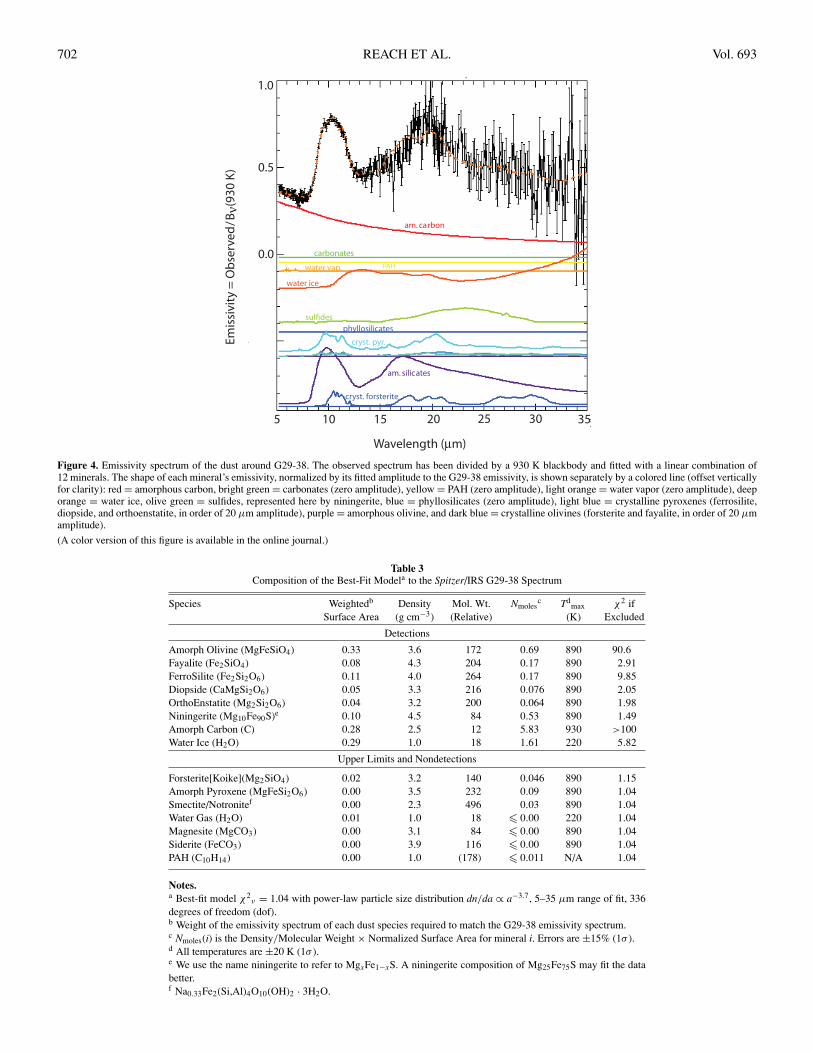
Figure 5. Emissivity spectrum as in Figure 4, but after the removal of thebest-fitting silicates and carbon. The residuals are well fitted by a combinationof water ice (deep orange, dashed and solid are two temperatures) and metalsulfides (olive green). The water ice is at temperature 200 K, and cannot be inthe same location as the 930 K dust. Whereas the dust is ∼ 1011 cm from thestar, the water ice must be further, ∼ 1013 cm, at the outer edge of an extendeddisk.
(A color version of this figure is available in the online journal.)
water gas are seen, reflecting a total lack of primitive nebularmaterial. Some metal sulfides appear to be present, suggestingtemperatures as low as ∼ 600 K in the observed dust; 600–700 Kis the temperature range for vaporization/condensation of fer-rosulfides. Given that the best-fit continuum temperature for thespectrum is 930 K (dominated by the short-wavelength emissionfrom 0.1 to 1.0 μm amorphous carbon particles), either the car-bon is superheated beyond the temperature of the metal sulfides,which may be present in larger, cooler particles, or there is adistribution of dust locations and effective temperatures, i.e., adisk-like structure.
3.3. Water Ice
The detection of water ice emission in the spectrum iscurious. In a vacuum, water ice sublimates at temperatures above∼ 200 K. Thus, water ice cannot be in direct physical contactwith the rest of the hot dust detected in the infrared spectrum.Either the dust must be continuously created, or it must reside ina physical location removed from the rest of the dust reservoir.Since no water vapor is detected at 6 μm, where there arestrong features that should be detected if water were present insignificant quantities (Lisse et al. 2006; Woodward et al. 2007),no appreciable ongoing sublimation can be occurring. Watervapor is ionized within ∼ 103 s, if we scale from the lifetimeof water at 1 AU from the Sun (∼ 106 s; Schleicher & A’Hearn1988) according to the luminosity of G29-38 (2 × 10⁻³ L�).There would still be a steady-state amount of water vapor presentif the ice is sublimating. Thus, it appears that the water ice is ata large remove from the rest of the warm circumstellar dust, andthe water ice is found in the IRS beam (i.e., within 5 × 1014 cm(7 × 10⁵R∗) of the star).
In Paper I, we showed that a range of temperatures is requiredto match the photometry out to 24 μm, with a two-temperaturefit having 890 and 290 K color temperatures. Thus, we already
suspected either a continuous range of dust temperatures orthe presence of two dust reservoirs, one hot and one cold. ForG29-38, the ice (or ice-coated grains) must be located at greaterthan 1012 cm (2000R∗) from the star, which, while farther thanthe dust that dominates the mid-infrared spectrum, is still veryclose to the star. Cold, icy dust around other stars, at locationscomparable to the solar system’s Kuiper Belt, is common, beingpresent around 15%–20% of all stars (Bryden et al. 2006). Theice detected around G29-38 is closer to the star than the far-infrared debris disks at ∼100 AU (1015 cm) radius commonlyseen around main-sequence stars (Bryden et al. 2006), andthe present location of the icy grains would have been withinthe star when G29-38 was in its red giant or AGB stage. Thesource of this cold, presumably icy, material is likely to bethe same parent bodies that create the dust closer to the star.We will return to the possible parent body natures in theDiscussion section, but we should point out now that thepresence of H2O is well established in asteroids (especially outerbelt), meteorites (as water of hydration as well as signatures ofaqueously altered mineralogy), comets, and planets. The H2Oin any of these bodies would freeze if it were liberated bydisintegration of these bodies and survive out to greater than1012 cm from the white dwarf, owing to its small luminosity.
4. DISTRIBUTION OF MATERIAL AROUND THE STAR
Two possible disk models are considered; these are illustratedin Figure 6 and discussed in turn in the following sections. Themodels will be fitted to a combination of Spitzer spectroscopyand photometry, 2MASS photometry, and the near-infraredspectrum, after the removal of the photosphere model andscaling to a common epoch (Section 2.2).
4.1. Physically Thick Disk
If the optical depth through the dust cloud around G29-38is optically thin at the wavelengths of the observed emission,then the spectrum is determined by simply integrating thedensity distribution, weighted by the Planck function at thelocal temperature, through the cloud. If the cloud is opticallythin at visible wavelengths, where the spectrum of the whitedwarf peaks, then the dust heating is simply determined by theintegrated absorption of the star’s distance-diluted spectrum byeach grain. We can place some constraints on whether such amodel can apply. First, the cloud can only emit as much energyas it absorbs from the star. Let us consider a flattened torus,defined in spherical coordinates r, θ (with r the distance fromthe star and θ the angular separation from the equatorial plane)as having nonzero density for R1 < r < R2 and θ < θ 1
2.
Since the dust luminosity is f = 3% of the star luminosity,the opening half-angle of the torus must be at least θ 1
2> f/2
radians, i.e., θ 12
> 0.◦8. A thinner torus simply cannot interceptenough starlight to emit the observed luminosity. The constraintdoes not apply to a disk thinner than the radius of the star, norto a warped disk, as discussed in the following sections.
Of critical importance to the radiative transfer for calculatingthe emergent spectrum from the disk is its optical depth inthe infrared. For a torus with radial mass density profileρ = ρ1(r/R1)−α , the total cloud mass
M = 4πθ 12ρ1R
31fα, (1)
where
fα = (R2/R1)3−α − 1
3 − α(for α = 3) (2)
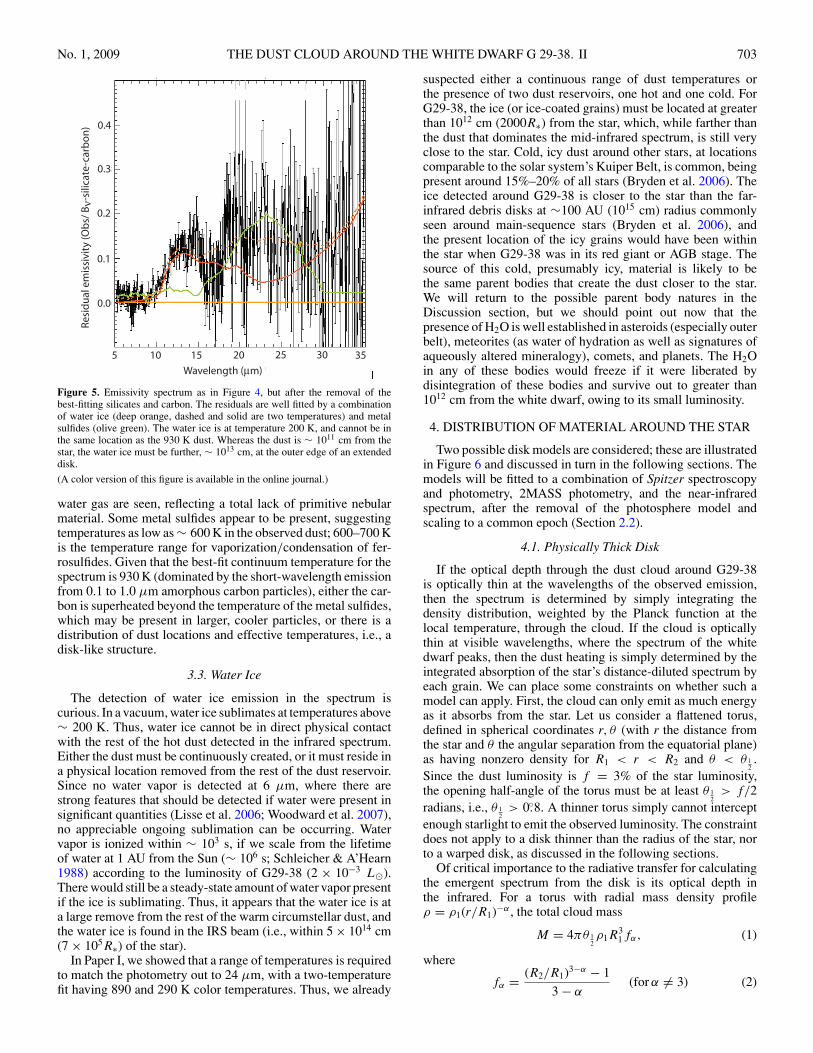
704 REACH ET AL. Vol. 693
Figure 6. Cartoons illustrating possible geometries for the G29-38 disk. The physically thin plus warp model (top) is based on Jura’s (2007) model for the similarwhite dwarf GD 362. The physically thick (bottom) is based on Reach et al. (2005a) and elaborated in Section 4. Distances from the star are labeled, in units of stellarradii. The distances from the star for grain vaporization (gray body grains at 1200 K) and tidal disruption (Roche limit for a solid body to be tidally disrupted by thewhite dwarf with radius 7.5 × 108 cm and mass 0.69 M�) are indicated.
= ln(R2/R1) (for α = 3). (3)
The vertical optical depth at the inner radius is
τ⊥1 = 3QIRM
16πρdaR21fα
, (4)
where a is the particle radius and QIR is the absorption efficiencyaveraged over the thermal emission spectrum. Using the cloudmass radius from Paper I (R1 = 1 R�) and scaling the mass inunits of 1018 g, τ⊥1 = 0.03M18QIR(a/μm)−1. For particlessmaller than the wavelength, the absorption efficiency canbe approximated as QIR � 2πa/λ, so the optical depth forthermal emission at wavelength λ is τ⊥1,λ = 0.2M18(λ/μm)−1,independent of particle size. For thermal emission at 10 μm, onecan neglect radiative transfer out of the disk only if M < 5×10¹⁹
g.Dust heating is determined by the propagation of starlight
through the disk. The optical depth from the disk inner boundaryto a distance twice as far from the star is
τ‖1 = τ⊥1Qopt
θ 12QIR
1 − 2−α
α − 1. (5)
For particles larger than 0.1 μm, QV � 1 for absorption ofstarlight, and the optical depth from the star to the disk interioris τ‖1 = 2.5M18(θ 1
2/0.◦8)−1a−1
μm(R1/R�)−2. Using the mass andradius from Paper I, we find the cloud is optically thin forstarlight propagation (and for thermal emission) as long asθ 1
2aμm > 2◦M18. The presence of the silicate emission feature
further requires particle size less than 2 μm, so for a disk that isoptically thin to propagation to starlight, we require M18 < θ 1
2.
The cloud must be at least as massive as derived in Paper I (wherelight was allowed to propagate through the disk unimpeded),so we finally obtain the constraint 1 < M18 < θ 1
2for an
optically thin disk. If the disk is more massive than the upperlimit, it becomes optically thick to propagation of starlight, thetemperature decreases more rapidly with distance from the star,and the cloud is more dominated by its inner edge. We will referto this case as moderately optically thick, with 0.5 < τ‖ < 10 sothe cloud is optically thin to vertical propagation of the observedinfrared emission but optically thick to radial propagation ofstarlight (Section 4.1.2).
It appears therefore that a model cloud that is “physicallythick” (i.e., thicker than the white dwarf’s diameter) can still
be quite flattened, with angular widths as small as 1◦, beforebecoming optically thick. The distinction between the “physi-cally thick” model (Reach et al. 2005a) and the “physically thin”model (Jura 2007) is that the physically thin model is thinnerthan the stellar diameter, so that it can be illuminated on its up-per and lower surfaces. In order to intercept as much energy asis observed (3% of the white dwarf’s luminosity), a physicallythick model at its inner edge must have a half-width at least109 cm, which is larger than the stellar radius (� 8 × 108 cm).Starlight does not illuminate the surface of the physically thickmodel, and instead the dust is heated by stellar photons thatmust propagate through the disk.
4.1.1. Spherical Shell Model
The simplest geometry for the cloud around G29-38, and alimiting case for the physically thick model, is a spherical shell.A moderately optically thick spherical shell will have the sametemperature distribution as a disk with the same radial densityvariation. We use the spherical shell calculations to measure theradial temperature profile relative to the optically thin case.
Spherical shell calculations were performed using DUSTY10
for a radial profile r−3, an amorphous carbon or silicatecomposition, and a range of total optical depths, τ (at 0.55 μm),from 0.01 to 10. The inner boundary of the shell is where thedust temperature reaches 1100 K (fits with inner temperatures1000 and 1300 K yielded significantly worse fits to the observedspectrum). Figure 7 shows emergent spectra compared tothe observations. The first are visually very good, clearlyreproducing the spectral shape, despite the simplicity of themodel; however, the reduced χ2
ν = 2.2 is statistically poor. Theresiduals are dominated by structure near the 9–11 μm silicatefeature: the observed minus model residuals have positive peaksat 9.2 and 11.2 μm and a broad negative trough spanning 8–13 μm. The deficiencies of this model are thus due to usingonly one silicate, in contrast to the more detailed mineralogyfound in the multi-composition models discussed above.
The luminosity of the shell per unit stellar luminosity isaccurately approximated by
Ld
L∗≡ f � f0(1 − e−τ ), (6)
10 Ivezic et al. (1999), User Manual for DUSTY, University of KentuckyInternal Report, accessible at http://www.pa.uky.edu/∼moshe/dusty.
No. 1, 2009 THE DUST CLOUD AROUND THE WHITE DWARF G 29-38. II 705
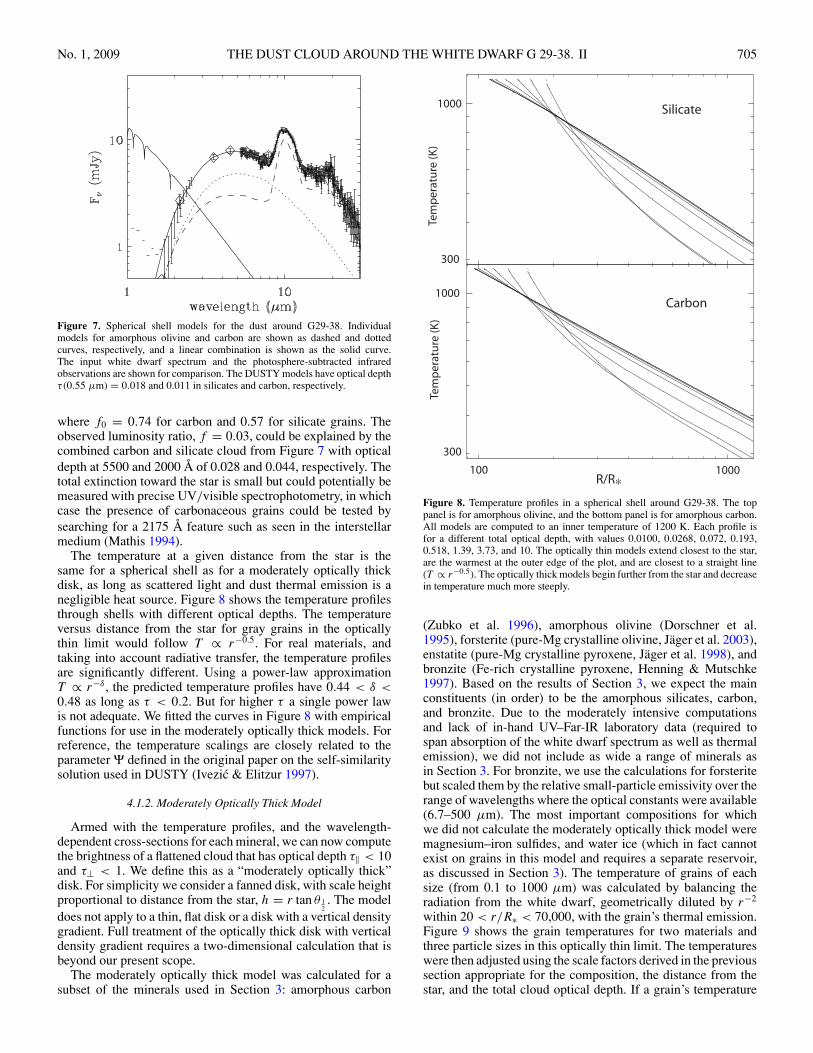
Figure 7. Spherical shell models for the dust around G29-38. Individualmodels for amorphous olivine and carbon are shown as dashed and dottedcurves, respectively, and a linear combination is shown as the solid curve.The input white dwarf spectrum and the photosphere-subtracted infraredobservations are shown for comparison. The DUSTY models have optical depthτ (0.55 μm) = 0.018 and 0.011 in silicates and carbon, respectively.
where f0 = 0.74 for carbon and 0.57 for silicate grains. Theobserved luminosity ratio, f = 0.03, could be explained by thecombined carbon and silicate cloud from Figure 7 with opticaldepth at 5500 and 2000 Å of 0.028 and 0.044, respectively. Thetotal extinction toward the star is small but could potentially bemeasured with precise UV/visible spectrophotometry, in whichcase the presence of carbonaceous grains could be tested bysearching for a 2175 Å feature such as seen in the interstellarmedium (Mathis 1994).
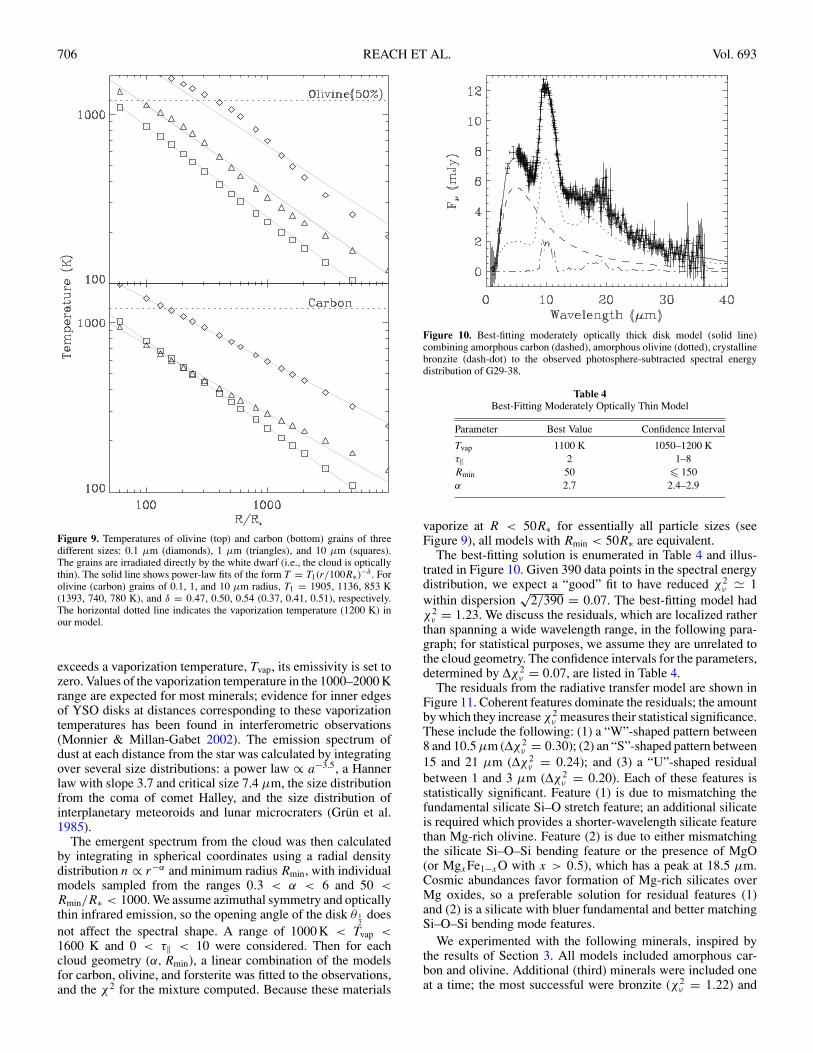
The temperature at a given distance from the star is thesame for a spherical shell as for a moderately optically thickdisk, as long as scattered light and dust thermal emission is anegligible heat source. Figure 8 shows the temperature profilesthrough shells with different optical depths. The temperatureversus distance from the star for gray grains in the opticallythin limit would follow T ∝ r−0.5. For real materials, andtaking into account radiative transfer, the temperature profilesare significantly different. Using a power-law approximationT ∝ r−δ , the predicted temperature profiles have 0.44 < δ <0.48 as long as τ < 0.2. But for higher τ a single power lawis not adequate. We fitted the curves in Figure 8 with empiricalfunctions for use in the moderately optically thick models. Forreference, the temperature scalings are closely related to theparameter Ψ defined in the original paper on the self-similaritysolution used in DUSTY (Ivezic & Elitzur 1997).
4.1.2. Moderately Optically Thick Model
Armed with the temperature profiles, and the wavelength-dependent cross-sections for each mineral, we can now computethe brightness of a flattened cloud that has optical depth τ‖ < 10and τ⊥ < 1. We define this as a “moderately optically thick”disk. For simplicity we consider a fanned disk, with scale heightproportional to distance from the star, h = r tan θ 1
2. The model
does not apply to a thin, flat disk or a disk with a vertical densitygradient. Full treatment of the optically thick disk with verticaldensity gradient requires a two-dimensional calculation that isbeyond our present scope.
The moderately optically thick model was calculated for asubset of the minerals used in Section 3: amorphous carbon
1000
1000
300
300
Tem
pe
ratu
re (
K)
Tem
pe
ratu
re (
K)
R/R∗1000100
Silicate
Carbon
Figure 8. Temperature profiles in a spherical shell around G29-38. The toppanel is for amorphous olivine, and the bottom panel is for amorphous carbon.All models are computed to an inner temperature of 1200 K. Each profile isfor a different total optical depth, with values 0.0100, 0.0268, 0.072, 0.193,0.518, 1.39, 3.73, and 10. The optically thin models extend closest to the star,are the warmest at the outer edge of the plot, and are closest to a straight line(T ∝ r−0.5). The optically thick models begin further from the star and decreasein temperature much more steeply.
(Zubko et al. 1996), amorphous olivine (Dorschner et al.1995), forsterite (pure-Mg crystalline olivine, Jager et al. 2003),enstatite (pure-Mg crystalline pyroxene, Jager et al. 1998), andbronzite (Fe-rich crystalline pyroxene, Henning & Mutschke1997). Based on the results of Section 3, we expect the mainconstituents (in order) to be the amorphous silicates, carbon,and bronzite. Due to the moderately intensive computationsand lack of in-hand UV–Far-IR laboratory data (required tospan absorption of the white dwarf spectrum as well as thermalemission), we did not include as wide a range of minerals asin Section 3. For bronzite, we use the calculations for forsteritebut scaled them by the relative small-particle emissivity over therange of wavelengths where the optical constants were available(6.7–500 μm). The most important compositions for whichwe did not calculate the moderately optically thick model weremagnesium–iron sulfides, and water ice (which in fact cannotexist on grains in this model and requires a separate reservoir,as discussed in Section 3). The temperature of grains of eachsize (from 0.1 to 1000 μm) was calculated by balancing theradiation from the white dwarf, geometrically diluted by r−2
within 20 < r/R∗ < 70,000, with the grain’s thermal emission.Figure 9 shows the grain temperatures for two materials andthree particle sizes in this optically thin limit. The temperatureswere then adjusted using the scale factors derived in the previoussection appropriate for the composition, the distance from thestar, and the total cloud optical depth. If a grain’s temperature
706 REACH ET AL. Vol. 693
Figure 9. Temperatures of olivine (top) and carbon (bottom) grains of threedifferent sizes: 0.1 μm (diamonds), 1 μm (triangles), and 10 μm (squares).The grains are irradiated directly by the white dwarf (i.e., the cloud is opticallythin). The solid line shows power-law fits of the form T = T1(r/100R∗)−δ . Forolivine (carbon) grains of 0.1, 1, and 10 μm radius, T1 = 1905, 1136, 853 K(1393, 740, 780 K), and δ = 0.47, 0.50, 0.54 (0.37, 0.41, 0.51), respectively.The horizontal dotted line indicates the vaporization temperature (1200 K) inour model.
exceeds a vaporization temperature, Tvap, its emissivity is set tozero. Values of the vaporization temperature in the 1000–2000 Krange are expected for most minerals; evidence for inner edgesof YSO disks at distances corresponding to these vaporizationtemperatures has been found in interferometric observations(Monnier & Millan-Gabet 2002). The emission spectrum ofdust at each distance from the star was calculated by integratingover several size distributions: a power law ∝ a−3.5, a Hannerlaw with slope 3.7 and critical size 7.4 μm, the size distributionfrom the coma of comet Halley, and the size distribution ofinterplanetary meteoroids and lunar microcraters (Grun et al.1985).
The emergent spectrum from the cloud was then calculatedby integrating in spherical coordinates using a radial densitydistribution n ∝ r−α and minimum radius Rmin, with individualmodels sampled from the ranges 0.3 < α < 6 and 50 <Rmin/R∗ < 1000. We assume azimuthal symmetry and opticallythin infrared emission, so the opening angle of the disk θ 1
2does
not affect the spectral shape. A range of 1000 K < Tvap <1600 K and 0 < τ‖ < 10 were considered. Then for eachcloud geometry (α,Rmin), a linear combination of the modelsfor carbon, olivine, and forsterite was fitted to the observations,and the χ2 for the mixture computed. Because these materials
Figure 10. Best-fitting moderately optically thick disk model (solid line)combining amorphous carbon (dashed), amorphous olivine (dotted), crystallinebronzite (dash-dot) to the observed photosphere-subtracted spectral energydistribution of G29-38.
Table 4Best-Fitting Moderately Optically Thin Model
Parameter Best Value Confidence Interval
Tvap 1100 K 1050–1200 Kτ‖ 2 1–8Rmin 50 � 150α 2.7 2.4–2.9
vaporize at R < 50R∗ for essentially all particle sizes (seeFigure 9), all models with Rmin < 50R∗ are equivalent.
The best-fitting solution is enumerated in Table 4 and illus-trated in Figure 10. Given 390 data points in the spectral energydistribution, we expect a “good” fit to have reduced χ2
ν � 1within dispersion
√2/390 = 0.07. The best-fitting model had
χ2ν = 1.23. We discuss the residuals, which are localized rather
than spanning a wide wavelength range, in the following para-graph; for statistical purposes, we assume they are unrelated tothe cloud geometry. The confidence intervals for the parameters,determined by Δχ2
ν = 0.07, are listed in Table 4.The residuals from the radiative transfer model are shown in
Figure 11. Coherent features dominate the residuals; the amountby which they increase χ2
ν measures their statistical significance.These include the following: (1) a “W”-shaped pattern between8 and 10.5 μm (Δχ2
ν = 0.30); (2) an “S”-shaped pattern between15 and 21 μm (Δχ2
ν = 0.24); and (3) a “U”-shaped residualbetween 1 and 3 μm (Δχ2
ν = 0.20). Each of these features isstatistically significant. Feature (1) is due to mismatching thefundamental silicate Si–O stretch feature; an additional silicateis required which provides a shorter-wavelength silicate featurethan Mg-rich olivine. Feature (2) is due to either mismatchingthe silicate Si–O–Si bending feature or the presence of MgO(or MgxFe1−xO with x > 0.5), which has a peak at 18.5 μm.Cosmic abundances favor formation of Mg-rich silicates overMg oxides, so a preferable solution for residual features (1)and (2) is a silicate with bluer fundamental and better matchingSi–O–Si bending mode features.
We experimented with the following minerals, inspired bythe results of Section 3. All models included amorphous car-bon and olivine. Additional (third) minerals were included oneat a time; the most successful were bronzite (χ2
ν = 1.22) and
No. 1, 2009 THE DUST CLOUD AROUND THE WHITE DWARF G 29-38. II 707
W
U S
Figure 11. Residuals (observed minus model) from the best-fitting moderatelyoptically thick disk model of Figure 10. Features discussed in the text are labeled.
forsterite (χ2ν = 1.55), in order of goodness of fit. These re-
sults are consistent with those in Section 3, where an Fe-richpyroxene was shown to be the third most important mineral.Then for the most successful third minerals, fourth mineralswere added; a good combination was forsterite plus mont-morillonite (χ2
ν = 1.23), but it was only slightly better thanthe bronzite model alone. Other minerals such as amorphouspyroxene yielded negligible improvement to the fit (Δχ2
ν =0.02). The materials commonly referred to as amorphous olivineand amorphous pyroxene are both amorphous silicates and areessentially indistinguishable. It appears to be significant thatFe-rich pyroxene is more abundant than Mg-rich olivine; thisis directly due to Fe-rich pyroxene having a bluer fundamentalSi–O stretch (as observed) compared to forsterite. From the lab-oratory measurements of phyllosilicates by Glotch et al. (2007),there are two properties that make them possible explanations forresidual features (1) and (2): phyllosilicates have an Si–O stretchthat is bluer than forsterite, and they have a double-peakedSi–O–Si bending mode that is similar to the shape observedin the G29-38 spectrum from 18 to 20 μm.
The distinction between the bronzite model and theforsterite + montmorillonite model is mathematically within theerrors, but we will refer primarily to the former model since it issimpler and agrees with the more extensive mineral search fromSection 3. The fit could be improved if a more exhaustive min-eral search were performed. However, the results of Section 3already demonstrate that including a wide range of minerals canexplain the silicate feature shape adequately, and we are alreadyat a reduced χ2
ν = 1.2 so that the present S/N does not allowfurther, unique modeling.
Feature (3) in the residuals relates to the shape of the inneredge of the disk and the vaporization temperature. We onlyexplored Tvap on a grid with 100 K intervals, and fixed it atthe same value for all compositions, so the observed, modestdeviations from our model are not particularly surprising in thenear-infrared. Further, we did not explore the composition ofthe featureless materials, which could affect not only their Tvapbut also the slope of their absorption around 3–6 μm, whichdetermines the shape of the inner edge of the disk spectrum.
4.2. Physically Thin Disk
A physically thin disk is very optically thick, so starlightcannot propagate radially through the disk. Such a disk mustbe so thin that the star can illuminate its surface, or it must bewarped such that the surface has clear lines of sight to the star,or a combination of both effects as described by Jura (2007).The temperature versus distance from the star scales as r−0.75
(e.g., Chiang & Goldreich 1997). The flux from an opticallythick disk is straightforward to estimate: for G29-38, the disktemperature T = 8008(R/R∗)−0.75 K, and the stellar radiusR∗ = 8 × 108 cm, so the model is determined only by the innerand outer radii of the disk. If we furthermore set the inner radiusto be that at which dust sublimates, the only free parameter isthe outer radius of the disk. Since emission from the inner radiusdominates at the shortest wavelengths, the optically thick modelmakes robust predictions of the disk flux at the wavelength whereemission from material at the vaporization temperature peaks,i.e., around 3 μm. The flux at longer wavelengths depends onthe outer radius.
As observed from Earth, the disk may of course be inclinedwith respect to the line of sight (von Hippel et al. 2007),though previous calculations considered face-on geometry forillustration (Jura 2003, 2007). The flux will scale as cos i,where i is the angle between the disk axis and the line ofsight, until i → tan−1 H/Router, where Router is the outer radiusof the disk and H is its scale height. Taking the outer radius∼ 50R∗ from the GD 362 model (Jura 2007), and requiring diskthickness H < R∗, the low-inclination limit only applies wheni < 1.◦2. The nearly edge-on limit is relatively improbable andfurthermore would cover the star unless H � R∗, in which casethe edge-on limit applies to even less probable geometries. Anoptically thick disk has a spectral energy distribution determinedalmost entirely by the outer radius, and total flux scaling withcos i.
Using the Spitzer spectra, it is clear the simple optically thickmodel is definitively ruled out by the presence of a very strongsilicate emission feature: this feature requires an optically thinemitting region. The feature contributes a significant portionof the disk luminosity and must have associated continuum.Further, the observed spectral energy distribution requires acolder component with color temperature ∼ 290 K (Reach et al.2005a) to explain the flux at 24 μm. As a first step towardconstraining a possible optically thick disk around the star, wefitted the thin-disk model to the spectrum excluding the silicatefeature (8–12 μm) and setting the inner radius as the locationwhere the grain temperature is 1200 K. The best fit has χ2
ν = 3.8;this high value is due to the lack of significant emergent coldflux from the model. However, we take the constraints on R2 andi as a guide, with best values R2/R∗ = 49±5 and i = 41◦ ±3◦.
Instead of attempting to fit the entire spectrum with the thin-disk model, we now consider only fitting it to the shorter-wavelength continuum, with an eye toward adding a cooler,physically thick silicate-bearing cloud. Thus, we excludedwavelengths longer than 8 μm and fitted the physically thinmodel to the spectrum of G29-38. The near-infrared spectrumand the decrease from 5 to 8 μm require that the inner edgeof the disk is closer to the star than the point that reaches1200 K; a better fit is obtained with Tvap = 1500 K so thatR1 = 9R∗. Figure 12 shows the constraints on outer radius (R2)and inclination (i). The best fit has a low χ2
ν = 0.8; it is probablyless than 1 due to overestimation of the uncertainties due tophotospheric subtraction in the near-infrared. The best-fittingouter radius is R2 = 25R∗ and the inclination is 23◦. It is notable
708 REACH ET AL. Vol. 693
Figure 12. Goodness of fit (χ2/dof) from the physically thin, optically thickmodel for a range of outer radii (R2, in units of stellar radius) and inclination. Thebest-fitting model has inner and outer radii R1 = 9, R2 = 25, and inclination23◦.
that the required inclination is roughly in the range required byGraham et al. (1990) in his model for the near-infrared timing(which required an inclination such that the dust temperaturepulsations are detectable while the exciting pulsations on thephotosphere are not).
An amendment to the physically thin disk model is needed toimprove the fit and explain the silicate emission. One possiblesolution is to include an optically thin, effectively physicallythick region at the outer edges of the ring. Jura (2007) showedthat for GD 362, an extension of the ring that is warped byonly ∼ 7◦ can produce a silicate feature in emission. Figure 6shows their model, compared to the moderately thick modelfrom Section 4.1.2. Indeed this outer region produces both thesilicate feature and a significant fraction of the continuum atλ > 11 μm in their model. The plausibility of the warp of theouter disk is discussed and justified physically by Jura (2007),who label it as “region III” in their model. In many ways, thedetails (mass, temperature, radius, vertical extent) of this outerportion of the disk must be similar to the physically thick model,since they explain the mid-infrared emission in the same way(an optically thin cloud of silicates). In the warped disk model,the optically thin region is actually the upper layer of the disk;i.e., even the warped portion of the disk may be optically thick,as long as it has a direct line of sight to the star.
4.3. Comparing the Thick and Thin Models
The disk spectral energy distribution can be empirically de-composed into three major components. One of them is a con-tinuum with a relatively hot (890 K) color temperature, peakingaround 4 μm and dominating the near-infrared emission. An-other component is continuum with a lower color temperature(∼ 300 K). The other major component is the silicate emissionfeature. In the Jura (2007) model, the hot component is the black-body disk—hot because it is close to the star—and the coolercontinuum and silicate feature arise in the outer warp regionIII. In the physically thick model (in Paper I and Section 4.1.2),
Figure 13. Best-fitting physically thin, optically thick disk model. The model(solid line) was only fitted to data at wavelengths less than 8 μm; it cannotproduce the silicate feature and underpredicts (by far) the longer-wavelengthcontinuum.
the hot component is amorphous carbon (hot because it is dueto highly absorbing material), and the cooler component is sili-cates (cool because the silicates are more transparent and havestrong mid-infrared emission features that allow them to coolefficiently); the two materials are colocated.
For many plausible configurations of solid material aroundthe white dwarf, we can consider the cloud as the sum of anoptically thick disk and an optically thin halo or flared disksurface. Indeed, Vinkovic et al. (2003) proved mathematicallythat flared disk models are equivalent to disk plus halo models.The radial profile of a spherical halo can be directly relatedto the flaring angle of a flared disk. Thus, it is not possible,using the spectral energy distribution alone, to separate disk andhalo (or warped disk) models. The halo dominates the infraredemission when τhalo > H/4R, where H is the flare height andR is the distance from the star (Vinkovic et al. 2003). For thewedge-shaped “physically thick” model discussed above, this isequivalent to τ‖ > tan θ 1
2/4. Equating the emission and absorbed
flux (3% of the stellar flux), the halo will dominate the infraredemission when τ‖ > 0.004, which is already required for boththe physically thick and thin models.
For the specific case of the G29-38 disk, we made a directsubstitution of the optically thick disk for the C/Fe componentof the moderately optically thick model. The optically thickdisk was taken directly from the model in Figure 13 (i.e., theone fitted to wavelengths shorter than 8 μm), and the silicatecomponents were taken from the moderately optically thickmodel in Figure 10. The silicate component of the moderatelyoptically thick disk was rescaled in amplitude in order tomatch the observed flux after being added to the optically thickdisk. The parameters for the best-fitting disk in this combineddisk+silicate model are similar to those derived above usingonly short-wavelength data: R2 = 22R∗ and i = 29◦. Figure 14shows the best fit; it is very similar to the moderately opticallythick model in Figure 10; the goodness-of-fit, χ2
ν = 1.40,not much worse than the moderately optically thick model.Improvements to χ2
ν as obtained in Section 3 could be obtainedby including more minerals in the optically thin region.
5. TIMING CONSTRAINTS
The geometry of the G29-38 disk can be constrained us-ing timing information. The star is a ZZ Ceti variable with
No. 1, 2009 THE DUST CLOUD AROUND THE WHITE DWARF G 29-38. II 709
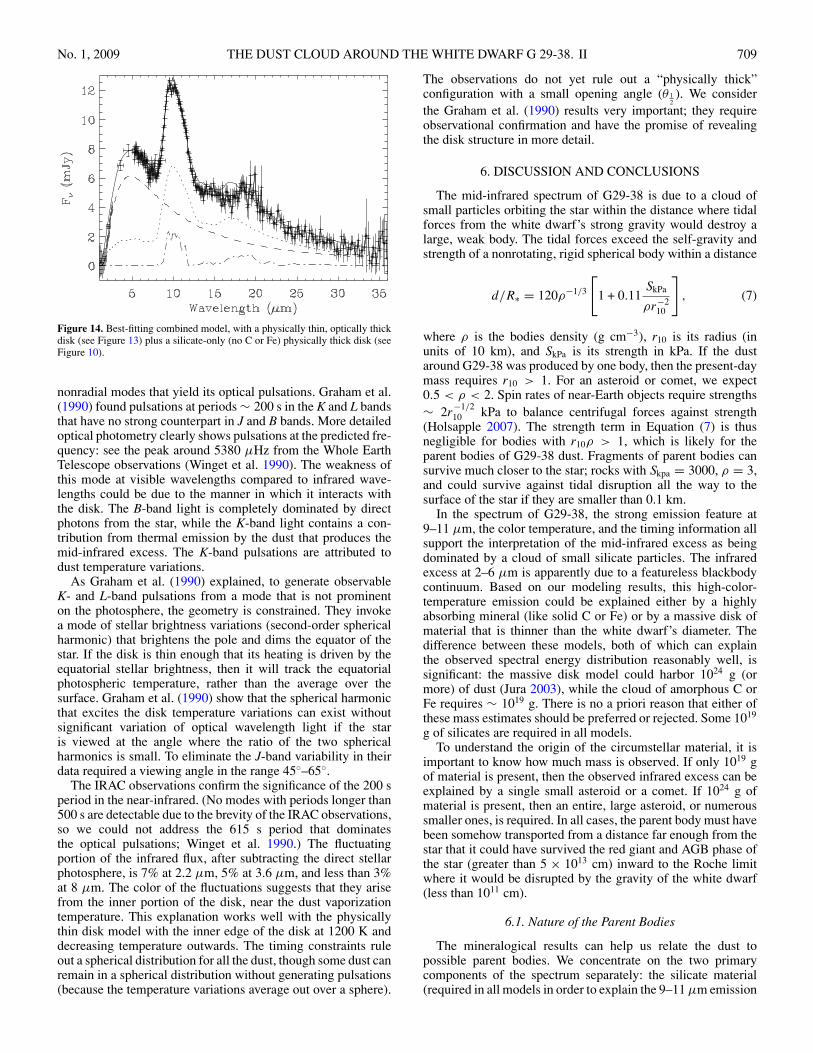
Figure 14. Best-fitting combined model, with a physically thin, optically thickdisk (see Figure 13) plus a silicate-only (no C or Fe) physically thick disk (seeFigure 10).
nonradial modes that yield its optical pulsations. Graham et al.(1990) found pulsations at periods ∼ 200 s in the K and L bandsthat have no strong counterpart in J and B bands. More detailedoptical photometry clearly shows pulsations at the predicted fre-quency: see the peak around 5380 μHz from the Whole EarthTelescope observations (Winget et al. 1990). The weakness ofthis mode at visible wavelengths compared to infrared wave-lengths could be due to the manner in which it interacts withthe disk. The B-band light is completely dominated by directphotons from the star, while the K-band light contains a con-tribution from thermal emission by the dust that produces themid-infrared excess. The K-band pulsations are attributed todust temperature variations.
As Graham et al. (1990) explained, to generate observableK- and L-band pulsations from a mode that is not prominenton the photosphere, the geometry is constrained. They invokea mode of stellar brightness variations (second-order sphericalharmonic) that brightens the pole and dims the equator of thestar. If the disk is thin enough that its heating is driven by theequatorial stellar brightness, then it will track the equatorialphotospheric temperature, rather than the average over thesurface. Graham et al. (1990) show that the spherical harmonicthat excites the disk temperature variations can exist withoutsignificant variation of optical wavelength light if the staris viewed at the angle where the ratio of the two sphericalharmonics is small. To eliminate the J-band variability in theirdata required a viewing angle in the range 45◦–65◦.
The IRAC observations confirm the significance of the 200 speriod in the near-infrared. (No modes with periods longer than500 s are detectable due to the brevity of the IRAC observations,so we could not address the 615 s period that dominatesthe optical pulsations; Winget et al. 1990.) The fluctuatingportion of the infrared flux, after subtracting the direct stellarphotosphere, is 7% at 2.2 μm, 5% at 3.6 μm, and less than 3%at 8 μm. The color of the fluctuations suggests that they arisefrom the inner portion of the disk, near the dust vaporizationtemperature. This explanation works well with the physicallythin disk model with the inner edge of the disk at 1200 K anddecreasing temperature outwards. The timing constraints ruleout a spherical distribution for all the dust, though some dust canremain in a spherical distribution without generating pulsations(because the temperature variations average out over a sphere).
The observations do not yet rule out a “physically thick”configuration with a small opening angle (θ 1
2). We consider
the Graham et al. (1990) results very important; they requireobservational confirmation and have the promise of revealingthe disk structure in more detail.
6. DISCUSSION AND CONCLUSIONS
The mid-infrared spectrum of G29-38 is due to a cloud ofsmall particles orbiting the star within the distance where tidalforces from the white dwarf’s strong gravity would destroy alarge, weak body. The tidal forces exceed the self-gravity andstrength of a nonrotating, rigid spherical body within a distance
d/R∗ = 120ρ−1/3
[1 + 0.11
SkPa
ρr−210
], (7)
where ρ is the bodies density (g cm−3), r10 is its radius (inunits of 10 km), and SkPa is its strength in kPa. If the dustaround G29-38 was produced by one body, then the present-daymass requires r10 > 1. For an asteroid or comet, we expect0.5 < ρ < 2. Spin rates of near-Earth objects require strengths∼ 2r
−1/210 kPa to balance centrifugal forces against strength
(Holsapple 2007). The strength term in Equation (7) is thusnegligible for bodies with r10ρ > 1, which is likely for theparent bodies of G29-38 dust. Fragments of parent bodies cansurvive much closer to the star; rocks with Skpa = 3000, ρ = 3,and could survive against tidal disruption all the way to thesurface of the star if they are smaller than 0.1 km.
In the spectrum of G29-38, the strong emission feature at9–11 μm, the color temperature, and the timing information allsupport the interpretation of the mid-infrared excess as beingdominated by a cloud of small silicate particles. The infraredexcess at 2–6 μm is apparently due to a featureless blackbodycontinuum. Based on our modeling results, this high-color-temperature emission could be explained either by a highlyabsorbing mineral (like solid C or Fe) or by a massive disk ofmaterial that is thinner than the white dwarf’s diameter. Thedifference between these models, both of which can explainthe observed spectral energy distribution reasonably well, issignificant: the massive disk model could harbor 1024 g (ormore) of dust (Jura 2003), while the cloud of amorphous C orFe requires ∼ 1019 g. There is no a priori reason that either ofthese mass estimates should be preferred or rejected. Some 1019
g of silicates are required in all models.To understand the origin of the circumstellar material, it is
important to know how much mass is observed. If only 1019 gof material is present, then the observed infrared excess can beexplained by a single small asteroid or a comet. If 1024 g ofmaterial is present, then an entire, large asteroid, or numeroussmaller ones, is required. In all cases, the parent body must havebeen somehow transported from a distance far enough from thestar that it could have survived the red giant and AGB phase ofthe star (greater than 5 × 1013 cm) inward to the Roche limitwhere it would be disrupted by the gravity of the white dwarf(less than 1011 cm).
6.1. Nature of the Parent Bodies
The mineralogical results can help us relate the dust topossible parent bodies. We concentrate on the two primarycomponents of the spectrum separately: the silicate material(required in all models in order to explain the 9–11 μm emission
710 REACH ET AL. Vol. 693
feature) and the highly absorbing material (required only in thethick-disk models).
The composition of the highly absorbing material cannotbe determined unambiguously from the spectrum. We fittedit in Section 3 with amorphous C, based on the high cosmicabundance of C. But solid Fe or Si are also plausible, given theirhigh cosmic abundance. Indeed, for chondritic (asteroidal andterrestrial) material the abundance of Si and Fe is much higherthan C (Jura 2006). Mineralogical models for dust around otherstars and in comets, using the same methodology as in Section 3,do not always show a high abundance of C (Lisse et al. 2007a,2007b). For extrasolar systems, a careful subtraction of thephotosphere is critical to measuring the high-color-temperatureemission (which is characteristic of highly absorbing materiallike solid C). For G29-38, the high-color-temperature excess(at 3.6 μm and longer wavelengths) is so far above photospherethat it must arise from circumstellar material, but at wavelengthsshorter than 2 μm the infrared excess shape depends on thephotosphere model. For G29-38 the mid-infrared data clearlyrequire emission with a color temperature greater than 800 K,whether it is C or Fe.
The compositions of the potential parent bodies for the cir-cumstellar material around white dwarfs can be addressed bystudies of solar system bodies. To date there has been no samplereturn mission from an asteroid, but meteorites provide directmeasures of composition of parts of at least some asteroids.Carbonaceous chondrites have some C, but all chondrites arelargely silicate mineral (olivine and pyroxene, mostly Mg-rich(forsterite and enstatite)), with a wide range of other minerals(some Ca- and Al-rich) and metals (often including previouslymolten Fe). Metallic meteorites, commonly found in museumsand on the ground, have largely Fe and Ni composition (Sheareret al. 1998). Comets are likely to have a more primitive com-position than carbonaceous chondrites, with abundant silicategrains as well as carbonaceous material, based on the infraredspectroscopy of cometary dust, laboratory study of cometaryinterplanetary dust particles, and in situ mass spectrometry dur-ing the 1P/Halley flyby in 1986 (Hanner & Bradley 2004).The most abundant silicate minerals in meteorites are Mg-richolivines and pyroxenes, as well as feldspar and phyllosilicates.Interplanetary dust particles believed to originate from comets(CP type) are largely composed of phyllosilicates that requireaqueous alteration on their parent body (Messenger et al. 2006).
Based on the analogy to solar system bodies, the dominance ofFe-rich pyroxene mineralogy is distinct. Comets or outer-main-belt (D-type) asteroids contain Mg-rich olivine and phyllosil-icates, which when combined can reasonably fit the observedspectrum of G29-38. Both comets and D-type asteroids containorganic material, which would be consistent with the presenceof amorphous C, and the most primitive carbonaceous (CI) me-teorites are largely composed of phyllosilicates. But the Mg-rich olivine plus phyllosilicate model is not as good a fit to thedata as Fe-rich pyroxene. There are pyroxene-dominated mete-orites, but they are dominated by Mg-rich pyroxene (hence thename enstatite meteorites for this rare class). It is worth notingthat enstatite chondrites are thought to have formed in reduc-ing conditions and contain other minerals including niningerite(Weisberg et al. 2006), which was one of the most abundantminerals from our fit for G29-38 in Table 3. Thus, the physicalconditions for the formation of the enstatite meteorite parentbodies may have some relevance to the formation of the G29-38debris parent body.
In terms of the featureless material that produces the near-infrared continuum (in the physically thick models), either C
or Fe are acceptable to the fits. If the material were C, thena cometary or D-type asteroid origin would be more likely,whereas with abundant Fe, formation closer to the star andwithin a differentiated parent body would be implicated.
Some constraints on the composition of the material areobtained from the abundances in the white dwarf atmosphere.Solid material at the inner edge of the disk is constantlybeing vaporized by the stellar radiation. These vapors reachthe atmosphere of the star (or are blown out of the system).They cannot reside in the stellar atmosphere for long; instead,they diffuse rapidly inward, deeper than the photosphere. Thus,the heavy elements in the stellar atmosphere must be “fresh,”consistent with an origin from vaporization of circumstellardust but not with a long-lived stellar atmosphere. G29-38 hasmetals present in its atmosphere. Jura (2006) discussed thedeficiency of C in some externally polluted white dwarfs, wherethe abundance of C relative to Fe is more than 10 times lowerthan solar. CI meteorites have C/Fe 10 times lower than solar;this is commonly explained by the volatility of C and thehigh temperature required for chondrite formation (Brearleyand Jones 1998). We note that the abundances of refractoryelements in comets and asteroids as well as that inferred fromexozodiacal dust is consistently less than solar, in the 7%–10%range (Lisse et al. 2006). But in a relative abundance, dustcollected during the encounter with the long-period comet 1P/Halley has C/Fe abundance ratio similar to solar (Jessbergeret al. 1988). Short-period comets (which are periodically heatedto higher temperature) may be more devolatilized and may haveabundances more similar to asteroidal material.
6.2. Disruption of “Hot Jupiter”?
One intriguing possibility for the origin of the infrared excessis the survival of the core of a giant planet and its subsequentgravitational disruption. “Hot Jupiters,” with masses of order1030 g orbiting within 1012 cm (0.1 AU) of their star, appearto be fairly common in extrasolar planetary systems: 1.2%of nearby F, G, and K stars have such a planet (Marcy et al.2005). In this scenario, the planet would become engulfed intoa common atmosphere during the red giant phase. Drag fromthe extended stellar atmosphere would cause the planet to spiralinward toward the stellar core. At the end of the mass-losingphase of the star’s evolution, we would be left with a whitedwarf, the surviving core of the planet, and the planetary nebulacomposed of the outer atmosphere from the star.
If a planet began at less than 1012 cm from the star, it ispossible that its remnant could land within the Roche radius.The effect of the post-main-sequence evolution on the planetarydynamics has not been explored in detail. The change in massof the central star could make any borderline-unstable system ofmultiple planets unstable (Debes & Sigurdsson 2002) and couldlead to nonlinear orbital perturbations. A simple estimate of theorbital decay due to gas drag when the planet is within the redgiant atmosphere is made by setting the rate of kinetic energyimparted to the planet,
E = 1
2ρπR2
p
(GM∗
a
)3/2
, (8)
equal to the change in the orbital binding energy
U = GM∗Mp
a2
da
dt, (9)
No. 1, 2009 THE DUST CLOUD AROUND THE WHITE DWARF G 29-38. II 711
where Mp and Rp are, respectively, the mass and radius of theplanet, G is the gravitational constant, a is the semi-major axisof the presumed circular orbit, M∗ is the mass of the star, and ρ isthe mass density of the star at the distance of the planet. Takingfor illustration a planet with the mass of Jupiter and averagedensity 1 g cm−3, orbiting at a distance of 0.1 AU from a star ofmass 2 M� that has mass density 10−9 g cm−3 at 0.1 AU fromits center, the timescale for orbital decay is 6 × 10⁴ yr. This ismuch smaller than the AGB lifetime ∼ 107 yr (Vassiliadis &Wood 1993) for a progenitor star mass of 3.1 M� (Weidemann2000). Thus, the inward spiral of hot Jupiter (or other close-in)planetary orbits is likely to be rapid, once the star has enteredits giant phase.
Considering only a convective main-sequence primary star,Sasselov (2003) showed that the orbit of a “hot Jupiter” likeOGLE-TR-56b would tidally decay on a timescale of 1–10 gyr.Again considering only a main-sequence primary star, Baraffeet al. (2004) showed that planets with masses less than 3 × 1030
will evaporate down to a rocky core in less than 5 gyr. Theseeffects may combine, with tidal decay enhancing evaporation(Erkaev et al. 2007). The tidal decay of “hot Jupiter” orbitscannot be too rapid for main-sequence stars, or else they wouldbe much less common. The orbital evolution is very sensitiveto the stellar structure and the planet’s orbital eccentricity;the response is highly nonlinear and may lead to a rapidinward spiral upon perturbation of the stellar interior structureor eccentricity (Ogilvie & Lin 2007; Jackson et al. 2007).Nonetheless, regardless of whether tidal decay can bring planetsclose to the stellar surface during main-sequence evolution,the gas drag during the red giant phase should finish thejob.
How much of a “hot Jupiter” could survive the late stagesof its star’s evolution is not known. A brown dwarf wasrecently discovered around a white dwarf suggesting that somecompanions can survive the red giant phase of the primarystar despite being well within the atmosphere (Maxted et al.2006). Indeed, the companion is within the Roche distanceof the white dwarf unless it has a mass density greater than3.6 g cm−3 or is held together by more than its own gravity.The composition of the core of an extrasolar giant planet isdifficult to constrain. Mass and radius estimates seem to requirea dense core, possibly of high-pressure ice or stony composition(Burrows et al. 2007). This material would be tidally disrupted,as in the asteroid (or comet) disruption models considered todate. The Fe-rich pyroxene mineralogy for the G29-38 debris,which is distinct from that of most comets and asteroids, does notappear impossible for a rocky planetary core, but at present thereis little more than can be said about whether such a mineralogyis likely.
That G29-38 is exceptional among debris disks (having by farthe brightest infrared excess, with 3% of the star’s luminosityabsorbed and radiated by dust) makes the hypothesis moreattractive. Consider the reverse argument: if 1% of all stars have“hot Jupiters,” what is their expected end state? From this pointof view, it seems inevitable that such remnant planets wouldgenerate debris for their parent star in its white dwarf phase.But this argument assumes that “hot Jupiters” exist aroundA-type stars (the progenitor type for G29-38), at least part ofthe planet can survive the common envelope phase, the remnantcore lands within the Roche radius, and the debris can survive500 Myr (the age of G29-38). The age problem may not besevere if the remnant planetary core becomes fragmented, withfragments gradually entering the Roche radius due to collisional
disruption and gravitational perturbations. Further theoreticalwork is needed to test the viability of this scenario.
W.T.R. gratefully acknowledges discussions on radiativetransfer in disks with Moshe Elitzur in 2007 May. W.T.R.gratefully acknowledges discussions on extrasolar giant planetswith Adam Burrows in 2007 June. This work is based in part onobservations made with the Spitzer Space Telescope, which isoperated by the Jet Propulsion Laboratory, California Instituteof Technology under NASA contract 1407.
REFERENCES
Backman, D. E., & Paresce, F. 1993, in Protostars and Planets III, ed. E. H.Levy & J. I. Lunine (Tucson, AZ: Univ. Arizona Press), 1253
Baraffe, I., Selsis, F., Chabrier, G., Barman, T. S., Allard, F., Hauschildt, P. H.,& Lammer, H. 2004, A&A, 419, L13
Beichman, C. A., et al. 2006, ApJ, 639, 1166Bergeron, P., Wesemael, F., & Beauchamp, A. 1995, PASP, 107, 1047Bradley, J. P. 2002, Highlights Astron., 12, 34Brearley, A. J., & Jones, R. H. 1998, Rev. Mineral. Geochem., 36, 301Bryden, G., et al. 2006, ApJ, 636, 1098Burrows, A., Hubeny, I., Budaj, J., & Hubbard, W. B. 2007, ApJ, 661, 502Chen, C. H., et al. 2006, ApJS, 166, 351Chiang, E. I., & Goldreich, P. 1997, ApJ, 490, 368Chihara, H., Koike, C., Tsuchiyama, A., Tachibana, S., & Sakamoto, D.
2002, A&A, 391, 267Debes, J. H., & Sigurdsson, S. 2002, ApJ, 572, 556Dohnanyi, J. W. 1969, JGR, 74, 2531Dorschner, J., Begemann, B., Henning, T., Jaeger, C., & Mutschke, H. 1995,
A&A, 300, 503Durda, D., & Dermott, S. F. 1996, Icarus, 130, 140Edoh, O. 1983, PhD thesis, Univ. ArizonaErkaev, N. V., Kulikov, Yu. N., Lammer, H., Selsis, F., Langmayr, D., Jaritz,
G. F., & Biernat, H. K. 2007, A&A, 472, 329Fazio, G. G., et al. 2004, ApJS, 154, 10Glotch, T. D., Rossman, G. R., & Aharanson, O. 2007, Icarus, 192, 605Graham, J. R., Matthews, K., Neugebauer, G., & Soifer, B. T. 1990, ApJ, 357,
216Greenstein, J. L., & Liebert, J. W. 1990, ApJ, 360, 662Grun, E., Zook, H. A., Fechtig, H., & Giese, R. H. 1985, Icarus, 62, 244Hanner, M. S., & Bradley, J. P. 2004, in Comets II, ed. M. C. Festou, H. U.
Keller, & H. A. Weaver (Tucson, AZ: Univ. Arizona Press), 555Henning Th., & Mutschke, H. 1997, A&A, 327, 743Holberg, J. B., & Bergeron, P. 2006, AJ, 132, 1221Holsapple, K. A. 2007, Icarus, 187, 500Houck, J. R., et al. 2004, ApJS, 154, 18Ivezic, Z., & Elitzur, M. 1997, MNRAS, 287, 799Ivezic, Z., Nenkova, M., & Elitzur, M. 1999, arXiv:astro-ph/9910475Jackson, B., Greenberg, R., & Barnes, R. 2008, ApJ, 678, 498Jager, C., Dorschner, J., Mutschke, H., Posch, Th., & Henning, Th. 2003, A&A,
408, 193Jager, C., Molster, F. J., Dorschner, J., Henning, Th., Mutschke, H., & Waters,
L. B. F. M. 1998, A&A, 339, 904Jessberger, E. K., Christoforidis, A., & Kissel, J. 1988, Nature, 332, 691Jura, M. 2003, ApJ, 584, L91Jura, M. 2006, ApJ, 653, 613Jura, M., Farihi, J., Zuckerman, B., & Becklin, E. E. 2007, ApJ, 133, 1927Kalas, P., Graham, J. R., & Clampin, M. 2005, Nature, 435, 1067Kalas, P., Graham, J. R., Clampin, M. C., & Fitzgerald, M. P. 2006, ApJ, 637,
L57Keller, L., et al. 2002, Nature, 417, 148Kemper, F., Jager, C., Waters, L. B. F. M., Henning, Th., Molster, F. J., Barlow,
M. J., Lim, T., & de Koter, A. 2002, Nature, 415, 295Kilic, M., von Hippel, T., Leggett, S. K., & Winget, D. E. 2006, ApJ, 646, 474Kimura, Y., Kurumada, M., Tamura, K., Koike, C., Chihara, H., & Kaito, C.
2005, A&A, 442, 507Kleinman, S. J., et al. 1998, ApJ, 495, 424Koester, D., Rollenhagen, K., Napiwotzki, R., Voss, B., Christlieb, N., Homeier,
D., & Reimers, D. 2005, A&A, 432, 1025Koike, C., Chihara, H., Tsuchiyama, A., Suto, H., Sogawa, H., & Okuda, H.
2003, A&A, 399, 1101Li, A., & Draine, B. T. 2001, ApJ, 554, 778
712 REACH ET AL. Vol. 693
Lisse, C. M., Beichman, C. A., Bryden, G., & Wyatt, M. C. 2007a, ApJ, 658,584
Lisse, C. M., Chen, C. H., Wyatt, M. C., & Morlok, A. 2008, ApJ, 673, 1106Lisse, C. M., Kraemer, K. E., Nuth, J. A., III, Li, A., & Joswiak, D. 2007b, Icarus,
187, 69Lisse, C. M., et al. 2006, Science, 313, 635Marcy, G., Butler, R. P., Fischer, D., Vogt, S., Wright, J. T., Tinney, C. G., &
Jones, H. R. A. 2005, Prog. Theor. Phys. Suppl., 158, 24Mathis, J. S. 1994, ApJ, 422, 176Maxted, P. F. L., Napiwotzki, R., Dobbie, P. D., & Burleigh, M. R. 2006, Nature,
442, 543Messenger, S., Sandford, S., & Brownlee, D. 2006, in Meteorites and the Early
Solar System II, ed. D. S. Lauretta & H. Y. McSween, Jr. (Tucson, AZ: Univ.Arizona Press), 187–208
Molster, F. J., & Waters, L. B. F. M. 2003, in Lecture Notes in Physics (Berlin:Springer), 609, 121
Monnier, J. D., & Millan-Gabet, R. 2002, ApJ, 579, 694O’Brien, D. P., & Greenberg, R. 2003, Icarus, 164, 334Ogilvie, G. I., & Lin, D. N. C. 2007, ApJ, 661, 1180Reach, W. T., Kuchner, M. J., von Hippel, T., Burrows, A., Mullally, F., Kilic,
M., & Winget, D. E. 2005a, ApJ, 635, L161Reach, W. T., et al. 2005b, PASP, 117, 978Rhee, J. H., Song, I., Zuckerman, B., & McElwain, M. 2007, ApJ, 660, 1556
Sasselov, D. D. 2003, ApJ, 596, 1327Scargle, J. D. 1982, ApJ, 263, 835Schleicher, D. G., & A’Hearn, M. F. 1988, ApJ, 331, 1058Shearer, C. K., Papike, J. J., & Rietmeijer, F. J. M. 1998, in Reviews
in Mineralogy 36, Planetary Materials, ed. J. J. Papike (Washington:Mineralogical Society of America), 3
Su, K. Y. L., et al. 2007, ApJ, 657, L41Trilling, D. E., et al. 2008, ApJ, 674, 1086Vassiliadis, E., & Wood, P. R. 1993, ApJ, 413, 641Vinkovic, D., Ivevic, Z., Miroshnichenko, A. S., & Elitzer, M. 2003, MNRAS,
346, 1151von Hippel, T., Kuchner, M. J., Kilic, M., Mullally, F., & Reach, W. T. 2007, ApJ,
662, 544Werner, M. W., et al. 2004, ApJS, 154, 1Weidemann, V. 2000, A&A, 363, 647Weisberg, M. K., McCoy, T. J., & Krot, A. N. 2006, in Meteorites and the Early
Solar System II, ed. D. S. Lauretta & H. Y. McSween, Jr. (Tucson, AZ: Univ.Arizona Press), 19
Winget, D. E. 1990, ApJ, 357, 630Woodward, C. E., Kelley, M. S., Bockelee-Morvan, D., & Gehrz, R. D.
2007, ApJ, 671, 1065Zubko, V. G., Mennella, V., Colangeli, L., & Bussoletti, E. 1996, MNRAS, 282,
1321