The “Big 4” – Significance, Effect Size, Sample Size, and Power 18 Sep 2009 Dr. Sean Ho...
33
The “Big 4” – The “Big 4” – Significance, Effect Size, Significance, Effect Size, Sample Size, and Power Sample Size, and Power 18 Sep 2009 Dr. Sean Ho CPSY501 cpsy501.seanho.com
-
Upload
maryann-barker -
Category
Documents
-
view
224 -
download
0
Transcript of The “Big 4” – Significance, Effect Size, Sample Size, and Power 18 Sep 2009 Dr. Sean Ho...
The “Big 4” –The “Big 4” –Significance, Effect Size, Significance, Effect Size, Sample Size, and PowerSample Size, and Power
18 Sep 2009Dr. Sean HoCPSY501
cpsy501.seanho.com
18 Sep 200918 Sep 2009CPSY501: "Big 4"CPSY501: "Big 4" 22
Outline for todayOutline for today
Stats review: Correlation (Pearson, Spearman) t-tests (indep, paired)
Discussion of research article (Missirlian et al) The “Big 4”:
Statistical significance (p-value, α) Effect size Power Finding needed sample size
SPSS tips
11 Sep 200911 Sep 2009CPSY501: IntroCPSY501: Intro 33
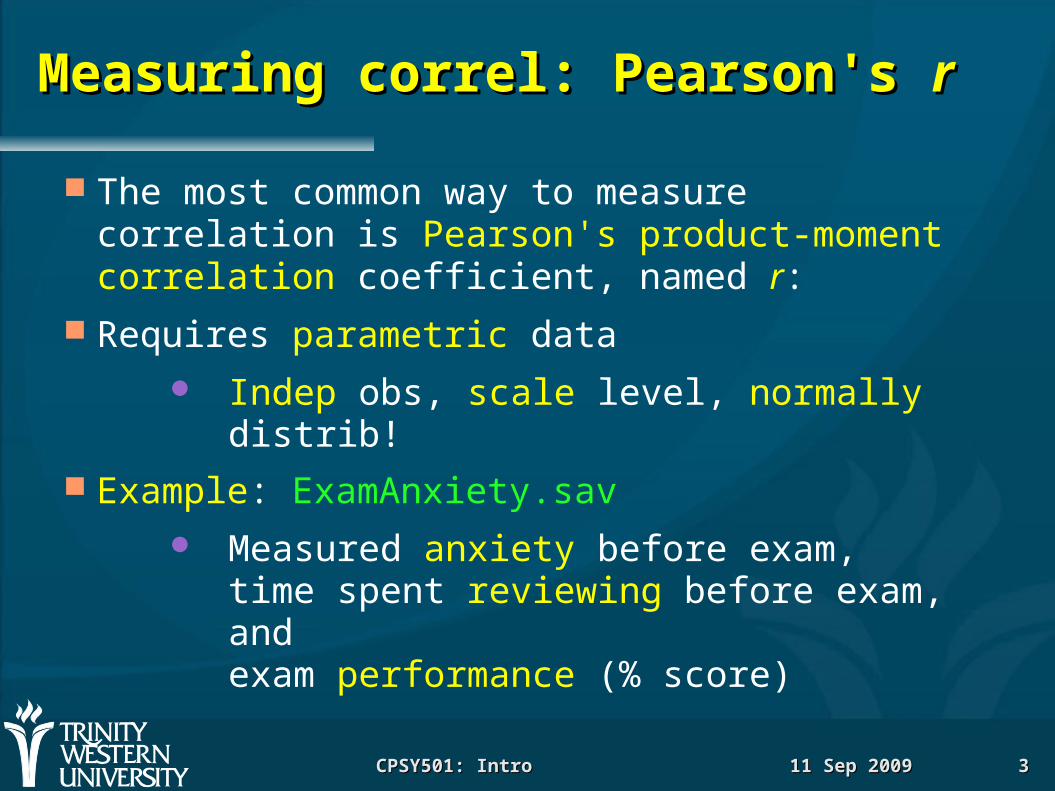
Measuring correl: Pearson's Measuring correl: Pearson's rr
The most common way to measure correlation is Pearson's product-moment correlation coefficient, named r:
Requires parametric data Indep obs, scale level, normally distrib!
Example: ExamAnxiety.sav Measured anxiety before exam,
time spent reviewing before exam, andexam performance (% score)
11 Sep 200911 Sep 2009CPSY501: IntroCPSY501: Intro 44
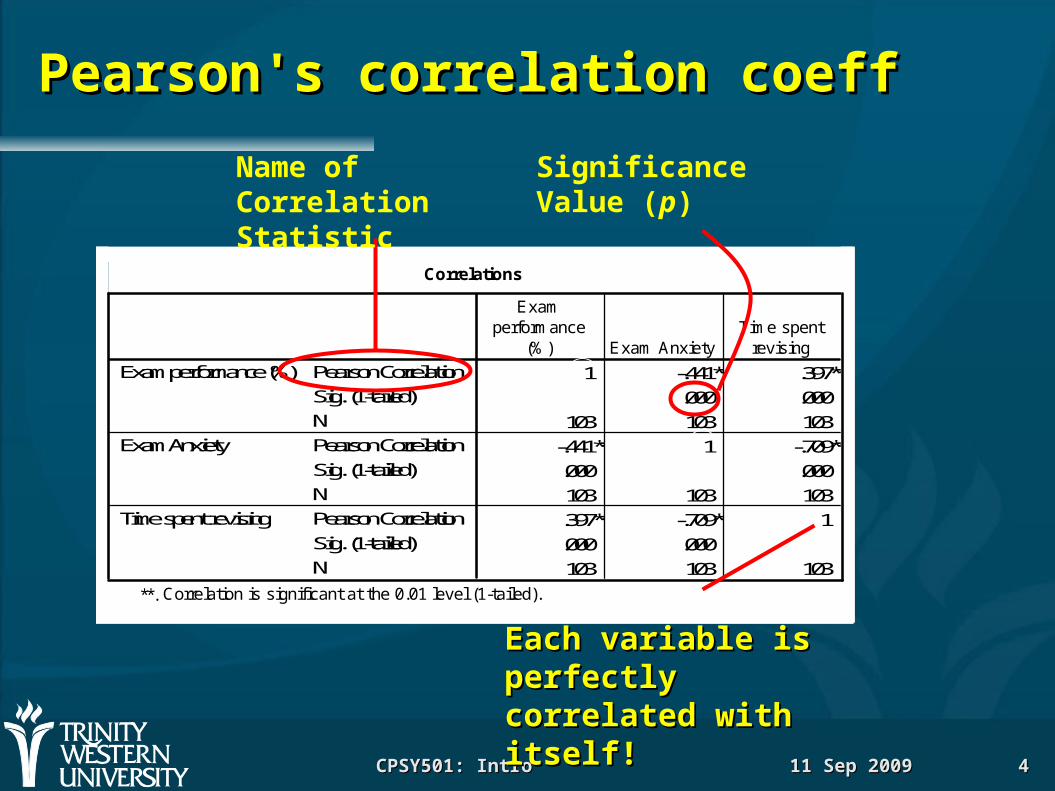
Pearson's correlation coeffPearson's correlation coeff
Correlations
1 -.441** .397**
.000 .000
103 103 103
-.441** 1 -.709**
.000 .000
103 103 103
.397** -.709** 1
.000 .000
103 103 103
Pearson Correlation
Sig. (1-tailed)
N
Pearson Correlation
Sig. (1-tailed)
N
Pearson Correlation
Sig. (1-tailed)
N
Exam performance (%)
Exam Anxiety
Time spent revising
Examperformance
(%) Exam AnxietyTime spent
revising
Correlation is significant at the 0.01 level (1-tailed).**.
Name of Correlation Statistic
Each variable is Each variable is perfectly correlated perfectly correlated with itself!with itself!
Significance Value (p)
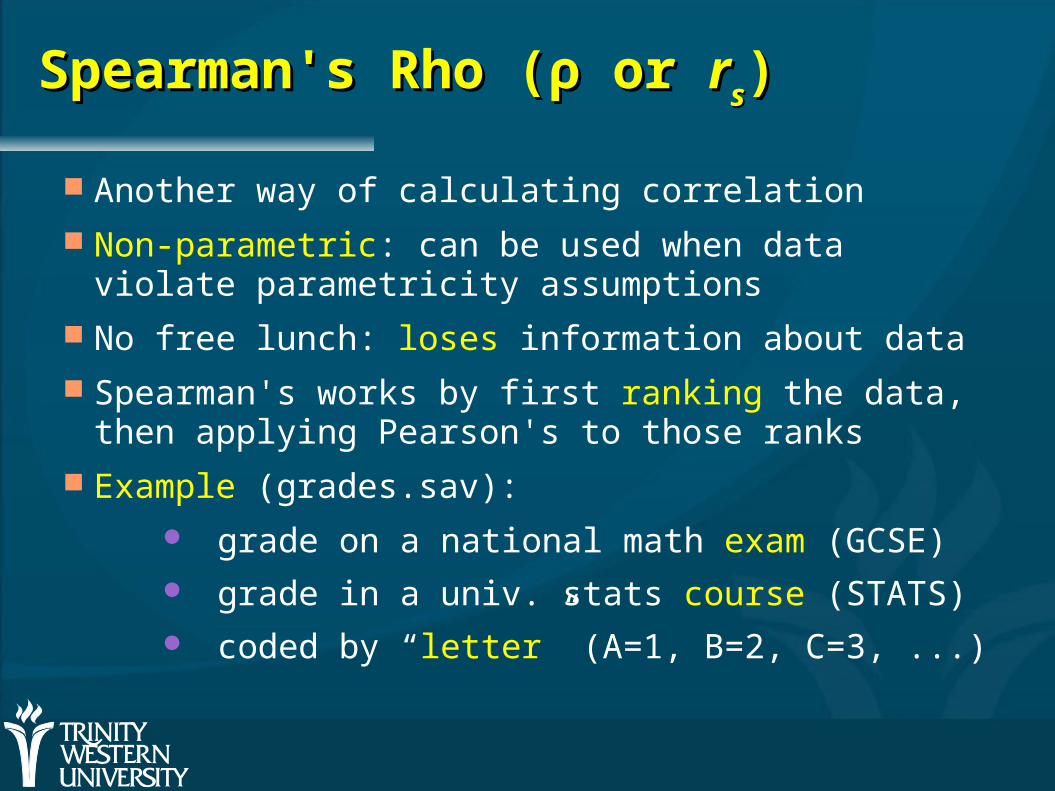
Spearman's Rho (Spearman's Rho (ρρ or or rrss))
Another way of calculating correlation Non-parametric: can be used when data violate
parametricity assumptions No free lunch: loses information about data Spearman's works by first ranking the data,
then applying Pearson's to those ranks Example (grades.sav):
grade on a national math exam (GCSE) grade in a univ. stats course (STATS) coded by “letter” (A=1, B=2, C=3, ...)
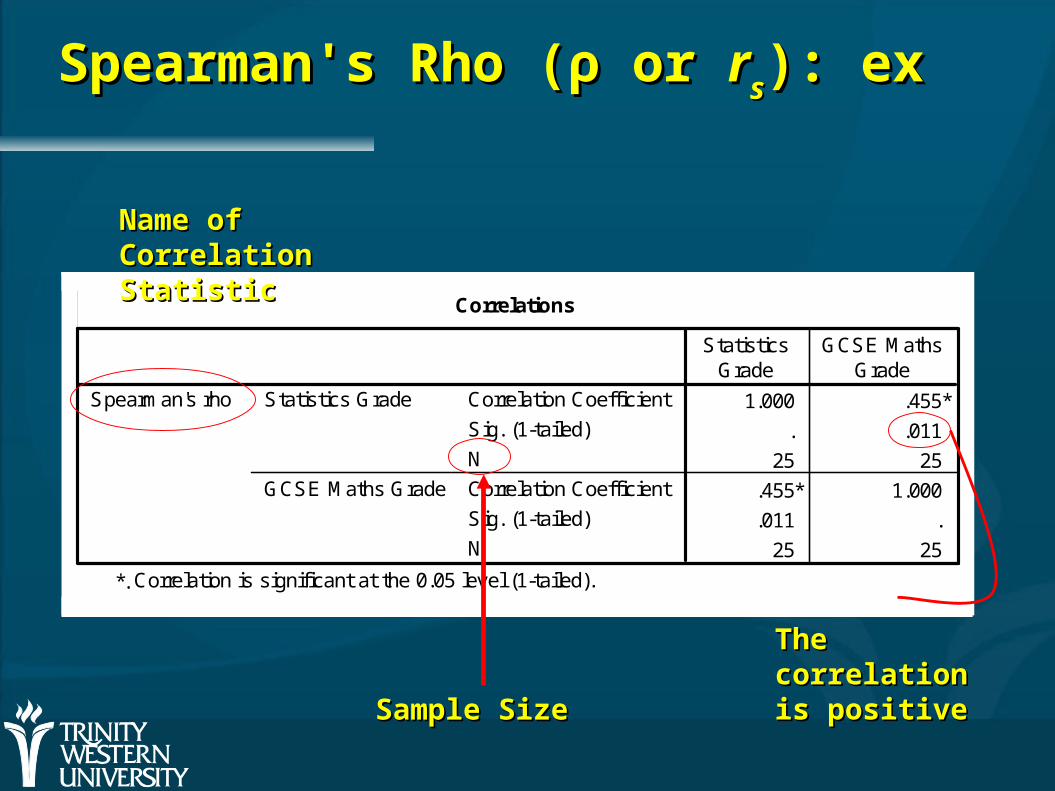
Spearman's Rho (Spearman's Rho (ρρ or or rrss): ex): ex
Correlations
1.000 .455*
. .011
25 25
.455* 1.000
.011 .
25 25
Correlation Coefficient
Sig. (1-tailed)
N
Correlation Coefficient
Sig. (1-tailed)
N
Statistics Grade
GCSE Maths Grade
Spearman's rho
StatisticsGrade
GCSE MathsGrade
Correlation is significant at the 0.05 level (1-tailed).*.
Sample SizeSample Size
The The correlation correlation is positiveis positive
Name of Name of Correlation Correlation StatisticStatistic
Chi-Square test (Chi-Square test (χχ22))
Evaluates whether there is a relationship between 2 categorical variables
The Pearson chi-square statistic tests whether the 2 variables are independent
If the significance is small enough(p<α, usually α=.05), we reject the null hypothesis that the two variables are independent (unrelated)
i.e., we think that they are in some way related.
tt-Tests: comparing two means-Tests: comparing two means
Moving beyond correlational research… We often want to look at the effect of one
variable on another by systematically changing some aspect of that variable
That is, we want to manipulate one variable to observe its effect on another variable.
t-tests are for comparing two means Two types of application of t-tests:
Related/dependent measures Independent groups

Related/dependent Related/dependent tt-tests-tests
A repeated measures experiment that has 2 conditions (levels of the IV)
the same subjects participate in both conditions We expect that a person’s behaviour will be the same
in both conditions external factors – age, gender, IQ,
motivation, ... – should be same in both conditions
Experimental Manipulation: we do something different in Condition 1 than what we do in Condition 2 (so the only difference between conditions is the manipulation the experimenter made)
e.g., Control vs. test
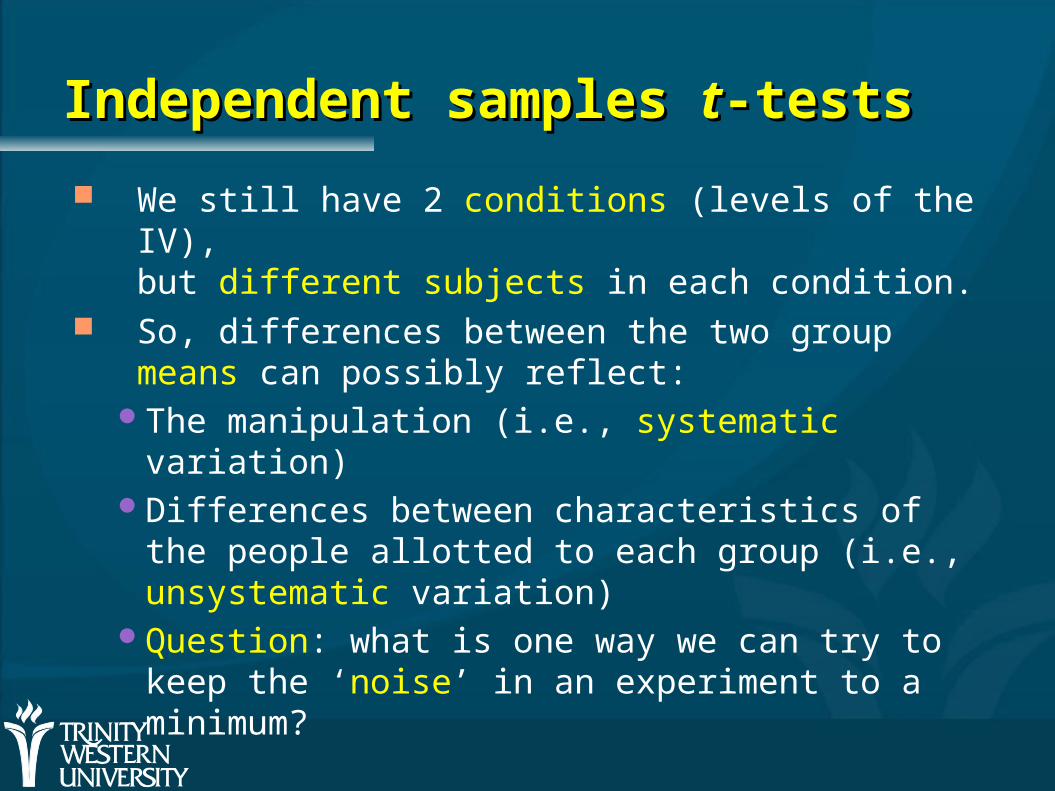
Independent samples Independent samples tt-tests-tests
We still have 2 conditions (levels of the IV),but different subjects in each condition.
So, differences between the two group means can possibly reflect:
The manipulation (i.e., systematic variation) Differences between characteristics of the
people allotted to each group (i.e., unsystematic variation)
Question: what is one way we can try to keep the ‘noise’ in an experiment to a minimum?
tt-Tests-Tests
t-tests work by identifying sources of systematic and unsystematic variation, and then comparing them.
The comparison lets us see whether the experiment created considerably more variation than we would have got if we had just tested the participants w/o the experimental manipulation.
Example: dependent samplesExample: dependent samples
“Paired” samples t-test 12 ‘spider phobes’ exposed to a picture of a
spider (picture), and on a separate occasion, a real live tarantula (real)
Their anxiety was measured at each time (i.e., in each condition).
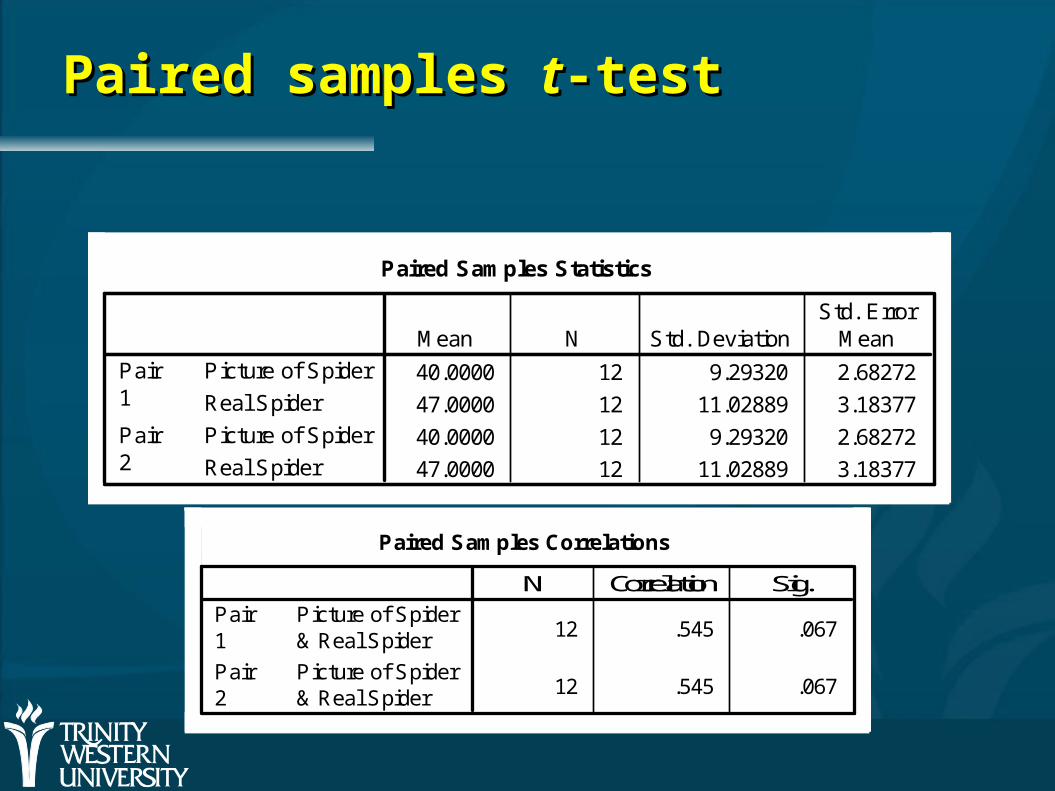
Paired samples Paired samples tt-test-test
Paired Samples Correlations
12 .545 .067
12 .545 .067
Picture of Spider& Real Spider
Pair1
Picture of Spider& Real Spider
Pair2
N Correlation Sig.
Paired Samples Statistics
40.0000 12 9.29320 2.68272
47.0000 12 11.02889 3.18377
40.0000 12 9.29320 2.68272
47.0000 12 11.02889 3.18377
Picture of Spider
Real Spider
Pair1
Picture of Spider
Real Spider
Pair2
Mean N Std. DeviationStd. Error
Mean
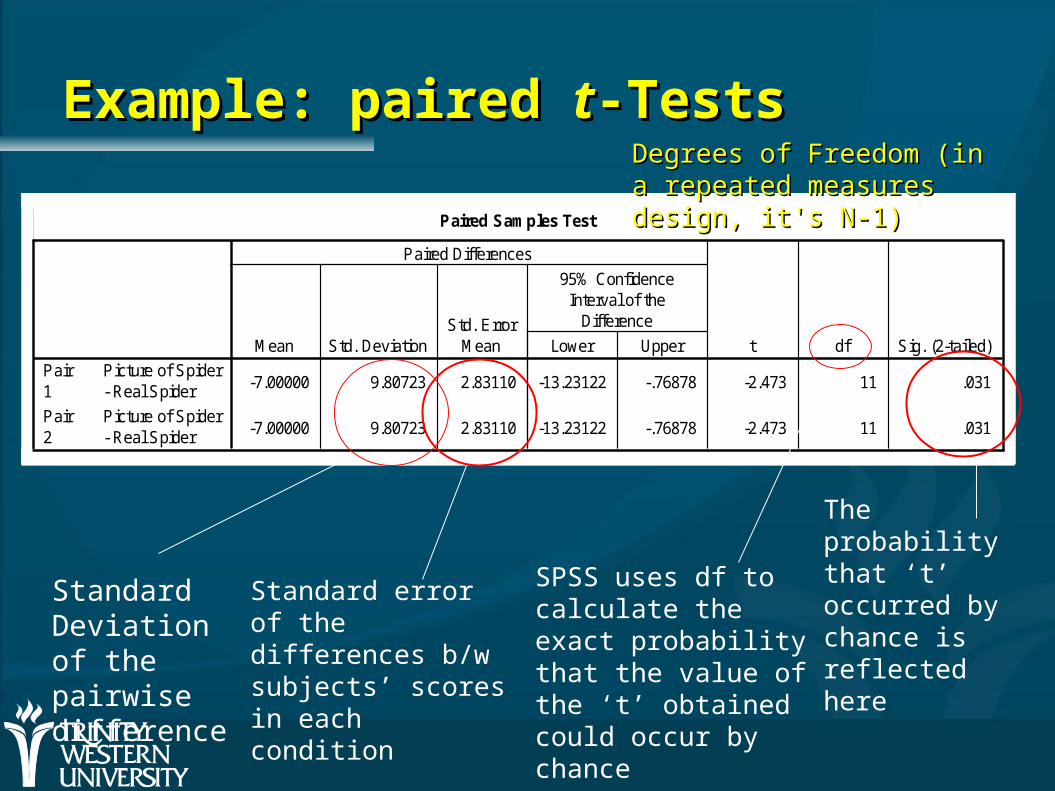
Example: paired Example: paired tt-Tests-Tests
Paired Samples Test
-7.00000 9.80723 2.83110 -13.23122 -.76878 -2.473 11 .031
-7.00000 9.80723 2.83110 -13.23122 -.76878 -2.473 11 .031
Picture of Spider- Real Spider
Pair1
Picture of Spider- Real Spider
Pair2
Mean Std. DeviationStd. Error
Mean Lower Upper
95% ConfidenceInterval of the
Difference
Paired Differences
t df Sig. (2-tailed)
Standard Deviation of the pairwise difference
Standard error of the differences b/w subjects’ scores in each condition
Degrees of Freedom (in a Degrees of Freedom (in a repeated measures repeated measures design, it's N-1)design, it's N-1)
SPSS uses df to calculate the exact probability that the value of the ‘t’ obtained could occur by chance
The probability that ‘t’ occurred by chance is reflected here

Example: indep samples Example: indep samples tt-test-test
Used in situations where there are 2 experimental conditions – and different participants are used in each condition
Example: SpiderBG.sav 12 spider phobes exposed to a picture of a
spider (picture); 12 different spider phobes exposed to a real-life tarantula
Anxiety was measured in each condition
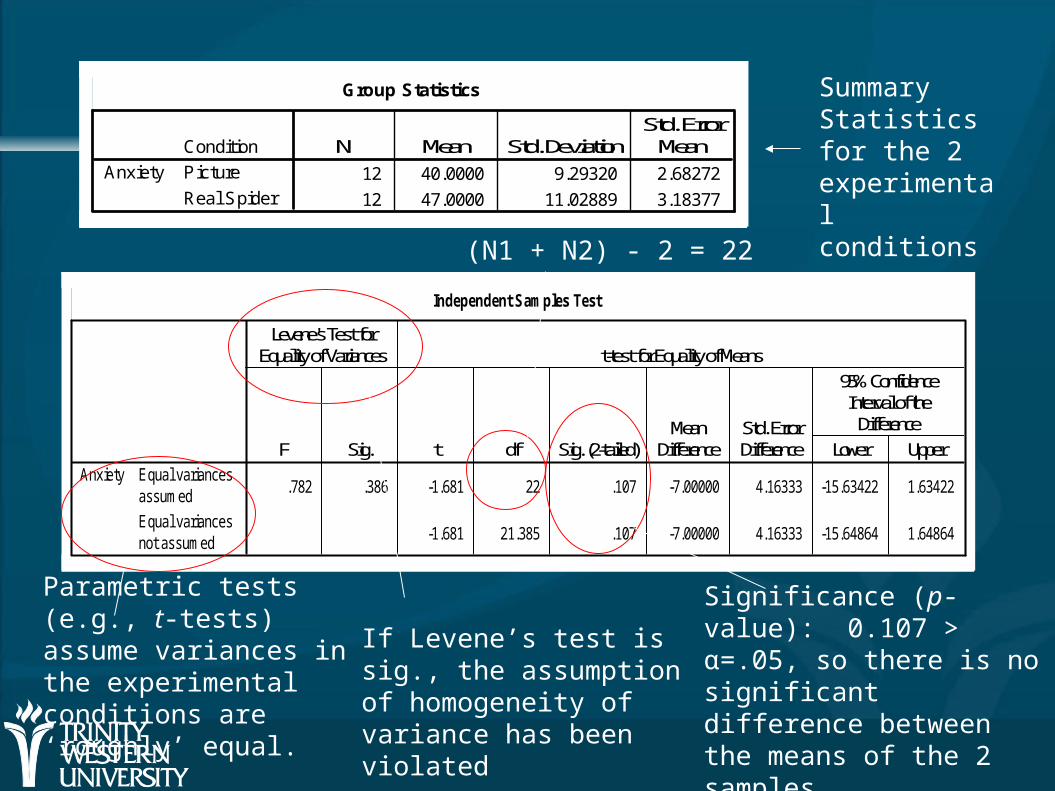
Group Statistics
12 40.0000 9.29320 2.68272
12 47.0000 11.02889 3.18377
ConditionPicture
Real Spider
AnxietyN Mean Std. Deviation
Std. ErrorMean
Independent Samples Test
.782 .386 -1.681 22 .107 -7.00000 4.16333 -15.63422 1.63422
-1.681 21.385 .107 -7.00000 4.16333 -15.64864 1.64864
Equal variancesassumed
Equal variancesnot assumed
AnxietyF Sig.
Levene's Test forEquality of Variances
t df Sig. (2-tailed)Mean
DifferenceStd. ErrorDifference Lower Upper
95% ConfidenceInterval of theDifference
t-test for Equality of Means
Summary Statistics for the 2 experimental conditions
Parametric tests (e.g., t-tests) assume variances in the experimental conditions are ‘roughly’ equal.
If Levene’s test is sig., the assumption of homogeneity of variance has been violated
(N1 + N2) - 2 = 22
Significance (p-value): 0.107 > α=.05, so there is no significant difference between the means of the 2 samples
18 Sep 200918 Sep 2009CPSY501: "Big 4"CPSY501: "Big 4" 1717
Outline for todayOutline for today
Stats review: Correlation (Pearson, Spearman) t-tests (indep, paired)
Discussion of research article (Missirlian et al) The “Big 4”:
Statistical significance (p-value, α) Effect size Power Finding needed sample size
SPSS tips

Practice reading articlePractice reading article
For practice, try reading this journal article, focusing on their statistical methods: see how much you can understand
Missirlian, et al., “Emotional Arousal, Client Perceptual Processing, and the Working Alliance in Experiential Psychotherapy for Depression”, Journal of Consulting and Clinical Psychology, Vol. 73, No. 5, pp. 861–871, 2005.
Download from website, under today's lecture
For discussion:For discussion:
What research questions do the authors state that they are addressing?
What analytical strategy was used, and how appropriate is it for addressing their questions?
What were their main conclusions, and are these conclusions warranted from the actual results /statistics /analyses that were reported?
What, if any, changes/additions need to be made to the methods to give a more complete picture of the phenomenon of interest (e.g., sampling, description of analysis process, effect sizes, dealing with multiple comparisons, etc.)?
18 Sep 200918 Sep 2009CPSY501: "Big 4"CPSY501: "Big 4" 2020
Outline for todayOutline for today
Stats review: Correlation (Pearson, Spearman) t-tests (indep, paired)
Discussion of research article (Missirlian et al) The “Big 4”:
Statistical significance (p-value, α) Effect size Power Finding needed sample size
SPSS tips
18 Sep 200918 Sep 2009CPSY501: "Big 4"CPSY501: "Big 4" 2121
Central Themes of StatisticsCentral Themes of Statistics
Is there a real effect/relationship amongst certain variables?
How big is that effect?
We evaluate these by looking at Statistical significance (p-value) and
Effect size (r2, R2, η, μ1- μ2, etc.)
Along with sample size (n) and statistical power (1-β), these form the “Big 4” of any test
18 Sep 200918 Sep 2009CPSY501: "Big 4"CPSY501: "Big 4" 2222
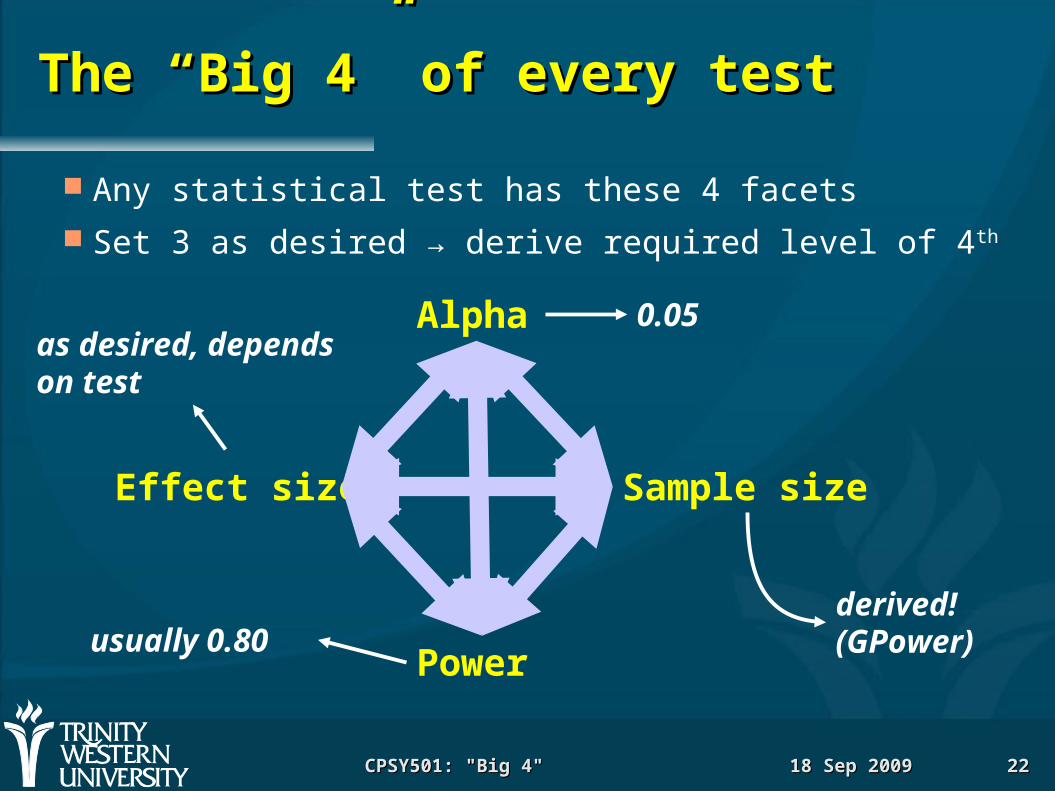
The “Big 4” of every testThe “Big 4” of every test
Any statistical test has these 4 facets Set 3 as desired → derive required level of 4th
Alpha
Sample sizeEffect size
Power
0.05as desired, depends on test
usually 0.80derived!(GPower)
18 Sep 200918 Sep 2009CPSY501: "Big 4"CPSY501: "Big 4" 2323
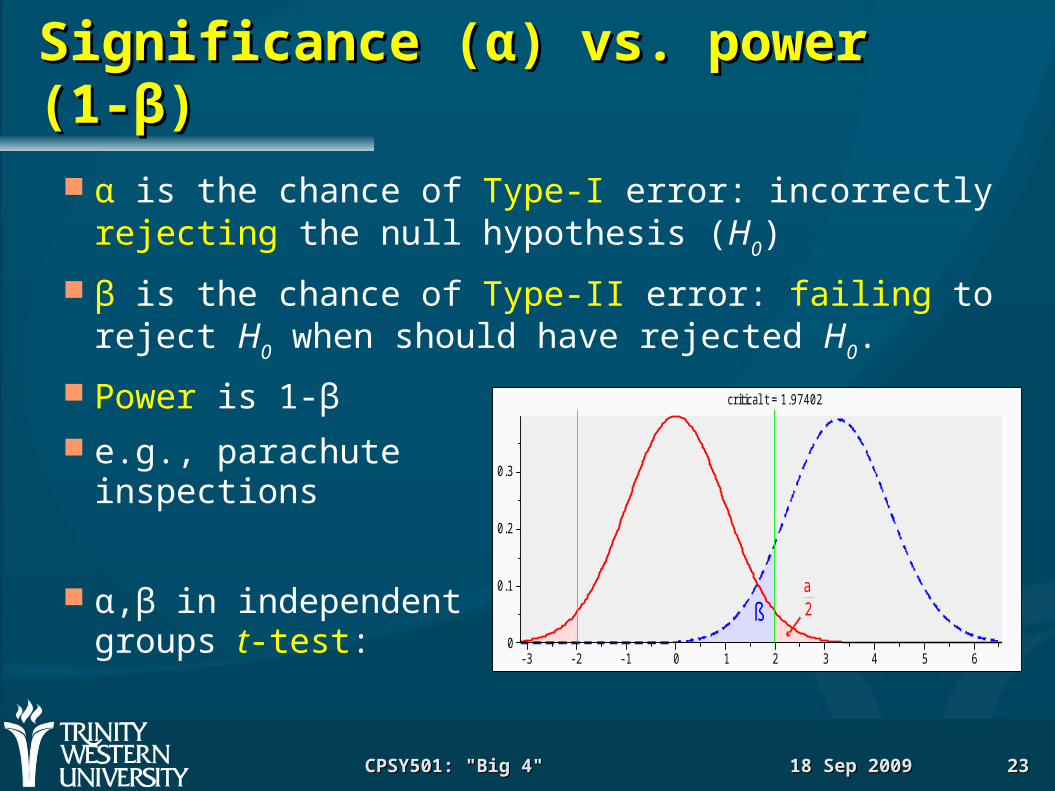
Significance (Significance (αα) vs. power (1-) vs. power (1-ββ))
α is the chance of Type-I error: incorrectly rejecting the null hypothesis (H0)
β is the chance of Type-II error: failing to reject H0 when should have rejected H0.
Power is 1-β e.g., parachute
inspections
α,β in independentgroups t-test:
0
0.1
0.2
0.3
- 3 - 2 - 1 0 1 2 3 4 5 6
critical t = 1.97402
a2ß
18 Sep 200918 Sep 2009CPSY501: "Big 4"CPSY501: "Big 4" 2424
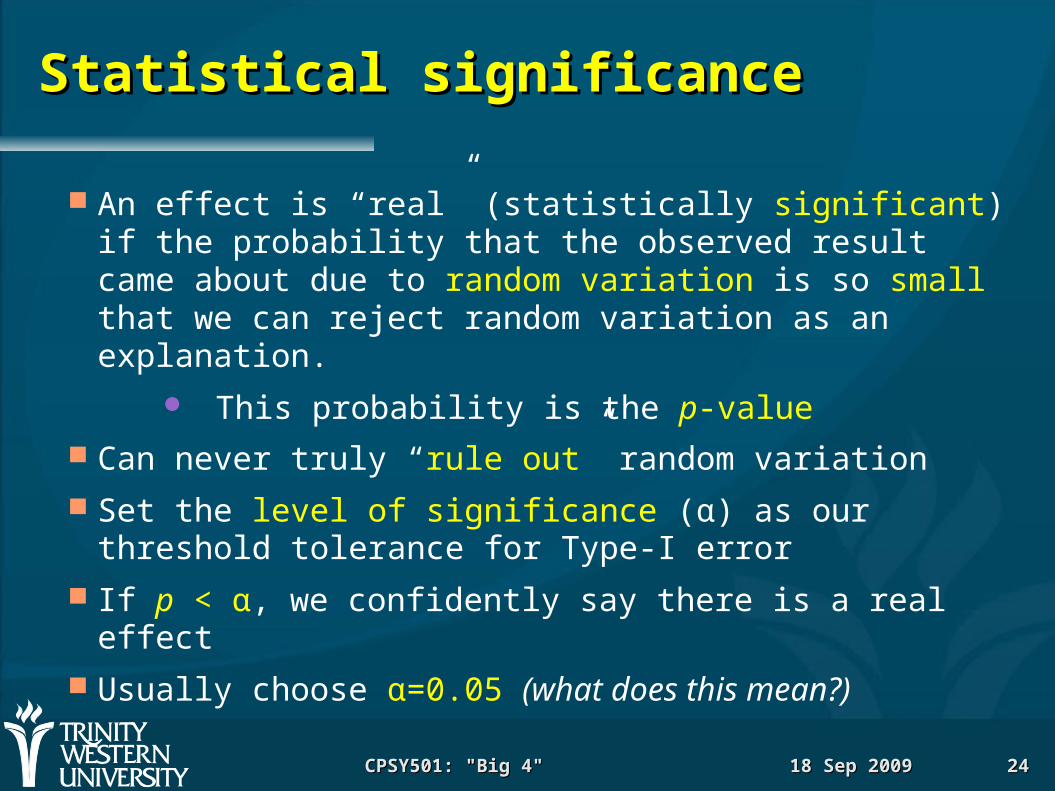
Statistical significanceStatistical significance
An effect is “real” (statistically significant) if the probability that the observed result came about due to random variation is so small that we can reject random variation as an explanation.
This probability is the p-value Can never truly “rule out” random variation Set the level of significance (α) as our threshold
tolerance for Type-I error If p < α, we confidently say there is a real effect Usually choose α=0.05 (what does this mean?)
18 Sep 200918 Sep 2009CPSY501: "Big 4"CPSY501: "Big 4" 2525
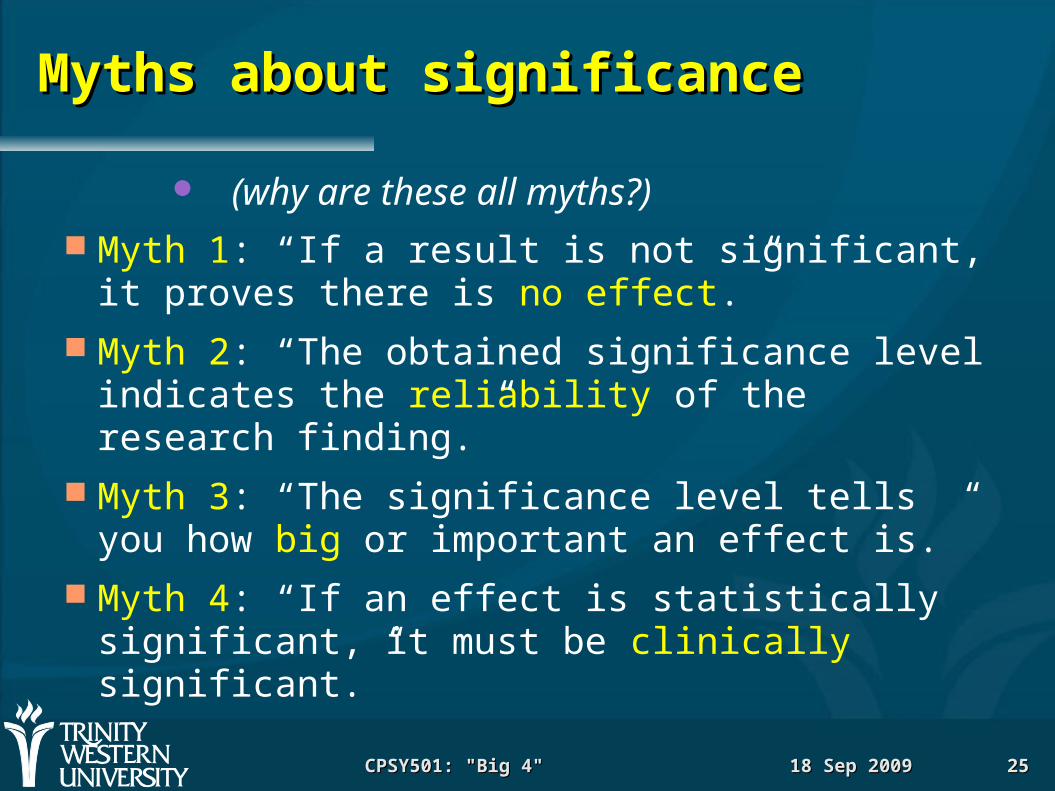
Myths about significanceMyths about significance
(why are these all myths?) Myth 1: “If a result is not significant, it proves
there is no effect.” Myth 2: “The obtained significance level
indicates the reliability of the research finding.” Myth 3: “The significance level tells you how big
or important an effect is.” Myth 4: “If an effect is statistically significant, it
must be clinically significant.”
18 Sep 200918 Sep 2009CPSY501: "Big 4"CPSY501: "Big 4" 2626
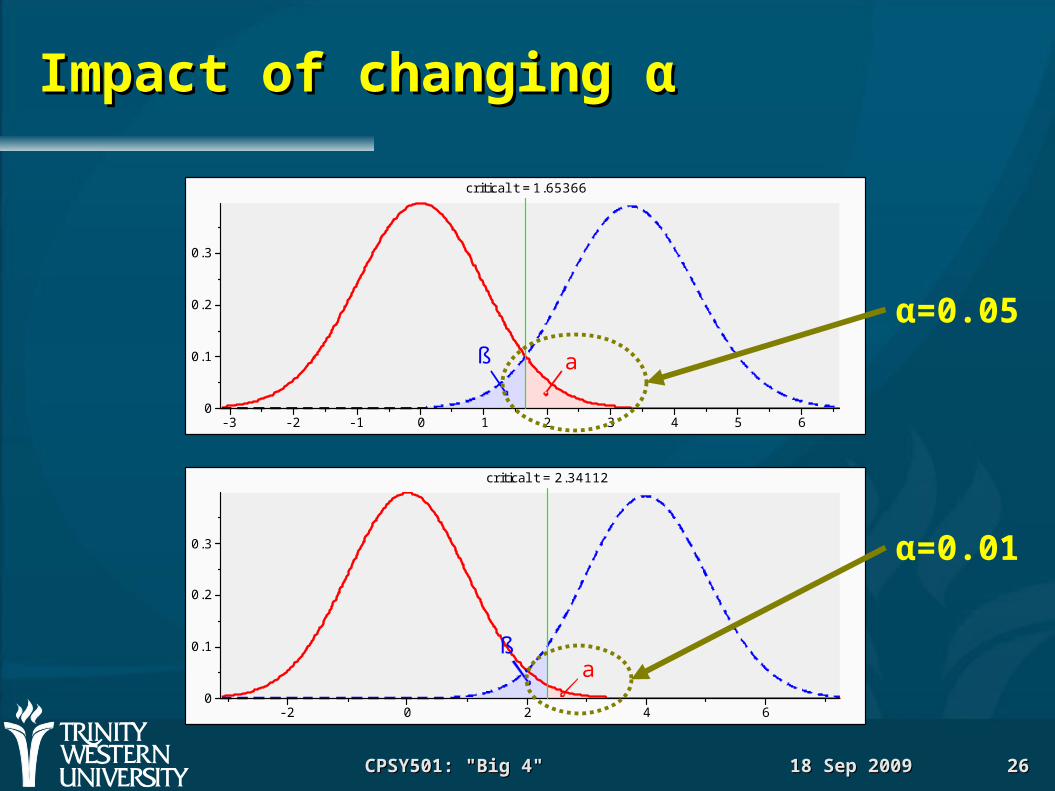
Impact of changing Impact of changing αα
0
0.1
0.2
0.3
- 3 - 2 - 1 0 1 2 3 4 5 6
critical t = 1.65366
aß
0
0.1
0.2
0.3
- 2 0 2 4 6
critical t = 2.34112
aß
α=0.05
α=0.01
18 Sep 200918 Sep 2009CPSY501: "Big 4"CPSY501: "Big 4" 2727
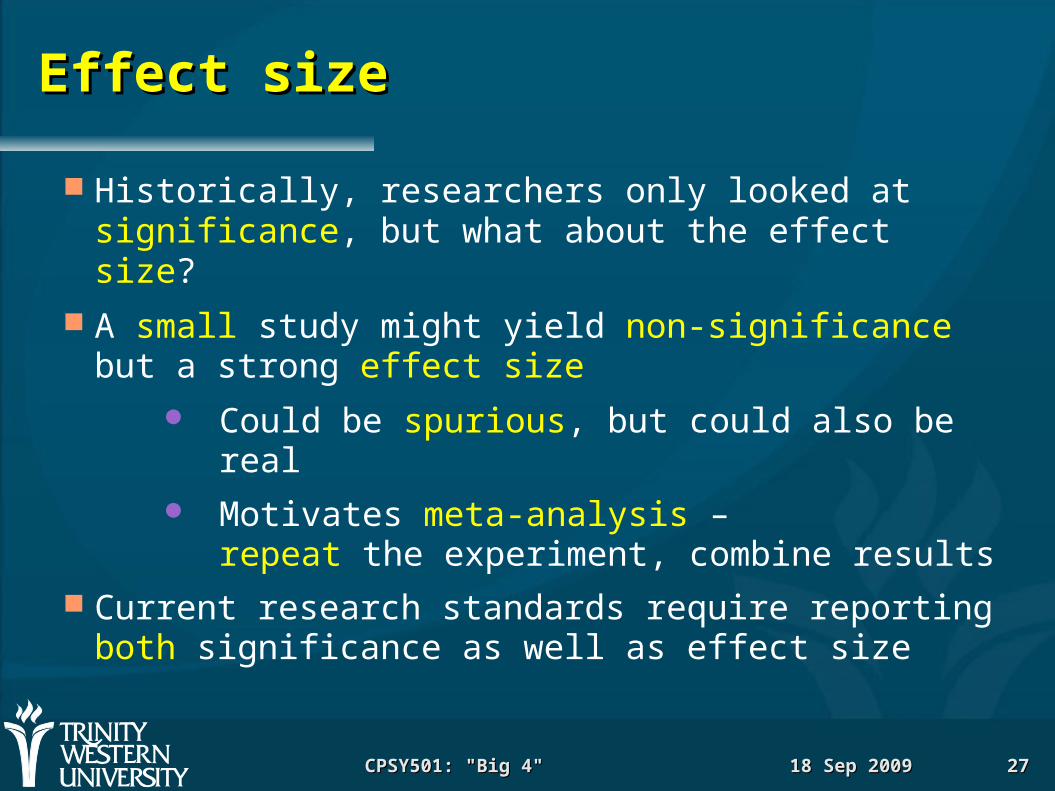
Effect sizeEffect size
Historically, researchers only looked at significance, but what about the effect size?
A small study might yield non-significance but a strong effect size
Could be spurious, but could also be real Motivates meta-analysis –
repeat the experiment, combine results Current research standards require reporting
both significance as well as effect size
18 Sep 200918 Sep 2009CPSY501: "Big 4"CPSY501: "Big 4" 2828
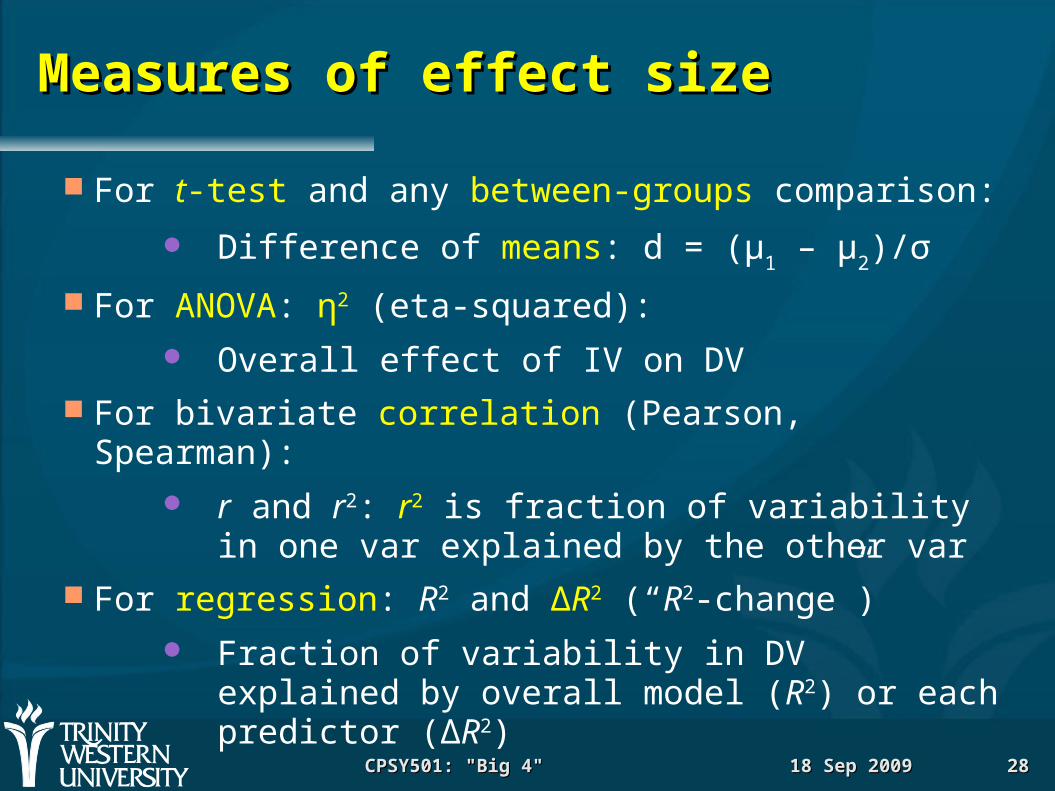
Measures of effect sizeMeasures of effect size
For t-test and any between-groups comparison:
Difference of means: d = (μ1 – μ2)/σ
For ANOVA: η2 (eta-squared): Overall effect of IV on DV
For bivariate correlation (Pearson, Spearman): r and r2: r2 is fraction of variability in one
var explained by the other var For regression: R2 and ΔR2 (“R2-change”)
Fraction of variability in DV explained by overall model (R2) or each predictor (ΔR2)
18 Sep 200918 Sep 2009CPSY501: "Big 4"CPSY501: "Big 4" 2929
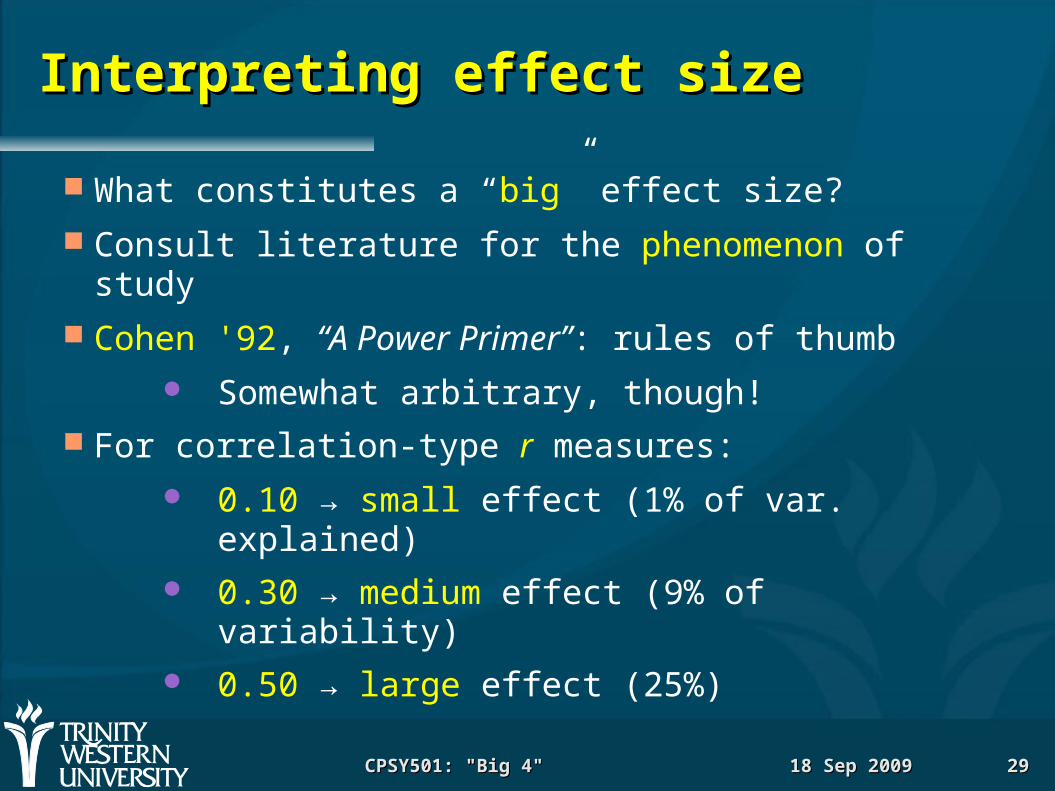
Interpreting effect sizeInterpreting effect size
What constitutes a “big” effect size? Consult literature for the phenomenon of study Cohen '92, “A Power Primer”: rules of thumb
Somewhat arbitrary, though! For correlation-type r measures:
0.10 → small effect (1% of var. explained)
0.30 → medium effect (9% of variability) 0.50 → large effect (25%)
18 Sep 200918 Sep 2009CPSY501: "Big 4"CPSY501: "Big 4" 3030
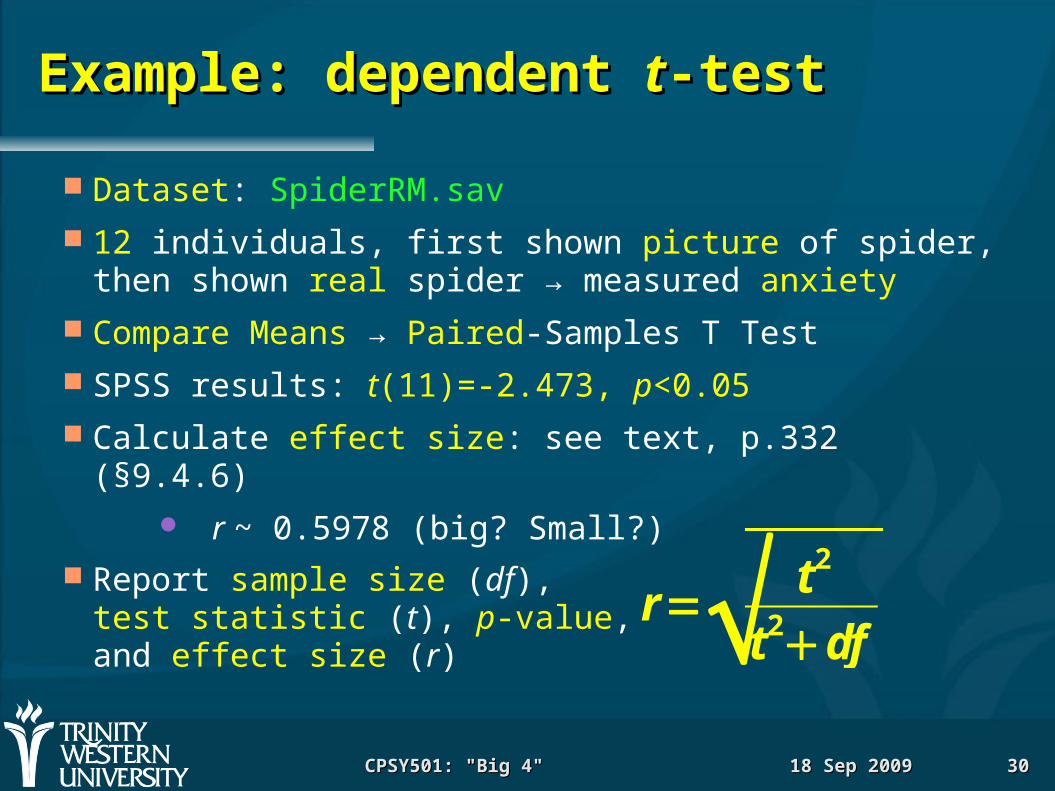
Example: dependent Example: dependent tt-test-test
Dataset: SpiderRM.sav 12 individuals, first shown picture of spider,
then shown real spider → measured anxiety Compare Means → Paired-Samples T Test SPSS results: t(11)=-2.473, p<0.05 Calculate effect size: see text, p.332 (§9.4.6)
r ~ 0.5978 (big? Small?) Report sample size (df),
test statistic (t), p-value,and effect size (r)
r= t 2
t 2df
18 Sep 200918 Sep 2009CPSY501: "Big 4"CPSY501: "Big 4" 3131
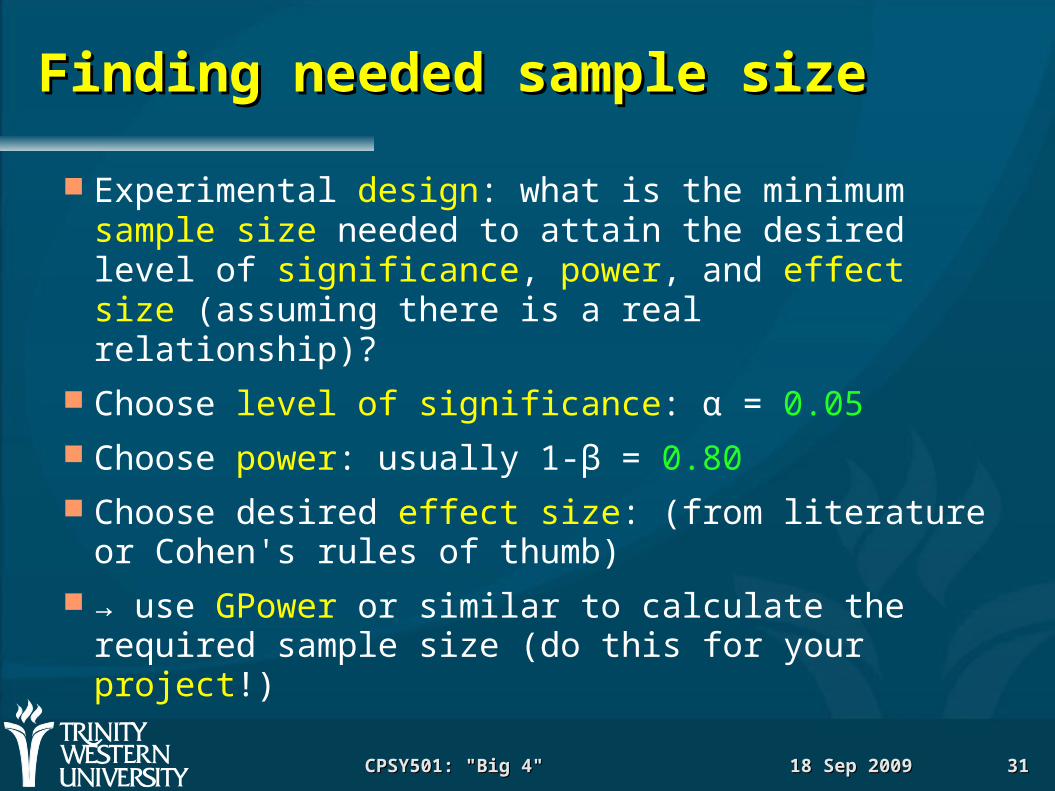
Finding needed sample sizeFinding needed sample size
Experimental design: what is the minimum sample size needed to attain the desired level of significance, power, and effect size (assuming there is a real relationship)?
Choose level of significance: α = 0.05 Choose power: usually 1-β = 0.80 Choose desired effect size: (from literature or
Cohen's rules of thumb) → use GPower or similar to calculate the
required sample size (do this for your project!)
18 Sep 200918 Sep 2009CPSY501: "Big 4"CPSY501: "Big 4" 3232
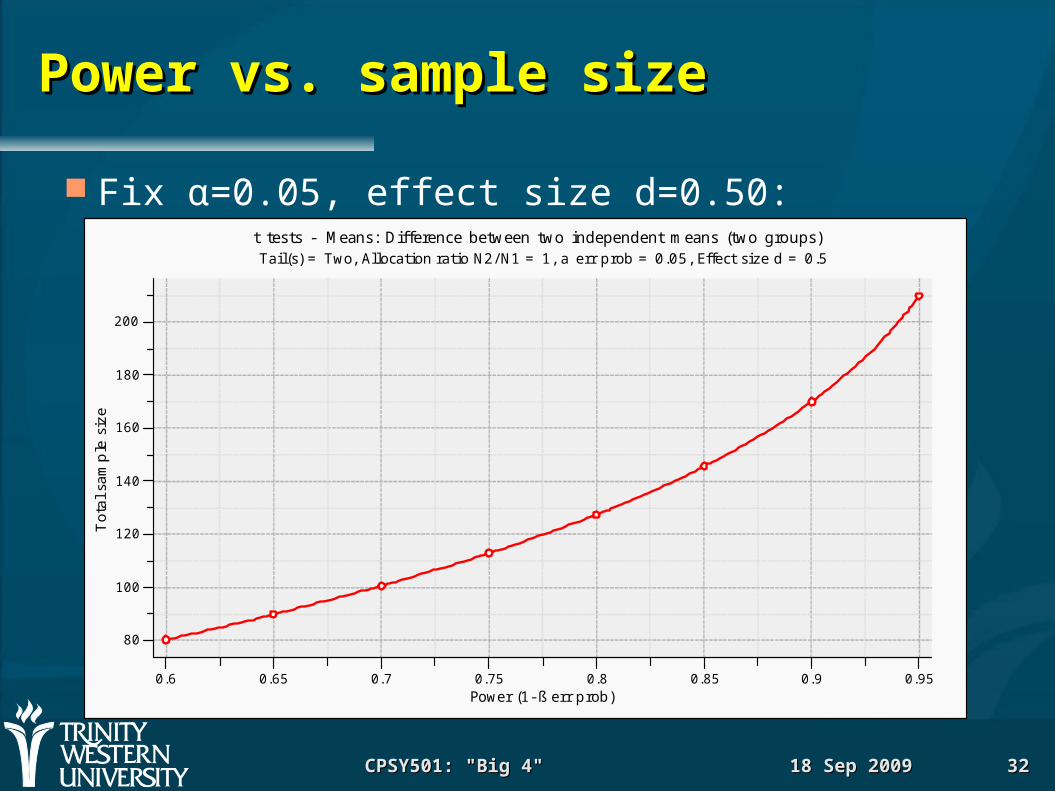
Power vs. sample sizePower vs. sample size
Fix α=0.05, effect size d=0.50:
Power (1- ß err prob)
Tota
l sa
mp
le s
ize
t tests - Means: Difference between two independent means (two groups)Tail(s) = Two, Allocation ratio N2/ N1 = 1, a err prob = 0.05, Effect size d = 0.5
80
100
120
140
160
180
200
0.6 0.65 0.7 0.75 0.8 0.85 0.9 0.95
18 Sep 200918 Sep 2009CPSY501: "Big 4"CPSY501: "Big 4" 3333
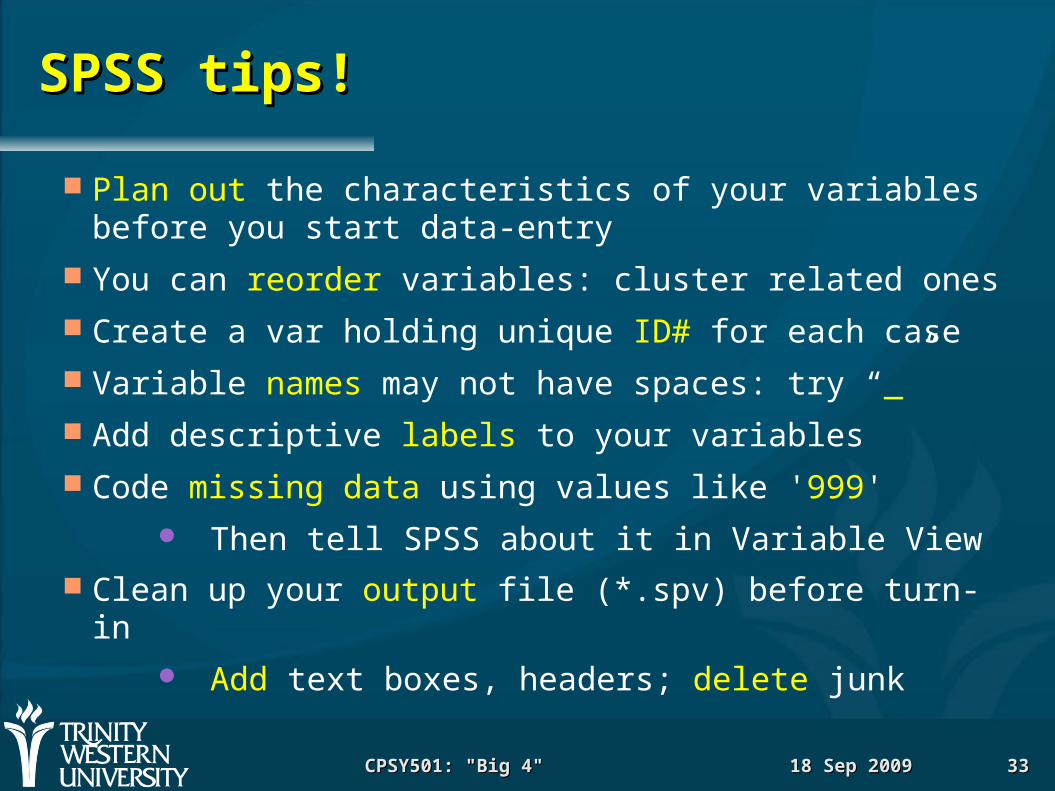
SPSS tips!SPSS tips!
Plan out the characteristics of your variables before you start data-entry
You can reorder variables: cluster related ones Create a var holding unique ID# for each case Variable names may not have spaces: try “_” Add descriptive labels to your variables Code missing data using values like '999'
Then tell SPSS about it in Variable View Clean up your output file (*.spv) before turn-in
Add text boxes, headers; delete junk


![Our Week at Math Camp Abridged Group 2π = [Erin Groark, Sarah Lynn Joyner, Dario Varela, Sean Wilkoff]](https://static.fdocument.org/doc/165x107/56649f175503460f94c2d24c/our-week-at-math-camp-abridged-group-2-erin-groark-sarah-lynn-joyner.jpg)