Tests about a Population Mean σ unkown. p. 745 1,2,3 p. 754 5,6,7.
26
Chapter Twelve Day One Tests about a Population Mean σ unkown
-
Upload
ella-sherman -
Category
Documents
-
view
221 -
download
0
Transcript of Tests about a Population Mean σ unkown. p. 745 1,2,3 p. 754 5,6,7.

Chapter Twelve Day One
Tests about a Population Mean σ unkown

Homework
p. 745 1,2,3p. 754 5,6,7
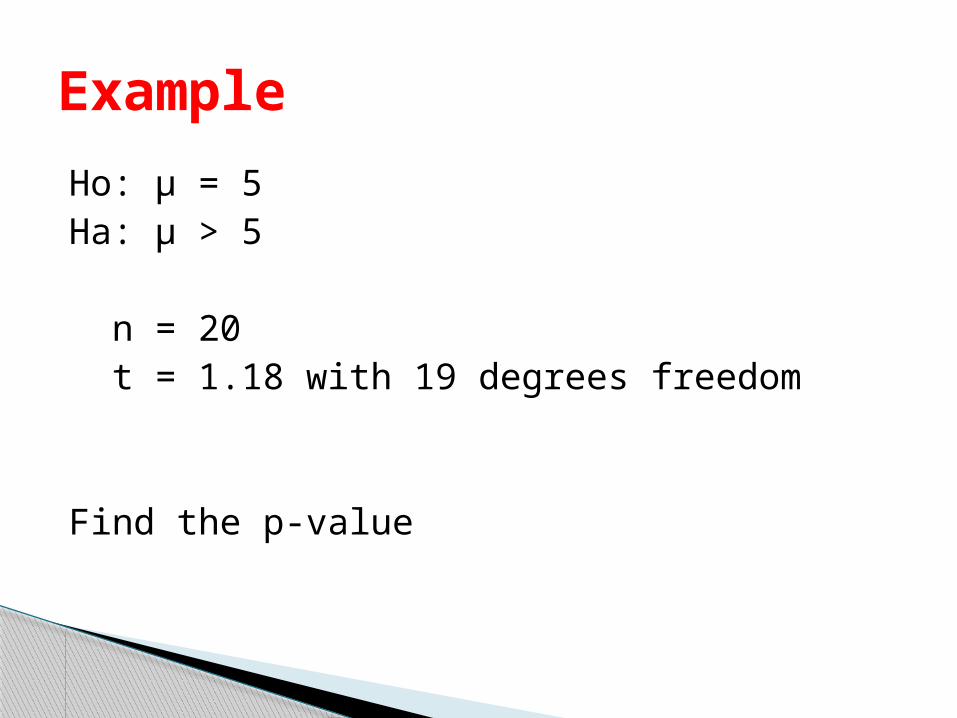
Example
Ho: µ = 5Ha: µ > 5
n = 20 t = 1.18 with 19 degrees freedom
Find the p-value

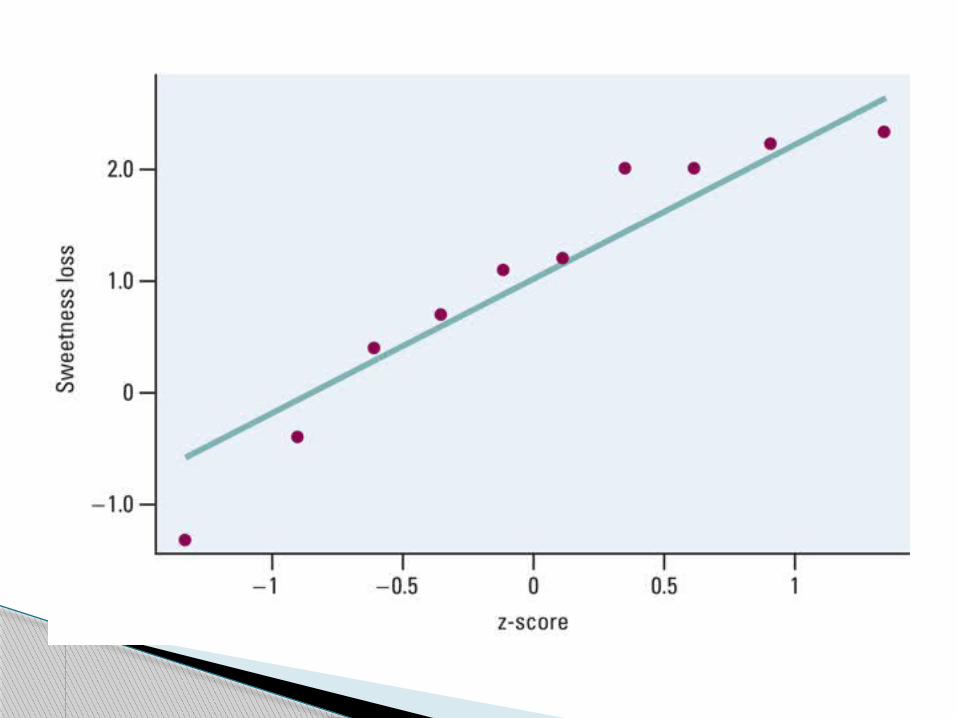
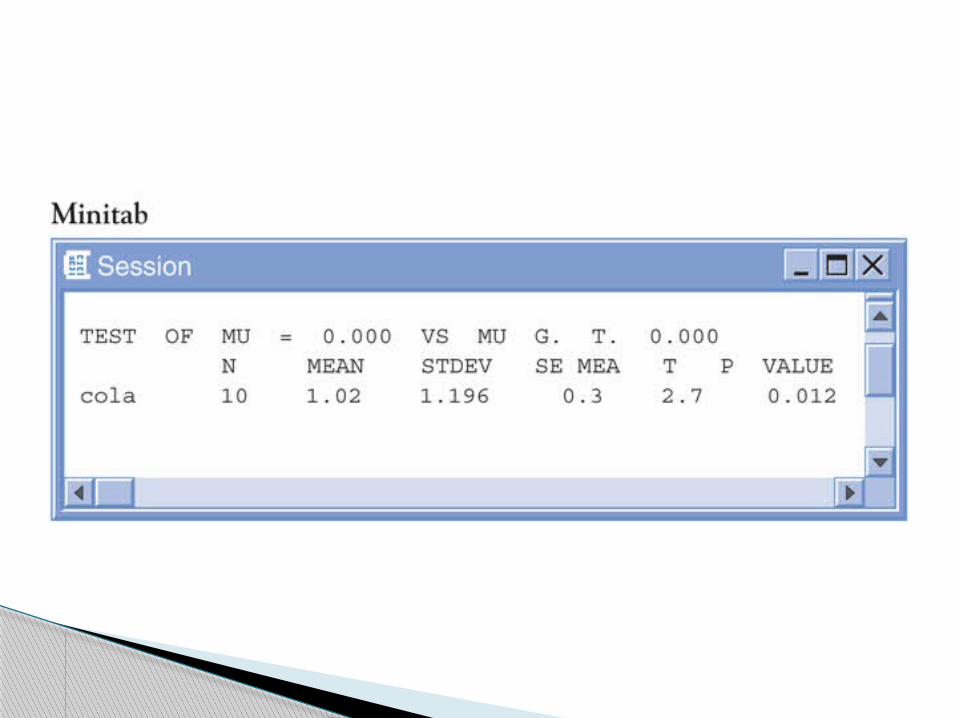
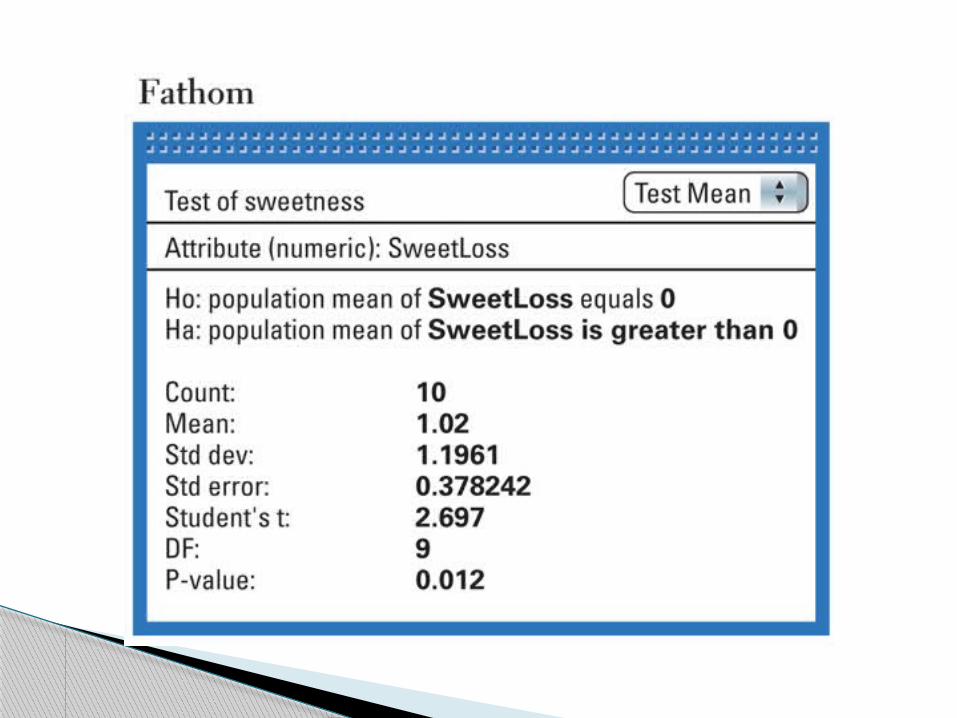
Diet colas use artificial sweeteners to avoid sugar. These sweeteners gradually lose their sweetness over time. Manufacturers therefore test new colas for loss of sweetness before marketing them. Trained tasters sip the cola along with drinks of standard sweetness and score the colas on the sweetness scale of 1 to 10. The cola is then stored for a month at high temperature to imitate the effect of four months’ storage at room temperature. Each taster scores the cola again after storage. Our data are the differences (score before storage minus score after storage) in the tasters’ scores. The bigger the difference, the bigger the loss of sweetness. Here are the sweetness losses for a new cola, as measured b 10 trained tasters.
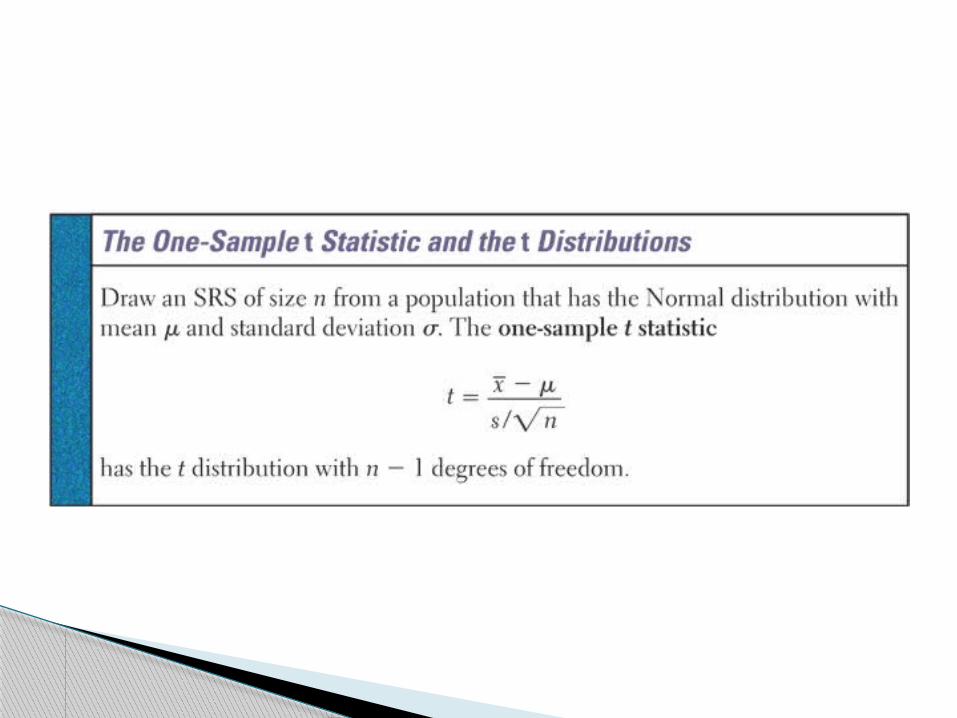
The One Sample t Test
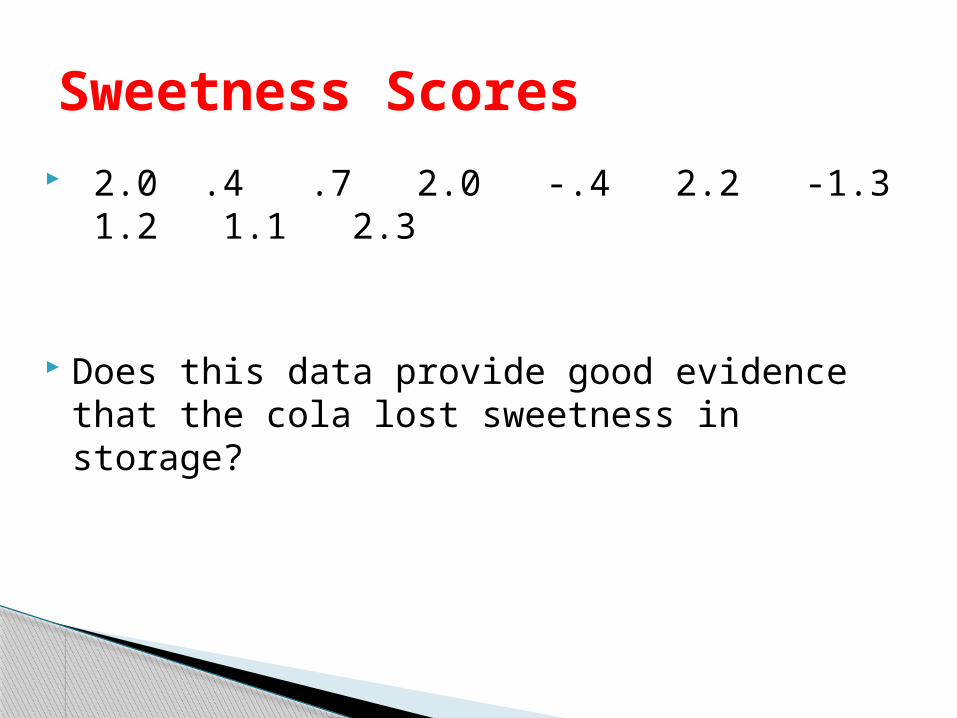
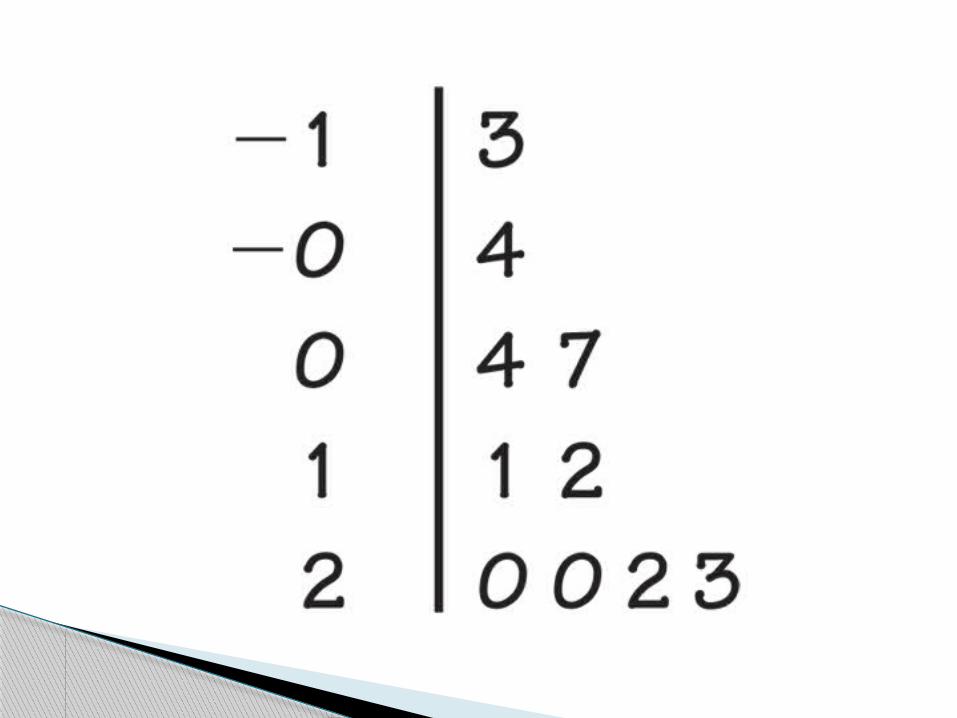
2.0 .4 .7 2.0 -.4 2.2 -1.3 1.2 1.1 2.3
Does this data provide good evidence that the cola lost sweetness in storage?
Sweetness Scores

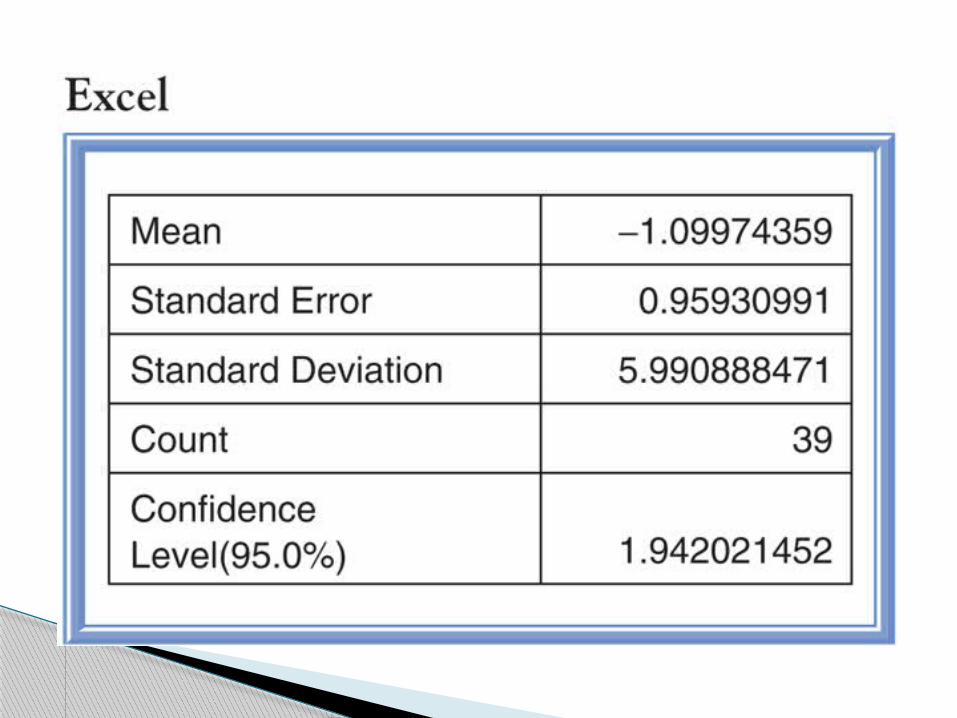
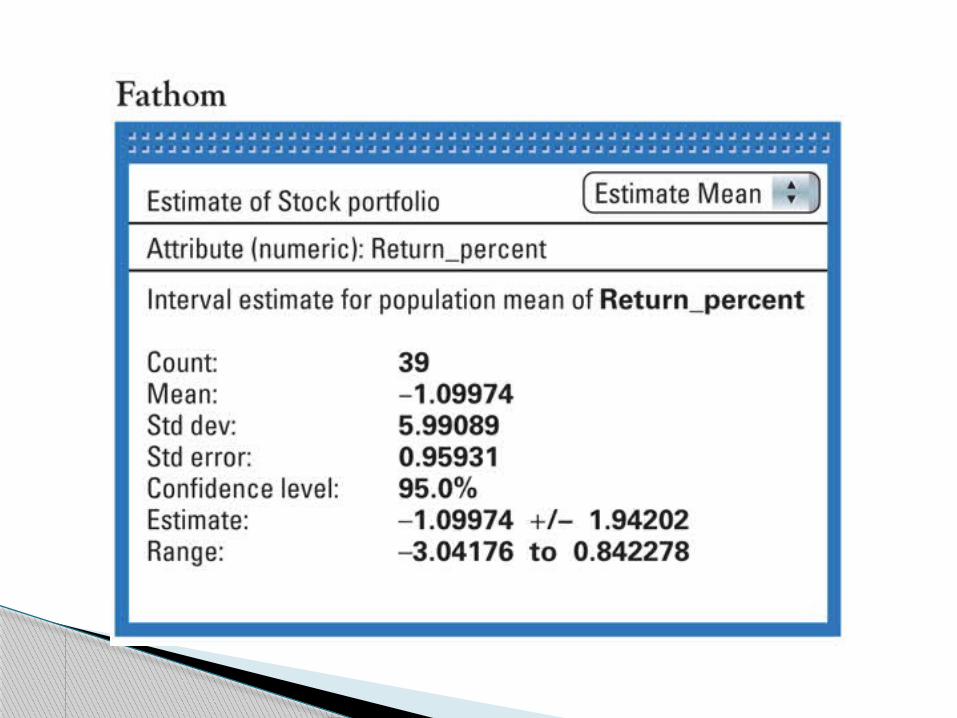
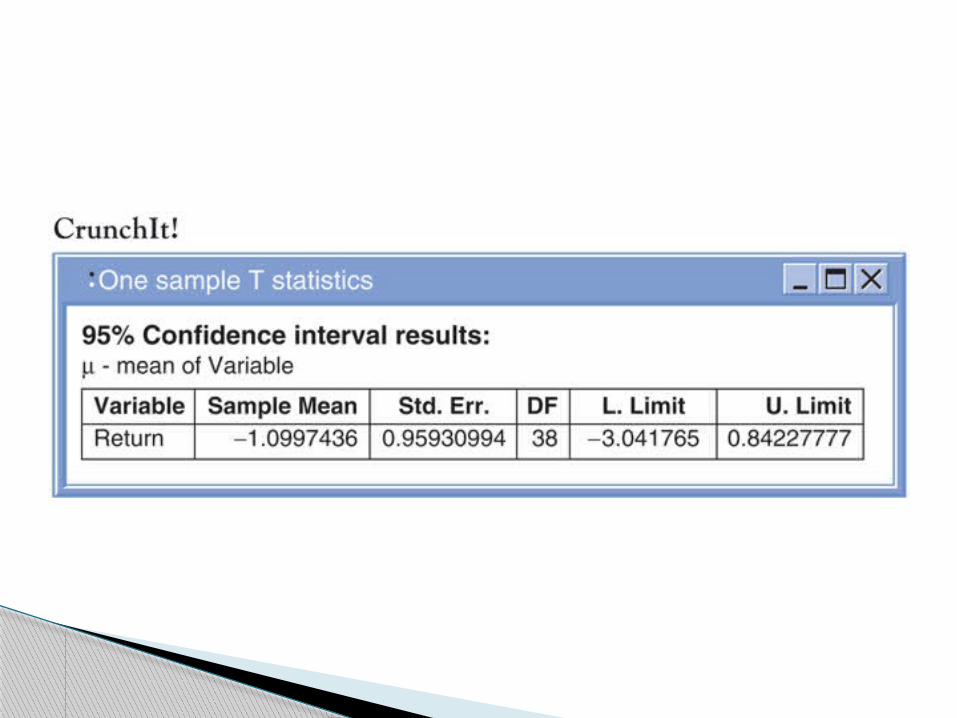
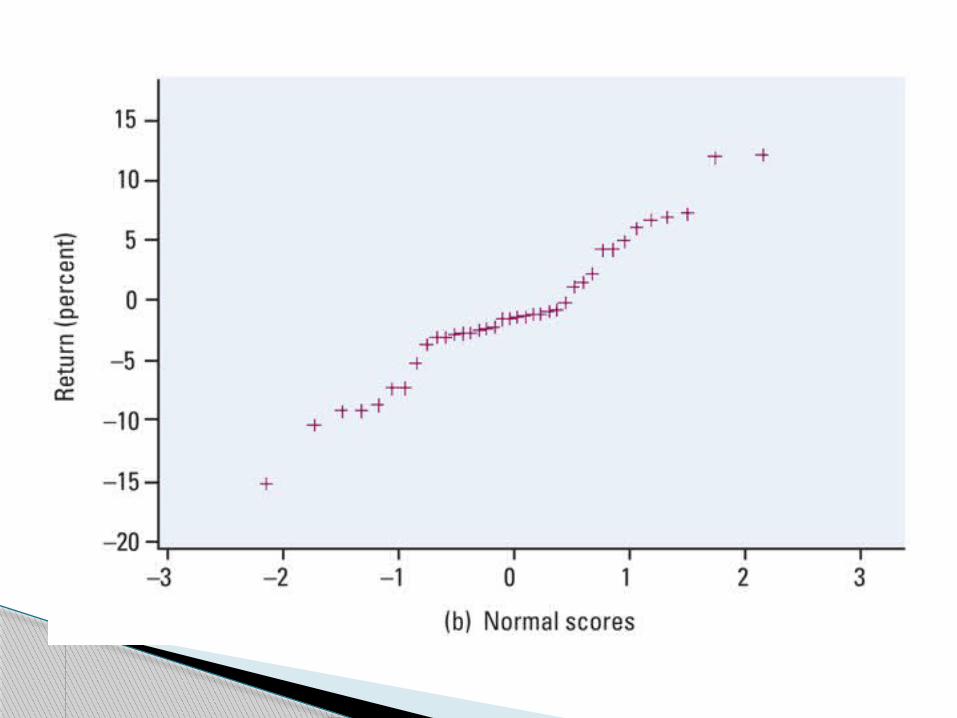
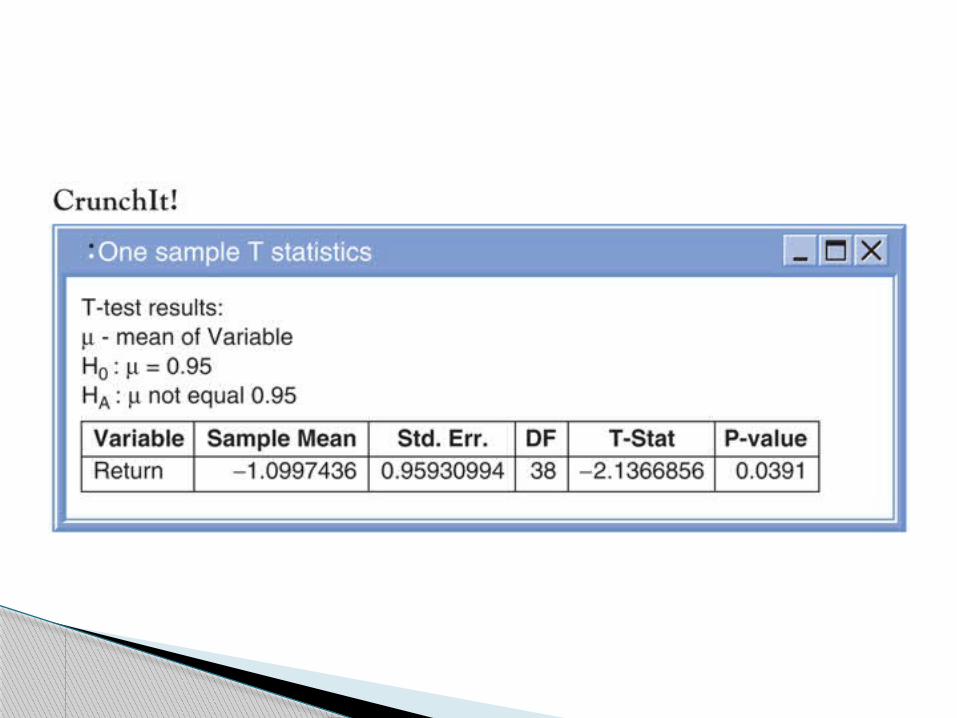
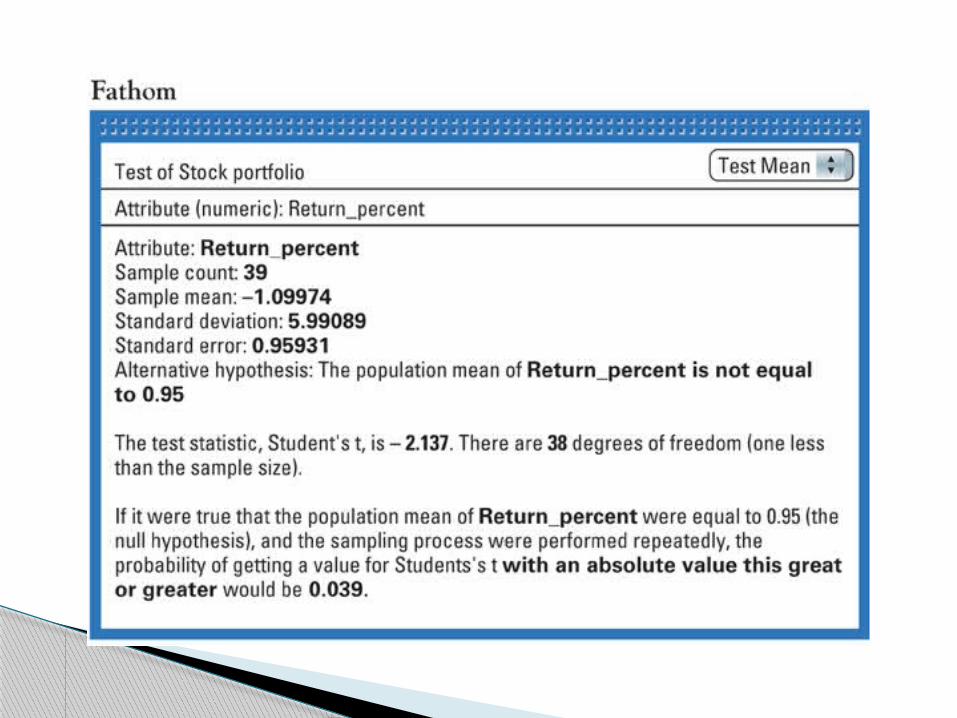
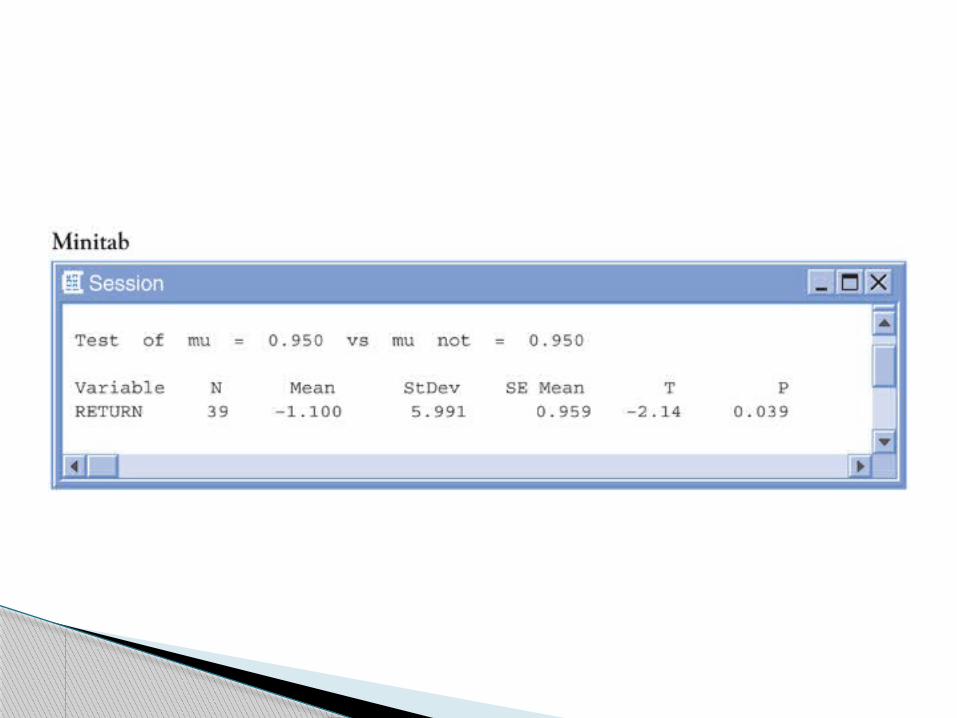
An investor with a stock portfolio worth several hundred thousand dollars sued his broker because lack of diversification in his portfolio led to poor performance. The following table give the rates of return for the 39 months that the account was managed by the broker. An arbitration panel compared these returns with the average of the Standard & Poor’s 500 stock index for the same period. Consider the 39 monthly returns as a random sample from the monthly returns the broker would generate if he managed the account forever. Are these returns compatible with a population mean µ = .95%?, the S&P 500 average?
Example
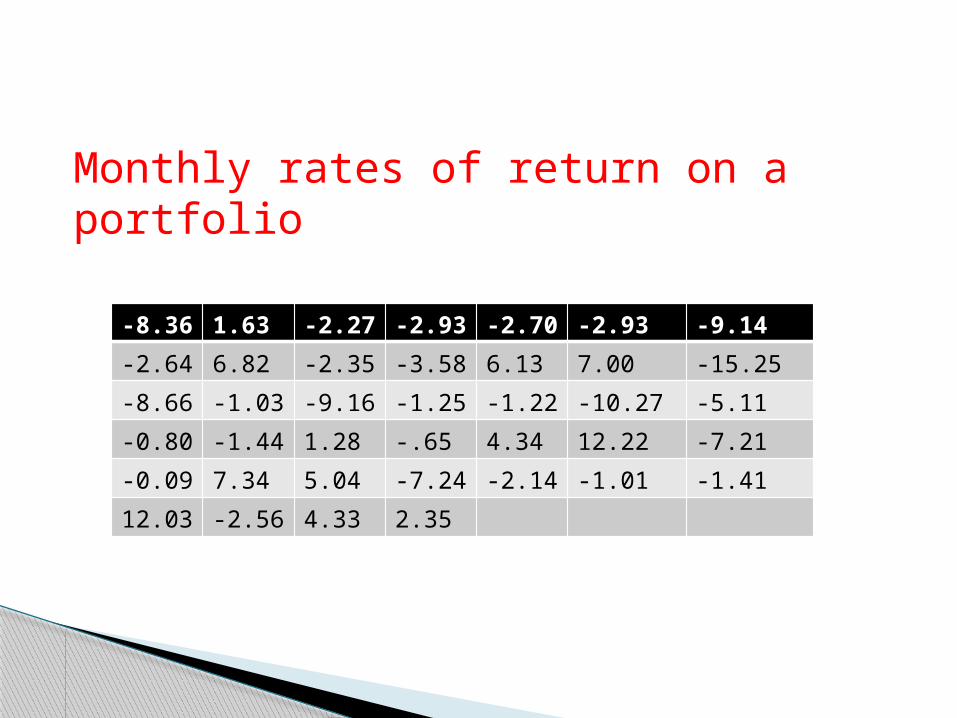
Monthly rates of return on a portfolio
-8.36 1.63 -2.27 -2.93 -2.70 -2.93 -9.14
-2.64 6.82 -2.35 -3.58 6.13 7.00 -15.25
-8.66 -1.03 -9.16 -1.25 -1.22 -10.27 -5.11
-0.80 -1.44 1.28 -.65 4.34 12.22 -7.21
-0.09 7.34 5.04 -7.24 -2.14 -1.01 -1.41
12.03 -2.56 4.33 2.35
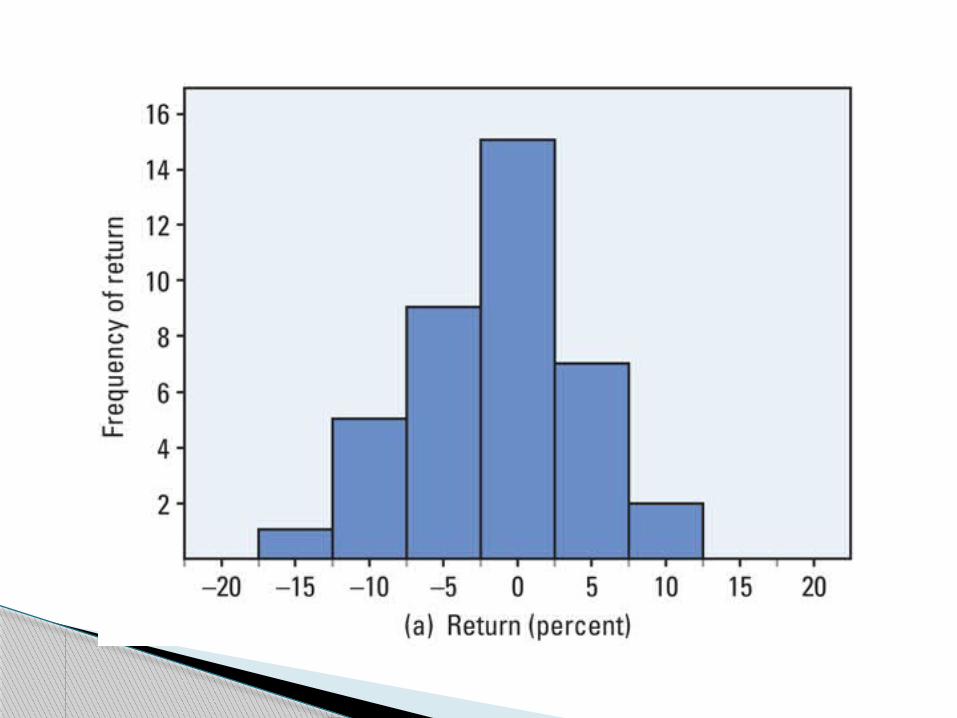

Example Construct a 95% Confidence interval for the
true mean monthly rate of return.