Technical Memorandum - Home Page | California State … · flow rating for a 36 inch check valve is...
16
Solving flow problems since 1894 ALDEN Research Laboratory, Inc. Massachusetts | Colorado | Oregon | Washington 30 Shrewsbury Street, Holden, Massachusetts 01520-1843 508-829-6000 • www.aldenlab.com Technical Memorandum To: Mr. Patrick Crain and Ms. Josie McKinely, Poseidon From: George Hecker, Brian McMahon and Greg Allen, Alden Date: March 22, 2017 Re: Summary of Head Loss Calculations for the Poseidon Huntington Beach Desalination Plant Discharge System Alden Research Laboratory, Inc. (Alden) has evaluated Poseidon Water Surfside’s (Poseidon) proposed discharge system to determine hydraulic losses for the Huntington Beach Desalination Plant (HBDP). This review combines previous efforts by Alden in evaluating the hydraulic conditions of HBDP brine discharge system and diffuser design. Specifically, we evaluated the offshore portion of the system and diffuser design in a Memo dated February 16, 2017 (Alden, 2017) and more recently we have evaluated the onshore portion of the HBDP discharge system. This memo combines and provides a summary of our evaluation of head losses for both the offshore and onshore portions of the system. The HBDP is to be constructed at the site of the existing Huntington Beach Generating Station (HBGS) and will use some of the existing HBGS cooling water system infrastructure. HBDP brine discharge will tie into the existing HBGS cooling water discharge system at Station 1, shown on Figure 1. Our understanding of the onshore portion of the HBGS existing discharge system is presented on Figure 1 to Figure 3. The existing 14-ft diameter conduit to the discharge tower will remain in place and be used by the HBDP. Some changes will be made to the top of the outlet tower: the existing grating and top modular rings of the tower will be removed and replaced with a new diffuser cap, as shown on Figure 6. The goal of the evaluation is to provide head loss calculations and a hydraulic grade line through the system from the discharge point in the ocean to station 1, where HBDP ties into the existing system. This information will allow Poseidon to further their design of the HBDP brine discharge system upstream of station 1. Assumptions for Head Loss Calculations HBDP stand-alone operation Total brine discharge flow of 127 MGD HBDP tie in at Station 1, shown on Figure 1
-
Upload
phungnguyet -
Category
Documents
-
view
215 -
download
0
Transcript of Technical Memorandum - Home Page | California State … · flow rating for a 36 inch check valve is...
Solving flow problems since 1894
ALDEN Research Laboratory, Inc. Massachusetts | Colorado | Oregon | Washington 30 Shrewsbury Street, Holden, Massachusetts 01520-1843 508-829-6000 • www.aldenlab.com
Technical Memorandum
To: Mr. Patrick Crain and Ms. Josie McKinely, Poseidon
From: George Hecker, Brian McMahon and Greg Allen, Alden
Date: March 22, 2017
Re: Summary of Head Loss Calculations for the Poseidon Huntington Beach Desalination Plant Discharge System
Alden Research Laboratory, Inc. (Alden) has evaluated Poseidon Water Surfside’s (Poseidon) proposed discharge system to determine hydraulic losses for the Huntington Beach Desalination Plant (HBDP). This review combines previous efforts by Alden in evaluating the hydraulic conditions of HBDP brine discharge system and diffuser design. Specifically, we evaluated the offshore portion of the system and diffuser design in a Memo dated February 16, 2017 (Alden, 2017) and more recently we have evaluated the onshore portion of the HBDP discharge system. This memo combines and provides a summary of our evaluation of head losses for both the offshore and onshore portions of the system.
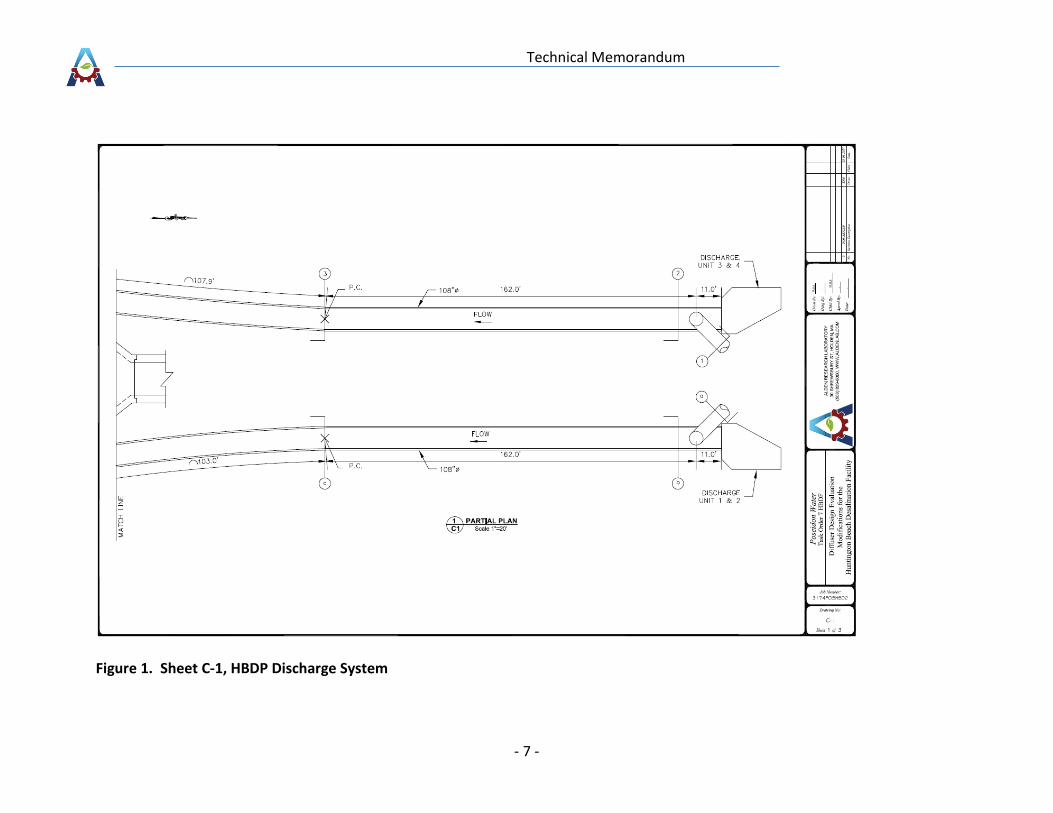
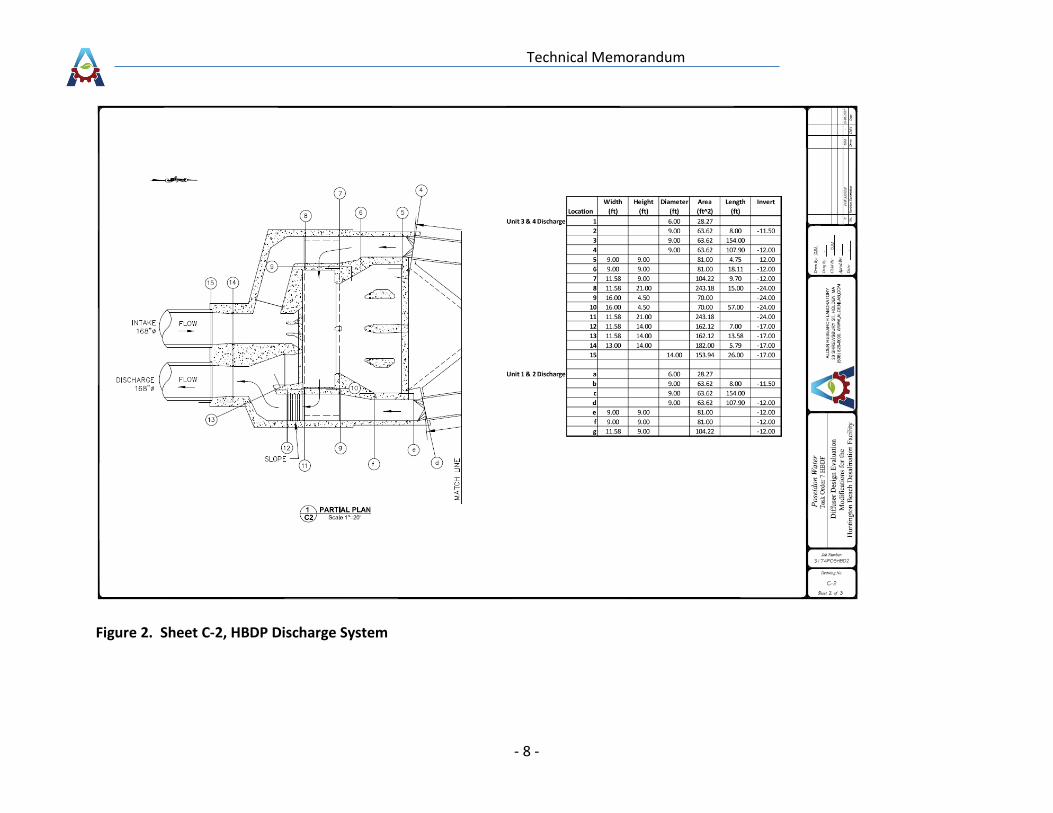
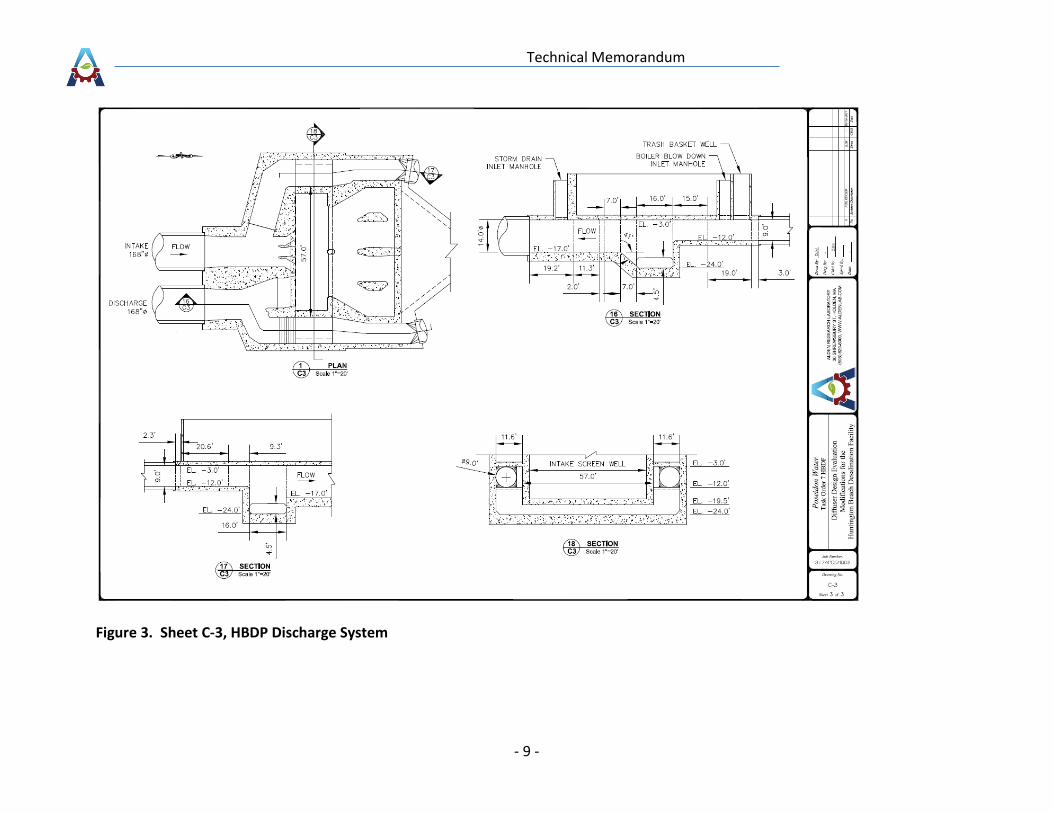
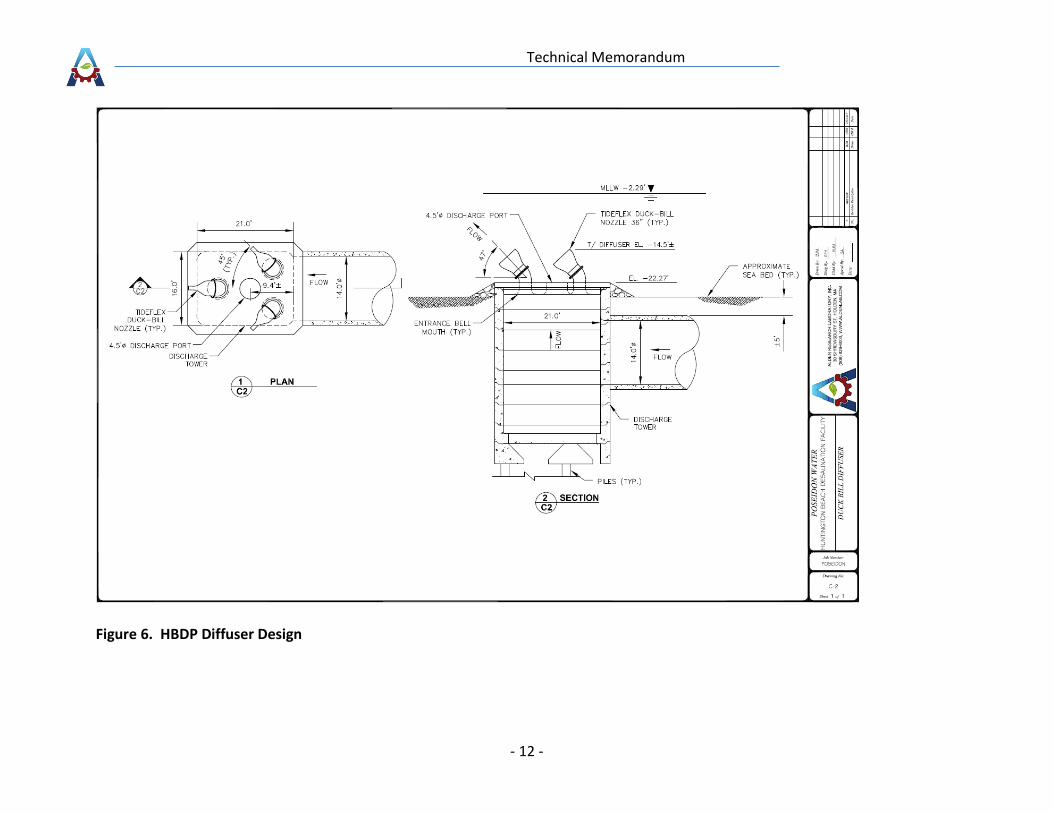
The HBDP is to be constructed at the site of the existing Huntington Beach Generating Station (HBGS) and will use some of the existing HBGS cooling water system infrastructure. HBDP brine discharge will tie into the existing HBGS cooling water discharge system at Station 1, shown on Figure 1. Our understanding of the onshore portion of the HBGS existing discharge system is presented on Figure 1 to Figure 3. The existing 14-ft diameter conduit to the discharge tower will remain in place and be used by the HBDP. Some changes will be made to the top of the outlet tower: the existing grating and top modular rings of the tower will be removed and replaced with a new diffuser cap, as shown on Figure 6.
The goal of the evaluation is to provide head loss calculations and a hydraulic grade line through the system from the discharge point in the ocean to station 1, where HBDP ties into the existing system. This information will allow Poseidon to further their design of the HBDP brine discharge system upstream of station 1.
Assumptions for Head Loss Calculations
HBDP stand-alone operation
Total brine discharge flow of 127 MGD
HBDP tie in at Station 1, shown on Figure 1
Technical Memorandum
- 2 -
(3) 36 inch Tideflex discharge valves on the diffuser cap presented in Alden’s February
16, 2017 Memo and shown in Figure 6.
HBGS cooling water discharge infrastructure as depicted in Figure 1 to Figure 3.
A friction coefficient depicting rough conduit wall surfaces (Mannings n = 0.025) and no
reduction in flow area due to bio growth.
HBDP Discharge System Losses
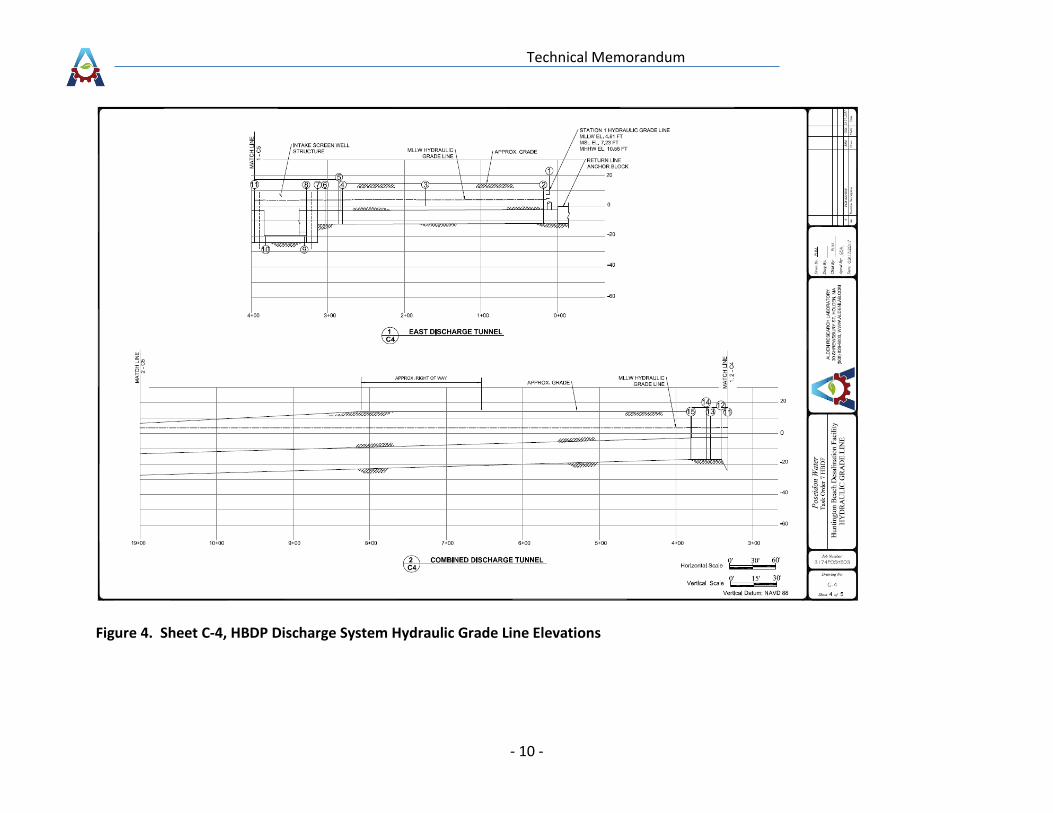
Head loss through the HBDP system was calculated from Station 1, just upstream of where HBDP ties into the existing HBGS discharge, to the offshore diffuser, Station 17, shown on Figure 1 to Figure 5. The losses through the system can be attributed to friction losses from the conduit side walls and to geometric transition losses where flow may expand, contract or change direction. Stations (1 – 17) were assigned based on changes in the shape of the conduit to identify sources of transition losses. Head loss calculations were made between each station and summed to determine the total system loss.
Friction losses
Conduit friction losses were calculated by the Darcy-Weisbach equation, namely
hf = (f L/D) V2 / 2g = Kf V2/ 2g (Rouse & Howe, 1953)
where:
hf = head loss due to friction at conduit walls, ft
f = Darcy-Weisbach friction coefficient (a function of Reynolds number and wall relative roughness D/k), dimensionless
L = conduit length, ft
D = conduit diameter, or effective diameter in the case of a rectangular conduit, ft
k = related to roughness of surface, ft
Kf = f L//D, loss coefficient due to friction, dimensionless
g = gravitational constant, 32 ft/sec2
V = conduit average velocity, ft/sec
Technical Memorandum
- 3 -
Further, the friction coefficient was determined by a relationship to the Mannings n friction factor, which provides a greater range for rough surfaces. This relationship is defined as;
f = (182 n2)/D1/6 (Rouse & Howe, 1953)
where:
n = Mannings coefficient
R = hydraulic radius (R = Area/Perimeter)
D = Diameter, (effective D = 4R)
A Mannings n value of 0.025 was used in the calculations to represent a rough surface.
Transition Losses
Transition losses are determined by;
hL = K V2/ 2g (Rouse & Howe, 1953)
where
K = transition loss coefficient
Transition loss coefficients were determined based on the nature of the transition and published values based on empirical data. The loss coefficients appropriate for each transition encountered within HBDP system are discussed below.
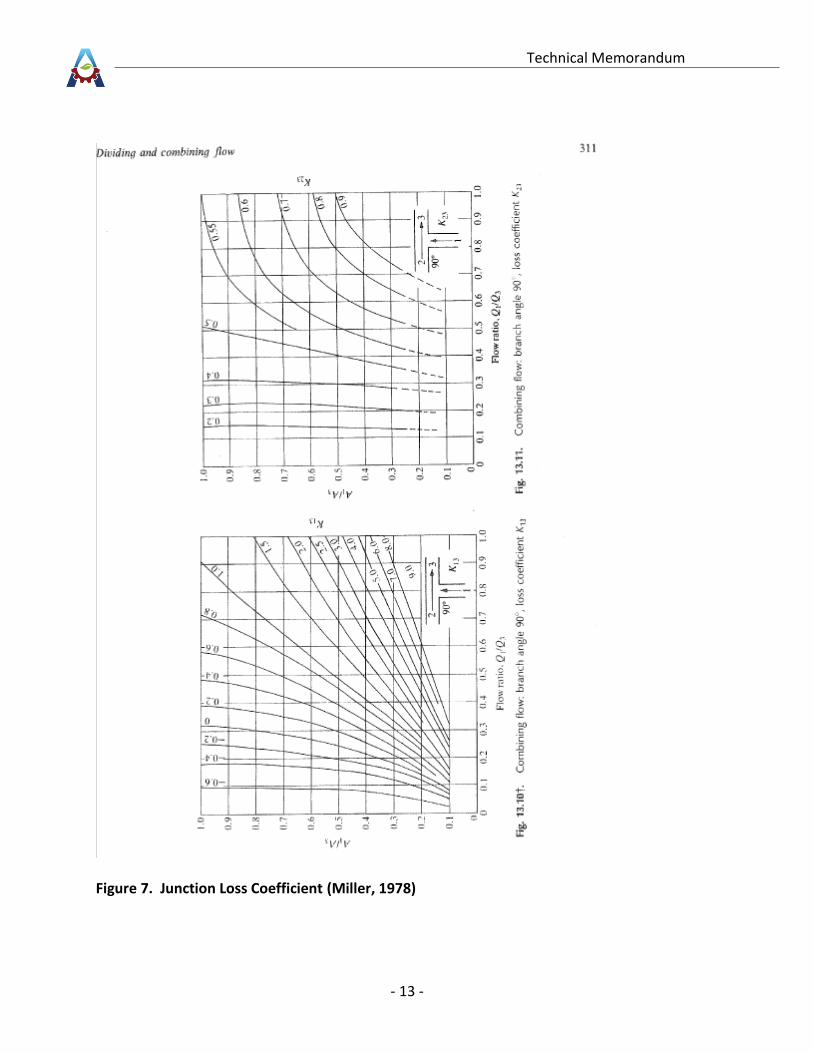
Junction losses
Junction losses are associated with Stations 1 - 2, where HBDP connects to the existing HBGS discharge, and Stations 10 - 11, where the cross over from the west side channel merges with the channel on the east side of the screenwell, see Figure 2 and Figure 3. The loss coefficients K, at these junctions were determined from the graphs within Figure 7.
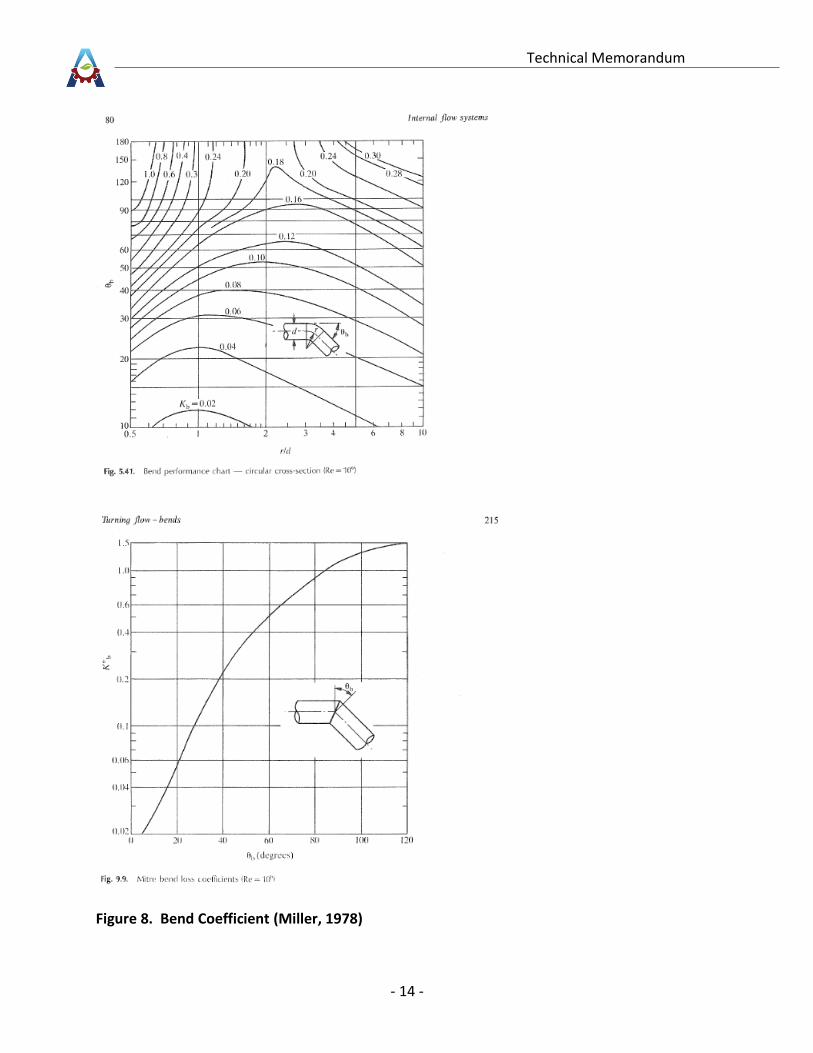
Bend Losses
Bend losses are associated with locations where the flow changes direction. The loss coefficients at these bends were determined by the geometry of the bend and use of Figure 8.
Technical Memorandum
- 4 -
Expansion and Contraction Losses
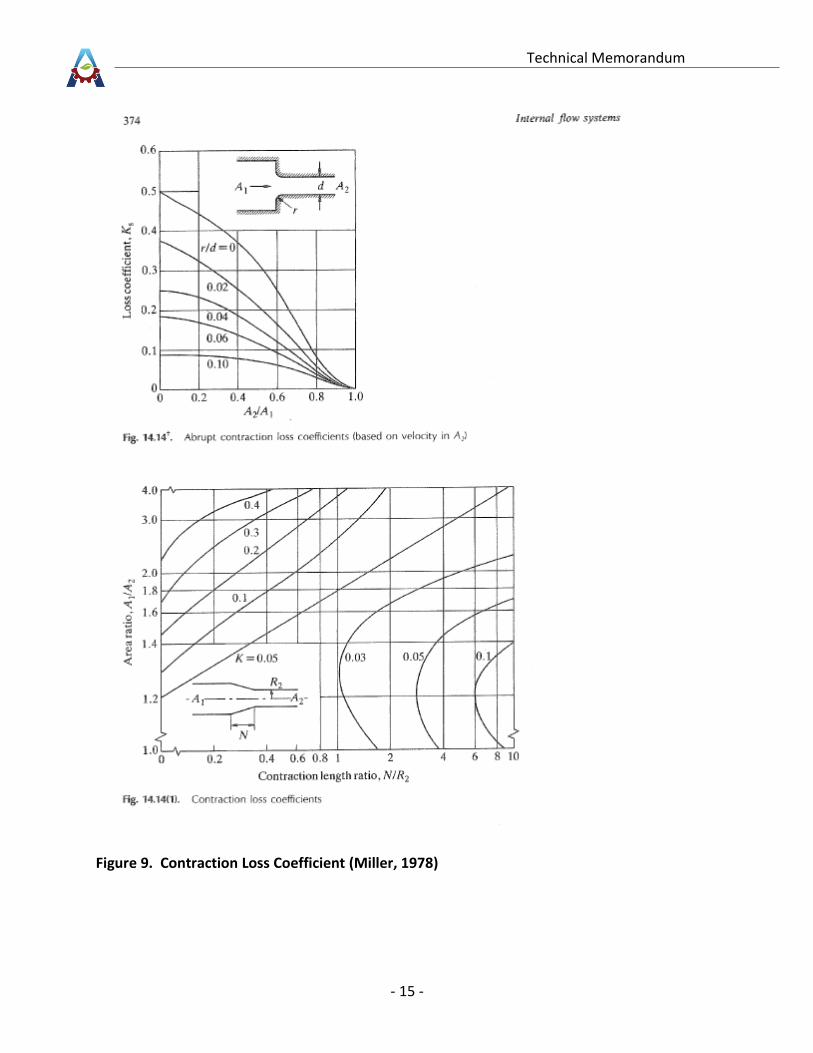
Expansion and contraction losses occur where areas of the conduit changes by either expanding or reducing. There are multiple locations where the conduit area is changing throughout the system. The loss coefficients for contraction were determined from graphs within Figure 9.
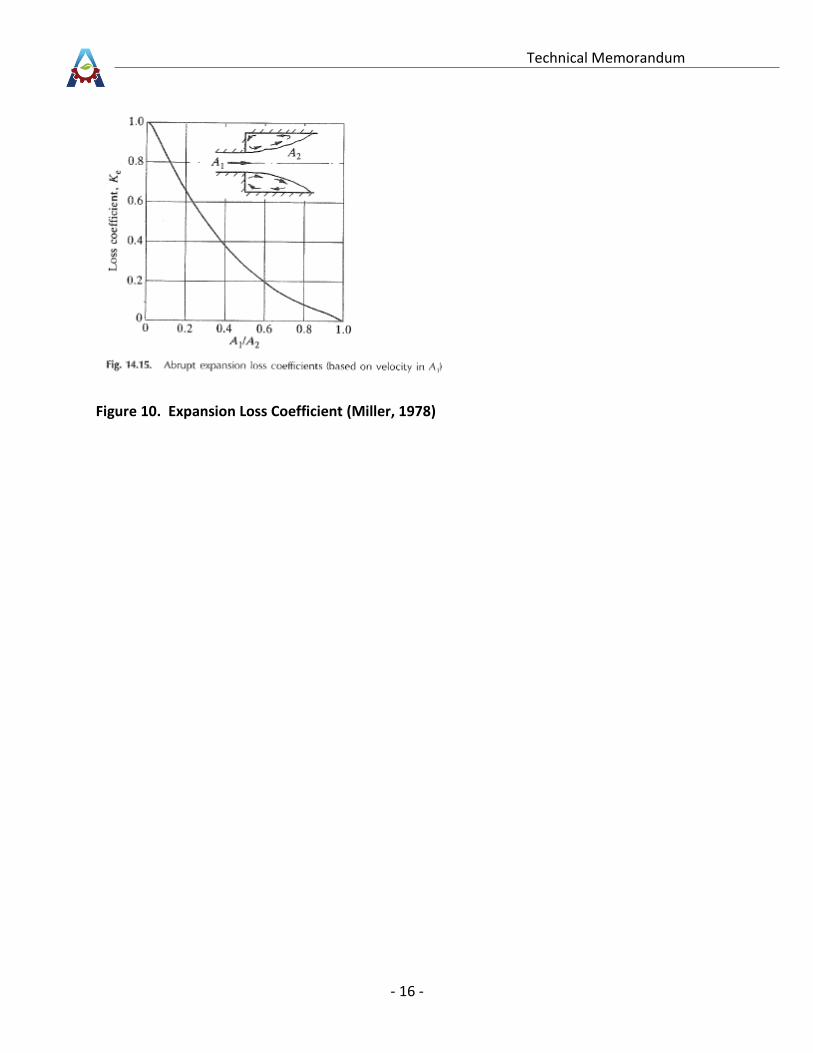
The loss coefficients for expansion were determined either from the following expression or from Figure 10.
Ke = (1 – A1 / A2)2 (Rouse & Howe, 1953)
where,
Ke = Head loss coefficient for expansion
A1 = Area of upstream geometry, ft
A2 = Area of downstream geometry, ft
Duck-Bill Diffuser Losses
The duck-bill diffuser design was summarized in a previous Alden memo (Alden, 2017). The design includes (3) 36 inch Tideflex “duck-bill” check valves to act as diffusers, see Figure 6. The offshore diffuser also includes a 4.5 ft diameter top port that would only be opened for co-located operation at flows greater than 127 MGD. This head loss evaluation, for stand-alone operation assumes the 4.5 ft diameter top port is closed.
Based on information received from Tideflex (duck-bill check valve vendor) the head versus flow rating for a 36 inch check valve is given by;
Q = 8,250 ΔH
where
Q = flow from each valve, gpm
ΔH = Head difference or head loss across valve, ft
Assuming a total flow of 127 MGD for the three check valves, the head loss associated with the duck-bill diffusers is 3.56 ft.
Technical Memorandum
- 5 -
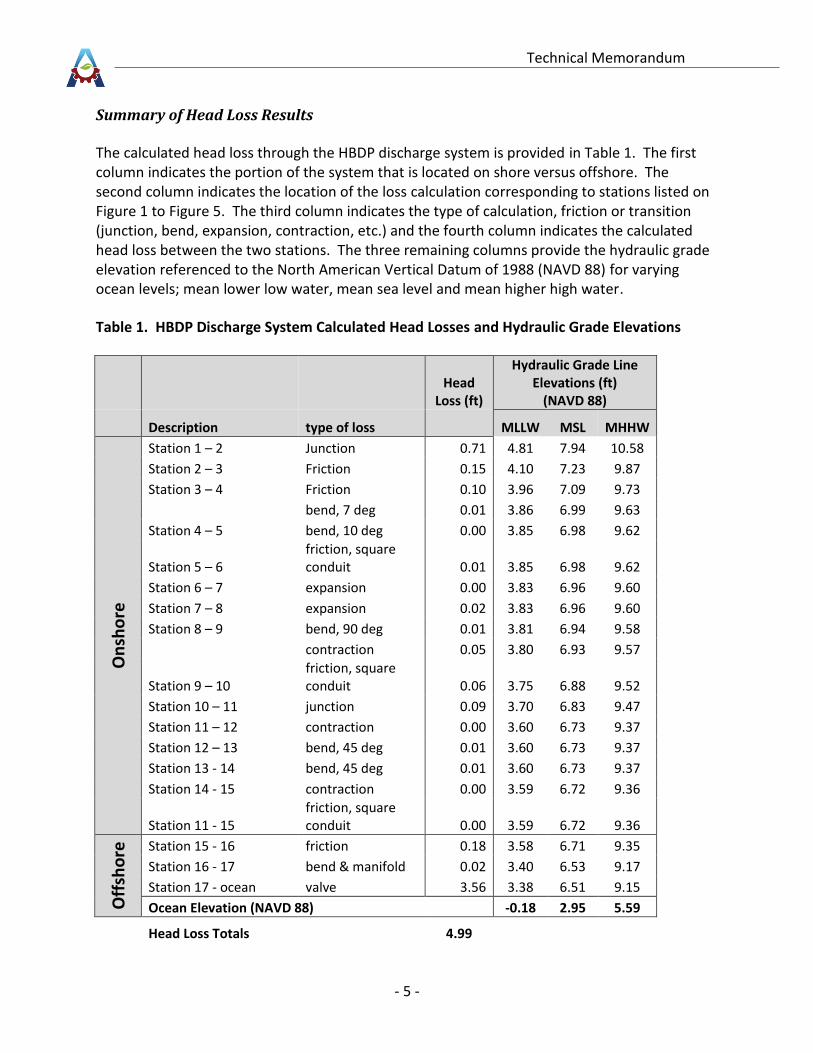
Summary of Head Loss Results
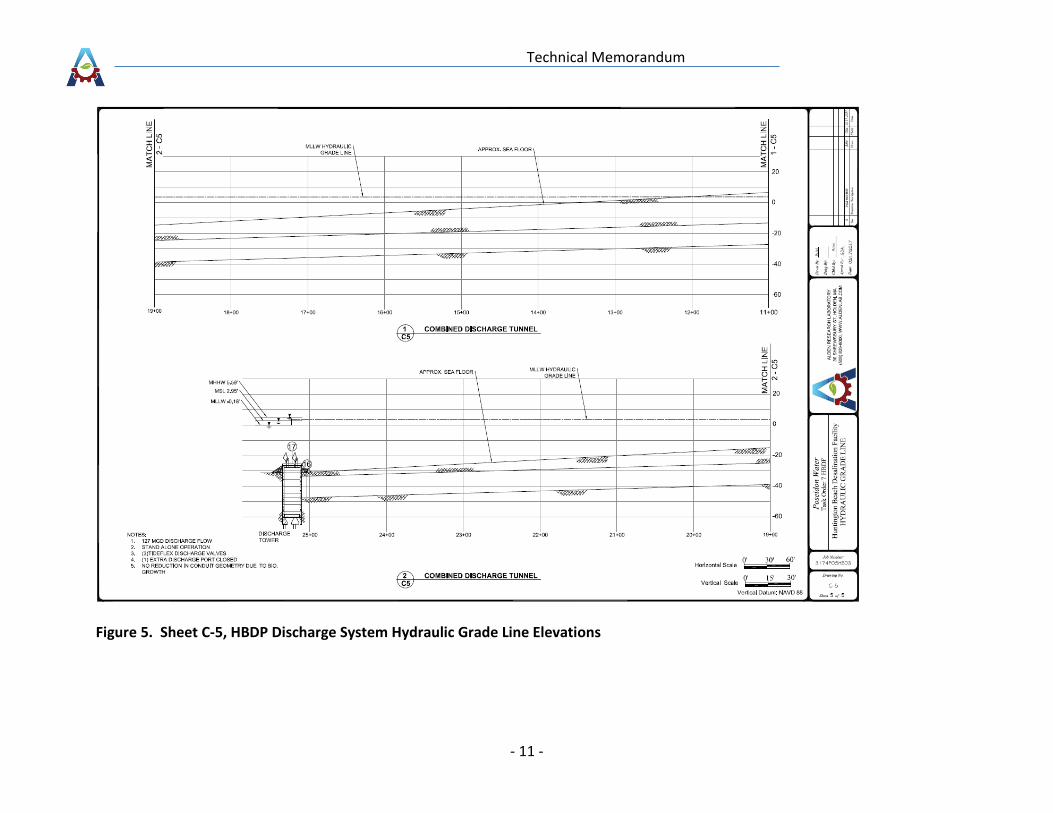
The calculated head loss through the HBDP discharge system is provided in Table 1. The first column indicates the portion of the system that is located on shore versus offshore. The second column indicates the location of the loss calculation corresponding to stations listed on Figure 1 to Figure 5. The third column indicates the type of calculation, friction or transition (junction, bend, expansion, contraction, etc.) and the fourth column indicates the calculated head loss between the two stations. The three remaining columns provide the hydraulic grade elevation referenced to the North American Vertical Datum of 1988 (NAVD 88) for varying ocean levels; mean lower low water, mean sea level and mean higher high water.
Table 1. HBDP Discharge System Calculated Head Losses and Hydraulic Grade Elevations
Head
Loss (ft)
Hydraulic Grade Line Elevations (ft)
(NAVD 88)
Description type of loss MLLW MSL MHHW
On
sho
re
Station 1 – 2 Junction 0.71 4.81 7.94 10.58
Station 2 – 3 Friction 0.15 4.10 7.23 9.87
Station 3 – 4 Friction 0.10 3.96 7.09 9.73
bend, 7 deg 0.01 3.86 6.99 9.63
Station 4 – 5 bend, 10 deg 0.00 3.85 6.98 9.62
Station 5 – 6 friction, square conduit 0.01 3.85 6.98 9.62
Station 6 – 7 expansion 0.00 3.83 6.96 9.60
Station 7 – 8 expansion 0.02 3.83 6.96 9.60
Station 8 – 9 bend, 90 deg 0.01 3.81 6.94 9.58
contraction 0.05 3.80 6.93 9.57
Station 9 – 10 friction, square conduit 0.06 3.75 6.88 9.52
Station 10 – 11 junction 0.09 3.70 6.83 9.47
Station 11 – 12 contraction 0.00 3.60 6.73 9.37
Station 12 – 13 bend, 45 deg 0.01 3.60 6.73 9.37
Station 13 - 14 bend, 45 deg 0.01 3.60 6.73 9.37
Station 14 - 15 contraction 0.00 3.59 6.72 9.36
Station 11 - 15 friction, square conduit 0.00 3.59 6.72 9.36
Off
sho
re
Station 15 - 16 friction 0.18 3.58 6.71 9.35
Station 16 - 17 bend & manifold 0.02 3.40 6.53 9.17
Station 17 - ocean valve 3.56 3.38 6.51 9.15
Ocean Elevation (NAVD 88) -0.18 2.95 5.59
Head Loss Totals
4.99
Technical Memorandum
- 6 -
Recommendations
The proposed design of the HBDP discharge system could be improved to reduce losses through the system. As can be seen in Table 1, a significant portion of the total loss is attributed to the tie in location at Station 1. This junction could be designed to significantly reduce hydraulic losses. In addition, if HBDP were to tie into both Station 1 and Station a, shown on Figure 1, and discharge half the total flow to each channel, then the losses through the system could be reduced by 0.9 ft. The total head loss would reduce from 4.99 ft to 4.09 ft. Splitting the flow between Station 1 and Station a, and improving the junction geometry at these points will provide a significant improvement relative to total head loss.
References
Alden. (2017). Technical Memorandum, Revised Diffuser Design for Co-located and Stand-alone Operation of the Poseidon Huntington Beach Desalination Plant, February 16, 2017. Holden, MA: Alden Research Laboratory, Inc.
Miller, D. S. (1978). Internal Flow Systems, 2nd Edition. Bedford, UK: BHRA (Information Services), The Fluid Engineering Centre.
Rouse, H., & Howe, J. (1953). Basic Mechanics of Fluids. New York: John Wiley & Sons, Inc.
Technical Memorandum
- 7 -
Figure 1. Sheet C-1, HBDP Discharge System
Technical Memorandum
- 8 -
Figure 2. Sheet C-2, HBDP Discharge System
Technical Memorandum
- 9 -
Figure 3. Sheet C-3, HBDP Discharge System
Technical Memorandum
- 10 -
Figure 4. Sheet C-4, HBDP Discharge System Hydraulic Grade Line Elevations
Technical Memorandum
- 11 -
Figure 5. Sheet C-5, HBDP Discharge System Hydraulic Grade Line Elevations
Technical Memorandum
- 12 -
Figure 6. HBDP Diffuser Design
Technical Memorandum
- 13 -
Figure 7. Junction Loss Coefficient (Miller, 1978)
Technical Memorandum
- 14 -
Figure 8. Bend Coefficient (Miller, 1978)
Technical Memorandum
- 15 -
Figure 9. Contraction Loss Coefficient (Miller, 1978)
Technical Memorandum
- 16 -
Figure 10. Expansion Loss Coefficient (Miller, 1978)