Tables - Champlain College Stats... · Tables 285 Table 1: Binomial Probabilities Table gives...
10
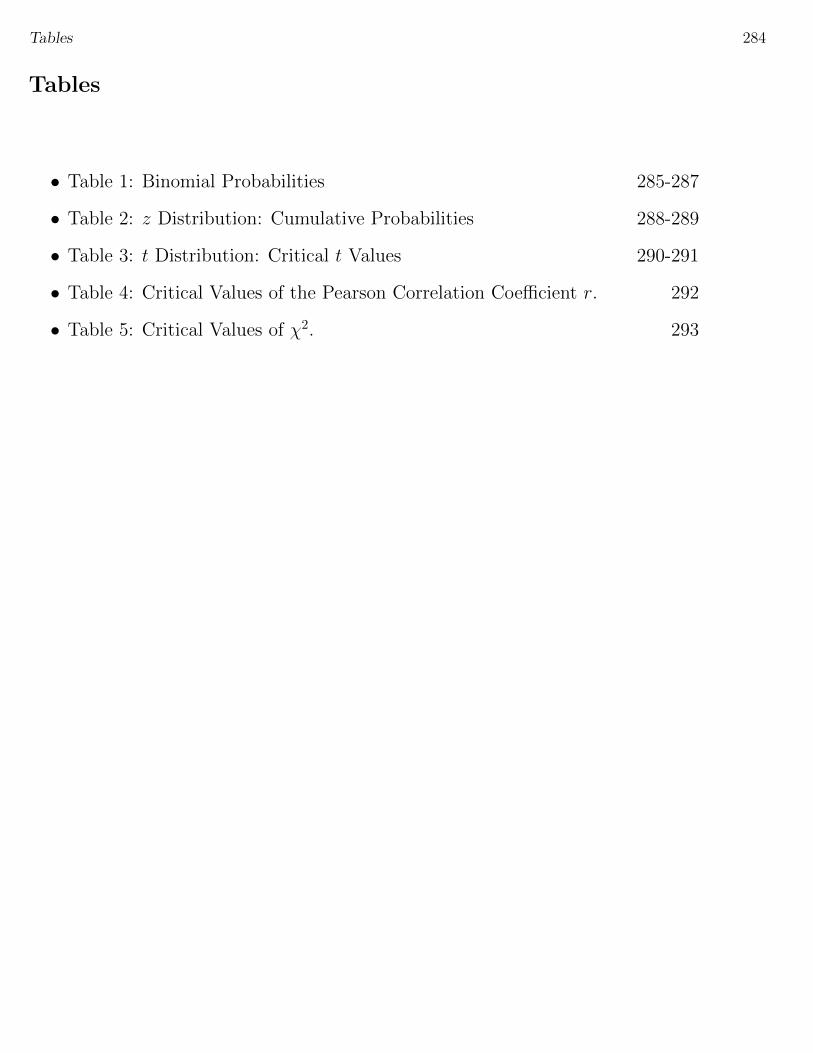
Tables 284 Tables • Table 1: Binomial Probabilities 285-287 • Table 2: z Distribution: Cumulative Probabilities 288-289 • Table 3: t Distribution: Critical t Values 290-291 • Table 4: Critical Values of the Pearson Correlation Coefficient r. 292 • Table 5: Critical Values of χ 2 . 293
Transcript of Tables - Champlain College Stats... · Tables 285 Table 1: Binomial Probabilities Table gives...
Tables 284
Tables
• Table 1: Binomial Probabilities 285-287
• Table 2: z Distribution: Cumulative Probabilities 288-289
• Table 3: t Distribution: Critical t Values 290-291
• Table 4: Critical Values of the Pearson Correlation Coefficient r. 292
• Table 5: Critical Values of χ2. 293
Tables 285
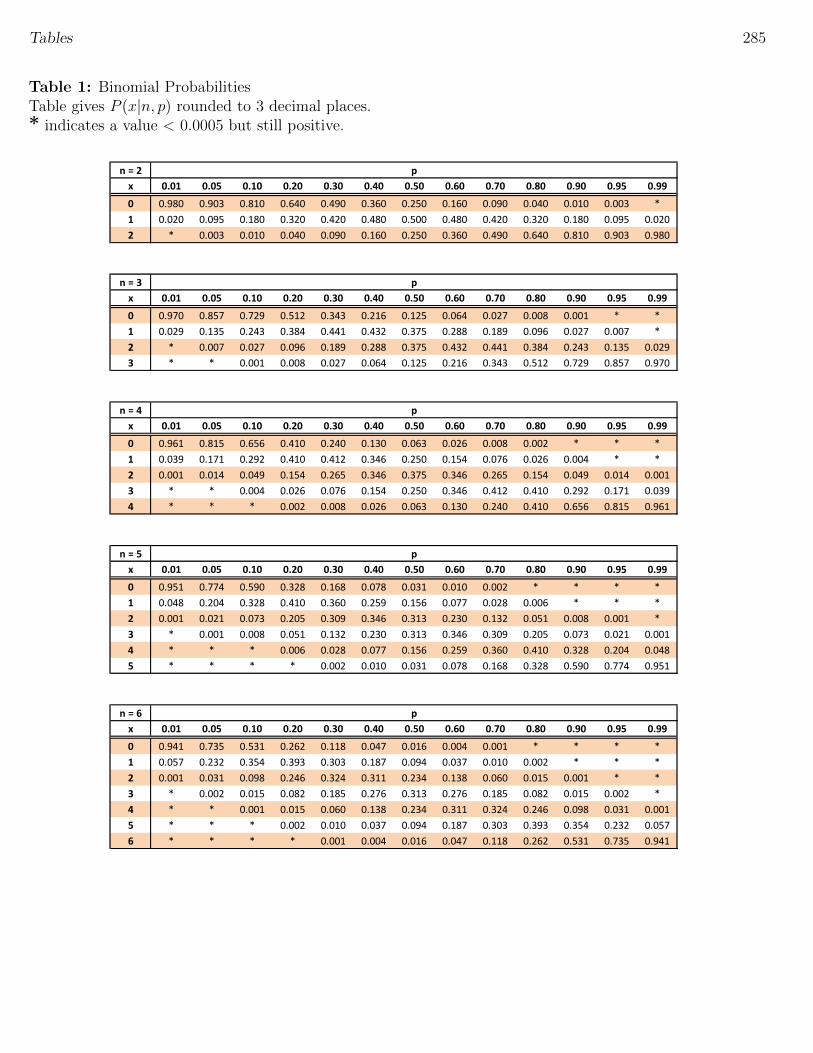
Table 1: Binomial ProbabilitiesTable gives P (x|n, p) rounded to 3 decimal places.* indicates a value < 0.0005 but still positive.
n = 2
x 0.01 0.05 0.10 0.20 0.30 0.40 0.50 0.60 0.70 0.80 0.90 0.95 0.99
0 0.980 0.903 0.810 0.640 0.490 0.360 0.250 0.160 0.090 0.040 0.010 0.003 *
1 0.020 0.095 0.180 0.320 0.420 0.480 0.500 0.480 0.420 0.320 0.180 0.095 0.020
2 * 0.003 0.010 0.040 0.090 0.160 0.250 0.360 0.490 0.640 0.810 0.903 0.980
n = 3
x 0.01 0.05 0.10 0.20 0.30 0.40 0.50 0.60 0.70 0.80 0.90 0.95 0.99
0 0.970 0.857 0.729 0.512 0.343 0.216 0.125 0.064 0.027 0.008 0.001 * *
1 0.029 0.135 0.243 0.384 0.441 0.432 0.375 0.288 0.189 0.096 0.027 0.007 *
2 * 0.007 0.027 0.096 0.189 0.288 0.375 0.432 0.441 0.384 0.243 0.135 0.029
3 * * 0.001 0.008 0.027 0.064 0.125 0.216 0.343 0.512 0.729 0.857 0.970
n = 4
x 0.01 0.05 0.10 0.20 0.30 0.40 0.50 0.60 0.70 0.80 0.90 0.95 0.99
0 0.961 0.815 0.656 0.410 0.240 0.130 0.063 0.026 0.008 0.002 * * *
1 0.039 0.171 0.292 0.410 0.412 0.346 0.250 0.154 0.076 0.026 0.004 * *
2 0.001 0.014 0.049 0.154 0.265 0.346 0.375 0.346 0.265 0.154 0.049 0.014 0.001
3 * * 0.004 0.026 0.076 0.154 0.250 0.346 0.412 0.410 0.292 0.171 0.039
4 * * * 0.002 0.008 0.026 0.063 0.130 0.240 0.410 0.656 0.815 0.961
n = 5
x 0.01 0.05 0.10 0.20 0.30 0.40 0.50 0.60 0.70 0.80 0.90 0.95 0.99
0 0.951 0.774 0.590 0.328 0.168 0.078 0.031 0.010 0.002 * * * *
1 0.048 0.204 0.328 0.410 0.360 0.259 0.156 0.077 0.028 0.006 * * *
2 0.001 0.021 0.073 0.205 0.309 0.346 0.313 0.230 0.132 0.051 0.008 0.001 *
3 * 0.001 0.008 0.051 0.132 0.230 0.313 0.346 0.309 0.205 0.073 0.021 0.001
4 * * * 0.006 0.028 0.077 0.156 0.259 0.360 0.410 0.328 0.204 0.048
5 * * * * 0.002 0.010 0.031 0.078 0.168 0.328 0.590 0.774 0.951
n = 6
x 0.01 0.05 0.10 0.20 0.30 0.40 0.50 0.60 0.70 0.80 0.90 0.95 0.99
0 0.941 0.735 0.531 0.262 0.118 0.047 0.016 0.004 0.001 * * * *
1 0.057 0.232 0.354 0.393 0.303 0.187 0.094 0.037 0.010 0.002 * * *
2 0.001 0.031 0.098 0.246 0.324 0.311 0.234 0.138 0.060 0.015 0.001 * *
3 * 0.002 0.015 0.082 0.185 0.276 0.313 0.276 0.185 0.082 0.015 0.002 *
4 * * 0.001 0.015 0.060 0.138 0.234 0.311 0.324 0.246 0.098 0.031 0.001
5 * * * 0.002 0.010 0.037 0.094 0.187 0.303 0.393 0.354 0.232 0.057
6 * * * * 0.001 0.004 0.016 0.047 0.118 0.262 0.531 0.735 0.941
p
p
p
p
p
Tables 286
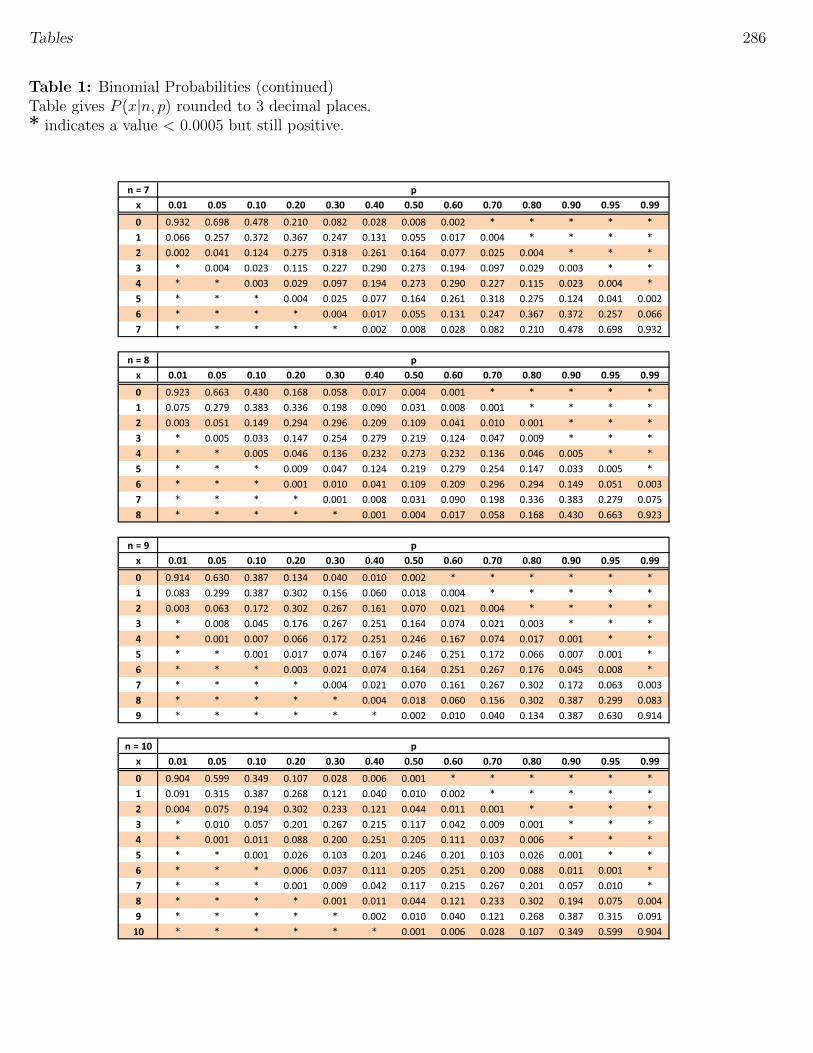
Table 1: Binomial Probabilities (continued)Table gives P (x|n, p) rounded to 3 decimal places.* indicates a value < 0.0005 but still positive.
n = 7
x 0.01 0.05 0.10 0.20 0.30 0.40 0.50 0.60 0.70 0.80 0.90 0.95 0.99
0 0.932 0.698 0.478 0.210 0.082 0.028 0.008 0.002 * * * * *
1 0.066 0.257 0.372 0.367 0.247 0.131 0.055 0.017 0.004 * * * *
2 0.002 0.041 0.124 0.275 0.318 0.261 0.164 0.077 0.025 0.004 * * *
3 * 0.004 0.023 0.115 0.227 0.290 0.273 0.194 0.097 0.029 0.003 * *
4 * * 0.003 0.029 0.097 0.194 0.273 0.290 0.227 0.115 0.023 0.004 *
5 * * * 0.004 0.025 0.077 0.164 0.261 0.318 0.275 0.124 0.041 0.002
6 * * * * 0.004 0.017 0.055 0.131 0.247 0.367 0.372 0.257 0.066
7 * * * * * 0.002 0.008 0.028 0.082 0.210 0.478 0.698 0.932
n = 8
x 0.01 0.05 0.10 0.20 0.30 0.40 0.50 0.60 0.70 0.80 0.90 0.95 0.99
0 0.923 0.663 0.430 0.168 0.058 0.017 0.004 0.001 * * * * *
1 0.075 0.279 0.383 0.336 0.198 0.090 0.031 0.008 0.001 * * * *
2 0.003 0.051 0.149 0.294 0.296 0.209 0.109 0.041 0.010 0.001 * * *
3 * 0.005 0.033 0.147 0.254 0.279 0.219 0.124 0.047 0.009 * * *
4 * * 0.005 0.046 0.136 0.232 0.273 0.232 0.136 0.046 0.005 * *
5 * * * 0.009 0.047 0.124 0.219 0.279 0.254 0.147 0.033 0.005 *
6 * * * 0.001 0.010 0.041 0.109 0.209 0.296 0.294 0.149 0.051 0.003
7 * * * * 0.001 0.008 0.031 0.090 0.198 0.336 0.383 0.279 0.075
8 * * * * * 0.001 0.004 0.017 0.058 0.168 0.430 0.663 0.923
n = 9
x 0.01 0.05 0.10 0.20 0.30 0.40 0.50 0.60 0.70 0.80 0.90 0.95 0.99
0 0.914 0.630 0.387 0.134 0.040 0.010 0.002 * * * * * *
1 0.083 0.299 0.387 0.302 0.156 0.060 0.018 0.004 * * * * *
2 0.003 0.063 0.172 0.302 0.267 0.161 0.070 0.021 0.004 * * * *
3 * 0.008 0.045 0.176 0.267 0.251 0.164 0.074 0.021 0.003 * * *
4 * 0.001 0.007 0.066 0.172 0.251 0.246 0.167 0.074 0.017 0.001 * *
5 * * 0.001 0.017 0.074 0.167 0.246 0.251 0.172 0.066 0.007 0.001 *
6 * * * 0.003 0.021 0.074 0.164 0.251 0.267 0.176 0.045 0.008 *
7 * * * * 0.004 0.021 0.070 0.161 0.267 0.302 0.172 0.063 0.003
8 * * * * * 0.004 0.018 0.060 0.156 0.302 0.387 0.299 0.083
9 * * * * * * 0.002 0.010 0.040 0.134 0.387 0.630 0.914
n = 10
x 0.01 0.05 0.10 0.20 0.30 0.40 0.50 0.60 0.70 0.80 0.90 0.95 0.99
0 0.904 0.599 0.349 0.107 0.028 0.006 0.001 * * * * * *
1 0.091 0.315 0.387 0.268 0.121 0.040 0.010 0.002 * * * * *
2 0.004 0.075 0.194 0.302 0.233 0.121 0.044 0.011 0.001 * * * *
3 * 0.010 0.057 0.201 0.267 0.215 0.117 0.042 0.009 0.001 * * *
4 * 0.001 0.011 0.088 0.200 0.251 0.205 0.111 0.037 0.006 * * *
5 * * 0.001 0.026 0.103 0.201 0.246 0.201 0.103 0.026 0.001 * *
6 * * * 0.006 0.037 0.111 0.205 0.251 0.200 0.088 0.011 0.001 *
7 * * * 0.001 0.009 0.042 0.117 0.215 0.267 0.201 0.057 0.010 *
8 * * * * 0.001 0.011 0.044 0.121 0.233 0.302 0.194 0.075 0.004
9 * * * * * 0.002 0.010 0.040 0.121 0.268 0.387 0.315 0.091
10 * * * * * * 0.001 0.006 0.028 0.107 0.349 0.599 0.904
p
p
p
p
Tables 287
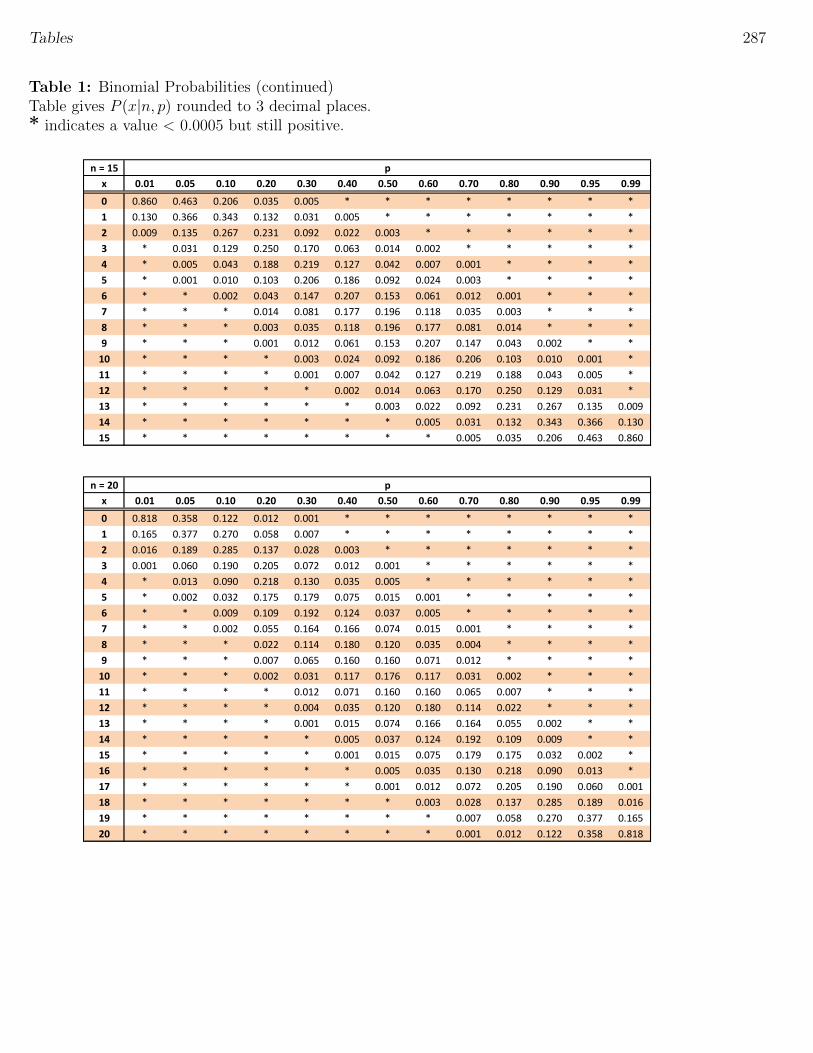
Table 1: Binomial Probabilities (continued)Table gives P (x|n, p) rounded to 3 decimal places.* indicates a value < 0.0005 but still positive.
n = 15
x 0.01 0.05 0.10 0.20 0.30 0.40 0.50 0.60 0.70 0.80 0.90 0.95 0.99
0 0.860 0.463 0.206 0.035 0.005 * * * * * * * *
1 0.130 0.366 0.343 0.132 0.031 0.005 * * * * * * *
2 0.009 0.135 0.267 0.231 0.092 0.022 0.003 * * * * * *
3 * 0.031 0.129 0.250 0.170 0.063 0.014 0.002 * * * * *
4 * 0.005 0.043 0.188 0.219 0.127 0.042 0.007 0.001 * * * *
5 * 0.001 0.010 0.103 0.206 0.186 0.092 0.024 0.003 * * * *
6 * * 0.002 0.043 0.147 0.207 0.153 0.061 0.012 0.001 * * *
7 * * * 0.014 0.081 0.177 0.196 0.118 0.035 0.003 * * *
8 * * * 0.003 0.035 0.118 0.196 0.177 0.081 0.014 * * *
9 * * * 0.001 0.012 0.061 0.153 0.207 0.147 0.043 0.002 * *
10 * * * * 0.003 0.024 0.092 0.186 0.206 0.103 0.010 0.001 *
11 * * * * 0.001 0.007 0.042 0.127 0.219 0.188 0.043 0.005 *
12 * * * * * 0.002 0.014 0.063 0.170 0.250 0.129 0.031 *
13 * * * * * * 0.003 0.022 0.092 0.231 0.267 0.135 0.009
14 * * * * * * * 0.005 0.031 0.132 0.343 0.366 0.130
15 * * * * * * * * 0.005 0.035 0.206 0.463 0.860
n = 20
x 0.01 0.05 0.10 0.20 0.30 0.40 0.50 0.60 0.70 0.80 0.90 0.95 0.99
0 0.818 0.358 0.122 0.012 0.001 * * * * * * * *
1 0.165 0.377 0.270 0.058 0.007 * * * * * * * *
2 0.016 0.189 0.285 0.137 0.028 0.003 * * * * * * *
3 0.001 0.060 0.190 0.205 0.072 0.012 0.001 * * * * * *
4 * 0.013 0.090 0.218 0.130 0.035 0.005 * * * * * *
5 * 0.002 0.032 0.175 0.179 0.075 0.015 0.001 * * * * *
6 * * 0.009 0.109 0.192 0.124 0.037 0.005 * * * * *
7 * * 0.002 0.055 0.164 0.166 0.074 0.015 0.001 * * * *
8 * * * 0.022 0.114 0.180 0.120 0.035 0.004 * * * *
9 * * * 0.007 0.065 0.160 0.160 0.071 0.012 * * * *
10 * * * 0.002 0.031 0.117 0.176 0.117 0.031 0.002 * * *
11 * * * * 0.012 0.071 0.160 0.160 0.065 0.007 * * *
12 * * * * 0.004 0.035 0.120 0.180 0.114 0.022 * * *
13 * * * * 0.001 0.015 0.074 0.166 0.164 0.055 0.002 * *
14 * * * * * 0.005 0.037 0.124 0.192 0.109 0.009 * *
15 * * * * * 0.001 0.015 0.075 0.179 0.175 0.032 0.002 *
16 * * * * * * 0.005 0.035 0.130 0.218 0.090 0.013 *
17 * * * * * * 0.001 0.012 0.072 0.205 0.190 0.060 0.001
18 * * * * * * * 0.003 0.028 0.137 0.285 0.189 0.016
19 * * * * * * * * 0.007 0.058 0.270 0.377 0.165
20 * * * * * * * * 0.001 0.012 0.122 0.358 0.818
p
p
Tables 288
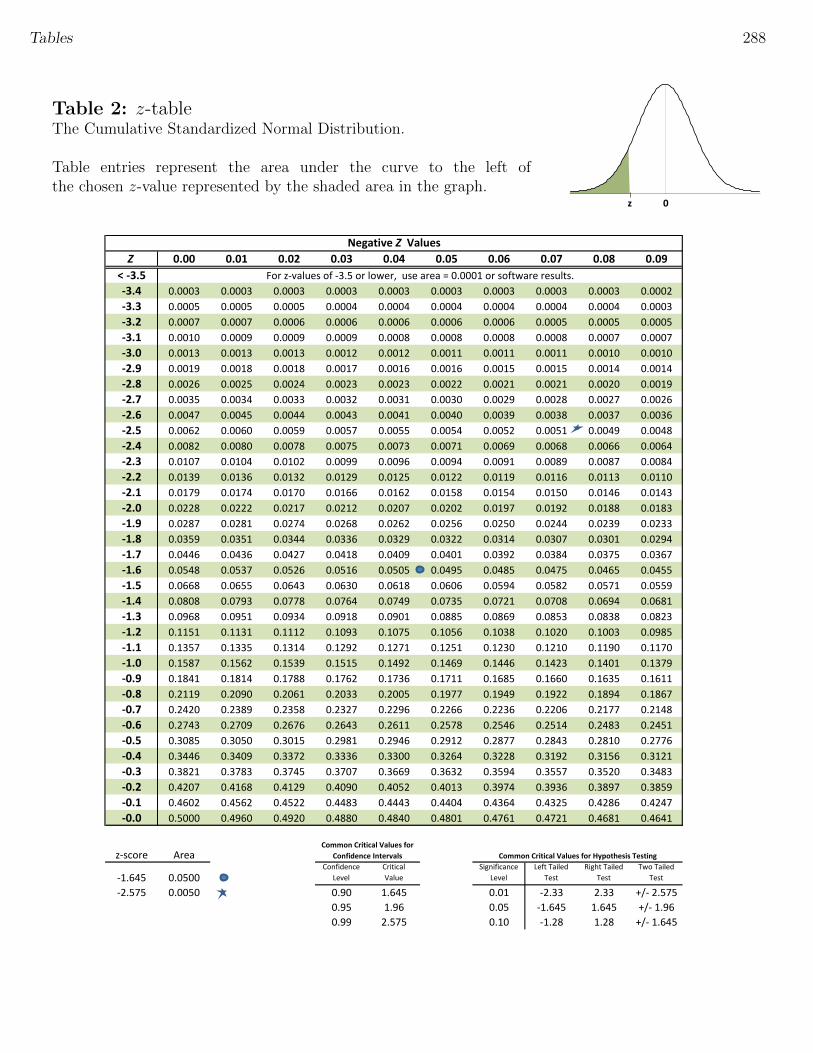
Table 2: z-tableThe Cumulative Standardized Normal Distribution.
Table entries represent the area under the curve to the left ofthe chosen z-value represented by the shaded area in the graph.
z 0
Z 0.00 0.01 0.02 0.03 0.04 0.05 0.06 0.07 0.08 0.09
< -3.5
-3.4 0.0003 0.0003 0.0003 0.0003 0.0003 0.0003 0.0003 0.0003 0.0003 0.0002
-3.3 0.0005 0.0005 0.0005 0.0004 0.0004 0.0004 0.0004 0.0004 0.0004 0.0003
-3.2 0.0007 0.0007 0.0006 0.0006 0.0006 0.0006 0.0006 0.0005 0.0005 0.0005
-3.1 0.0010 0.0009 0.0009 0.0009 0.0008 0.0008 0.0008 0.0008 0.0007 0.0007
-3.0 0.0013 0.0013 0.0013 0.0012 0.0012 0.0011 0.0011 0.0011 0.0010 0.0010
-2.9 0.0019 0.0018 0.0018 0.0017 0.0016 0.0016 0.0015 0.0015 0.0014 0.0014
-2.8 0.0026 0.0025 0.0024 0.0023 0.0023 0.0022 0.0021 0.0021 0.0020 0.0019
-2.7 0.0035 0.0034 0.0033 0.0032 0.0031 0.0030 0.0029 0.0028 0.0027 0.0026
-2.6 0.0047 0.0045 0.0044 0.0043 0.0041 0.0040 0.0039 0.0038 0.0037 0.0036
-2.5 0.0062 0.0060 0.0059 0.0057 0.0055 0.0054 0.0052 0.0051 0.0049 0.0048
-2.4 0.0082 0.0080 0.0078 0.0075 0.0073 0.0071 0.0069 0.0068 0.0066 0.0064
-2.3 0.0107 0.0104 0.0102 0.0099 0.0096 0.0094 0.0091 0.0089 0.0087 0.0084
-2.2 0.0139 0.0136 0.0132 0.0129 0.0125 0.0122 0.0119 0.0116 0.0113 0.0110
-2.1 0.0179 0.0174 0.0170 0.0166 0.0162 0.0158 0.0154 0.0150 0.0146 0.0143
-2.0 0.0228 0.0222 0.0217 0.0212 0.0207 0.0202 0.0197 0.0192 0.0188 0.0183
-1.9 0.0287 0.0281 0.0274 0.0268 0.0262 0.0256 0.0250 0.0244 0.0239 0.0233
-1.8 0.0359 0.0351 0.0344 0.0336 0.0329 0.0322 0.0314 0.0307 0.0301 0.0294
-1.7 0.0446 0.0436 0.0427 0.0418 0.0409 0.0401 0.0392 0.0384 0.0375 0.0367
-1.6 0.0548 0.0537 0.0526 0.0516 0.0505 0.0495 0.0485 0.0475 0.0465 0.0455
-1.5 0.0668 0.0655 0.0643 0.0630 0.0618 0.0606 0.0594 0.0582 0.0571 0.0559
-1.4 0.0808 0.0793 0.0778 0.0764 0.0749 0.0735 0.0721 0.0708 0.0694 0.0681
-1.3 0.0968 0.0951 0.0934 0.0918 0.0901 0.0885 0.0869 0.0853 0.0838 0.0823
-1.2 0.1151 0.1131 0.1112 0.1093 0.1075 0.1056 0.1038 0.1020 0.1003 0.0985
-1.1 0.1357 0.1335 0.1314 0.1292 0.1271 0.1251 0.1230 0.1210 0.1190 0.1170
-1.0 0.1587 0.1562 0.1539 0.1515 0.1492 0.1469 0.1446 0.1423 0.1401 0.1379
-0.9 0.1841 0.1814 0.1788 0.1762 0.1736 0.1711 0.1685 0.1660 0.1635 0.1611
-0.8 0.2119 0.2090 0.2061 0.2033 0.2005 0.1977 0.1949 0.1922 0.1894 0.1867
-0.7 0.2420 0.2389 0.2358 0.2327 0.2296 0.2266 0.2236 0.2206 0.2177 0.2148
-0.6 0.2743 0.2709 0.2676 0.2643 0.2611 0.2578 0.2546 0.2514 0.2483 0.2451
-0.5 0.3085 0.3050 0.3015 0.2981 0.2946 0.2912 0.2877 0.2843 0.2810 0.2776
-0.4 0.3446 0.3409 0.3372 0.3336 0.3300 0.3264 0.3228 0.3192 0.3156 0.3121
-0.3 0.3821 0.3783 0.3745 0.3707 0.3669 0.3632 0.3594 0.3557 0.3520 0.3483
-0.2 0.4207 0.4168 0.4129 0.4090 0.4052 0.4013 0.3974 0.3936 0.3897 0.3859
-0.1 0.4602 0.4562 0.4522 0.4483 0.4443 0.4404 0.4364 0.4325 0.4286 0.4247
-0.0 0.5000 0.4960 0.4920 0.4880 0.4840 0.4801 0.4761 0.4721 0.4681 0.4641
z-score Area
-1.645 0.0500Confidence
Level
Critical
Value
Significance
Level
Left Tailed
Test
Right Tailed
Test
Two Tailed
Test
-2.575 0.0050 0.90 1.645 0.01 -2.33 2.33 +/- 2.575
0.95 1.96 0.05 -1.645 1.645 +/- 1.96
0.99 2.575 0.10 -1.28 1.28 +/- 1.645
Negative Z Values
For z-values of -3.5 or lower, use area = 0.0001 or software results.
Common Critical Values for Hypothesis Testing
Common Critical Values for
Confidence Intervals
Tables 289
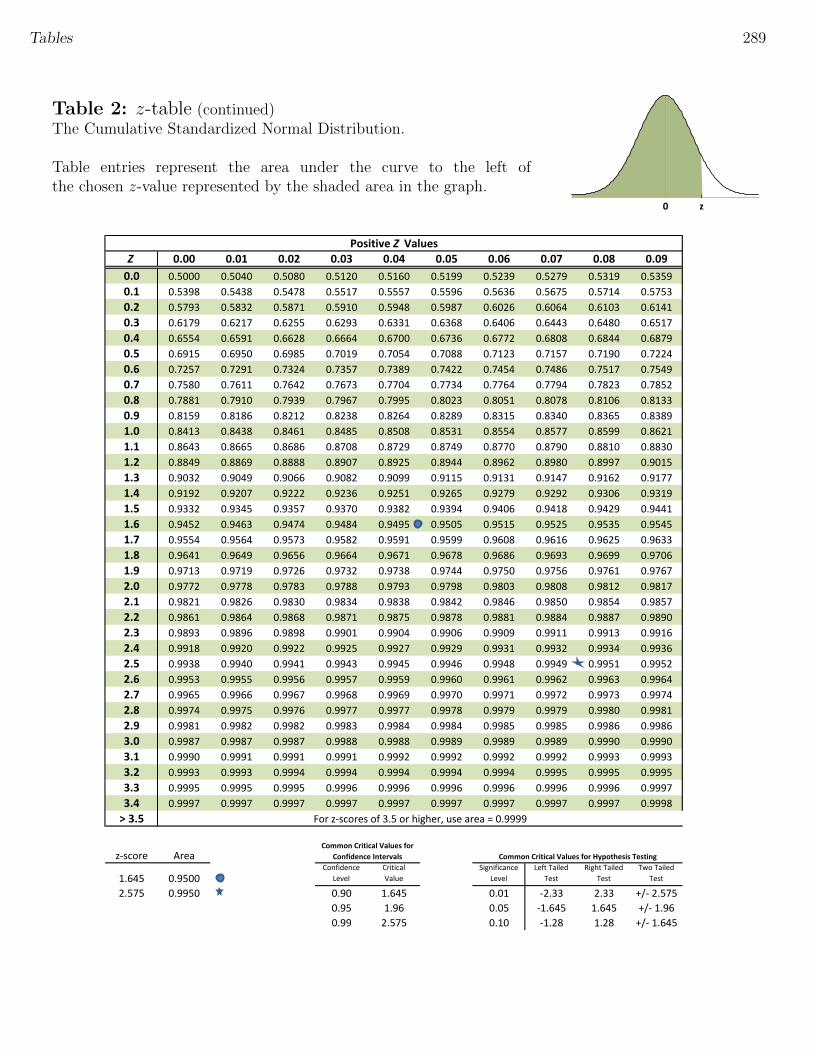
Table 2: z-table (continued)The Cumulative Standardized Normal Distribution.
Table entries represent the area under the curve to the left ofthe chosen z-value represented by the shaded area in the graph.
0 z
Z 0.00 0.01 0.02 0.03 0.04 0.05 0.06 0.07 0.08 0.09
0.0 0.5000 0.5040 0.5080 0.5120 0.5160 0.5199 0.5239 0.5279 0.5319 0.5359
0.1 0.5398 0.5438 0.5478 0.5517 0.5557 0.5596 0.5636 0.5675 0.5714 0.5753
0.2 0.5793 0.5832 0.5871 0.5910 0.5948 0.5987 0.6026 0.6064 0.6103 0.6141
0.3 0.6179 0.6217 0.6255 0.6293 0.6331 0.6368 0.6406 0.6443 0.6480 0.6517
0.4 0.6554 0.6591 0.6628 0.6664 0.6700 0.6736 0.6772 0.6808 0.6844 0.6879
0.5 0.6915 0.6950 0.6985 0.7019 0.7054 0.7088 0.7123 0.7157 0.7190 0.7224
0.6 0.7257 0.7291 0.7324 0.7357 0.7389 0.7422 0.7454 0.7486 0.7517 0.7549
0.7 0.7580 0.7611 0.7642 0.7673 0.7704 0.7734 0.7764 0.7794 0.7823 0.7852
0.8 0.7881 0.7910 0.7939 0.7967 0.7995 0.8023 0.8051 0.8078 0.8106 0.8133
0.9 0.8159 0.8186 0.8212 0.8238 0.8264 0.8289 0.8315 0.8340 0.8365 0.8389
1.0 0.8413 0.8438 0.8461 0.8485 0.8508 0.8531 0.8554 0.8577 0.8599 0.8621
1.1 0.8643 0.8665 0.8686 0.8708 0.8729 0.8749 0.8770 0.8790 0.8810 0.8830
1.2 0.8849 0.8869 0.8888 0.8907 0.8925 0.8944 0.8962 0.8980 0.8997 0.9015
1.3 0.9032 0.9049 0.9066 0.9082 0.9099 0.9115 0.9131 0.9147 0.9162 0.9177
1.4 0.9192 0.9207 0.9222 0.9236 0.9251 0.9265 0.9279 0.9292 0.9306 0.9319
1.5 0.9332 0.9345 0.9357 0.9370 0.9382 0.9394 0.9406 0.9418 0.9429 0.9441
1.6 0.9452 0.9463 0.9474 0.9484 0.9495 0.9505 0.9515 0.9525 0.9535 0.9545
1.7 0.9554 0.9564 0.9573 0.9582 0.9591 0.9599 0.9608 0.9616 0.9625 0.9633
1.8 0.9641 0.9649 0.9656 0.9664 0.9671 0.9678 0.9686 0.9693 0.9699 0.9706
1.9 0.9713 0.9719 0.9726 0.9732 0.9738 0.9744 0.9750 0.9756 0.9761 0.9767
2.0 0.9772 0.9778 0.9783 0.9788 0.9793 0.9798 0.9803 0.9808 0.9812 0.9817
2.1 0.9821 0.9826 0.9830 0.9834 0.9838 0.9842 0.9846 0.9850 0.9854 0.9857
2.2 0.9861 0.9864 0.9868 0.9871 0.9875 0.9878 0.9881 0.9884 0.9887 0.9890
2.3 0.9893 0.9896 0.9898 0.9901 0.9904 0.9906 0.9909 0.9911 0.9913 0.9916
2.4 0.9918 0.9920 0.9922 0.9925 0.9927 0.9929 0.9931 0.9932 0.9934 0.9936
2.5 0.9938 0.9940 0.9941 0.9943 0.9945 0.9946 0.9948 0.9949 0.9951 0.9952
2.6 0.9953 0.9955 0.9956 0.9957 0.9959 0.9960 0.9961 0.9962 0.9963 0.9964
2.7 0.9965 0.9966 0.9967 0.9968 0.9969 0.9970 0.9971 0.9972 0.9973 0.9974
2.8 0.9974 0.9975 0.9976 0.9977 0.9977 0.9978 0.9979 0.9979 0.9980 0.9981
2.9 0.9981 0.9982 0.9982 0.9983 0.9984 0.9984 0.9985 0.9985 0.9986 0.9986
3.0 0.9987 0.9987 0.9987 0.9988 0.9988 0.9989 0.9989 0.9989 0.9990 0.9990
3.1 0.9990 0.9991 0.9991 0.9991 0.9992 0.9992 0.9992 0.9992 0.9993 0.9993
3.2 0.9993 0.9993 0.9994 0.9994 0.9994 0.9994 0.9994 0.9995 0.9995 0.9995
3.3 0.9995 0.9995 0.9995 0.9996 0.9996 0.9996 0.9996 0.9996 0.9996 0.9997
3.4 0.9997 0.9997 0.9997 0.9997 0.9997 0.9997 0.9997 0.9997 0.9997 0.9998
> 3.5
z-score Area
1.645 0.9500Confidence
Level
Critical
Value
Significance
Level
Left Tailed
Test
Right Tailed
Test
Two Tailed
Test
2.575 0.9950 0.90 1.645 0.01 -2.33 2.33 +/- 2.575
0.95 1.96 0.05 -1.645 1.645 +/- 1.96
0.99 2.575 0.10 -1.28 1.28 +/- 1.645
Positive Z Values
For z-scores of 3.5 or higher, use area = 0.9999
Common Critical Values for
Confidence Intervals Common Critical Values for Hypothesis Testing
Tables 290
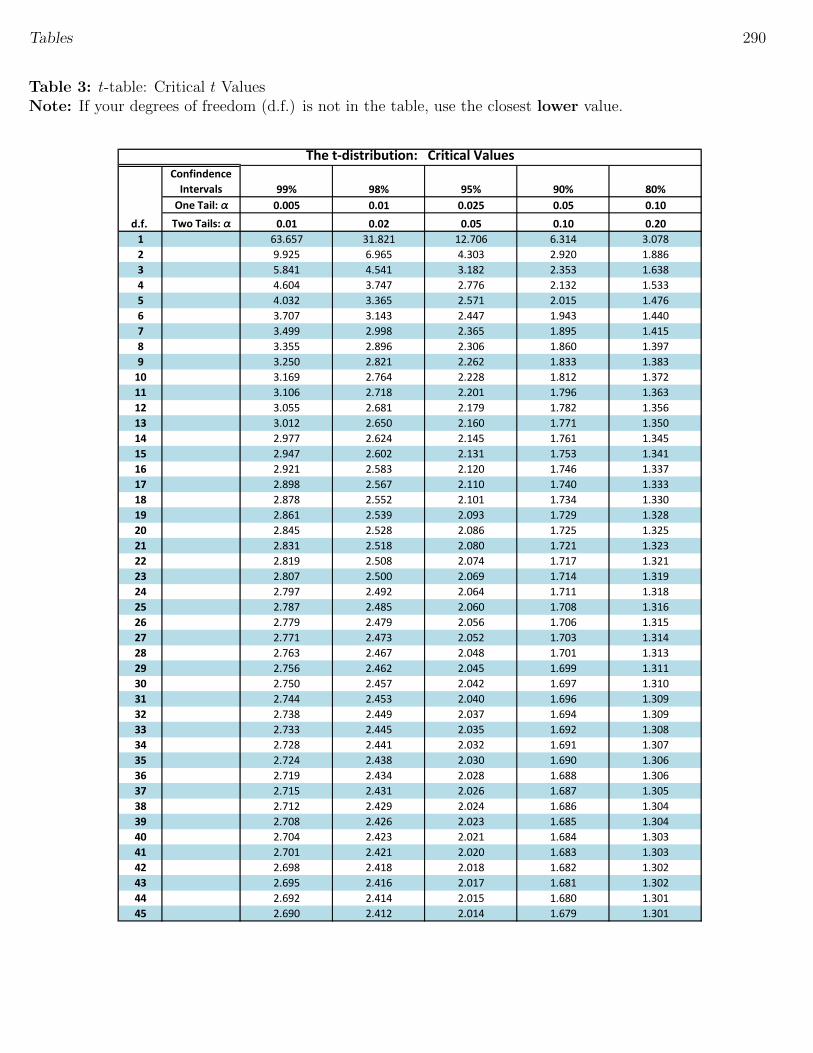
Table 3: t-table: Critical t ValuesNote: If your degrees of freedom (d.f.) is not in the table, use the closest lower value.
Confindence
Intervals 99% 98% 95% 90% 80%
One Tail: a 0.005 0.01 0.025 0.05 0.10
d.f. Two Tails: a 0.01 0.02 0.05 0.10 0.20
1 63.657 31.821 12.706 6.314 3.078
2 9.925 6.965 4.303 2.920 1.886
3 5.841 4.541 3.182 2.353 1.638
4 4.604 3.747 2.776 2.132 1.533
5 4.032 3.365 2.571 2.015 1.476
6 3.707 3.143 2.447 1.943 1.440
7 3.499 2.998 2.365 1.895 1.415
8 3.355 2.896 2.306 1.860 1.397
9 3.250 2.821 2.262 1.833 1.383
10 3.169 2.764 2.228 1.812 1.372
11 3.106 2.718 2.201 1.796 1.363
12 3.055 2.681 2.179 1.782 1.356
13 3.012 2.650 2.160 1.771 1.350
14 2.977 2.624 2.145 1.761 1.345
15 2.947 2.602 2.131 1.753 1.341
16 2.921 2.583 2.120 1.746 1.337
17 2.898 2.567 2.110 1.740 1.333
18 2.878 2.552 2.101 1.734 1.330
19 2.861 2.539 2.093 1.729 1.328
20 2.845 2.528 2.086 1.725 1.325
21 2.831 2.518 2.080 1.721 1.323
22 2.819 2.508 2.074 1.717 1.321
23 2.807 2.500 2.069 1.714 1.319
24 2.797 2.492 2.064 1.711 1.318
25 2.787 2.485 2.060 1.708 1.316
26 2.779 2.479 2.056 1.706 1.315
27 2.771 2.473 2.052 1.703 1.314
28 2.763 2.467 2.048 1.701 1.313
29 2.756 2.462 2.045 1.699 1.311
30 2.750 2.457 2.042 1.697 1.310
31 2.744 2.453 2.040 1.696 1.309
32 2.738 2.449 2.037 1.694 1.309
33 2.733 2.445 2.035 1.692 1.308
34 2.728 2.441 2.032 1.691 1.307
35 2.724 2.438 2.030 1.690 1.306
36 2.719 2.434 2.028 1.688 1.306
37 2.715 2.431 2.026 1.687 1.305
38 2.712 2.429 2.024 1.686 1.304
39 2.708 2.426 2.023 1.685 1.304
40 2.704 2.423 2.021 1.684 1.303
41 2.701 2.421 2.020 1.683 1.303
42 2.698 2.418 2.018 1.682 1.302
43 2.695 2.416 2.017 1.681 1.302
44 2.692 2.414 2.015 1.680 1.301
45 2.690 2.412 2.014 1.679 1.301
The t-distribution: Critical Values
Tables 291
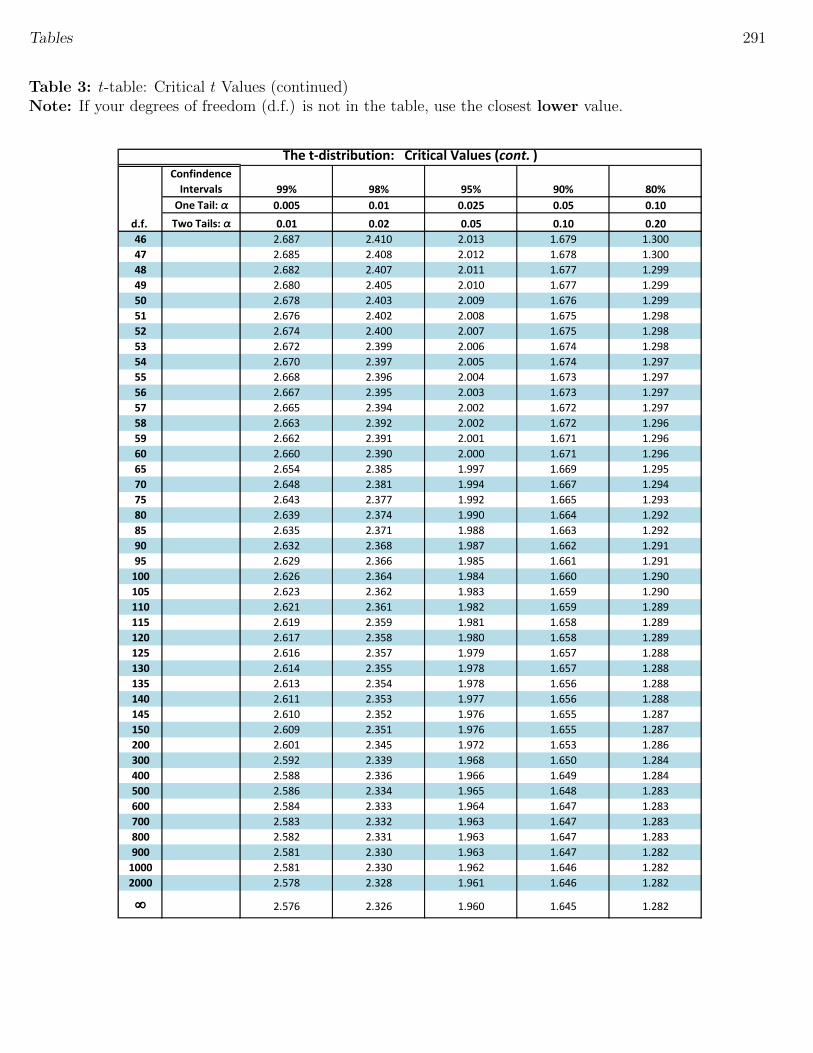
Table 3: t-table: Critical t Values (continued)Note: If your degrees of freedom (d.f.) is not in the table, use the closest lower value.
Confindence
Intervals 99% 98% 95% 90% 80%
One Tail: a 0.005 0.01 0.025 0.05 0.10
d.f. Two Tails: a 0.01 0.02 0.05 0.10 0.20
46 2.687 2.410 2.013 1.679 1.300
47 2.685 2.408 2.012 1.678 1.300
48 2.682 2.407 2.011 1.677 1.299
49 2.680 2.405 2.010 1.677 1.299
50 2.678 2.403 2.009 1.676 1.299
51 2.676 2.402 2.008 1.675 1.298
52 2.674 2.400 2.007 1.675 1.298
53 2.672 2.399 2.006 1.674 1.298
54 2.670 2.397 2.005 1.674 1.297
55 2.668 2.396 2.004 1.673 1.297
56 2.667 2.395 2.003 1.673 1.297
57 2.665 2.394 2.002 1.672 1.297
58 2.663 2.392 2.002 1.672 1.296
59 2.662 2.391 2.001 1.671 1.296
60 2.660 2.390 2.000 1.671 1.296
65 2.654 2.385 1.997 1.669 1.295
70 2.648 2.381 1.994 1.667 1.294
75 2.643 2.377 1.992 1.665 1.293
80 2.639 2.374 1.990 1.664 1.292
85 2.635 2.371 1.988 1.663 1.292
90 2.632 2.368 1.987 1.662 1.291
95 2.629 2.366 1.985 1.661 1.291
100 2.626 2.364 1.984 1.660 1.290
105 2.623 2.362 1.983 1.659 1.290
110 2.621 2.361 1.982 1.659 1.289
115 2.619 2.359 1.981 1.658 1.289
120 2.617 2.358 1.980 1.658 1.289
125 2.616 2.357 1.979 1.657 1.288
130 2.614 2.355 1.978 1.657 1.288
135 2.613 2.354 1.978 1.656 1.288
140 2.611 2.353 1.977 1.656 1.288
145 2.610 2.352 1.976 1.655 1.287
150 2.609 2.351 1.976 1.655 1.287
200 2.601 2.345 1.972 1.653 1.286
300 2.592 2.339 1.968 1.650 1.284
400 2.588 2.336 1.966 1.649 1.284
500 2.586 2.334 1.965 1.648 1.283
600 2.584 2.333 1.964 1.647 1.283
700 2.583 2.332 1.963 1.647 1.283
800 2.582 2.331 1.963 1.647 1.283
900 2.581 2.330 1.963 1.647 1.282
1000 2.581 2.330 1.962 1.646 1.282
2000 2.578 2.328 1.961 1.646 1.282
∞ 2.576 2.326 1.960 1.645 1.282
The t-distribution: Critical Values (cont. )
Tables 292
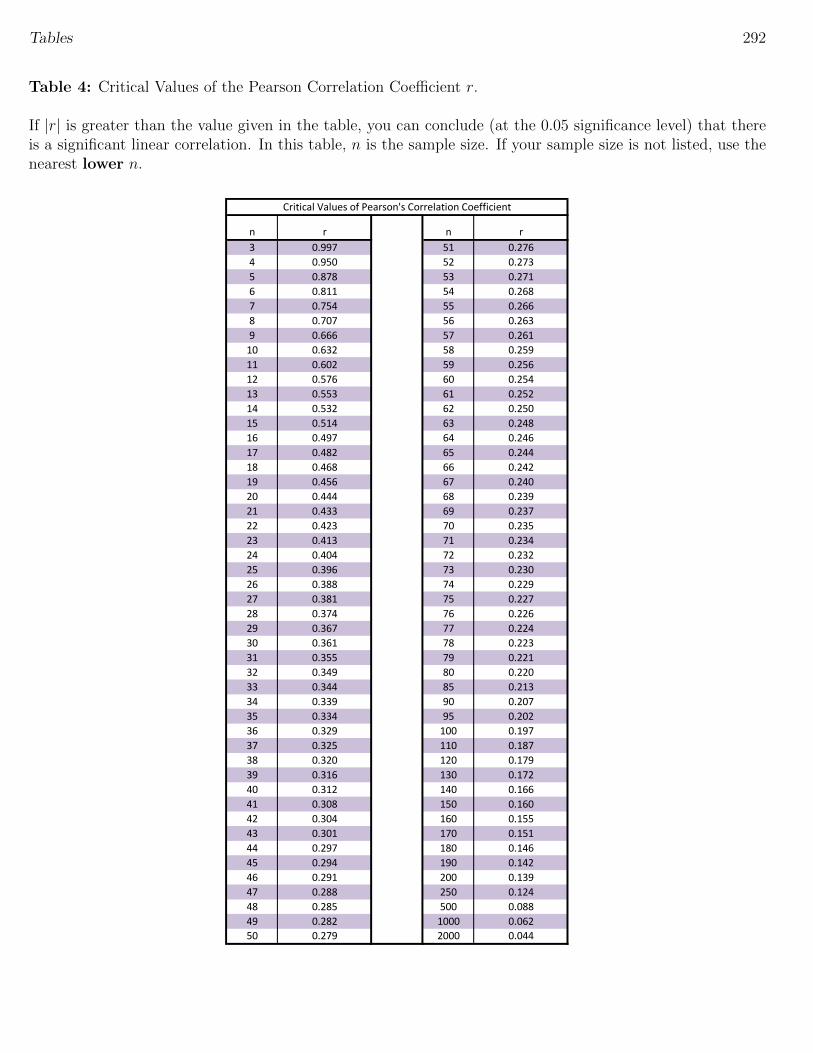
Table 4: Critical Values of the Pearson Correlation Coefficient r.
If |r| is greater than the value given in the table, you can conclude (at the 0.05 significance level) that thereis a significant linear correlation. In this table, n is the sample size. If your sample size is not listed, use thenearest lower n.
n r n r
3 0.997 51 0.276
4 0.950 52 0.273
5 0.878 53 0.271
6 0.811 54 0.268
7 0.754 55 0.266
8 0.707 56 0.263
9 0.666 57 0.261
10 0.632 58 0.259
11 0.602 59 0.256
12 0.576 60 0.254
13 0.553 61 0.252
14 0.532 62 0.250
15 0.514 63 0.248
16 0.497 64 0.246
17 0.482 65 0.244
18 0.468 66 0.242
19 0.456 67 0.240
20 0.444 68 0.239
21 0.433 69 0.237
22 0.423 70 0.235
23 0.413 71 0.234
24 0.404 72 0.232
25 0.396 73 0.230
26 0.388 74 0.229
27 0.381 75 0.227
28 0.374 76 0.226
29 0.367 77 0.224
30 0.361 78 0.223
31 0.355 79 0.221
32 0.349 80 0.220
33 0.344 85 0.213
34 0.339 90 0.207
35 0.334 95 0.202
36 0.329 100 0.197
37 0.325 110 0.187
38 0.320 120 0.179
39 0.316 130 0.172
40 0.312 140 0.166
41 0.308 150 0.160
42 0.304 160 0.155
43 0.301 170 0.151
44 0.297 180 0.146
45 0.294 190 0.142
46 0.291 200 0.139
47 0.288 250 0.124
48 0.285 500 0.088
49 0.282 1000 0.062
50 0.279 2000 0.044
Critical Values of Pearson's Correlation Coefficient
Tables 293
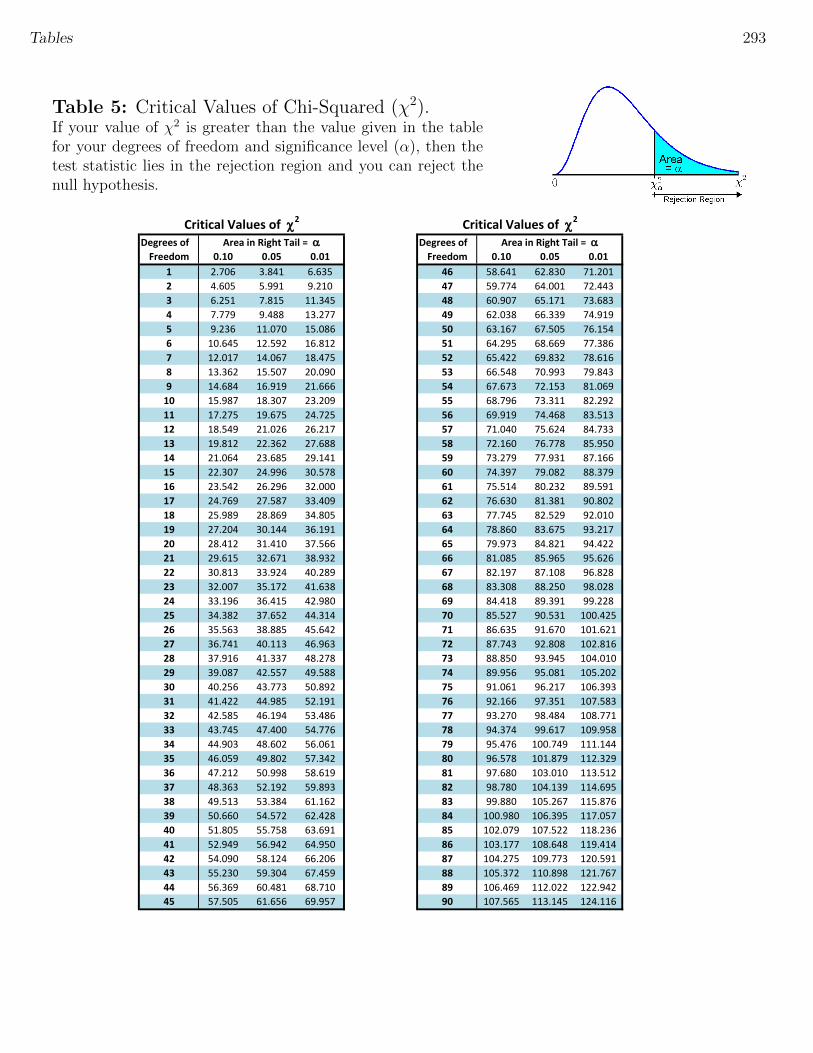
Table 5: Critical Values of Chi-Squared (χ2).If your value of χ2 is greater than the value given in the tablefor your degrees of freedom and significance level (α), then thetest statistic lies in the rejection region and you can reject thenull hypothesis.
Degrees of Degrees of
Freedom 0.10 0.05 0.01 Freedom 0.10 0.05 0.01
1 2.706 3.841 6.635 46 58.641 62.830 71.201
2 4.605 5.991 9.210 47 59.774 64.001 72.443
3 6.251 7.815 11.345 48 60.907 65.171 73.683
4 7.779 9.488 13.277 49 62.038 66.339 74.919
5 9.236 11.070 15.086 50 63.167 67.505 76.154
6 10.645 12.592 16.812 51 64.295 68.669 77.386
7 12.017 14.067 18.475 52 65.422 69.832 78.616
8 13.362 15.507 20.090 53 66.548 70.993 79.843
9 14.684 16.919 21.666 54 67.673 72.153 81.069
10 15.987 18.307 23.209 55 68.796 73.311 82.292
11 17.275 19.675 24.725 56 69.919 74.468 83.513
12 18.549 21.026 26.217 57 71.040 75.624 84.733
13 19.812 22.362 27.688 58 72.160 76.778 85.950
14 21.064 23.685 29.141 59 73.279 77.931 87.166
15 22.307 24.996 30.578 60 74.397 79.082 88.379
16 23.542 26.296 32.000 61 75.514 80.232 89.591
17 24.769 27.587 33.409 62 76.630 81.381 90.802
18 25.989 28.869 34.805 63 77.745 82.529 92.010
19 27.204 30.144 36.191 64 78.860 83.675 93.217
20 28.412 31.410 37.566 65 79.973 84.821 94.422
21 29.615 32.671 38.932 66 81.085 85.965 95.626
22 30.813 33.924 40.289 67 82.197 87.108 96.828
23 32.007 35.172 41.638 68 83.308 88.250 98.028
24 33.196 36.415 42.980 69 84.418 89.391 99.228
25 34.382 37.652 44.314 70 85.527 90.531 100.425
26 35.563 38.885 45.642 71 86.635 91.670 101.621
27 36.741 40.113 46.963 72 87.743 92.808 102.816
28 37.916 41.337 48.278 73 88.850 93.945 104.010
29 39.087 42.557 49.588 74 89.956 95.081 105.202
30 40.256 43.773 50.892 75 91.061 96.217 106.393
31 41.422 44.985 52.191 76 92.166 97.351 107.583
32 42.585 46.194 53.486 77 93.270 98.484 108.771
33 43.745 47.400 54.776 78 94.374 99.617 109.958
34 44.903 48.602 56.061 79 95.476 100.749 111.144
35 46.059 49.802 57.342 80 96.578 101.879 112.329
36 47.212 50.998 58.619 81 97.680 103.010 113.512
37 48.363 52.192 59.893 82 98.780 104.139 114.695
38 49.513 53.384 61.162 83 99.880 105.267 115.876
39 50.660 54.572 62.428 84 100.980 106.395 117.057
40 51.805 55.758 63.691 85 102.079 107.522 118.236
41 52.949 56.942 64.950 86 103.177 108.648 119.414
42 54.090 58.124 66.206 87 104.275 109.773 120.591
43 55.230 59.304 67.459 88 105.372 110.898 121.767
44 56.369 60.481 68.710 89 106.469 112.022 122.942
45 57.505 61.656 69.957 90 107.565 113.145 124.116
Area in Right Tail = a Area in Right Tail = a
Critical Values of c2 Critical Values of c2