Table SI. Spearman correlations between variables. · Table SI. Spearman correlations between...
3
Table SI. Spearman correlations between variables. VPA score IQ Sensation Seeking Perseverance Premeditation Urgency Age YFAS symp BMI (kg/m²) ρ p .001 .992 -.048 .629 .001 .992 .064 .519 .017 .865 .040 .684 .013 .897 .372 <.001 YFAS symp ρ p .082 .408 -.110 .266 -.211 .030 -.016 .875 -.190 .053 .350 <.001 -.187 .056 Age ρ p -.099 .314 -.203 .038 -.003 .975 .014 .886 .013 .895 -.132 .180 Urgency ρ p -.121 .222 -.023 .817 -.054 .583 .344 <.001 .113 .253 Premeditation ρ p -.192 .050 -.007 .947 .313 .001 .149 .128 Perseverance ρ p -.027 .781 -.074 .456 -.160 .102 Sensation Seeking ρ p -.134 .172 -.153 .119 IQ ρ p .293 .002
Transcript of Table SI. Spearman correlations between variables. · Table SI. Spearman correlations between...
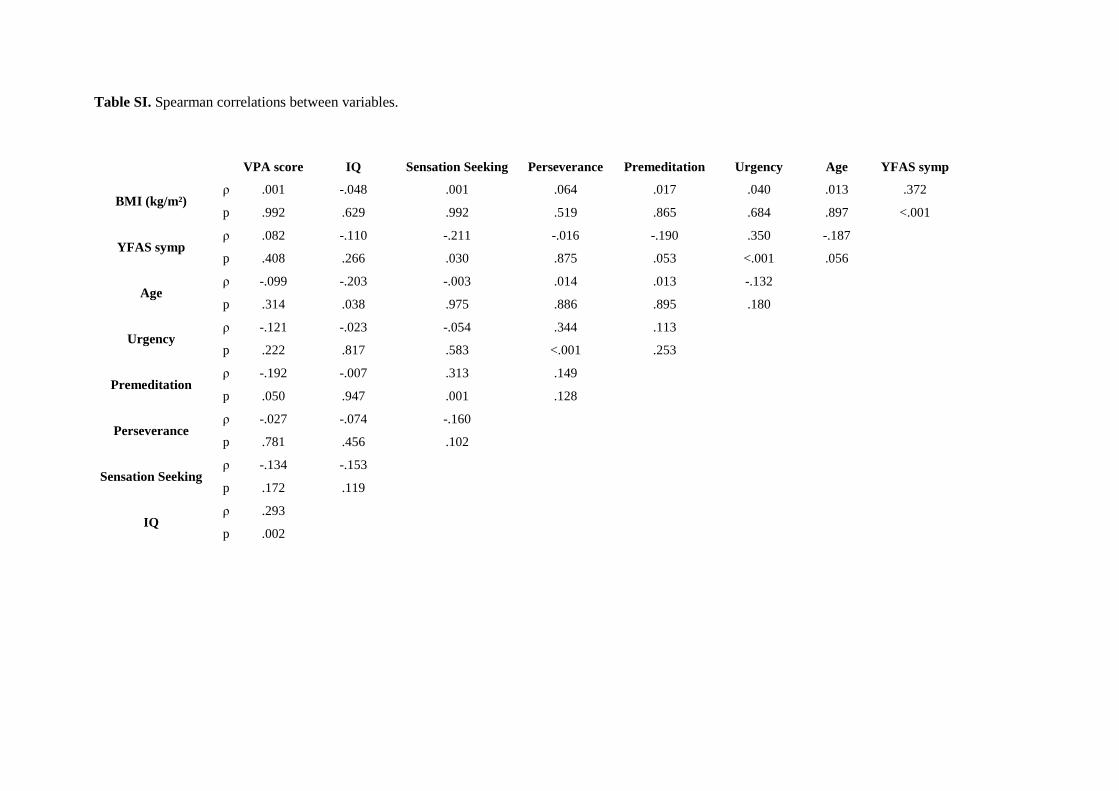
Table SI. Spearman correlations between variables.
VPA score IQ Sensation Seeking Perseverance Premeditation Urgency Age YFAS symp
BMI (kg/m²) ρ
p
.001
.992
-.048
.629
.001
.992
.064
.519
.017
.865
.040
.684
.013
.897
.372
<.001
YFAS symp ρ
p
.082
.408
-.110
.266
-.211
.030
-.016
.875
-.190
.053
.350
<.001
-.187
.056
Age ρ
p
-.099
.314
-.203
.038
-.003
.975
.014
.886
.013
.895
-.132
.180
Urgency ρ
p
-.121
.222
-.023
.817
-.054
.583
.344
<.001
.113
.253
Premeditation ρ
p
-.192
.050
-.007
.947
.313
.001
.149
.128
Perseverance ρ
p
-.027
.781
-.074
.456
-.160
.102
Sensation Seeking ρ
p
-.134
.172
-.153
.119
IQ ρ
p
.293
.002
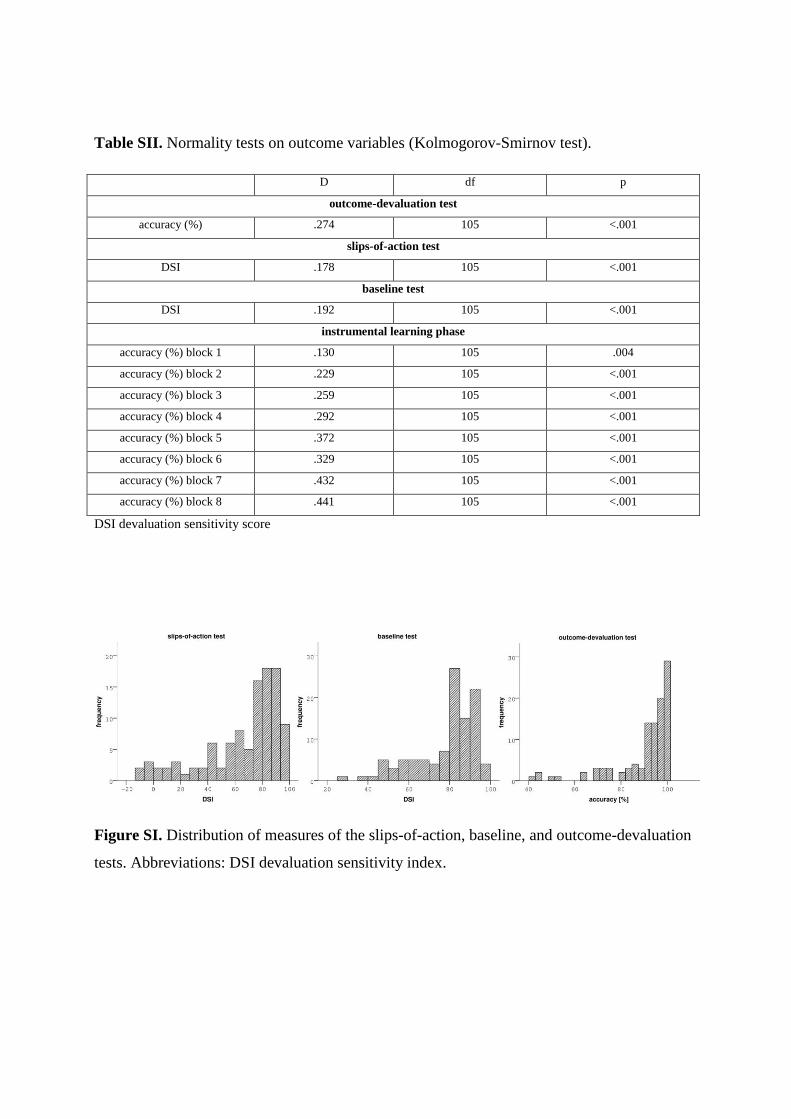
Table SII. Normality tests on outcome variables (Kolmogorov-Smirnov test).
D df p
outcome-devaluation test
accuracy (%) .274 105 <.001
slips-of-action test
DSI .178 105 <.001
baseline test
DSI .192 105 <.001
instrumental learning phase
accuracy (%) block 1 .130 105 .004
accuracy (%) block 2 .229 105 <.001
accuracy (%) block 3 .259 105 <.001
accuracy (%) block 4 .292 105 <.001
accuracy (%) block 5 .372 105 <.001
accuracy (%) block 6 .329 105 <.001
accuracy (%) block 7 .432 105 <.001
accuracy (%) block 8 .441 105 <.001
DSI devaluation sensitivity score
Figure SI. Distribution of measures of the slips-of-action, baseline, and outcome-devaluation
tests. Abbreviations: DSI devaluation sensitivity index.
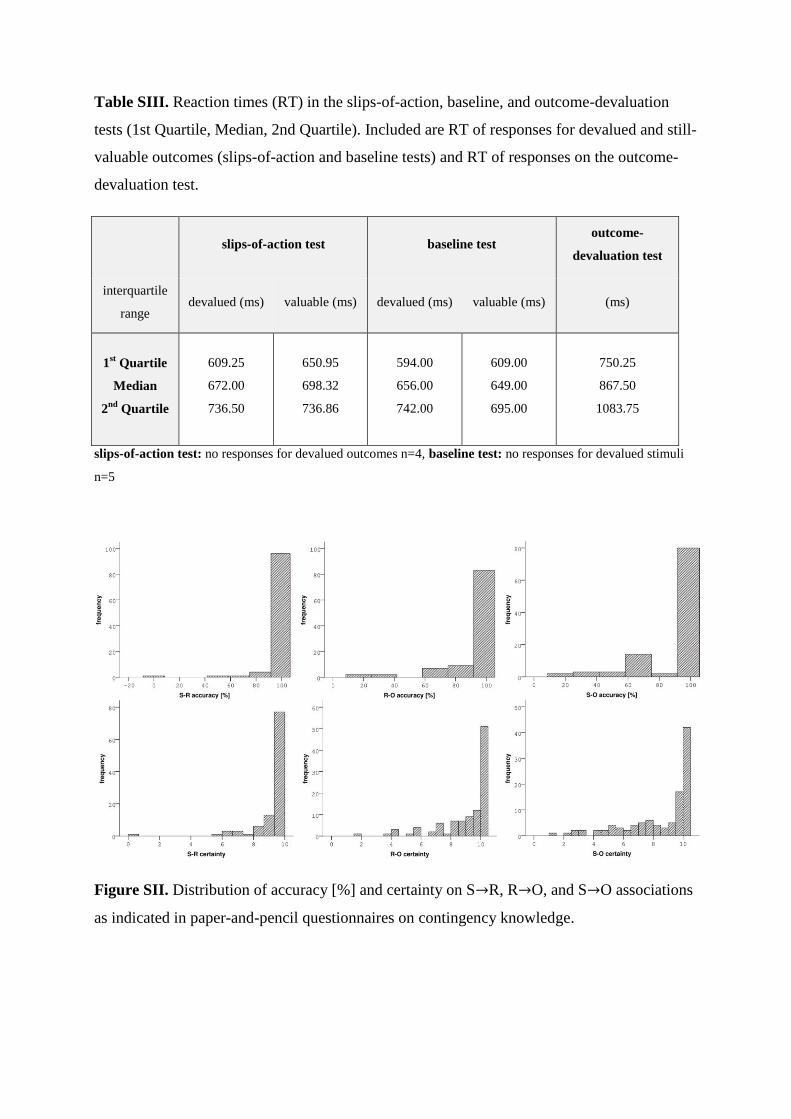
Table SIII. Reaction times (RT) in the slips-of-action, baseline, and outcome-devaluation
tests (1st Quartile, Median, 2nd Quartile). Included are RT of responses for devalued and still-
valuable outcomes (slips-of-action and baseline tests) and RT of responses on the outcome-
devaluation test.
slips-of-action test baseline test outcome-
devaluation test
interquartile
range devalued (ms) valuable (ms) devalued (ms) valuable (ms) (ms)
1st Quartile
Median
2nd
Quartile
609.25
672.00
736.50
650.95
698.32
736.86
594.00
656.00
742.00
609.00
649.00
695.00
750.25
867.50
1083.75
slips-of-action test: no responses for devalued outcomes n=4, baseline test: no responses for devalued stimuli
n=5
Figure SII. Distribution of accuracy [%] and certainty on S→R, R→O, and S→O associations
as indicated in paper-and-pencil questionnaires on contingency knowledge.