Table of Contents - Nature Figure 4. Cs+ and Tl+ ions binding sites in the fluoride riboswitch. a,...
18
a b c d WWW.NATURE.COM/NATURE | 1 SUPPLEMENTARY INFORMATION doi:10.1038/nature11152
Transcript of Table of Contents - Nature Figure 4. Cs+ and Tl+ ions binding sites in the fluoride riboswitch. a,...
a b
c d
WWW.NATURE.COM/NATURE | 1
SUPPLEMENTARY INFORMATIONdoi:10.1038/nature11152
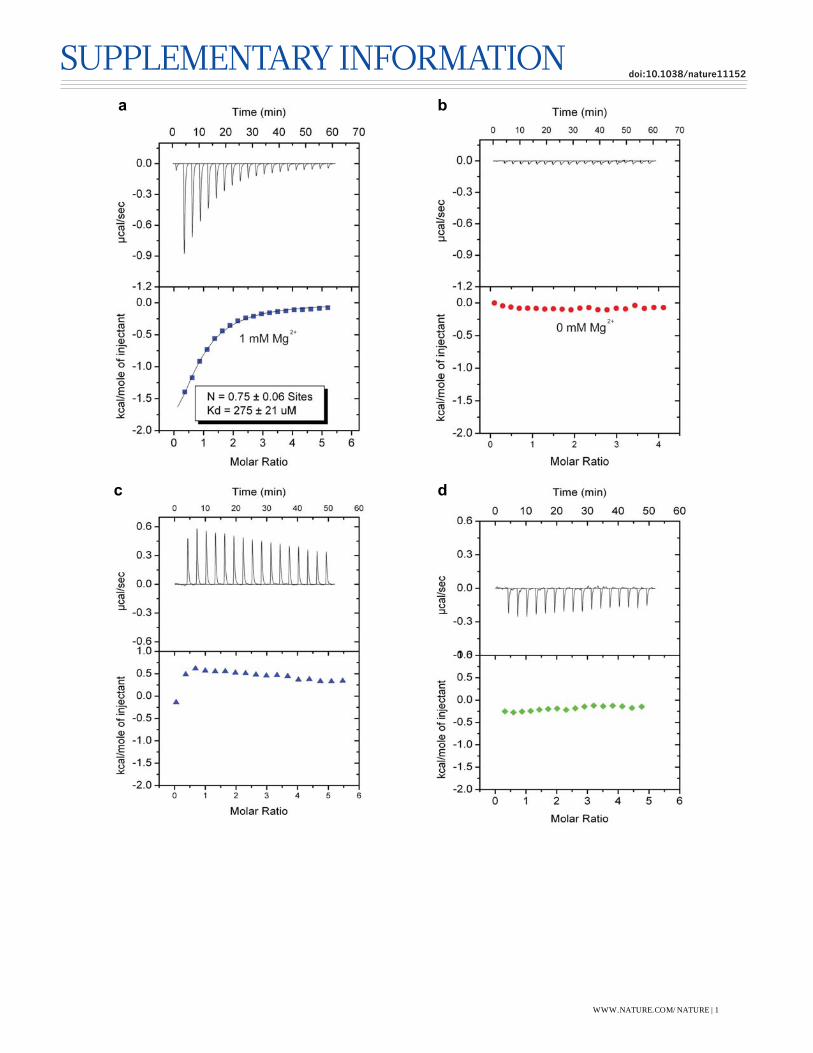
Supplementary Figure 1. ITC-monitored effect of cations on fluoride ion binding to the
fluoride riboswitch. a, ITC binding curve on addition of KF to the fluoride riboswitch in the
presence of 1 mM MgSO4. The Kd is 275 ± 21 μM, the stoichiometry of binding approaches 1:1
(N = 0.75), with estimated thermodynamic parameters of ΔH = -3.3 ± 0.3 Kcal/mol and ΔS = 5.1
cal/mol/deg. b, No binding is detected by ITC on addition of KF to the fluoride riboswitch in the
absence of added MgSO4. c, ITC binding curve on addition of chloride ion (added KCl) to the
fluoride riboswitch in the presence of 20 mM MgSO4. d, No binding is detected by ITC on
addition of fluoride ion (added KF) to the fluoride riboswitch in the presence of 20 mM Li2SO4.
The buffer was 50 mM K-acetate, pH 6.8.
WWW.NATURE.COM/NATURE | 2
SUPPLEMENTARY INFORMATIONRESEARCHdoi:10.1038/nature11152
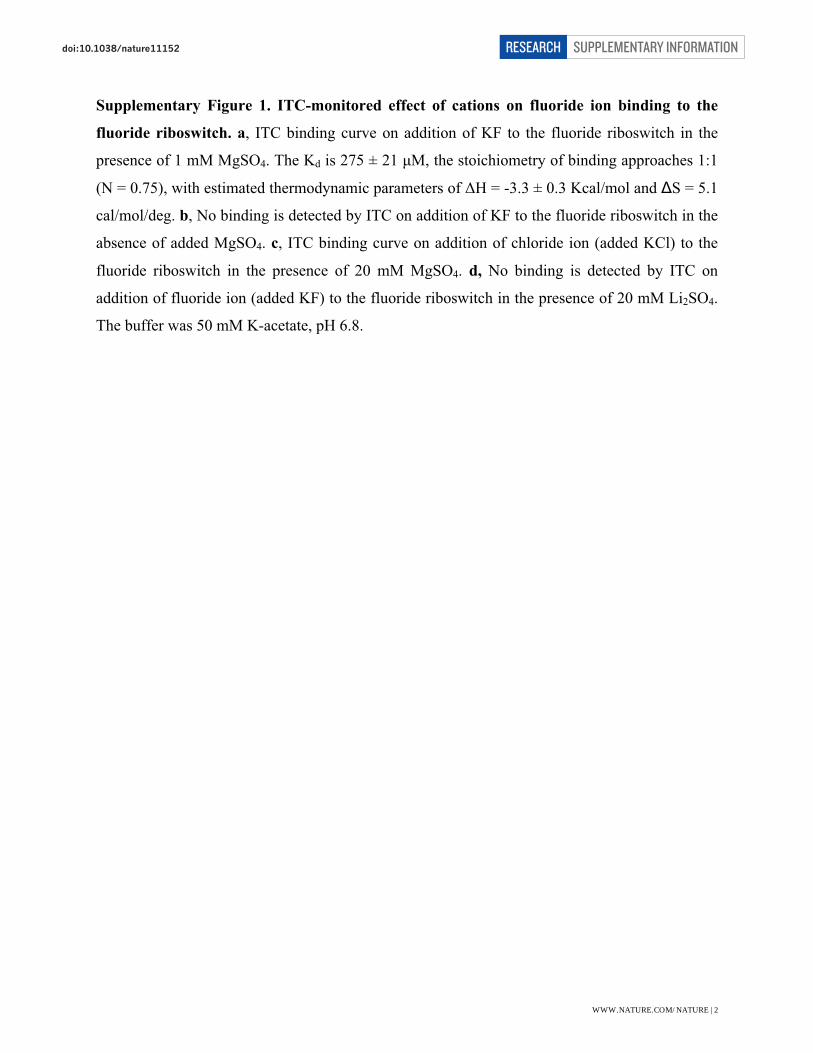
Supplementary Figure 2. Location of four Ir(NH3)63+ binding sites in the ligand-bound
fluoride riboswitch. The refined fluoride riboswitch structure based on a 2.3 Å Ir3+ SAD data set
superposed with the anomalous Ir3+ map (green) coutoured at 3σ level. The four bound Ir3+ ions
are shown as purple spheres and indicated by red arrows. The blue spheres represent symmetry
related Ir3+ ions.
WWW.NATURE.COM/NATURE | 3
SUPPLEMENTARY INFORMATIONRESEARCHdoi:10.1038/nature11152
a
b
WWW.NATURE.COM/NATURE | 4
SUPPLEMENTARY INFORMATIONRESEARCHdoi:10.1038/nature11152
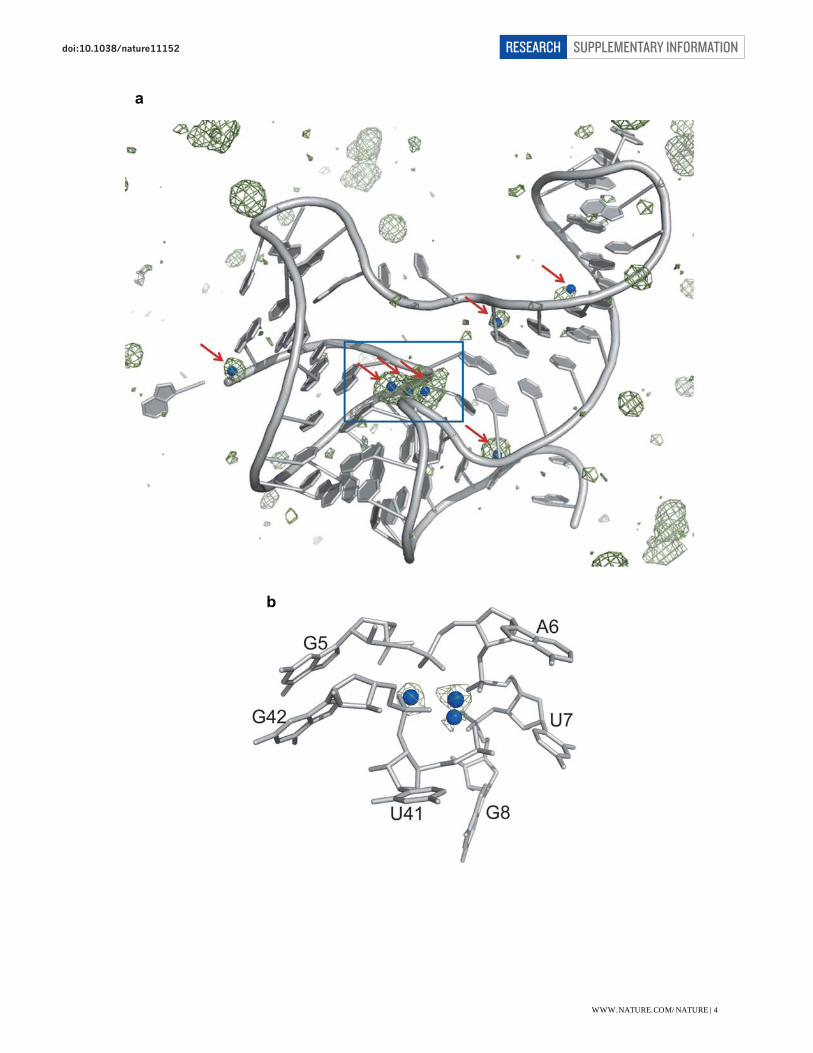
Supplementary Figure 3. Mn2+ ion binding sites in the fluoride riboswitch. a, The refined
fluoride riboswitch structure (Mn2+ anomalous data) superposed with anomalous map (deep
green) contoured at 3σ level. The bound Mn2+ ions are shown as blue spheres and indicated by
red arrows. b, The three bound Mn2+ ions in the center of the fluoride riboswitch (9σ level) have
been identified in the map. Mn2+ ions replace the three Mg2+ ions coordinated with the bound
fluoride.
WWW.NATURE.COM/NATURE | 5
SUPPLEMENTARY INFORMATIONRESEARCHdoi:10.1038/nature11152
a
b
WWW.NATURE.COM/NATURE | 6
SUPPLEMENTARY INFORMATIONRESEARCHdoi:10.1038/nature11152
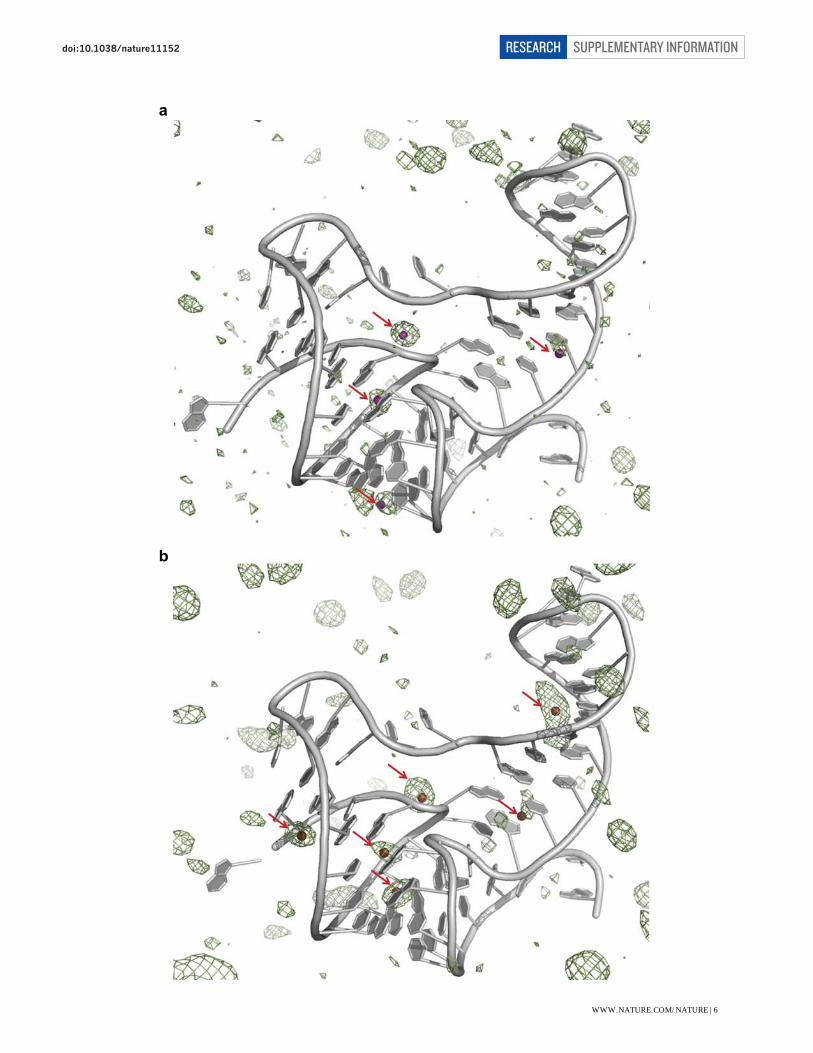
Supplementary Figure 4. Cs+ and Tl+ ions binding sites in the fluoride riboswitch. a, The
refined fluoride riboswitch structure (Cs+ anomalous data) superposed with anomalous map
(deep green) contoured at 3σ level. The bound Cs+ ions are shown as deep purple spheres and
indicated by red arrows. b, The refined fluoride riboswitch structure (Tl+ anomalous data)
superposed with anomalous map (deep green) contoured at 3σ level. The bound Tl+ ions are
shown as brown spheres and indicated by red arrows.
WWW.NATURE.COM/NATURE | 7
SUPPLEMENTARY INFORMATIONRESEARCHdoi:10.1038/nature11152
a
b
c
WWW.NATURE.COM/NATURE | 8
SUPPLEMENTARY INFORMATIONRESEARCHdoi:10.1038/nature11152

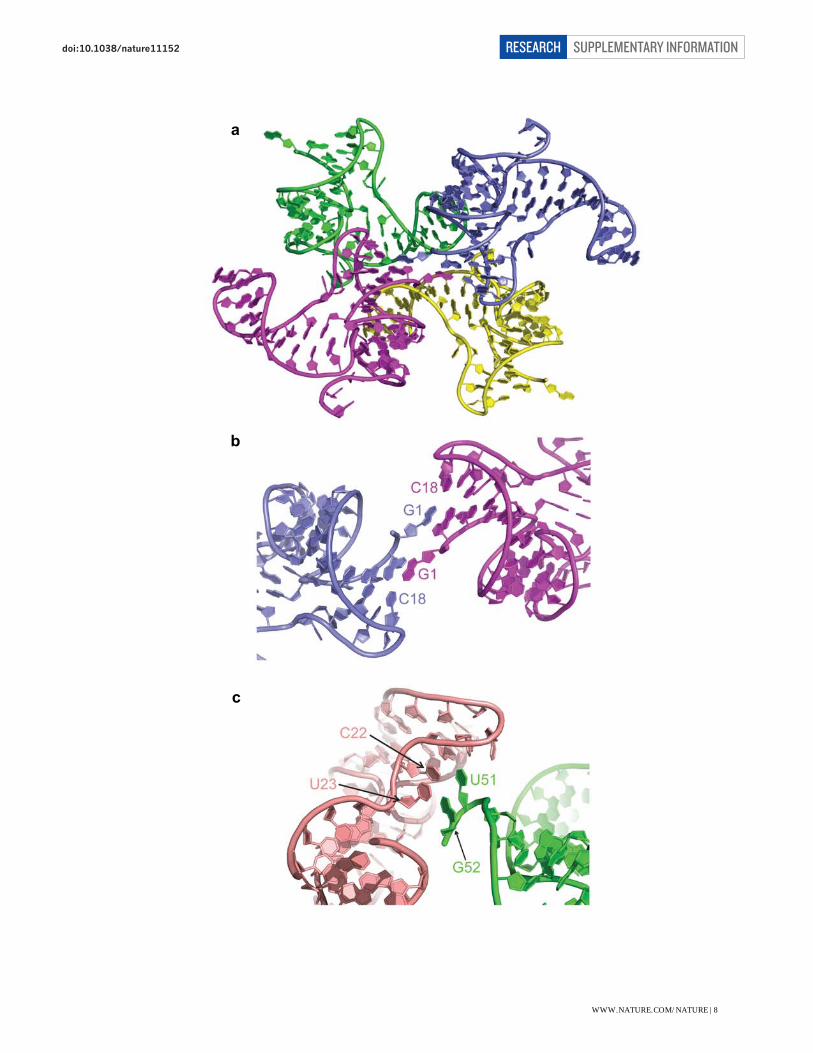
Supplementary Figure 5. Crystal packing interactions in the structure of the ligand-bound
fluoride riboswitch. a, Packing of four fluoride riboswitch molecules, each of which is
represented in a different color. b, Formation of symmetric Watson-Crick G1-C18 pairs between
blue and purple-colored structures of the fluoride riboswitch. Note that 5’-terminal G1 does not
pair with C18 in the same molecule. c, Formation of Watson-Crick G52-C22 pair between
fluoride riboswitches from different tetrameric arrangements of the ligand-bound fluoride
riboswitch. In addition, U51 and U23 from the two molecules are stacked on either side of the
G52-C22 pair. Note that U51 and G52 are 3’-terminal residues.
WWW.NATURE.COM/NATURE | 9
SUPPLEMENTARY INFORMATIONRESEARCHdoi:10.1038/nature11152
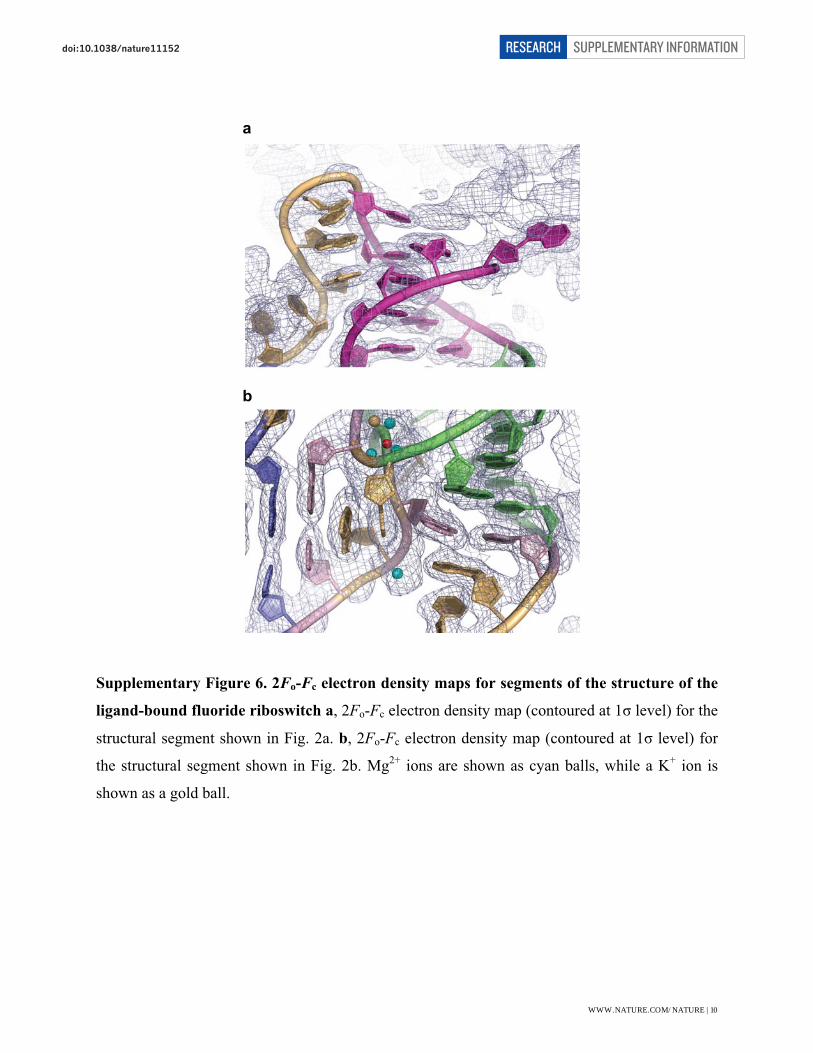
Supplementary Figure 6. 2Fo-Fc electron density maps for segments of the structure of the
ligand-bound fluoride riboswitch a, 2Fo-Fc electron density map (contoured at 1σ level) for the
structural segment shown in Fig. 2a. b, 2Fo-Fc electron density map (contoured at 1σ level) for
the structural segment shown in Fig. 2b. Mg2+ ions are shown as cyan balls, while a K+ ion is
shown as a gold ball.
a
b
WWW.NATURE.COM/NATURE | 10
SUPPLEMENTARY INFORMATIONRESEARCHdoi:10.1038/nature11152
a
b
WWW.NATURE.COM/NATURE | 11
SUPPLEMENTARY INFORMATIONRESEARCHdoi:10.1038/nature11152
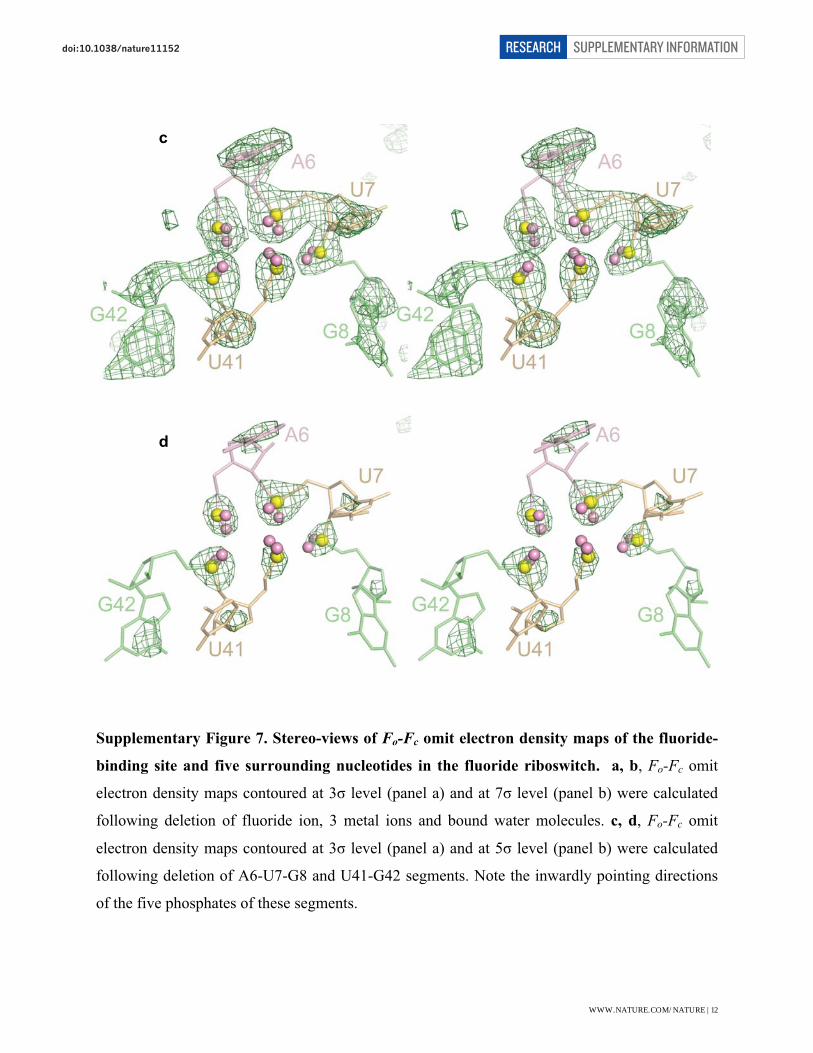
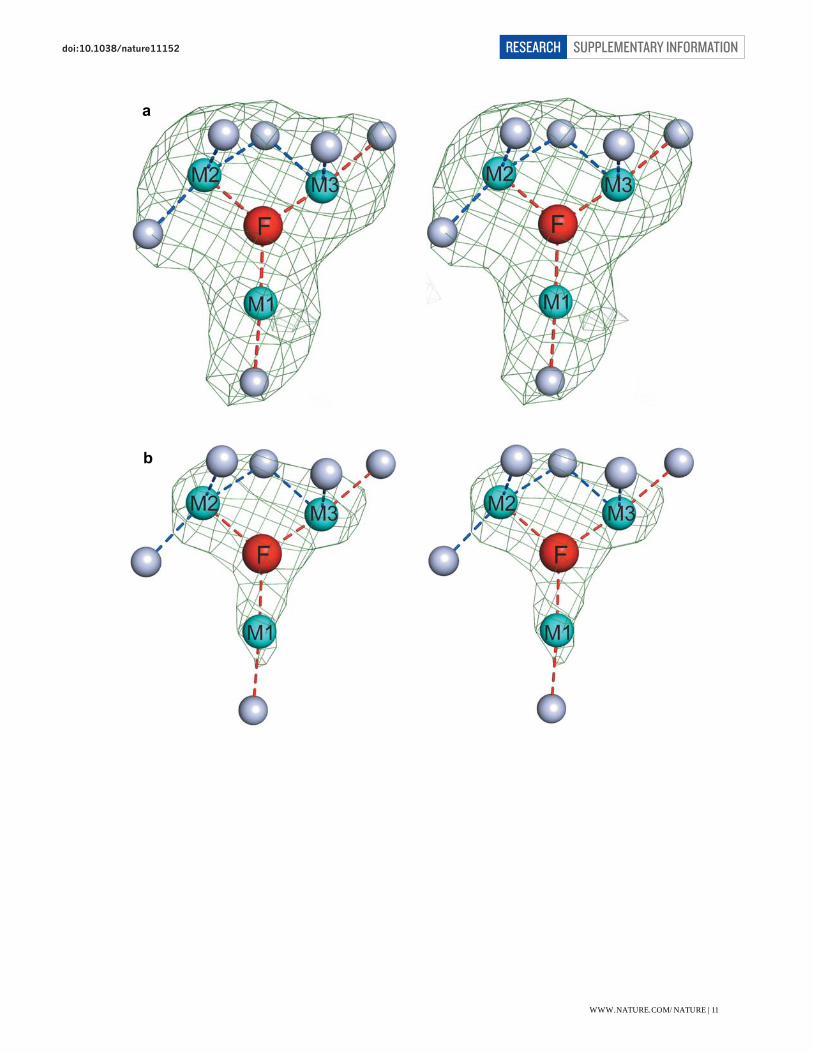
Supplementary Figure 7. Stereo-views of Fo-Fc omit electron density maps of the fluoride-
binding site and five surrounding nucleotides in the fluoride riboswitch. a, b, Fo-Fc omit
electron density maps contoured at 3σ level (panel a) and at 7σ level (panel b) were calculated
following deletion of fluoride ion, 3 metal ions and bound water molecules. c, d, Fo-Fc omit
electron density maps contoured at 3σ level (panel a) and at 5σ level (panel b) were calculated
following deletion of A6-U7-G8 and U41-G42 segments. Note the inwardly pointing directions
of the five phosphates of these segments.
c
d
WWW.NATURE.COM/NATURE | 12
SUPPLEMENTARY INFORMATIONRESEARCHdoi:10.1038/nature11152
a
b
c
d
WWW.NATURE.COM/NATURE | 13
SUPPLEMENTARY INFORMATIONRESEARCHdoi:10.1038/nature11152
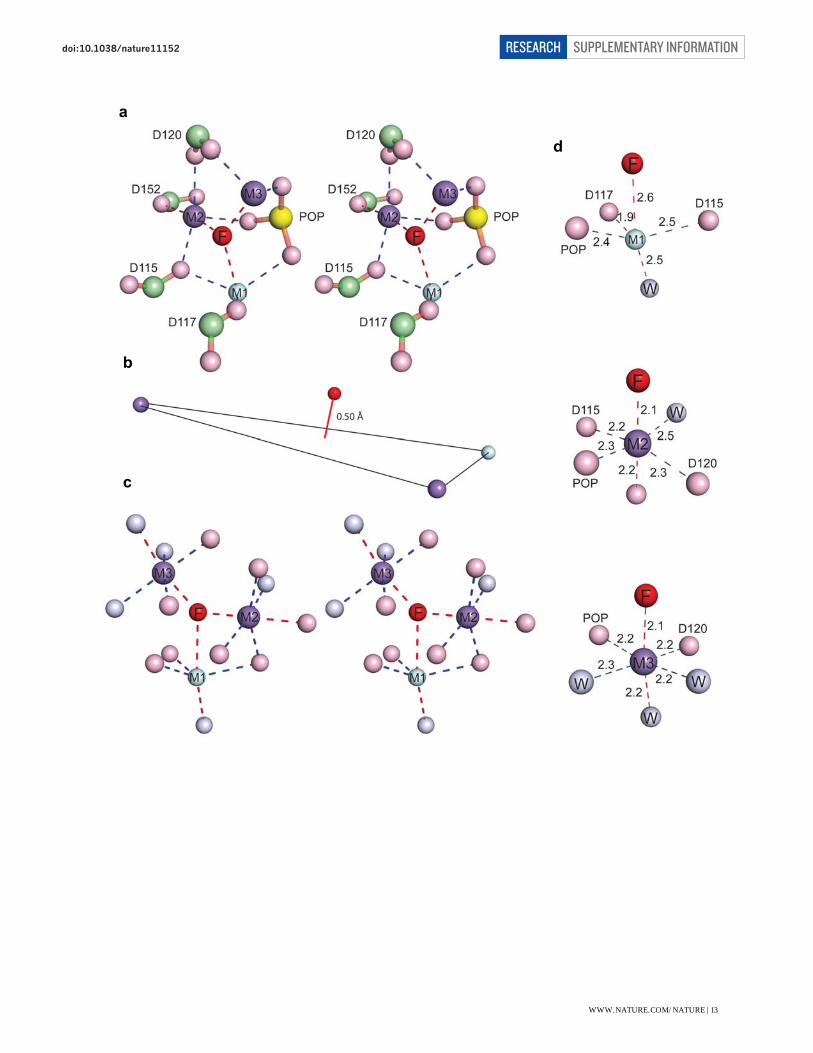
Supplementary Figure 8. Details of fluoride binding sites in the 1.9 Å fluoride-inhibited
pyrophosphase structure21 (crystals grown from 1 mM MnCl2 and 5 mM NaF-containing
buffer; PDB: 1E6A). The fluoride ion (red) is coordinated by three metal ions, namely two
Mn2+ (purple) ions and one Na+ (palecyan) ion. The three metal ions are coordinated by four
aspartic acid residues, one POP ligand and water molecules. a, An expanded stereo view
highlighting aspartate carboxylate oxygens (in pink, carbon atoms in green) and POP oxygens (in
pink, phosphorus in yellow) directly coordinated to the three metals ions labeled M1 (Na+ in
palecyan), M2 (Mn2+ in purple) and M3 (Mn2+ in purple), that in turn are directly coordinated to
the fluoride ion (in red). b, The fluoride ion is positioned 0.50 Å above the plane formed by the
three metal ions in the structure of the fluoride-inhibited pyrophosphatase. c, A stereo view of
the coordination geometries of fluoride ion (in red) with surrounding metal ions (in purple and
palecyan), and in turn coordination geometries of metals with surrounding aspartate carboxylate
oxygens (in pink) and POP ligand oxygens (in pink) and waters (in silver). Metal coordination
within square-planar positions are shown by dashed blue lines, while coordination in apical
positions are shown by dashed red lines in panels a, c and d. d, The octahedral coordination
geometries around metal ions M1, M2 and M3, together with coordination distances in Å. Note
that the fluoride ion adopts the apical coordination position for metal ions M1, M2 and M3, and
coordination distances to all three metal ions varies between 1.9 and 2.6 Å.
The arrangement of the three metal ions and one fluoride ion in the fluoride-inhibited
pyrophosphate structure is very similar to that observed in the ligand-bound fluoride riboswitch
as shown in Fig. 3.
WWW.NATURE.COM/NATURE | 14
SUPPLEMENTARY INFORMATIONRESEARCHdoi:10.1038/nature11152
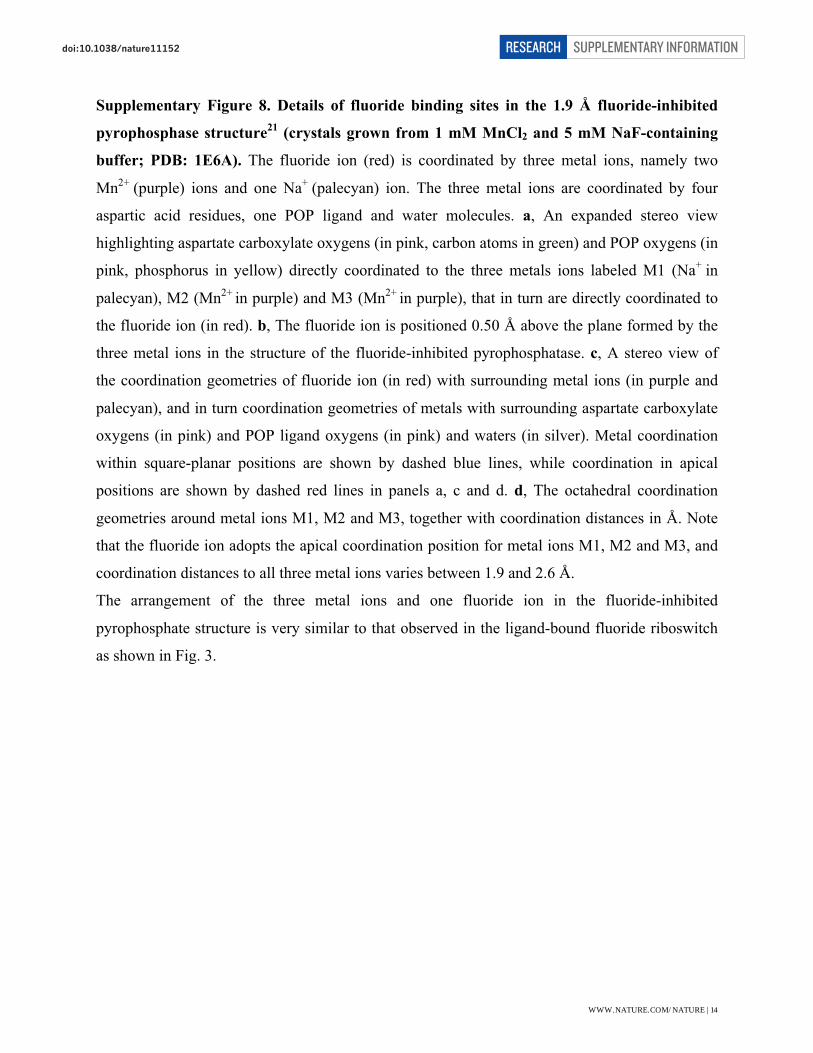
Supplementary Figure 9. 900 MHz imino proton NMR spectra (15 to 11 ppm) of the T.
petrophila fluoride riboswitch in the free and bound state. a, NMR spectrum of the riboswitch
in the free state (top) and in the fluoride-bound state (bottom). b, NMR spectrum of a mixture of
the free and bound states in slow exchange on the NMR time scale. Spectra were recorded in
buffer containing 50 mM K-acetate-d3, 5 mM Mg-sulfate, 90% H2O/10% D2O, pH 6.8, at 25 oC.
WWW.NATURE.COM/NATURE | 15
SUPPLEMENTARY INFORMATIONRESEARCHdoi:10.1038/nature11152
a
b
WWW.NATURE.COM/NATURE | 16
SUPPLEMENTARY INFORMATIONRESEARCHdoi:10.1038/nature11152
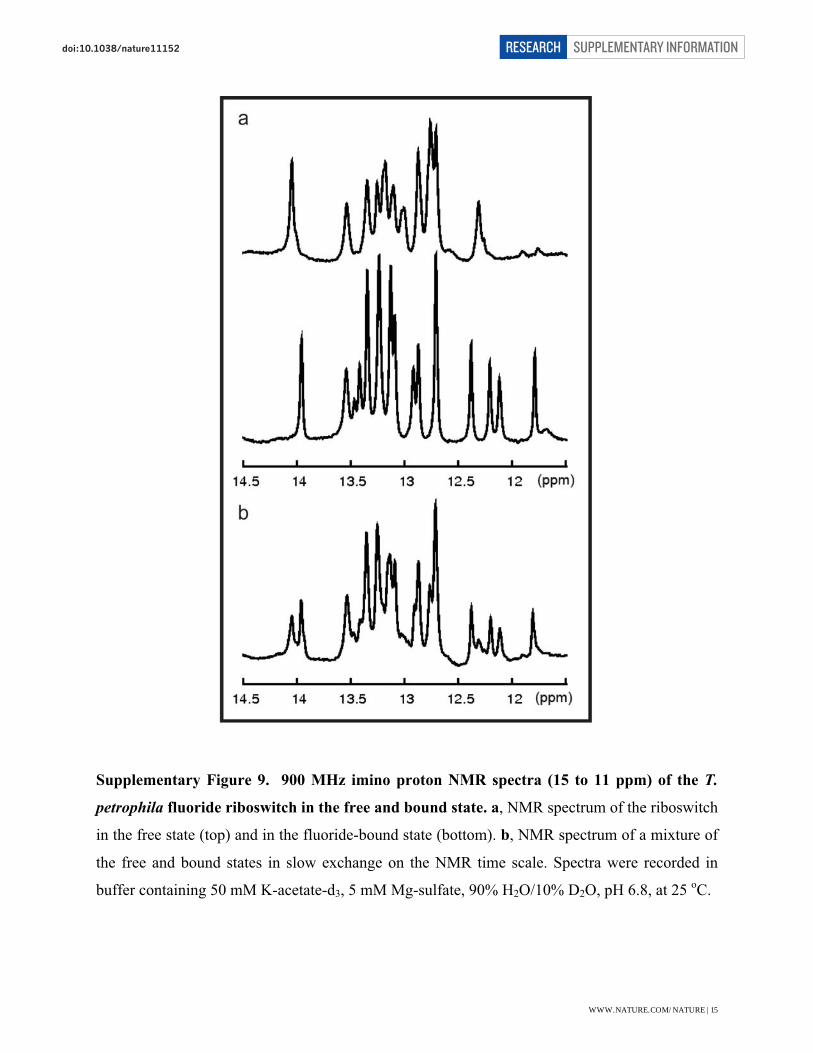
Supplementary Figure 10. Proposed transcription attenuation mechanism for the T.
petrophila fluoride riboswitch. The complete (sensing domain and expression platform) T.
petrophila fluoride riboswitch could interconvert between two conformations, one in which stem
1 forms in the presence of bound fluoride (ON state) (panel a) and an alternate conformation at
low fluoride concentrations where stem 1 is disrupted as a result of forming a transcription
terminator (OFF state) involving a stable stem loop ending in uracils at the 3’-end (panel b).
WWW.NATURE.COM/NATURE | 17
SUPPLEMENTARY INFORMATIONRESEARCHdoi:10.1038/nature11152
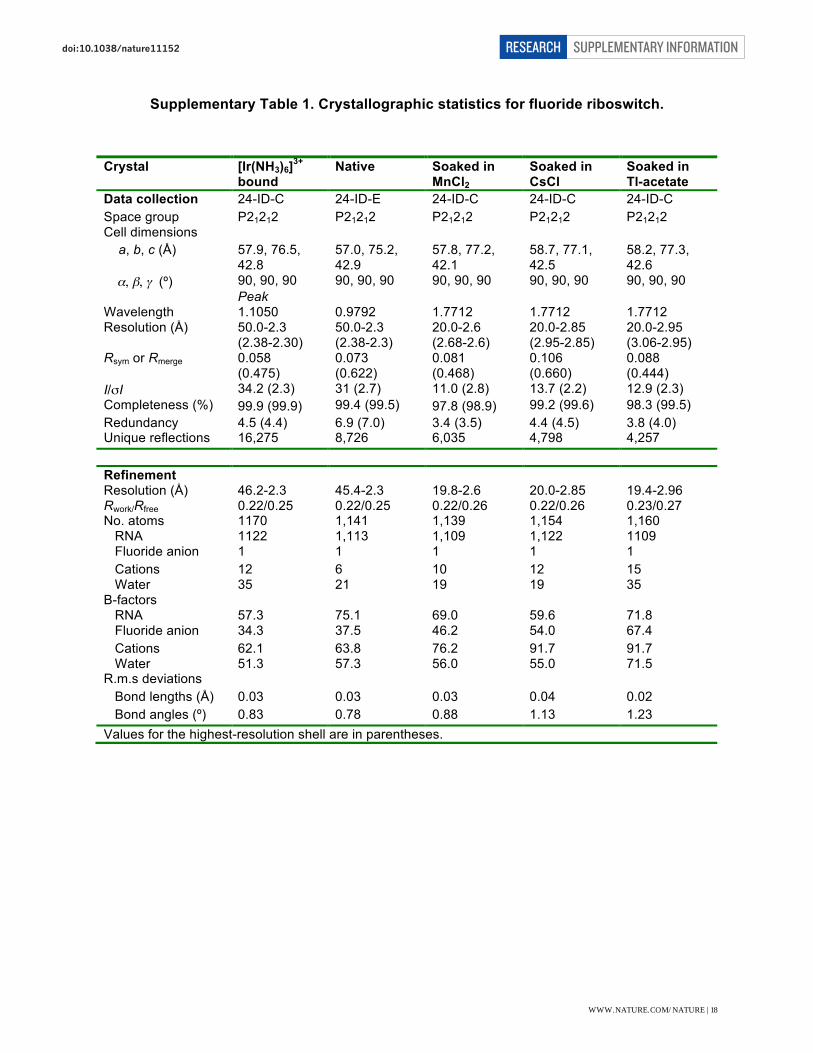
Supplementary Table 1. Crystallographic statistics for fluoride riboswitch.
Crystal [Ir(NH3)6]3+
bound Native
Soaked in MnCl2
Soaked in CsCl
Soaked in Tl-acetate
Data collection 24-ID-C 24-ID-E 24-ID-C 24-ID-C 24-ID-C Space group P21212 P21212 P21212 P21212 P21212 Cell dimensions a, b, c (Å) 57.9, 76.5,
42.8 57.0, 75.2, 42.9
57.8, 77.2, 42.1
58.7, 77.1, 42.5
58.2, 77.3, 42.6
α, β, γ (º) 90, 90, 90 90, 90, 90 90, 90, 90 90, 90, 90 90, 90, 90 Peak Wavelength 1.1050 0.9792 1.7712 1.7712 1.7712 Resolution (Å) 50.0-2.3
(2.38-2.30) 50.0-2.3 (2.38-2.3)
20.0-2.6 (2.68-2.6)
20.0-2.85 (2.95-2.85)
20.0-2.95 (3.06-2.95)
Rsym or Rmerge 0.058 (0.475)
0.073 (0.622)
0.081 (0.468)
0.106 (0.660)
0.088 (0.444)
I/σI 34.2 (2.3) 31 (2.7) 11.0 (2.8) 13.7 (2.2) 12.9 (2.3) Completeness (%) 99.9 (99.9) 99.4 (99.5) 97.8 (98.9) 99.2 (99.6) 98.3 (99.5) Redundancy 4.5 (4.4) 6.9 (7.0) 3.4 (3.5) 4.4 (4.5) 3.8 (4.0) Unique reflections 16,275 8,726 6,035 4,798 4,257 Refinement Resolution (Å) 46.2-2.3 45.4-2.3 19.8-2.6 20.0-2.85 19.4-2.96 Rwork/Rfree 0.22/0.25 0.22/0.25 0.22/0.26 0.22/0.26 0.23/0.27 No. atoms 1170 1,141 1,139 1,154 1,160 RNA 1122 1,113 1,109 1,122 1109 Fluoride anion 1 1 1 1 1 Cations 12 6 10 12 15 Water 35 21 19 19 35 B-factors RNA 57.3 75.1 69.0 59.6 71.8 Fluoride anion 34.3 37.5 46.2 54.0 67.4 Cations 62.1 63.8 76.2 91.7 91.7 Water 51.3 57.3 56.0 55.0 71.5 R.m.s deviations Bond lengths (Å) 0.03 0.03 0.03 0.04 0.02 Bond angles (º) 0.83 0.78 0.88 1.13 1.23 Values for the highest-resolution shell are in parentheses.
WWW.NATURE.COM/NATURE | 18
SUPPLEMENTARY INFORMATIONRESEARCHdoi:10.1038/nature11152