Synthesis of γ-Fe O, Fe O and Copper Doped Fe O ... Kannusamy Mohan… · dan aglomerasi zarah...
8
Sains Malaysiana 46(10)(2017): 1935–1942 http://dx.doi.org/10.17576/jsm-2017-4610-32 Synthesis of γ-Fe 2 O 3 , Fe 3 O 4 and Copper Doped Fe 3 O 4 Nanoparticles by Sonochemical Method (Sintesis γ-Fe 2 O 3 , Fe 3 O 4 dan Tembaga Terdop dengan Nanopartikel Fe 3 O 4 melalui Kaedah Sonokimia) KANNUSAMY MOHANRAJ* & GANESAN SIVAKUMAR ABSTRACT Nanoparticles of undoped and copper doped with Fe 3 O 4 of three concentrations (0.5, 1.0 and 1.5) are synthesized by sonochemical method. Structural, optical and morphological properties of these compounds were studied. Fe 2+ /Fe 3+ ratio is found to be 2.36. Crystalline structure, lattice parameters, surface morphologies, direct and indirect band gap energies of the synthesized compounds were estimated and the results are discussed in detail. The XDR analysis indicates the Cu doped Fe 3 O 4 nanoparticles have higher crystallinity than undoped samples. Average crystallite size is found to increase as Cu concentration increased. The FTIR results are proven by the presence of mixed magnetite-hematite nanostructures and it is complement to the XRD results. The presence of spherical, polygonal and agglomeration forms of the particles are visually seen in the SEM images. Direct and indirect band gap energy is found to be decreased as the copper concentration was increased. Keywords: Copper; Fe 2+ /Fe 3+ ratio; magnetite; sonochemical ABSTRAK Nanopartikel yang tidak terdop dan tembaga yang didop dengan tiga kepekatan Fe3O4 (0.5, 1.0 dan 1.5) disintesis oleh kaedah sonokimia. Struktur, sifat optik dan morfologi sebatian ini dikaji. Nisbah Fe 2+ /Fe 3+ yang diperoleh adalah 2.36. Struktur kristal, parameter kisi, morfologi permukaan, tenaga jurang jalur langsung dan tidak langsung daripada sebatian yang disintesis telah dianggarkan dan hasilnya dibincangkan secara terperinci. Analisis XDR menunjukkan bahawa Cu terdop dengan nanopartikel Fe3O4 mempunyai kristalografi yang lebih tinggi daripada sampel yang tidak terdop. Ukuran purata kristal didapati meningkat apabila kepekatan Cu meningkat. Keputusan FTIR dibuktikan oleh kehadiran struktur nano hematit magnetit yang bercampuran dan ia pelengkap kepada keputusan XRD. Kehadiran bentuk sfera, poligon dan aglomerasi zarah dapat dilihat secara visual dalam imej SEM. Tenaga jurang jalur langsung dan tidak langsung didapati menurun kerana peningkatan kepekatan tembaga. Kata kunci: Magnetit; nisbah Fe 2+ /Fe 3+ ; sonokimia; tembaga INTRODUCTION Nanocrystalline Fe 3 O 4 is an excellent material for fabrication of magnetic record or storage devices due to its reduce saturation magnetization (Ms) 62.5-88 emu/g than that of bulk 92.6-95.5 emu/g. Many researchers have been synthesized Fe 3 O 4 nanoparticles doped with Mn, Zn, Co, Al, Cu, Ag and Ni (Gupta et al. 2002; Hastings & Corliss 1956; Liu et al. 2006; Rao et al. 2007; Tripathy et al. 2008, 2007; Varshney et al. 2011; Wang et al. 2010). From their investigations, Ms was found to be either decreased or increased depends on nature of the metals and particle size. Also, Fe 2+ /Fe 3+ molar ratio (0.4-0.6) and iron concentration (39-78 mM) are major role in the formation of homogenous iron oxide nanoparticles under non oxidizing environment, otherwise, it may be oxidized as iron (III) hydroxide (Fe(OH) 3 ) (Laurent et al. 2008). Fe 3 O 4 nanoparticles have been prepared by sonochemical (Dang et al. 2009); solvothermal (Hou et al. 2003), sol-gel (Hasanpour et al. 2012) co-precipitation (Kim et al. 2001; Sun et al. 2006; Tang et al. 2003), ultrasound-electrochemical (Cabrera et al. 2010), refluxing (Rahman et al. 2012), ultrasound-co- precipitation (Wu et al. 2011) and water in oil in water emulsion methods (Cong et al. 2008). Mizutani et al. 2008 have synthesized Fe 3 O 4 nanoparticles under external heat in an autoclave for different Fe 2+ /Fe 3+ ratios 0.25 to 2.0. According to their report, the Fe 2+ /Fe 3+ ratio is an important factor to control the properties of Fe 3 O 4 nanoparticles and to decrease the magnetization of Fe 3 O 4 nanoparticles. The concentration of Fe 2+ in the crystal structure strongly affects the magnetization. Although the application of external heat should be controlled while preparing the Fe 3 O 4 nanoparticles. Unless, the Fe 3 O 4 particles are transformed into maghemite (200-400) and it is transformed into hematite (α-Fe 2 O 3 ), when increase the temperature in the range of 400-700°C due to strong oxidation than in room temperature. Even though the presence of water molecules on the Fe 3 O 4 is eliminated while heating, but it affects the particle size and magnetization (Darezereshki 2011; Rahman et al. 2012). Hence, the direct synthesis of iron oxide nanoparticles
Transcript of Synthesis of γ-Fe O, Fe O and Copper Doped Fe O ... Kannusamy Mohan… · dan aglomerasi zarah...
Sains Malaysiana 46(10)(2017): 1935–1942 http://dx.doi.org/10.17576/jsm-2017-4610-32
Synthesis of γ-Fe2O3, Fe3O4 and Copper Doped Fe3O4 Nanoparticles by Sonochemical Method
(Sintesis γ-Fe2O3, Fe3O4 dan Tembaga Terdop dengan Nanopartikel Fe3O4 melalui Kaedah Sonokimia)
KANNUSAMY MOHANRAJ* & GANESAN SIVAKUMAR
ABSTRACT
Nanoparticles of undoped and copper doped with Fe3O4 of three concentrations (0.5, 1.0 and 1.5) are synthesized by sonochemical method. Structural, optical and morphological properties of these compounds were studied. Fe2+/Fe3+
ratio is found to be 2.36. Crystalline structure, lattice parameters, surface morphologies, direct and indirect band gap energies of the synthesized compounds were estimated and the results are discussed in detail. The XDR analysis indicates the Cu doped Fe3O4 nanoparticles have higher crystallinity than undoped samples. Average crystallite size is found to increase as Cu concentration increased. The FTIR results are proven by the presence of mixed magnetite-hematite nanostructures and it is complement to the XRD results. The presence of spherical, polygonal and agglomeration forms of the particles are visually seen in the SEM images. Direct and indirect band gap energy is found to be decreased as the copper concentration was increased.
Keywords: Copper; Fe2+/Fe3+ ratio; magnetite; sonochemical
ABSTRAK
Nanopartikel yang tidak terdop dan tembaga yang didop dengan tiga kepekatan Fe3O4 (0.5, 1.0 dan 1.5) disintesis oleh kaedah sonokimia. Struktur, sifat optik dan morfologi sebatian ini dikaji. Nisbah Fe2+/Fe3+ yang diperoleh adalah 2.36. Struktur kristal, parameter kisi, morfologi permukaan, tenaga jurang jalur langsung dan tidak langsung daripada sebatian yang disintesis telah dianggarkan dan hasilnya dibincangkan secara terperinci. Analisis XDR menunjukkan bahawa Cu terdop dengan nanopartikel Fe3O4 mempunyai kristalografi yang lebih tinggi daripada sampel yang tidak terdop. Ukuran purata kristal didapati meningkat apabila kepekatan Cu meningkat. Keputusan FTIR dibuktikan oleh kehadiran struktur nano hematit magnetit yang bercampuran dan ia pelengkap kepada keputusan XRD. Kehadiran bentuk sfera, poligon dan aglomerasi zarah dapat dilihat secara visual dalam imej SEM. Tenaga jurang jalur langsung dan tidak langsung didapati menurun kerana peningkatan kepekatan tembaga.
Kata kunci: Magnetit; nisbah Fe2+/Fe3+; sonokimia; tembaga
INTRODUCTION
Nanocrystalline Fe3O4 is an excellent material for fabrication of magnetic record or storage devices due to its reduce saturation magnetization (Ms) 62.5-88 emu/g than that of bulk 92.6-95.5 emu/g. Many researchers have been synthesized Fe3O4 nanoparticles doped with Mn, Zn, Co, Al, Cu, Ag and Ni (Gupta et al. 2002; Hastings & Corliss 1956; Liu et al. 2006; Rao et al. 2007; Tripathy et al. 2008, 2007; Varshney et al. 2011; Wang et al. 2010). From their investigations, Ms was found to be either decreased or increased depends on nature of the metals and particle size. Also, Fe2+/Fe3+ molar ratio (0.4-0.6) and iron concentration (39-78 mM) are major role in the formation of homogenous iron oxide nanoparticles under non oxidizing environment, otherwise, it may be oxidized as iron (III) hydroxide (Fe(OH)3) (Laurent et al. 2008). Fe3O4 nanoparticles have been prepared by sonochemical (Dang et al. 2009); solvothermal (Hou et al. 2003), sol-gel (Hasanpour et al. 2012) co-precipitation (Kim et al. 2001; Sun et al. 2006; Tang et al. 2003), ultrasound-electrochemical (Cabrera et
al. 2010), refluxing (Rahman et al. 2012), ultrasound-co-precipitation (Wu et al. 2011) and water in oil in water emulsion methods (Cong et al. 2008). Mizutani et al. 2008 have synthesized Fe3O4 nanoparticles under external heat in an autoclave for different Fe2+/Fe3+ ratios 0.25 to 2.0. According to their report, the Fe2+/Fe3+ ratio is an important factor to control the properties of Fe3O4 nanoparticles and to decrease the magnetization of Fe3O4 nanoparticles. The concentration of Fe2+ in the crystal structure strongly affects the magnetization. Although the application of external heat should be controlled while preparing the Fe3O4 nanoparticles. Unless, the Fe3O4 particles are transformed into maghemite (200-400) and it is transformed into hematite (α-Fe2O3), when increase the temperature in the range of 400-700°C due to strong oxidation than in room temperature. Even though the presence of water molecules on the Fe3O4 is eliminated while heating, but it affects the particle size and magnetization (Darezereshki 2011; Rahman et al. 2012). Hence, the direct synthesis of iron oxide nanoparticles
1936
without heat must be motivated. Tang et al. (2003) have shown a small oxidation of Fe3O4 at 0°C under illumination of argon laser. It can also be controlled the oxidation of Fe3O4 by flow of N2 gas instead of argon gas. According to our literature review, a single report is found for direct preparation of γ-Fe2O3 particles without any organic substance by wet chemical method (Darezereshki et al. 2010), And there is no report found for preparation of γ-Fe2O3, Fe3O4 and Cu doped Fe3O4 nanoparticles by ultrasonic irradiation. Since, the method promoting Ms due to the cleaning the surface of nanoparticles and eliminating dead oxide layer, reduce particle size as well as induces the reactions of intermediates by cavitation (Cabrera et al. 2010). Hence, an attempt is made to synthesis of γ-Fe2O3, undoped and copper doped Fe3O4 nanoparticles by ultrasonic method at high concentration of Fe2+.
MATERIALS AND METHODS
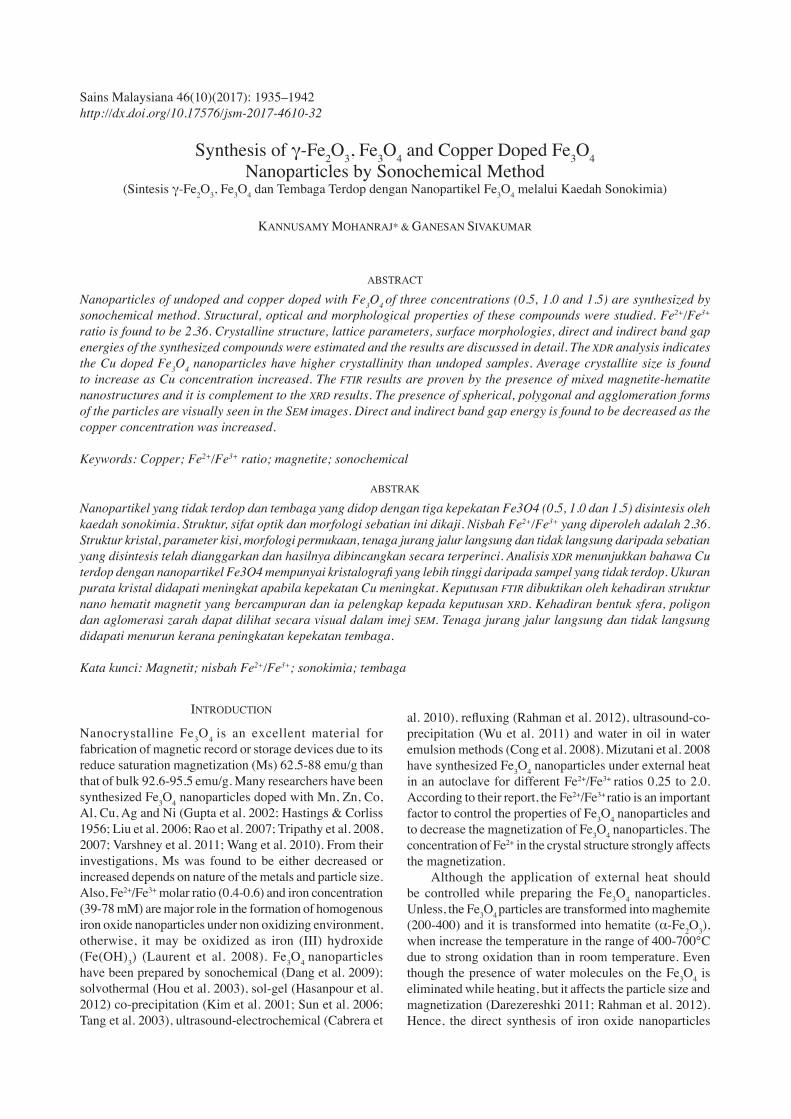
Aqueous solution (25 mL) consist of 1.01 g of FeCl3 (anhydrous, 96%) and 4.08 g of FeSO4.7H2O (99%) and its Fe2+/Fe3+ ratio is found to be 2.36. The mixture solution was vigorously stirred at room temperature for 1 h. The initial pH value was 2 and it was increased by adding NaOH into the solution. Subsequently, brown and black color precipitates was obtained for pH 9 and 12, respectively. Next, the precipitates were placed in ultrasonic bath (50 W, 40±3 kHz, ENERTECH) and ultrasonicated for 30 min and then it was filtered by proper filterant. Consequently, centrifuged and rinsed for three times using distilled water and ethanol. Finally, the obtained precipitates were dried at 120°C for 1 h. Similar steps were involved to synthesis Cu doped Fe3O4 for all three concentrations (0.5, 1.0 and 1.5) using CuSO4.5H2O (99%) as precursors. The synthesis procedure is illustrated in Figure 1.
The structural characteristics of as-prepared and Cu doped nanoparticles were carried out by analyzing the X-ray diffraction (XRD) patterns using Cu Kα radiation in the range of 2θ = 10̊ - 80̊ in an X’ Pert PRO diffractometer (PANalytical, Netherlands). FTIR spectra of the samples were recorded using Perkin Elmer (Spectrum Two), Fourier Transform Infrared Spectrometer (FTIR) in range of 4000 - 450 cm-1 with resolution of 4 cm-1. A JEOL-Scanning Electron Microscopy (SEM) (JSM - 5610 LV) was used to record the micrograph for the samples. Optical absorption studies were carried out using a UV-visible spectroscopy (UV2202) in the wavelength range 300 - 800 nm.
RESULTS AND DISCUSSION
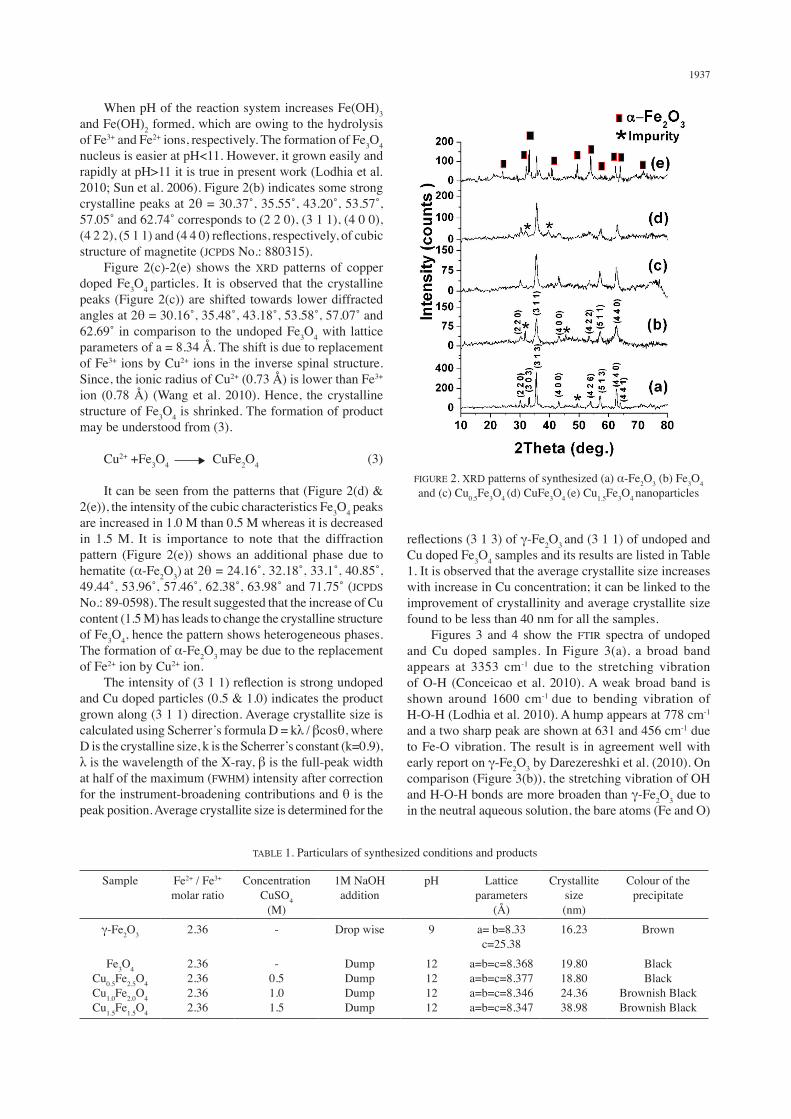
XRD patterns of undoped γ-Fe2O3 and Fe3O4 particles are shown in Figure 2(a) & 2(b) indicates crystalline (Figure 2(a)) shows peaks at 2θ= 30.27̊, 33.37̊, 35.53̊, 43.30̊, 53.83̊, 57.34̊, 62.78̊ and 64.10̊ corresponds to (2 2 0), (3 0 3), (3 1 3), (4 0 0), (4 2 6), (5 1 3), (4 4 0) and (4 4 1) reflections, respectively, of tetragonal maghemite (JCPDS: 895894) which is formed at pH 9. In typical mechanism, the precursors yield considerable amount of Fe2+ and Fe3+ ions when they mixed with water. However, no precipitate is formed when the pH was 2. Hence, NaOH was added drop by drop into the solution to increase the pH from 2 to 9. Subsequently, brown color precipitate was formed and it was turned into brownish black at pH 12, due to the following chemical reactions (1, 2),
Fe2+ + 2Fe3+ + 8OH- � Fe3O4 + 4H2O (1)
Fe3O4 + 2H+ � γ-Fe2O3 + Fe2+ + H2O (2)
FIGURE 1. Illustration of γ-Fe2O3, Fe3O4 and Cu doped Fe3O4 nanoparticles
1937
When pH of the reaction system increases Fe(OH)3 and Fe(OH)2 formed, which are owing to the hydrolysis of Fe3+ and Fe2+ ions, respectively. The formation of Fe3O4 nucleus is easier at pH<11. However, it grown easily and rapidly at pH>11 it is true in present work (Lodhia et al. 2010; Sun et al. 2006). Figure 2(b) indicates some strong crystalline peaks at 2θ = 30.37̊, 35.55̊, 43.20̊, 53.57̊, 57.05̊ and 62.74̊ corresponds to (2 2 0), (3 1 1), (4 0 0), (4 2 2), (5 1 1) and (4 4 0) reflections, respectively, of cubic structure of magnetite (JCPDS No.: 880315). Figure 2(c)-2(e) shows the XRD patterns of copper doped Fe3O4 particles. It is observed that the crystalline peaks (Figure 2(c)) are shifted towards lower diffracted angles at 2θ = 30.16̊, 35.48̊, 43.18̊, 53.58̊, 57.07̊ and 62.69̊ in comparison to the undoped Fe3O4 with lattice parameters of a = 8.34 Å. The shift is due to replacement of Fe3+ ions by Cu2+ ions in the inverse spinal structure. Since, the ionic radius of Cu2+ (0.73 Å) is lower than Fe3+ ion (0.78 Å) (Wang et al. 2010). Hence, the crystalline structure of Fe3O4 is shrinked. The formation of product may be understood from (3).
Cu2+ +Fe3O4 � CuFe2O4 (3)
It can be seen from the patterns that (Figure 2(d) & 2(e)), the intensity of the cubic characteristics Fe3O4 peaks are increased in 1.0 M than 0.5 M whereas it is decreased in 1.5 M. It is importance to note that the diffraction pattern (Figure 2(e)) shows an additional phase due to hematite (α-Fe2O3) at 2θ = 24.16̊, 32.18̊, 33.1̊, 40.85̊, 49.44̊, 53.96̊, 57.46̊, 62.38̊, 63.98̊ and 71.75̊ (JCPDS No.: 89-0598). The result suggested that the increase of Cu content (1.5 M) has leads to change the crystalline structure of Fe3O4, hence the pattern shows heterogeneous phases. The formation of α-Fe2O3 may be due to the replacement of Fe2+ ion by Cu2+ ion. The intensity of (3 1 1) reflection is strong undoped and Cu doped particles (0.5 & 1.0) indicates the product grown along (3 1 1) direction. Average crystallite size is calculated using Scherrer’s formula D = kλ / βcosθ, where D is the crystalline size, k is the Scherrer’s constant (k=0.9), λ is the wavelength of the X-ray, β is the full-peak width at half of the maximum (FWHM) intensity after correction for the instrument-broadening contributions and θ is the peak position. Average crystallite size is determined for the
TABLE 1. Particulars of synthesized conditions and products
Sample Fe2+ / Fe3+
molar ratioConcentration
CuSO4 (M)
1M NaOH addition
pH Lattice parameters
(Å)
Crystallite size (nm)
Colour of the precipitate
γ-Fe2O3 2.36 - Drop wise 9 a= b=8.33c=25.38
16.23 Brown
Fe3O4Cu0.5Fe2.5O4Cu1.0Fe2.0O4Cu1.5Fe1.5O4
2.362.362.362.36
-0.51.01.5
DumpDumpDumpDump
12121212
a=b=c=8.368a=b=c=8.377a=b=c=8.346a=b=c=8.347
19.8018.8024.3638.98
BlackBlack
Brownish BlackBrownish Black
FIGURE 2. XRD patterns of synthesized (a) α-Fe2O3 (b) Fe3O4 and (c) Cu0.5Fe3O4 (d) CuFe3O4 (e) Cu1.5Fe3O4 nanoparticles
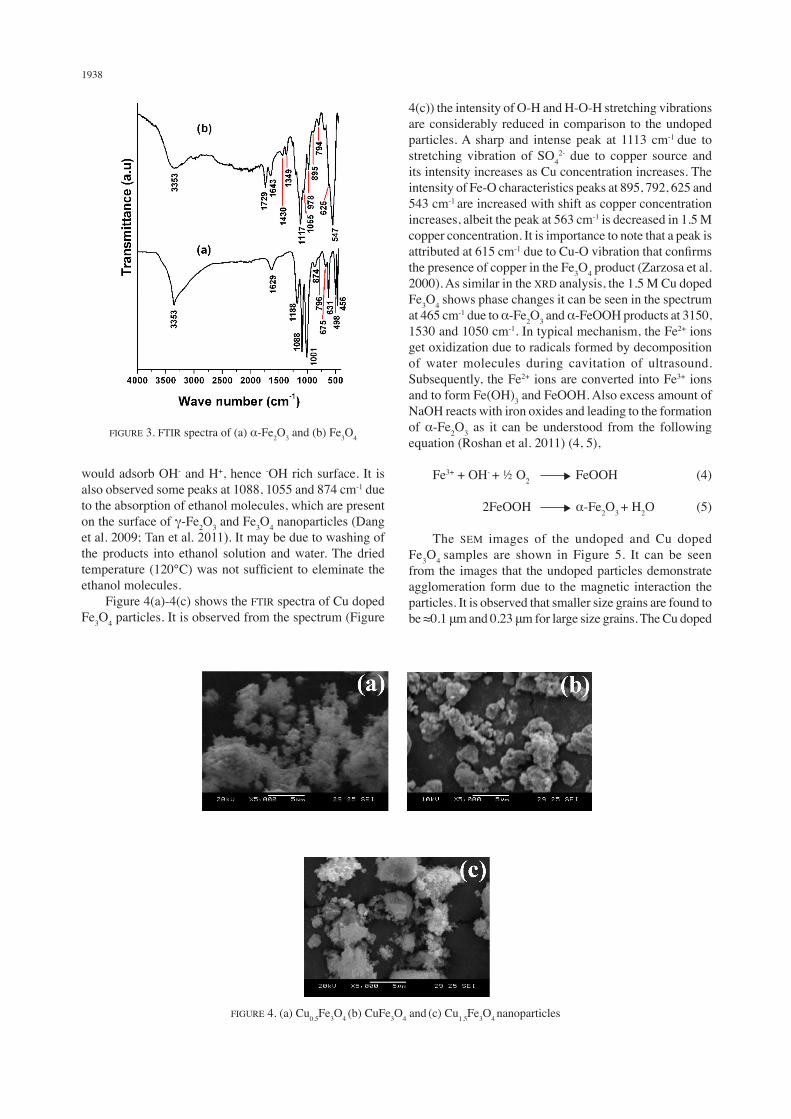
reflections (3 1 3) of γ-Fe2O3 and (3 1 1) of undoped and Cu doped Fe3O4 samples and its results are listed in Table 1. It is observed that the average crystallite size increases with increase in Cu concentration; it can be linked to the improvement of crystallinity and average crystallite size found to be less than 40 nm for all the samples. Figures 3 and 4 show the FTIR spectra of undoped and Cu doped samples. In Figure 3(a), a broad band appears at 3353 cm-1 due to the stretching vibration of O-H (Conceicao et al. 2010). A weak broad band is shown around 1600 cm-1 due to bending vibration of H-O-H (Lodhia et al. 2010). A hump appears at 778 cm-1 and a two sharp peak are shown at 631 and 456 cm-1 due to Fe-O vibration. The result is in agreement well with early report on γ-Fe2O3 by Darezereshki et al. (2010). On comparison (Figure 3(b)), the stretching vibration of OH and H-O-H bonds are more broaden than γ-Fe2O3 due to in the neutral aqueous solution, the bare atoms (Fe and O)
1938
would adsorb OH- and H+, hence -OH rich surface. It is also observed some peaks at 1088, 1055 and 874 cm-1 due to the absorption of ethanol molecules, which are present on the surface of γ-Fe2O3 and Fe3O4 nanoparticles (Dang et al. 2009; Tan et al. 2011). It may be due to washing of the products into ethanol solution and water. The dried temperature (120°C) was not sufficient to eleminate the ethanol molecules. Figure 4(a)-4(c) shows the FTIR spectra of Cu doped Fe3O4 particles. It is observed from the spectrum (Figure
4(c)) the intensity of O-H and H-O-H stretching vibrations are considerably reduced in comparison to the undoped particles. A sharp and intense peak at 1113 cm-1 due to stretching vibration of SO4
2- due to copper source and its intensity increases as Cu concentration increases. The intensity of Fe-O characteristics peaks at 895, 792, 625 and 543 cm-1 are increased with shift as copper concentration increases, albeit the peak at 563 cm-1 is decreased in 1.5 M copper concentration. It is importance to note that a peak is attributed at 615 cm-1 due to Cu-O vibration that confirms the presence of copper in the Fe3O4 product (Zarzosa et al. 2000). As similar in the XRD analysis, the 1.5 M Cu doped Fe3O4 shows phase changes it can be seen in the spectrum at 465 cm-1 due to α-Fe2O3 and α-FeOOH products at 3150, 1530 and 1050 cm-1. In typical mechanism, the Fe2+ ions get oxidization due to radicals formed by decomposition of water molecules during cavitation of ultrasound. Subsequently, the Fe2+ ions are converted into Fe3+ ions and to form Fe(OH)3 and FeOOH. Also excess amount of NaOH reacts with iron oxides and leading to the formation of α-Fe2O3 as it can be understood from the following equation (Roshan et al. 2011) (4, 5),
Fe3+ + OH- + ½ O2 � FeOOH (4)
2FeOOH � α-Fe2O3 + H2O (5)
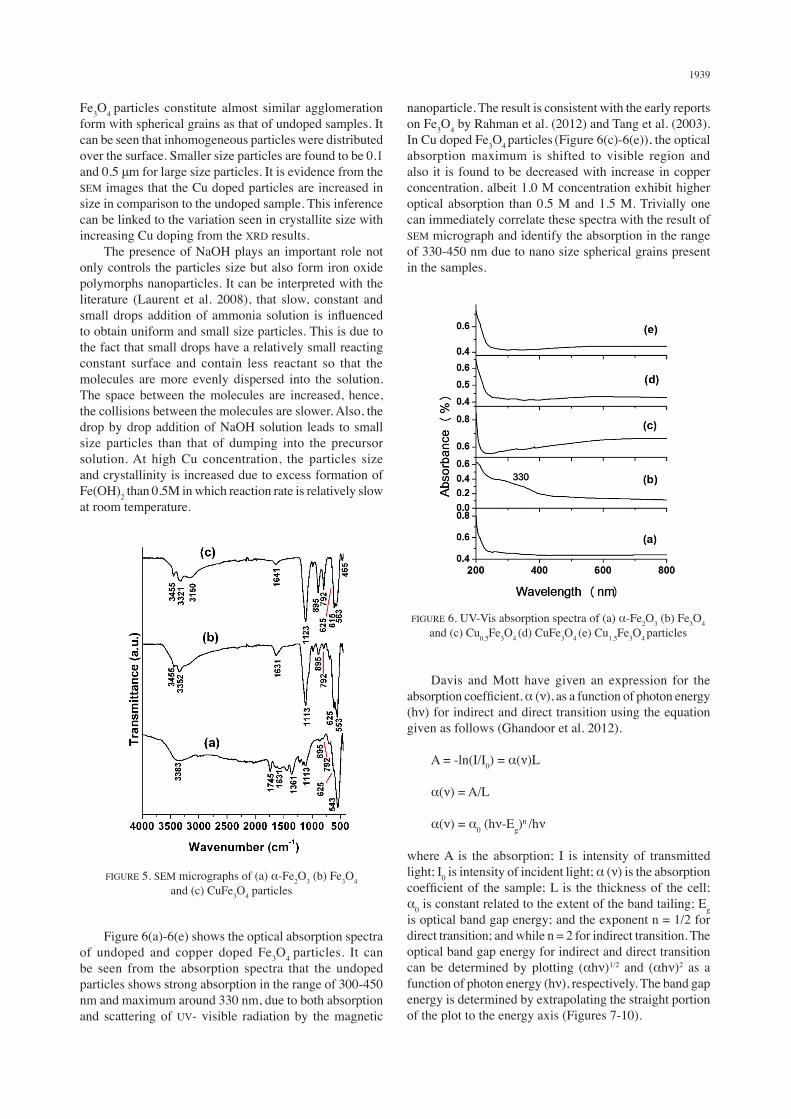
The SEM images of the undoped and Cu doped Fe3O4 samples are shown in Figure 5. It can be seen from the images that the undoped particles demonstrate agglomeration form due to the magnetic interaction the particles. It is observed that smaller size grains are found to be ≈0.1 μm and 0.23 μm for large size grains. The Cu doped
FIGURE 3. FTIR spectra of (a) α-Fe2O3 and (b) Fe3O4
FIGURE 4. (a) Cu0.5Fe3O4 (b) CuFe3O4 and (c) Cu1.5Fe3O4 nanoparticles
1939
Fe3O4 particles constitute almost similar agglomeration form with spherical grains as that of undoped samples. It can be seen that inhomogeneous particles were distributed over the surface. Smaller size particles are found to be 0.1 and 0.5 μm for large size particles. It is evidence from the SEM images that the Cu doped particles are increased in size in comparison to the undoped sample. This inference can be linked to the variation seen in crystallite size with increasing Cu doping from the XRD results. The presence of NaOH plays an important role not only controls the particles size but also form iron oxide polymorphs nanoparticles. It can be interpreted with the literature (Laurent et al. 2008), that slow, constant and small drops addition of ammonia solution is influenced to obtain uniform and small size particles. This is due to the fact that small drops have a relatively small reacting constant surface and contain less reactant so that the molecules are more evenly dispersed into the solution. The space between the molecules are increased, hence, the collisions between the molecules are slower. Also, the drop by drop addition of NaOH solution leads to small size particles than that of dumping into the precursor solution. At high Cu concentration, the particles size and crystallinity is increased due to excess formation of Fe(OH)2 than 0.5M in which reaction rate is relatively slow at room temperature.
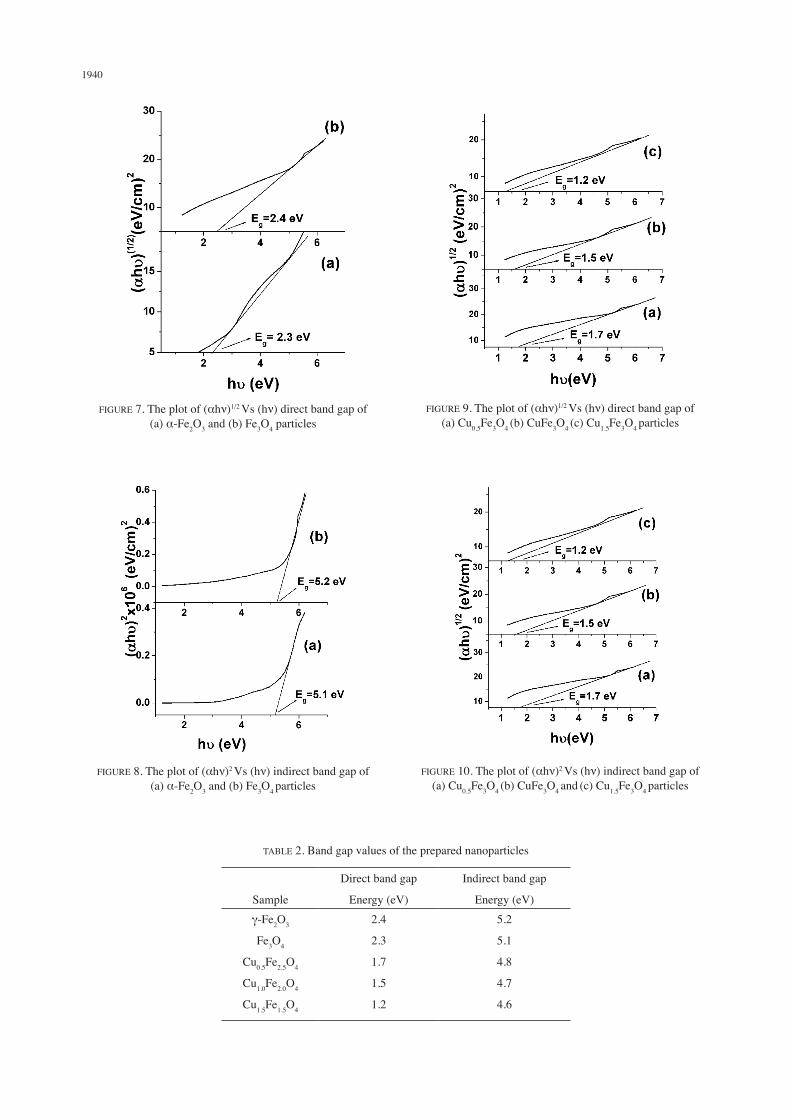
nanoparticle. The result is consistent with the early reports on Fe3O4 by Rahman et al. (2012) and Tang et al. (2003). In Cu doped Fe3O4 particles (Figure 6(c)-6(e)), the optical absorption maximum is shifted to visible region and also it is found to be decreased with increase in copper concentration, albeit 1.0 M concentration exhibit higher optical absorption than 0.5 M and 1.5 M. Trivially one can immediately correlate these spectra with the result of SEM micrograph and identify the absorption in the range of 330-450 nm due to nano size spherical grains present in the samples.
FIGURE 5. SEM micrographs of (a) α-Fe2O3 (b) Fe3O4 and (c) CuFe3O4 particles
FIGURE 6. UV-Vis absorption spectra of (a) α-Fe2O3 (b) Fe3O4 and (c) Cu0.5Fe3O4 (d) CuFe3O4 (e) Cu1.5Fe3O4 particles
Figure 6(a)-6(e) shows the optical absorption spectra of undoped and copper doped Fe3O4 particles. It can be seen from the absorption spectra that the undoped particles shows strong absorption in the range of 300-450 nm and maximum around 330 nm, due to both absorption and scattering of UV- visible radiation by the magnetic
Davis and Mott have given an expression for the absorption coefficient, α (ν), as a function of photon energy (hν) for indirect and direct transition using the equation given as follows (Ghandoor et al. 2012).
A = -ln(I/I0) = α(ν)L
α(ν) = A/L
α(ν) = α0 (hν-Eg)n /hν
where A is the absorption; I is intensity of transmitted light; I0 is intensity of incident light; α (ν) is the absorption coefficient of the sample; L is the thickness of the cell; α0 is constant related to the extent of the band tailing; Eg is optical band gap energy; and the exponent n = 1/2 for direct transition; and while n = 2 for indirect transition. The optical band gap energy for indirect and direct transition can be determined by plotting (αhν)1/2 and (αhν)2 as a function of photon energy (hν), respectively. The band gap energy is determined by extrapolating the straight portion of the plot to the energy axis (Figures 7-10).
1940
TABLE 2. Band gap values of the prepared nanoparticles
Sample
Direct band gap
Energy (eV)
Indirect band gap
Energy (eV)γ-Fe2O3
Fe3O4
Cu0.5Fe2.5O4
Cu1.0Fe2.0O4
Cu1.5Fe1.5O4
2.4
2.3
1.7
1.5
1.2
5.2
5.1
4.8
4.7
4.6
FIGURE 7. The plot of (αhν)1/2 Vs (hν) direct band gap of (a) α-Fe2O3 and (b) Fe3O4 particles
FIGURE 8. The plot of (αhν)2 Vs (hν) indirect band gap of (a) α-Fe2O3 and (b) Fe3O4 particles
FIGURE 9. The plot of (αhν)1/2 Vs (hν) direct band gap of (a) Cu0.5Fe3O4 (b) CuFe3O4 (c) Cu1.5Fe3O4 particles
FIGURE 10. The plot of (αhν)2 Vs (hν) indirect band gap of (a) Cu0.5Fe3O4 (b) CuFe3O4 and (c) Cu1.5Fe3O4 particles
1941
From Table 2, the band gap energy is found to be 2.4 eV for γ-Fe2O3 and 2.3 eV for Fe3O4 which is higher than bulk γ-Fe2O3 (2.2 eV) and Fe3O4 (0.1 eV) (Cornell & Schwertmann 2003). Albeit, it is found to be decreased considerably from 1.7 to 1.2 eV in the Cu doped samples. It can be correlated with the obtained crystallite size in the XRD analysis and grain size in SEM analysis. The result is evidenced that the Cu dopant plays an important role to tune the band gap energy of the Fe3O4 particles. It is learnt from the early report that the mixed magnetite-hematite nanoparticles have strong adsorption of heavy metals such as lead, chromium and cadmium from the waste waters and also it have very low Ms (11 emu/g). Note that, the present work (1.5 M Cu concentration) also exhibit mixed magnetite-hematite nanostructures and low band gap energy. Therefore, the particles may have lesser Ms due to diamagnetic property of Cu. Hence, further investigation is needed to elucidate the magnetization properties of the characteristics nanoparticles; it can be used to find the sorbent efficiency. From the experimental results, the 1.5 M Cu concentration is suitable ratio to obtain mixed phase of Fe3O4 nanoparticles. It is also interesting to note that at low Cu concentration (0.5 and 1.0 M) Fe3+ ions are replaced by Cu2+ ions whereas at higher concentration (1.5 M) Fe2+ ions are replaced by Cu2+ ions, to form α–Fe2O3.
CONCLUSION
The maghemite (γ-Fe2O3), magnetite (Fe3O4) and copper doped Fe3O4 nanoparticles are synthesized by sonochemical method the Fe2+/Fe3+ ratio was found 2.36. The XDR analysis indicates the Cu doped Fe3O4 nanoparticles have higher crystallinity than undoped samples. The higher Cu concentration (1.5 M) shows mixed magnetite-hematite nanostructures that are very useful for removal of heavy metals from the waste water. Average crystallite size is found to be increased as Cu concentration increases. The lattice parameters a, b and c are stretched or compressed. The FTIR results are proved by the presence of mixed magnetite-hematite nanostructures and it is complement to the XRD results. The presence of spherical, polygonal and agglomeration forms of the particles are visually seen in the SEM images and the observed average grain size is comparable to the crystallite size found in XRD analysis. Direct and indirect band gap energy is found to be decreased as increase the copper concentration and inversely proportional to its crystallite size.
ACKNOWLEDGEMENTS
The authors are thankful to the DST-FIST and UGC-SAP, New Delhi for providing the financial support to the Department of Physics, Manonmaniam Sundaranar University and the Prof. and Head, Department of Physics, Annamalai University for their supporting to record the SEM photographs.
REFERENCES
Cabrera, L., Gutiérrez, S., Herrasti, P. & Reyman, D. 2010. Sonoelectrochemical synthesis of magnetite. Physics Procedia 3: 89-94.
Conceicao, T.F.D., Scharnag, l.N., Blawert, C., Dietzel, W. & Kainer, K.U. 2010. Surface modification of magnesium alloy AZ31 by hydrofluoric acid treatment and its effect on the corrosion behavior. Thin Solid Films 518: 5209-5218.
Cong, Y., Wang, G., Xiong, M., Huang, Y., Hong, Z., Wang, D., Li, D. & Li, L. 2008. A facile interfacial reaction route to prepare magnetic hollow spheres with tunable shell thickness. Langmuir 24: 6624-6629.
Cornell, R.M. & Schwertmann, U. 2003. The Iron Oxide: Structure, Properties, Reaction, Occurrences and Uses. 2nd
ed. (Chapter 6). Federal Republic of Germany: Wiley-VCH Verlag GmbH.
Dang, F., Enomoto, N., Hojo, J. & Enpuku, K. 2009. Sonochemical synthesis of monodispersed magnetite nanoparticles by using an ethanol-water mixed solvent. Ultrasonics Sonochemistry 16: 649-654.
Darezereshki, E. 2011. One-step synthesis of hematite (α-Fe2O3) nanoparticles by direct thermal- decomposition of maghemite. Materials Letter 65: 642-645.
Darezereshki, E., Ranjibar, M. & Bakhitiari, F. 2010. One-step synthesis of maghemite (γ-Fe2O3) nanoparticles by wet chemical method. Journals of Alloy Compounds 502: 257-260.
Ghandoor, H.E., Zidan, H.M., Khalil, M.M.H. & Ismail, M.I.M. 2012. Synthesis and some physical properties of magnetite nanoparticles. International Journal of Electrochemical Science 7: 5734-5745.
Gupta, R., Sood, A.K., Metcalf, P. & Honig, J.M. 2002. Raman study of stoichiometric and Zn-doped Fe3O4. Physics Review B 65: 104430-104438.
Hasanpour, A., Niyaifar, M. & Asan, M. 2012. Synthesis and characterization of Fe3O4 & ZnO nanocomposites by sol-gel method. Proceedings of the 4th International Conferences on Nanostructures (ICNS4), 12-14 March. pp. 205-207.
Hastings, J.M. & Corliss, L.M. 1956. Neutron diffraction study of manganese ferrite. Physics Review 104: 329-331.
Hou, Y., Yu, J. & Gao, S. 2003. Solvothermal reduction synthesis and characterization of superparamagnetic magnetite nanoparticles. Journal of Material Chemistry 13: 1983-1987.
Laurent, S., Forge, D., Port, M., Roch, A., Robic, C., Elst, L.V. & Mullerm, R.N. 2008. Magnetic iron oxide nanoparticles: Synthesis, stabilization, vectorization, physicochemical characterizations and biological applications. Chemistry Review 108: 2064-2110.
Liu, S.H., Tai, H.M., Pao, C.W., Chiou, J.W., Ling, D.C., Pong, W.F., Tasi, M-H., Lin, H.J., Jang, L.Y., Lee, J.F., Hsu, J.H., Wang, W.J. & Hsu, C.J. 2006. Electronic and magnetic properties of the Ag-doped Fe3O4 films studied by X-ray absorption spectroscopy. Applied Physics Letter 89: 092112.
Lodhia, J., Mandarano, G., Ferris, N.J., Eu, P. & Cowell, SF. 2010. Development and use of iron oxide nanoparticles (Part1): Synthesis of iron oxide nanoparticles for MRI. Biomedical Imaging and Intervention Journal 6: e12.
Roshan, A.H., Vaezi, M.R., Shokuhfur, A. & Rajabali, Z. 2011. Synthesis of iron oxide nanoparticles via sonochemical method and their characterization. Particuology 9: 95-99.
Sun, J., Zhou, S., Hou, P., Yang, Y., Weng, J., Li, X. & Li, M. 2006. Synthesis and characterization of biocompatible Fe3O4
1942
nanoparticles. Journal of Biomedical Materials Research Part A 80(2): 333-341.
Tan, J., Yang, L., Kang, Q. & Cai, Q. 2011. In situ ATR-FTIR and UV-visible spectroscopy study of photocatalytic oxidation of ethanol over TiO2 nanotubes. Analytical Letters 44: 1114-1125.
Tang, J., Myers, M., Bosnick, K.A. & Brus, L.E. 2003. Magnetic Fe3O4 nanocrystals: Spectroscopic observation of aqueous oxidation kinetics. Journal of Physical Chemistry B 107: 7501-7506.
Tripathy, D., Adeyeye, A.O., Boothroyd, C.B. & Shannigrahi, S. 2008. Microstructure and magneto transport properties of Cu doped Fe3O4 films. Journal of Applied Physics 103: 07F701-07F703.
Tripathy, D., Adeyeye, A.O., Boothroyd, C.B. & Piramanmayagam, S.N. 2007. Magnetic and transport properties of Co-doped Fe3O4 films. Journal of Applied Physics 101: 013904.
Varshney, D., Verma, K. & Yogi, A. 2011. Structural and magnetic properties of Mn and Zn doped Fe3O4 nanoparticles. AIP Conference Proceedings 1349: 253-254.
Wang, X., Hu, C.G., Xi, Y., Xia, C.H. & He, X.S. 2010. Al-doped Fe3O4 nanoparticles and their magnetic properties. Journal of Superconductivity and Novel Magnetism 23: 909-911.
Wu, S., Sun, A., Zhai, F., Wang, J., Xu, W., Zhang, Q. & Volinsky, A.A. 2011. Fe3O4 magnetic nanoparticles synthesis from tailings by ultrasonic chemical co-precipitation. Materials Letters 65: 1882-1884.
Zarzosa, G.O., Martinez, J.R., Espinos, O.D., Ruiz, F. & Aquino, J.A.M. 2000. Formation of copper based particles trapped in a silica xerogel matrix. Superficies y vacio 11: 61-65.
Kannusamy Mohanraj*Department of Physics Manonmaniam Sundaranar University Tirunelveli-627 012, Tamilnadu India
Ganesan SivakumarCISL, Department of PhysicsAnnamalai University Annamalai Nagar-608 002, Tamilnadu India
*Corresponding author; email: [email protected]
Received: 10 February 2014Accepted: 1 March 2017


![[14] Ligas ferrosas 2.ppt [Modo de Compatibilidade]foundrygate.com/upload/artigos/Estrutura das Ligas Ferrosas.pdf · Ligas Ferrosas 2 ¾O carbono nos ferros fundidos Fe 3C 3 Fe +](https://static.fdocument.org/doc/165x107/5fe109e715d485644939a550/14-ligas-ferrosas-2ppt-modo-de-compatibilidade-das-ligas-ferrosaspdf-ligas.jpg)