Surface Tension Prediction for Liquid Mixtures Tension Prediction for Liquid Mixtures ... ρl is the...
24
AIChE Journal, Vol. 44, No. 10, pp. 2324-2332, 1998 1 Surface Tension Prediction for Liquid Mixtures Joel Escobedo and G. Ali Mansoori (*) Department of Chemical Engineering University of Illinois at Chicago 810 S. Clinton Street, Chicago, IL 60607-7000, USA key words: Surface tension, organic fluids, mixtures, prediction, new mixing rules Abstract Recently Escobedo and Mansoori (AIChE J. 42(5): 1425, 1996) proposed a new expression, originally derived from statistical mechanics, for the surface tension prediction of pure fluids. In this report, the same theory is extended to the case of mixtures of organic liquids with the following expression, σ m = [(1-T r,m ) 0.37 T r,m exp (0.30066/T r,m + 0.86442 T r,m 9 ) (P L 0,m ρ L,m - P V 0,m ρ v,m )] 4 P 0,m = { Σ i Σ j [x i x j (P c ij / T c ij ) 7/3 P 4 0,ij ]} 1/4 [ Σ i Σ j (x i x j T c ij / P c ij )] 7/12 P 0,ij =(1-m ij )(P 0,i P 0,j ) 1/2 where σ m is the surface tension of the mixture. T r,m =T/T c,m and T c,m is the pseudo-critical temperature of the liquid mixture. ρ L,m and ρ v,m are the equilibrium densities of liquid and vapor, respectively. P L 0,m and P V 0,m are the temperature-independent compound-dependent parameters for the liquid and vapor, respectively. P c,i , T c,i and x i are the critical pressure, critical temperature and the mole fraction for component i, respectively. P 0,i is the temperature- independent parameter for component i and m ij is the unlike interaction parameter. Using the proposed equation surface tensions of 55 binary mixtures are predicted within an overall 0.50 AAD% which is better than the other available prediction methods. When the P 0,i ’s are made compound-insensitive using a corresponding states expression the surface tension of all the 55 binary mixtures are predicted within an overall 2.10 AAD%. The proposed model is also applicable to multicomponent liquid mixtures. ______________________________________________________________________________ (*) To whom correspondence concerning this article should be addressed.
Transcript of Surface Tension Prediction for Liquid Mixtures Tension Prediction for Liquid Mixtures ... ρl is the...
AIChE Journal, Vol. 44, No. 10, pp. 2324-2332, 1998
1
Surface Tension Prediction for Liquid MixturesJoel Escobedo and G. Ali Mansoori(*)
Department of Chemical EngineeringUniversity of Illinois at Chicago
810 S. Clinton Street, Chicago, IL 60607-7000, USA
key words: Surface tension, organic fluids, mixtures, prediction, new mixing rules
Abstract
Recently Escobedo and Mansoori (AIChE J. 42(5): 1425, 1996) proposed a new expression,originally derived from statistical mechanics, for the surface tension prediction of pure fluids. Inthis report, the same theory is extended to the case of mixtures of organic liquids with thefollowing expression,
σm = [(1-Tr,m)0.37 Tr,m exp (0.30066/Tr,m + 0.86442 Tr,m9) (P L
0,m ρL,m
- P V0,m ρ
v,m)]4
P0,m = { ΣiΣj [xixj (Pcij / Tcij)
7/3 P 40,ij]} 1/4 [ΣiΣj
(xixj Tcij / Pcij)]7/12
P0,ij=(1-mij)(P0,iP0,j)1/2
where σm is the surface tension of the mixture. Tr,m=T/Tc,m and Tc,m is the pseudo-criticaltemperature of the liquid mixture. ρ
L,m and ρ
v,m are the equilibrium densities of liquid and
vapor, respectively. PL0,m and PV
0,m are the temperature-independent compound-dependentparameters for the liquid and vapor, respectively. Pc,i , Tc,i and xi are the critical pressure, criticaltemperature and the mole fraction for component i, respectively. P0,i is the temperature-independent parameter for component i and mij is the unlike interaction parameter.
Using the proposed equation surface tensions of 55 binary mixtures are predicted within anoverall 0.50 AAD% which is better than the other available prediction methods. When the P0,i’s
are made compound-insensitive using a corresponding states expression the surface tension of allthe 55 binary mixtures are predicted within an overall 2.10 AAD%. The proposed model is alsoapplicable to multicomponent liquid mixtures.______________________________________________________________________________
(*) To whom correspondence concerning this article should be addressed.
AIChE Journal, Vol. 44, No. 10, pp. 2324-2332, 1998
2
IntroductionThe surface tension of a liquid mixture is not a simple function of the surface tensions of the
pure liquids. Also, the composition of the bulk phase and the composition at the vapor-liquidinterface are not always the same. At the interface, there is migration of the species having thelowest surface tension, or free energy per unit area, at the temperature of the system. Thismigration at the interface results in a liquid-phase rich in the component with the highest surfacetension and a vapor phase rich in the component with the lowest surface tension (Teixeira et al.,1992, Croxton, 1986, Carey et al, 1980;Winterfield et al., 1978; Massoudi and King, 1975,Wertheim,1976). According to Chapela et al., (1977) the more volatile component is adsorbedfrom the mixture and extends about one atomic diameter into the gas phase beyond the otherspecies.
In most instances the bulk composition is known. However, the composition at the vapor-liquid interface is unknown. Therefore, there is a need for relating the surface tension ofmixtures to bulk-phase concentrations and properties (i.e. densities).
In general, there have been several approaches for estimating the surface tension of mixtures(i) based on empirical or semi-empirical thermodynamic relations suggested first for pure fluidsand (ii)based on statistical mechanical grounds.
In a recent publication Escobedo and Mansoori (1996) presented a set of new expressionsfor predicting the surface tension of pure fluids. These new expressions were developed fromthe statistical mechanical basis of the Macleod equation. It was shown that their new expressionsrepresent rather accurately the surface tension of a variety of pure fluids over a wide range oftemperatures. In this paper, the expressions proposed originally by Escobedo and Mansoori(1996) are extended to the case of mixtures.
TheoryFor the surface tension of pure organic fluids, σ, Escobedo and Mansoori (1996), proposed,
σ = [P (ρl - ρv)]4 (1)
P = P0 (1-Tr)0.37 Tr
Exp(0.30066/Tr + 0.86442 Tr9) (2)
where P is known as parachor, ρl is the liquid density, ρv is the vapor density, Tr is the reducedtemperature and P0 is a constant which is a function of the characteristics of the molecule underconsideration. This new expression, derived from statistical mechanics, represents theexperimental surface tension of 94 different organic compounds within 1.05 AAD%. Inaddition,
P0 = 39.6431 [0.22217 - 2.91042× 10⁻³ (R*/Tbr2)] Tc
13/12/Pc5/6 (3)
AIChE Journal, Vol. 44, No. 10, pp. 2324-2332, 1998
3
was proposed as a corresponding-states expression for the temperature-independent, compound-dependent parameter P0. In this equation, R * = Rm/Rm,ref; Rm is the molar refraction given byRm = (4πNA/3)[α +µ 2f(T)] = (1/ρ)(n2-1)/(n2+2); α and µ are the polarizability and the dipolemoment of the molecule; NA is the Avogadro’s number, n is the sodium-D light refractive indexof a liquid at 20¡ C; Rm,ref=6.987 is the molar refraction of the reference fluid (methane). Whenthis generalized expression is used, surface tensions for all the 94 pure compounds can bepredicted within an overall 2.57 AAD% at all temperatures investigated.
Exact statistical mechanical extension of equations 1-3 to mixtures results in quite complexexpressions. However, using the principles of the conformal solution theory (Massih andMansoori, 1983) the following generalization of Eq. 2 for the case of mixtures will be concluded,
σm = [(1-Trm)0.37 Tr,m exp (0.30066/Tr,m + 0.86442 Tr,m
9) (P L0,m
ρL,m - P V0,m
ρv,m)]4(4)
where σm is the surface tension of the mixture; PL0,m and PV
0,m are the temperature-independentconformal parameters for the liquid and vapor phase, respectively; Tr,m is the pseudo-reducedtemperature for the mixture (i.e. Tr,m = T / Tc,m); Tc,m is the pseudo-critical temperature of theliquid mixture); and ρL,m and ρv,m are the equilibrium densities of the liquid and vapor phase,
respectively. The aim of this report is the application of Eq. 4 for the prediction of the surfacetension of mixtures, over the whole concentration range from the temperature-independentparameter P0 for the pure components. In order to apply Eq. 4 to mixtures we need thefollowing,
1. Accurate prediction of phase equilibrium properties (i.e. composition of the liquid and vaporphases, vapor and liquid densities, and saturation pressures).
2. Mixing rules for the temperature-independent parameter P0 in order to calculate thetemperature-independent parameters PL
0,m and PV0,m for the liquid-and vapor-phase
mixtures.
Prediction of Phase Equilibrium PropertiesIn this work, the equilibrium properties for a multicomponent mixture were calculated in
two steps.First, the Peng-Robinson (PR) equation of state was used to predict the vapor pressure and
liquid- and vapor-phase compositions. The PR equation of state was selected for this purposebecause its parameters are known for many pure compounds and because its interactionparameters are available for numerous binary mixtures. Since the constants of the PR equationare fitted to vapor pressure data it is reliable for vapor-liquid-equilibrium (VLE) calculations.Second, the predicted compositions and vapor pressure by the PR equation were in turn used
AIChE Journal, Vol. 44, No. 10, pp. 2324-2332, 1998
4
with the Riazi-Mansoori (RM) equation of state (described below) to predict the densities of theliquid and vapor phases. The RM equation of state yields more accurate density predictions thanthe PR equation.The calculations described above have been incorporated into a comprehensive computerpackage for vapor-liquid-equilibrium (VLE) calculations. This computer package has been usedto perform the routine bubble-point and flash calculations.
The PR equation of state is given by,
P = RT / (V - b) - aα /(V2 + 2bV - b2) (5)
where P, T, and V=1/ρ are pressure, temperature, and molar volume, respectively; R is theuniversal gas constant; a = 0.45724 R2Tc
2 / Pc; b = 0.07780 RTc / Pc; Tc is the criticaltemperature; Pc is the critical pressure; α = [1 + (0.37464+ 1.5422 ω - 0.26992 ω2)(1 - Tr
0.5 )]
2;ω is the acentric factor; Tr=T/Tc is the reduced temperature. The mixing rules for thetemperature-dependent term (a αααα) and constant b are given by: (a α)m = ΣΣ [xixj(a α)ij] and bm =Σ (xi bi), respectively; (a α)m is the temperature-dependent parameter for the mixture; bm is thevolume-related constant for the mixture; and xi is the mole fraction of species i in the mixture.The cross-parameters are calculated using the following expression, (a α)ij = (1-kij)[(aα)i(aα)j]1/2
; where kij is a binary interaction parameter. This interaction parameter is calculated using acorrelation recently proposed by Gao, 1992: (1 - kij
PR) = [2 (Tci Tcj)1/2 / (Tci +Tcj)]
Zcij ; Zcij=[(Zci
+ Zcj)/2]; where Zci is the critical compressibility factor for pure component i.
Bubble-point and flash calculations are performed using the above equation of statefollowing the standard algorithms reported in textbooks (Walas, 1985). The predicted saturationpressure and vapor- and liquid-phase compositions are then used along with the Riazi-Mansoori(1993) equation of state (RM EOS) to calculate the equilibrium densities for the vapor and liquidphases. The RM EOS is given below,
P = ρRT/(1-bρ) -aρ2/[T1/2.(1+bρ)] (6)
a = 0.42748 R2Tc2.5/Pc and b = (0.08664 RTc/Pc).δ(R*,Tr)
δ-1 = 1+{ 0.02[1 - 0.92 exp (-1000 Tr - 1 )]-0.035(Tr - 1)} (R* - 1)
R* = Rm/Rm,ref; Rm = (4πNA/3)[α + µ 2f(T)] = (1/ρ)(n2-1)/(n2+2); Rm,ref=6.987
where ρ is the molar density; T, P, Tc, Pc, Tr, and R are as previously defined; Rm is the molarrefraction; Rm,ref is the molar refraction of the reference compound(methane); α and µ are thepolarizability and the dipole moment of the molecule; NA is the Avogadro’s number, n is thesodium-D light refractive index of a liquid at 20¡ C (Riazi and Mansoori, 1993).
In order to apply Eq. 6 to the case of mixtures the van der Waals mixing rules and the
AIChE Journal, Vol. 44, No. 10, pp. 2324-2332, 1998
5
molecular expressions for the cross-parameters (Riazi and Mansoori, 1993) have been used,
Tcm = ΣiΣj [xixj (Tcij
2 / Pcij)] / ΣiΣj [xixj (Tcij / Pcij)] (6a)
Tcij = (1 - kijRM) (Tci Tcj)
1/2 (6b)
Pcm = ΣiΣj [xixj (Tcij
2 / Pcij)] / { ΣiΣj [xixj (Tcij / Pcij)]} 2
(6c)
Pcij = 8 Tcij / [(Tcii / Pcii)1/3 + (Tcjj / Pcjj)
1/3]3 (6d)
R*m = ΣiΣj
(xixj R*ij) (6e)
R*ij = [R*
ii1/3 + R*
jj1/3]3 / 8 (6f)
In these equations, Tcm is the pseudo-critical temperature of the mixture; Tci is the criticaltemperature of pure component i in the mixture; Pcm is the pseudo-critical pressure of themixture; Pci is the critical pressure of pure component i in the mixture; Pcij is a cross-parameterfor pressure; kij
RM is the binary interaction parameter (RM stands for Riazi-Mansoori todifferentiate it from the interaction parameter used in the PR equation of state); R*
m is thedimensionless molar refraction of the mixture; R*
i is the dimensionless molar refraction of purecomponent i in the mixture; and xi is the mole fraction of component i in the mixture. Thebinary interaction parameter, kij
RM, is calculated using the following expression,
(1 - kijRM) = (1 - kij
PR) { 8 [(Tcii / Pcii)(Tcjj / Pcjj)]1/2 / [(Tcii / Pcii)
1/3 + (Tcjj / Pcjj)1/3]3} (6g)
Mixing Rules for the Temperature-independent parameter PoThis section is devoted to the development of the mixing rules for the temperature-
independent parameter Po. These mixing rules may be derived considering the proportionality ofPo to the intermolecular parameters(or critical properties) according to Kwak and Mansoori(1986). Following the principle of corresponding states a reduced surface tension may be definedas σr = σ / [Tc
2/3 (kTc)1/3] and expected to be a universal function of Tr = T/Tc (i.e. the
reduced temperature). Thus, it can be shown that,
Po,ii ∝ ∝ ∝ ∝ Tc13/12 / Pc
5/6 (7)
It may be assumed that the temperature-independent parameter, Po,m, for the mixture will follow
the same proportionality with respect to the critical temperature and pressure of the mixture,
Po,m ∝ .Tc,m13/12 / Pc,m
5/6 (8)
AIChE Journal, Vol. 44, No. 10, pp. 2324-2332, 1998
6
where Tc,m and Pc,m are the pseudo-critical temperature and pressure for the mixture,respectively. Introducing the van der Waals mixing rules for Tc,m and Pc,m, Eqs. 6a and 6c, into
Eq. 8 the following expression is obtained,
P o,m∝ {ΣiΣj(xixjTcij
2/Pcij)/ΣiΣj
(xixjTcij/Pcij
)}13/12/{ΣiΣj(xixjTcij
2/Pcij)/[ΣiΣj
(xixjTcij/Pcij
)]2}5/6
(9)
this equation may be further reduced to the following expression,
Po,m∝ [ΣiΣjxixj(Tcij
2 / Pcij)]1/4 [ΣiΣjxixj(Tcij / Pcij)]7/12 (10)
the term (Tcij2 / Pcij) maybe further simplified to obtain,
Tcij2 / Pcij =(Tcij
11/12 / Pcij1/6) (Tcij
13/12 / Pcij5/6) (11)
notice that the term within the second bracket on the right-hand side of Eq. 11 is nothing but Po,ij
given by Eq. 7. Thus, Eq. 11may be rewritten as follows,
Tcij2 / Pcij =(Tcij
11/12 / Pcij1/6) P0,ij (12)
Eq. 12 can further be rearranged as follows,
Tcij2 / Pcij =(Pcij / Tcij)
7/3 P40,ij (13)
By introducing Eq. 13 back into Eq. 10the following expression for Po,m is obtained,
Po,m =.[ΣiΣjxixj(Pcij / Tcij)
7/3 P40,ij]1/4 [ΣiΣj
xixj(Tcij / Pcij)]7/12 (14)
Eq. 14 represents the general van der Waals mixing rule proposed in this work for calculation ofthe temperature-independent parameter, Po,m, for a multicomponent mixture. The cross-
parameters may be calculated using the following expression,
AIChE Journal, Vol. 44, No. 10, pp. 2324-2332, 1998
7
Po,ij = (1 - mij) (P0,ii.P0,jj)
1/2 (15)
where mij is a binary interaction parameter. The cross-parameters for temperature and pressurein Eq. 14 may be calculated using Eq. 6b and 6d, respectively.
For the case of binary mixtures, the equations to calculate the temperature-independentparameters, PL
o,m and PVo,m, for the liquid phase is the following,
The temperature-independent parameter Pvo for the vapor-phase mixture is calculated by
replacing the xi’sin Eq. 16 by the compositions of the vapor phase (i.e. yi’s). The cross-parameters are then given by,
Po,12 = (1 - m12) (P0,1.P0,2)
1/2 (16a)
Tc12 = (1 - k12
RM) (Tc1 Tc2
)1/2 (16b)
Pc12 = 8 Tc12
/ [(Tc1 / Pc1
)1/3 + (Tc2 / Pc2
)1/3]3 (16c)
Eq. 16 may be used along with Eq. 4 to predict the surface tension of binary mixtures. In thefollowing sections the results for 55 binary mixtures are reported. Table 1 shows the physicalproperties of the pure fluids involved in these binary mixtures.
The most widely used mixing rules for the temperature-independent parameter, Po, in Eq. 4
used in the petroleum industry were proposed by Weinaug and Katz (1943) as follows,
Po,m= Σ(xi Po,i) (17)
Because of the simplicity of this mixing rule, it was decided to investigate the results obtainedwith Eq. 4 and this simple mixing rule as a preliminary step. Thus, the surface tension of all 55binary mixtures were predicted using the following procedure (CASE 1)
(a) The temperature-independent parameter Po for the pure compounds were obtained by fitting
Eq. 1 to the experimental surface tension for the pure compounds.(b) Routine VLE calculations were performed using a computer package developed in our
laboratory to obtain the vapor- and liquid-phase compositions as well as the saturationpressure. The results from the VLE calculations were used along with the Riazi-Mansoori
AIChE Journal, Vol. 44, No. 10, pp. 2324-2332, 1998
8
equation of state to predict the vapor and liquid densities.(c) Finally, Eqs. 4 and 17 were used to predict the surface tension for the mixture.
The results obtained for this CASE 1 are reported in Table 2. Note that the surface tension of all55 sets of binary-mixture data can be predicted with an overall 2.64 AAD%.
Surface Tension Prediction for Binary MixturesAs mentioned earlier, Eqs. 4, 16, 16a-16c,proposed in this work, represent the necessary
expressions to predict the surface tension of binary liquid mixtures. These expressions relate thesurface tension of the mixture to the bulk properties of the system such as the vapor- and liquid-phase compositions and vapor- and liquid-phase densities. Therefore, only the temperature-independent parameter Po for the pure components is needed. This parameter can be obtained
by fitting Eq. 1 to the experimental surface tension data for the pure fluids. It may also bepredicted using the corresponding-states expression given in Eq. 3.
In this work, we have predicted the surface tension for 55 binary mixtures and compared theresults against the experimental data for these systems. The selected systems represent a widevariety of binary mixtures (symmetric, asymmetric, and slightly asymmetric). The interactionparameter, mij, appearing in Eq. 15 has been treated as an adjustable parameter for all themixtures investigated.
The surface tension for all the binary mixtures was predicted following the procedureoutlined below,
(a) The temperature-independent parameter Po for the pure compounds were obtained in two
ways: CASE 2 by fitting Eq. 1 to the experimental surface tension for the pure compounds;and CASE 3 by predicting them using Eq. 3.
(b) VLE calculations were performed using a computer package developed according to whatwas discussed above to obtain the vapor- and liquid-phase compositions as well as thesaturation pressure. The results from the VLE calculations were used along with the Riazi-Mansoori equation of state to predict the equilibrium vapor and liquid densities.
(c) Finally, Eqs. 4, 16, and 16a-16c were used to predict the surface tension for the mixture.
The results obtained for these two cases are also reported in Table 2. It must be pointed out thatthe interaction parameter, mij’s in CASE 2 and CASE 3 are different. Therefore, a different valuefor each case is reported in Table2.
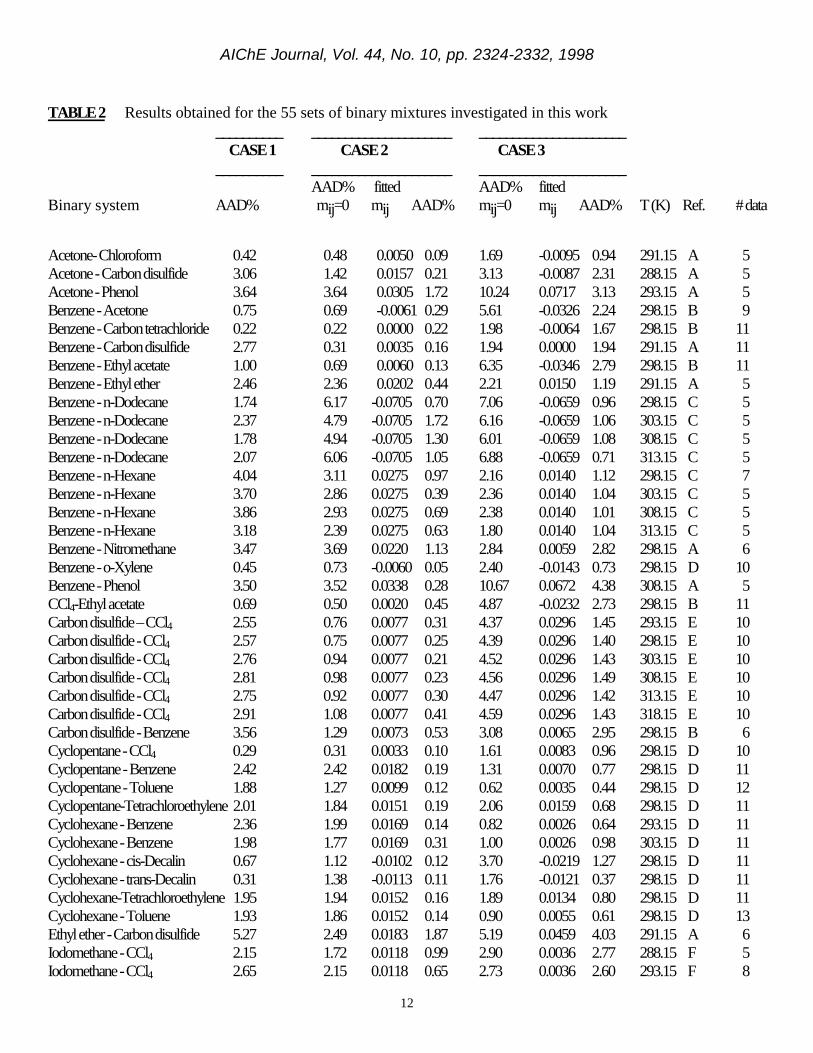
Results and Discussion for Binary MixturesTable 2 contains the results obtained for CASES1, 2, and 3. This table also reports
temperature, experimental data reference, and number of data points for each binary mixture.
CASE 2The average absolute percent deviation (AAD%) obtained when the binary interaction
AIChE Journal, Vol. 44, No. 10, pp. 2324-2332, 1998
9
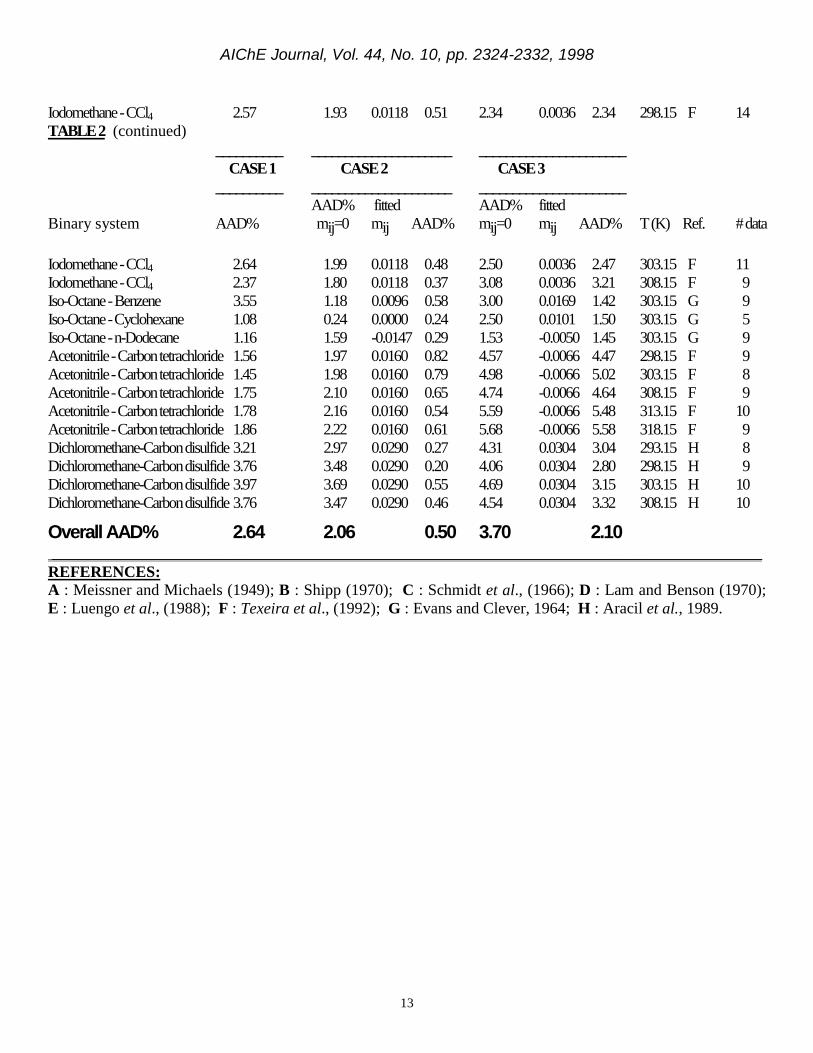
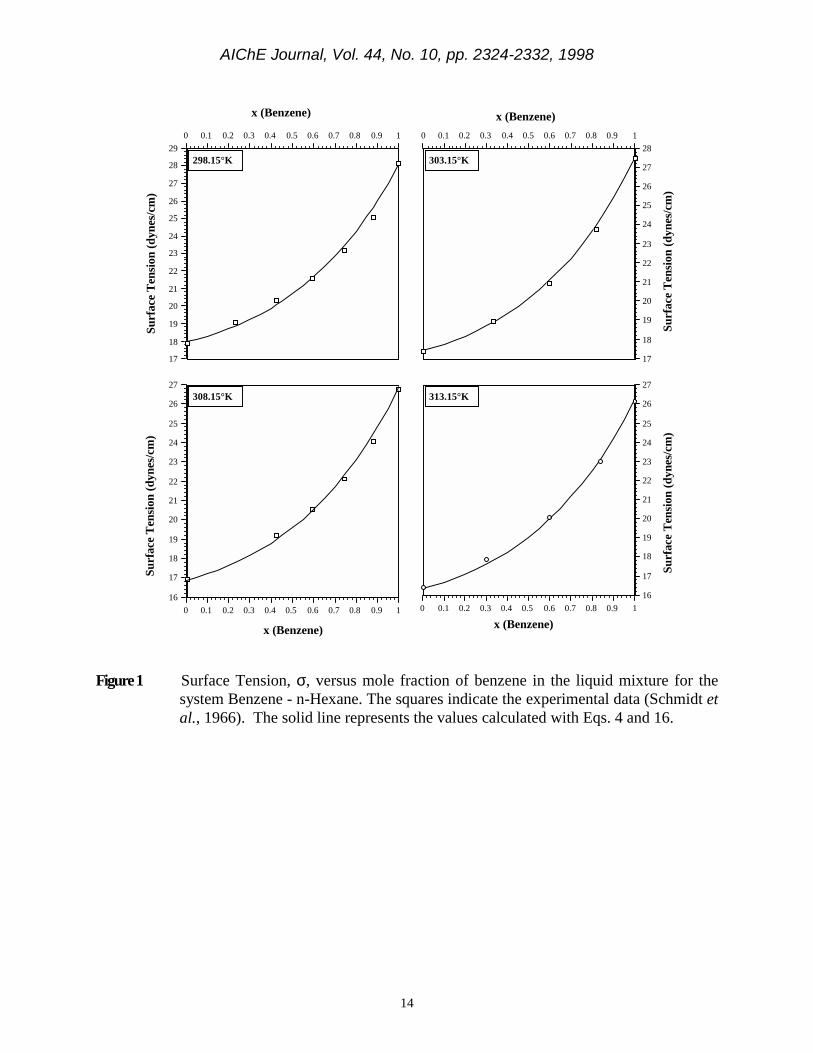
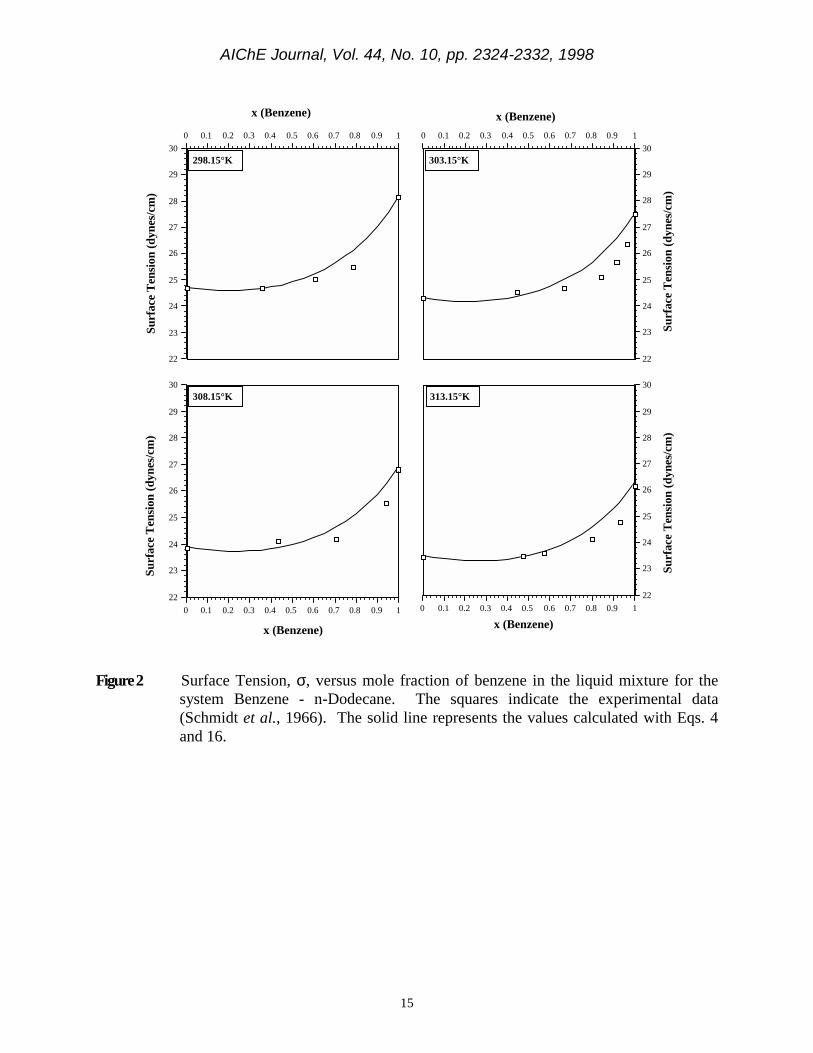
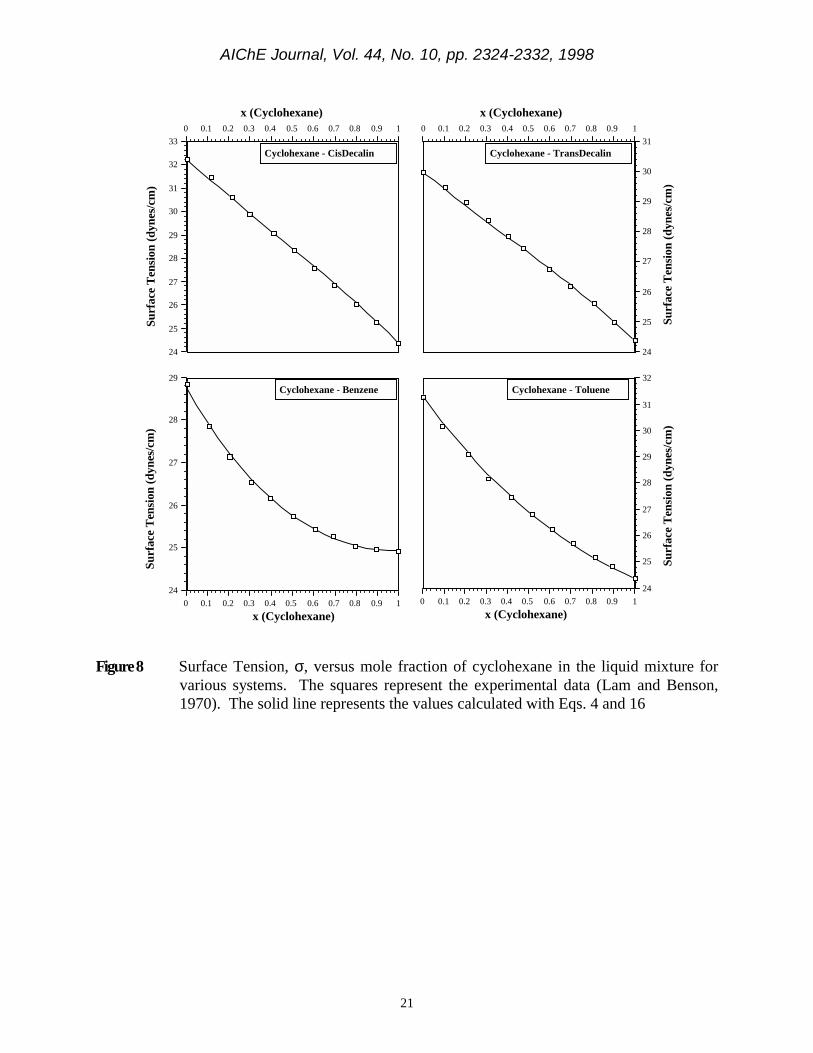
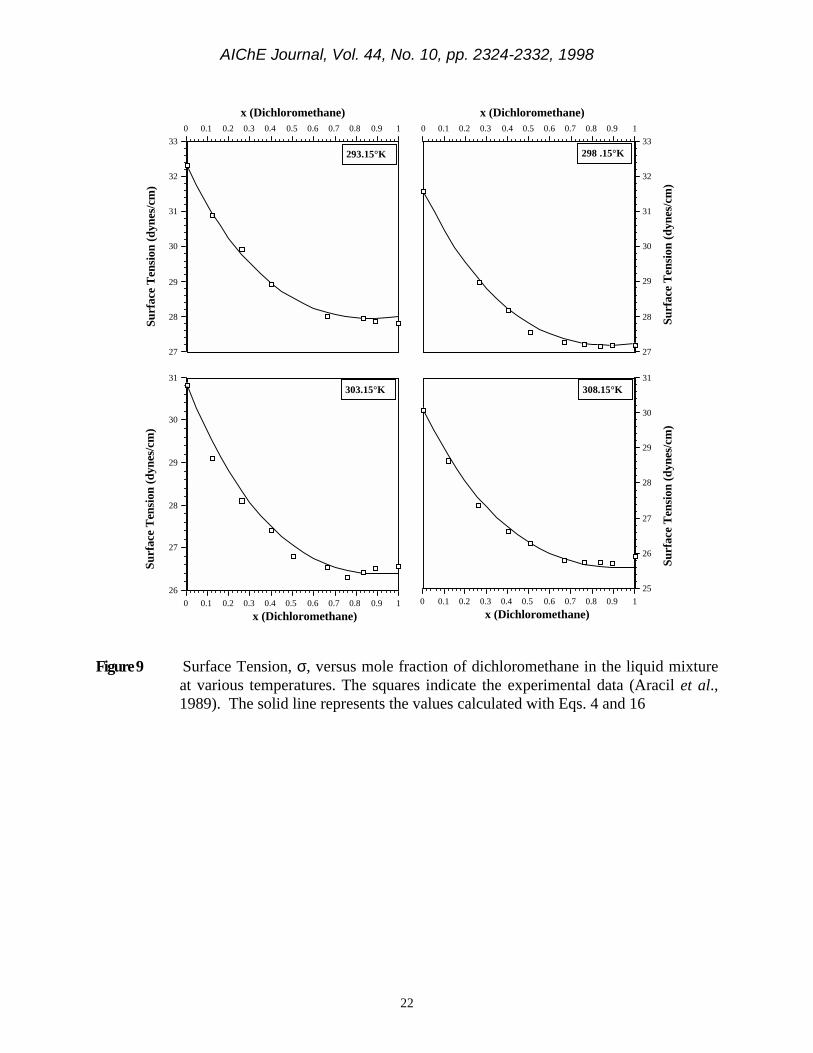
parameter (mij) was set equal to zero is reported. Note that the surface tension for all the 55binary mixtures can be predicted within an overall 2.06 AAD%. It may also be noticed that evenwhen mij is set equal to zero the surface tension for most binary mixtures can be predicted withreasonable accuracy. This represents an improvement over the simple mixing rule (CASE 1)asshown in Table 2. In a different calculation for CASE 2, the binary interaction parameters, mij,were fitted to all binary mixtures. The best value for this parameter is also reported in Table 2.It may be noted that this interaction parameter is small for all the systems investigated. Note alsothat when this optimized interaction parameter was used the surface tension of all 55 binarymixtures can be predicted within an overall0.50 AAD%. Figures 1 through 9 show the resultsobtained for CASE 2 when the best value for the binary interaction parameter used in theprediction of surface tension for the binary systems. Note the excellent agreement with theexperimental data.
CASE 3The AAD% obtained when the binary interaction parameter (mij) was set equal to zero and
the parameters Po are predicted using Eq. 3 is reported in Table 2. Note that the surface tension
for all the55 binary mixtures can be predicted within an overall 3.70 AAD%. It must be pointedout that by setting the binary interaction parameters equal to zero the surface tension is purelypredicted since the only adjustable parameter is eliminated. Note that predictions thus made arein good agreement with the experimental data except in a few cases where Eq. 3 fails to yieldgood estimates for the parameter Po. In another set of calculation for CASE 3 the binaryinteraction parameter (mij) was fitted to the experimental data. The best values for this parameterare also reported in Table2. Note that that when this optimized interaction parameter was usedthe surface tension of all the 55 binary mixtures can be predicted within an overall 2.10 AAD%.
It should be pointed out that in the absence of surface tension data for pure compounds, Eqs.3, 4, and 14 (CASE 3) represent an excellent tool to predict the surface tension of mixtures oforganic compounds. Good predictions will be obtained even when the binary interactionparameter, mij, is set equal to zero.
ConclusionsBased on the 55 sets of binary-mixture surface tension data analyzed in this work we may
conclude that the expressions proposed in this work for surface tension prediction of mixtures arevery good. These predictions are made using only the values of the temperature-independentparameter Po for the pure components in the mixture. This parameter may be obtained from
experimental surface tensions of the pure components or estimated using Eq. 3. It is also worthnoting that in these calculations only one adjustable parameter has been used namely the binaryinteraction parameter, mij, appearing in Eq. 15.
There exist a number of other methods for prediction of the surface tension of liquidmixtures. None of the other methods are as accurate in predicting mixture surface tension except
AIChE Journal, Vol. 44, No. 10, pp. 2324-2332, 1998
10
the ones by Carey et. al., (1980) and Winterfeld et al., (1978). The latter two methods reportvery accurate prediction of surface tension of mixtures provided pure fluid surface tension dataare available.
It may be concluded that the expressions proposed in this work are general since they havebeen applied to a variety of binary mixtures and the results obtained are in good agreement withthe experimental data. Application of the present method to multicomponent mixtures is straightforward. However, little reliable data are available for multicomponent surface tensions forreliable comparisons.
AIChE Journal, Vol. 44, No. 10, pp. 2324-2332, 1998
11
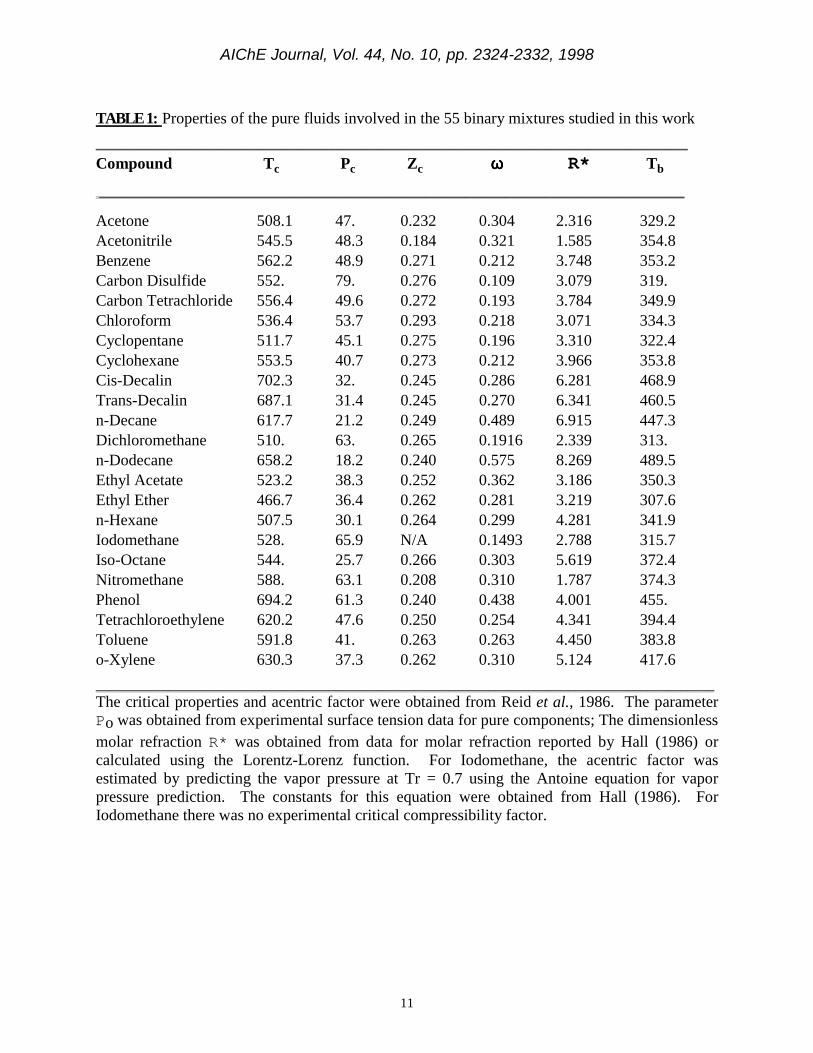
TABLE 1: Properties of the pure fluids involved in the 55 binary mixtures studied in this work_________________________________________________________________________________________Compound Tc Pc Zc ωωωω R* Tb
________________________________________________________________________________________
Acetone 508.1 47. 0.232 0.304 2.316 329.2Acetonitrile 545.5 48.3 0.184 0.321 1.585 354.8Benzene 562.2 48.9 0.271 0.212 3.748 353.2Carbon Disulfide 552. 79. 0.276 0.109 3.079 319.Carbon Tetrachloride 556.4 49.6 0.272 0.193 3.784 349.9Chloroform 536.4 53.7 0.293 0.218 3.071 334.3Cyclopentane 511.7 45.1 0.275 0.196 3.310 322.4Cyclohexane 553.5 40.7 0.273 0.212 3.966 353.8Cis-Decalin 702.3 32. 0.245 0.286 6.281 468.9Trans-Decalin 687.1 31.4 0.245 0.270 6.341 460.5n-Decane 617.7 21.2 0.249 0.489 6.915 447.3Dichloromethane 510. 63. 0.265 0.1916 2.339 313.n-Dodecane 658.2 18.2 0.240 0.575 8.269 489.5Ethyl Acetate 523.2 38.3 0.252 0.362 3.186 350.3Ethyl Ether 466.7 36.4 0.262 0.281 3.219 307.6n-Hexane 507.5 30.1 0.264 0.299 4.281 341.9Iodomethane 528. 65.9 N/A 0.1493 2.788 315.7Iso-Octane 544. 25.7 0.266 0.303 5.619 372.4Nitromethane 588. 63.1 0.208 0.310 1.787 374.3Phenol 694.2 61.3 0.240 0.438 4.001 455.Tetrachloroethylene 620.2 47.6 0.250 0.254 4.341 394.4Toluene 591.8 41. 0.263 0.263 4.450 383.8o-Xylene 630.3 37.3 0.262 0.310 5.124 417.6_____________________________________________________________________________________________The critical properties and acentric factor were obtained from Reid et al., 1986. The parameterPo was obtained from experimental surface tension data for pure components; The dimensionlessmolar refraction R* was obtained from data for molar refraction reported by Hall (1986) orcalculated using the Lorentz-Lorenz function. For Iodomethane, the acentric factor wasestimated by predicting the vapor pressure at Tr = 0.7 using the Antoine equation for vaporpressure prediction. The constants for this equation were obtained from Hall (1986). ForIodomethane there was no experimental critical compressibility factor.
AIChE Journal, Vol. 44, No. 10, pp. 2324-2332, 1998
12
TABLE 2 Results obtained for the 55 sets of binary mixtures investigated in this work__________ _____________________ ______________________
CASE 1 CASE 2 CASE 3__________ _____________________ ______________________
AAD% fitted AAD% fittedBinary system AAD% mij=0 mij AAD% mij=0 mij AAD% T (K) Ref. # data
Acetone- Chloroform 0.42 0.48 0.0050 0.09 1.69 -0.0095 0.94 291.15 A 5Acetone - Carbon disulfide 3.06 1.42 0.0157 0.21 3.13 -0.0087 2.31 288.15 A 5Acetone - Phenol 3.64 3.64 0.0305 1.72 10.24 0.0717 3.13 293.15 A 5Benzene - Acetone 0.75 0.69 -0.0061 0.29 5.61 -0.0326 2.24 298.15 B 9Benzene - Carbon tetrachloride 0.22 0.22 0.0000 0.22 1.98 -0.0064 1.67 298.15 B 11Benzene - Carbon disulfide 2.77 0.31 0.0035 0.16 1.94 0.0000 1.94 291.15 A 11Benzene - Ethyl acetate 1.00 0.69 0.0060 0.13 6.35 -0.0346 2.79 298.15 B 11Benzene - Ethyl ether 2.46 2.36 0.0202 0.44 2.21 0.0150 1.19 291.15 A 5Benzene - n-Dodecane 1.74 6.17 -0.0705 0.70 7.06 -0.0659 0.96 298.15 C 5Benzene - n-Dodecane 2.37 4.79 -0.0705 1.72 6.16 -0.0659 1.06 303.15 C 5Benzene - n-Dodecane 1.78 4.94 -0.0705 1.30 6.01 -0.0659 1.08 308.15 C 5Benzene - n-Dodecane 2.07 6.06 -0.0705 1.05 6.88 -0.0659 0.71 313.15 C 5Benzene - n-Hexane 4.04 3.11 0.0275 0.97 2.16 0.0140 1.12 298.15 C 7Benzene - n-Hexane 3.70 2.86 0.0275 0.39 2.36 0.0140 1.04 303.15 C 5Benzene - n-Hexane 3.86 2.93 0.0275 0.69 2.38 0.0140 1.01 308.15 C 5Benzene - n-Hexane 3.18 2.39 0.0275 0.63 1.80 0.0140 1.04 313.15 C 5Benzene - Nitromethane 3.47 3.69 0.0220 1.13 2.84 0.0059 2.82 298.15 A 6Benzene - o-Xylene 0.45 0.73 -0.0060 0.05 2.40 -0.0143 0.73 298.15 D 10Benzene - Phenol 3.50 3.52 0.0338 0.28 10.67 0.0672 4.38 308.15 A 5CCl4-Ethyl acetate 0.69 0.50 0.0020 0.45 4.87 -0.0232 2.73 298.15 B 11Carbon disulfide – CCl4 2.55 0.76 0.0077 0.31 4.37 0.0296 1.45 293.15 E 10Carbon disulfide - CCl4 2.57 0.75 0.0077 0.25 4.39 0.0296 1.40 298.15 E 10Carbon disulfide - CCl4 2.76 0.94 0.0077 0.21 4.52 0.0296 1.43 303.15 E 10Carbon disulfide - CCl4 2.81 0.98 0.0077 0.23 4.56 0.0296 1.49 308.15 E 10Carbon disulfide - CCl4 2.75 0.92 0.0077 0.30 4.47 0.0296 1.42 313.15 E 10Carbon disulfide - CCl4 2.91 1.08 0.0077 0.41 4.59 0.0296 1.43 318.15 E 10Carbon disulfide - Benzene 3.56 1.29 0.0073 0.53 3.08 0.0065 2.95 298.15 B 6Cyclopentane - CCl4 0.29 0.31 0.0033 0.10 1.61 0.0083 0.96 298.15 D 10Cyclopentane - Benzene 2.42 2.42 0.0182 0.19 1.31 0.0070 0.77 298.15 D 11Cyclopentane - Toluene 1.88 1.27 0.0099 0.12 0.62 0.0035 0.44 298.15 D 12Cyclopentane-Tetrachloroethylene 2.01 1.84 0.0151 0.19 2.06 0.0159 0.68 298.15 D 11Cyclohexane - Benzene 2.36 1.99 0.0169 0.14 0.82 0.0026 0.64 293.15 D 11Cyclohexane - Benzene 1.98 1.77 0.0169 0.31 1.00 0.0026 0.98 303.15 D 11Cyclohexane - cis-Decalin 0.67 1.12 -0.0102 0.12 3.70 -0.0219 1.27 298.15 D 11Cyclohexane - trans-Decalin 0.31 1.38 -0.0113 0.11 1.76 -0.0121 0.37 298.15 D 11Cyclohexane-Tetrachloroethylene 1.95 1.94 0.0152 0.16 1.89 0.0134 0.80 298.15 D 11Cyclohexane - Toluene 1.93 1.86 0.0152 0.14 0.90 0.0055 0.61 298.15 D 13Ethyl ether - Carbon disulfide 5.27 2.49 0.0183 1.87 5.19 0.0459 4.03 291.15 A 6Iodomethane - CCl4 2.15 1.72 0.0118 0.99 2.90 0.0036 2.77 288.15 F 5Iodomethane - CCl4 2.65 2.15 0.0118 0.65 2.73 0.0036 2.60 293.15 F 8
AIChE Journal, Vol. 44, No. 10, pp. 2324-2332, 1998
13
Iodomethane - CCl4 2.57 1.93 0.0118 0.51 2.34 0.0036 2.34 298.15 F 14TABLE 2 (continued)
__________ _____________________ ______________________ CASE 1 CASE 2 CASE 3
__________ _____________________ ______________________AAD% fitted AAD% fitted
Binary system AAD% mij=0 mij AAD% mij=0 mij AAD% T (K) Ref. # data
Iodomethane - CCl4 2.64 1.99 0.0118 0.48 2.50 0.0036 2.47 303.15 F 11Iodomethane - CCl4 2.37 1.80 0.0118 0.37 3.08 0.0036 3.21 308.15 F 9Iso-Octane - Benzene 3.55 1.18 0.0096 0.58 3.00 0.0169 1.42 303.15 G 9Iso-Octane - Cyclohexane 1.08 0.24 0.0000 0.24 2.50 0.0101 1.50 303.15 G 5Iso-Octane - n-Dodecane 1.16 1.59 -0.0147 0.29 1.53 -0.0050 1.45 303.15 G 9Acetonitrile - Carbon tetrachloride 1.56 1.97 0.0160 0.82 4.57 -0.0066 4.47 298.15 F 9Acetonitrile - Carbon tetrachloride 1.45 1.98 0.0160 0.79 4.98 -0.0066 5.02 303.15 F 8Acetonitrile - Carbon tetrachloride 1.75 2.10 0.0160 0.65 4.74 -0.0066 4.64 308.15 F 9Acetonitrile - Carbon tetrachloride 1.78 2.16 0.0160 0.54 5.59 -0.0066 5.48 313.15 F 10Acetonitrile - Carbon tetrachloride 1.86 2.22 0.0160 0.61 5.68 -0.0066 5.58 318.15 F 9Dichloromethane-Carbon disulfide 3.21 2.97 0.0290 0.27 4.31 0.0304 3.04 293.15 H 8Dichloromethane-Carbon disulfide 3.76 3.48 0.0290 0.20 4.06 0.0304 2.80 298.15 H 9Dichloromethane-Carbon disulfide 3.97 3.69 0.0290 0.55 4.69 0.0304 3.15 303.15 H 10Dichloromethane-Carbon disulfide 3.76 3.47 0.0290 0.46 4.54 0.0304 3.32 308.15 H 10
Overall AAD% 2.64 2.06 0.50 3.70 2.10 _________________________________________________________________________________________REFERENCES:A : Meissner and Michaels (1949); B : Shipp (1970); C : Schmidt et al., (1966); D : Lam and Benson (1970);E : Luengo et al., (1988); F : Texeira et al., (1992); G : Evans and Clever, 1964; H : Aracil et al., 1989.
AIChE Journal, Vol. 44, No. 10, pp. 2324-2332, 1998
14
16
17
18
19
20
21
22
23
24
25
26
27
Surf
ace
Tens
ion
(dyn
es/c
m)
0 0.1 0.2 0.3 0.4 0.5 0.6 0.7 0.8 0.9 1
x (Benzene)
16
17
18
19
20
21
22
23
24
25
26
27
Surf
ace
Tens
ion
(dyn
es/c
m)
0 0.1 0.2 0.3 0.4 0.5 0.6 0.7 0.8 0.9 1
x (Benzene)
313.15°K308.15°K
17
18
19
20
21
22
23
24
25
26
27
28
29Su
rfac
e Te
nsio
n (d
ynes
/cm
)0 0.1 0.2 0.3 0.4 0.5 0.6 0.7 0.8 0.9 1
17
18
19
20
21
22
23
24
25
26
27
28
Surf
ace
Tens
ion
(dyn
es/c
m)
0 0.1 0.2 0.3 0.4 0.5 0.6 0.7 0.8 0.9 1
x (Benzene) x (Benzene)
298.15°K 303.15°K
Figure 1 Surface Tension, σ, versus mole fraction of benzene in the liquid mixture for thesystem Benzene - n-Hexane. The squares indicate the experimental data (Schmidt etal., 1966). The solid line represents the values calculated with Eqs. 4 and 16.
AIChE Journal, Vol. 44, No. 10, pp. 2324-2332, 1998
15
22
23
24
25
26
27
28
29
30
Surf
ace
Tens
ion
(dyn
es/c
m)
0 0.1 0.2 0.3 0.4 0.5 0.6 0.7 0.8 0.9 1
x (Benzene)
22
23
24
25
26
27
28
29
30
Surf
ace
Tens
ion
(dyn
es/c
m)
0 0.1 0.2 0.3 0.4 0.5 0.6 0.7 0.8 0.9 1
x (Benzene)
313.15°K308.15°K
22
23
24
25
26
27
28
29
30Su
rfac
e Te
nsio
n (d
ynes
/cm
)0 0.1 0.2 0.3 0.4 0.5 0.6 0.7 0.8 0.9 1
22
23
24
25
26
27
28
29
30
Surf
ace
Tens
ion
(dyn
es/c
m)
0 0.1 0.2 0.3 0.4 0.5 0.6 0.7 0.8 0.9 1
x (Benzene) x (Benzene)
298.15°K 303.15°K
Figure 2 Surface Tension, σ, versus mole fraction of benzene in the liquid mixture for thesystem Benzene - n-Dodecane. The squares indicate the experimental data(Schmidt et al., 1966). The solid line represents the values calculated with Eqs. 4and 16.
AIChE Journal, Vol. 44, No. 10, pp. 2324-2332, 1998
16
26
27
28
29
Surf
ace
Tens
ion
(dyn
es/c
m)
0 0.1 0.2 0.3 0.4 0.5 0.6 0.7 0.8 0.9 1x (Benzene)
23
24
25
26
27
28
29
Surf
ace
Tens
ion
(dyn
es/c
m)
0 0.1 0.2 0.3 0.4 0.5 0.6 0.7 0.8 0.9 1x (Benzene)
Benzene - Carbon TetrachlorideBenzene - Acetone
23
24
25
26
27
28
29Su
rfac
e Te
nsio
n (d
ynes
/cm
)
0 0.1 0.2 0.3 0.4 0.5 0.6 0.7 0.8 0.9 1
28
28.5
29
29.5
Surf
ace
Tens
ion
(dyn
es/c
m)
0 0.1 0.2 0.3 0.4 0.5 0.6 0.7 0.8 0.9 1
x (Benzene) x (Benzene)
Benzene - Ethylacetate Benzene - o-Xylene
Figure 3 Surface Tension, σ, mole fraction of benzene in the liquid mixture for varioussystems. The squares indicate the experimental data (Shipp, 1970). Data for thesystem benzene - o-xylene was taken from Lam and Benson (1970). The solid linerepresents the values calculated with Eqs. 4 and 16.
AIChE Journal, Vol. 44, No. 10, pp. 2324-2332, 1998
17
16
18
20
22
24
26
Surf
ace
Tens
ion
(dyn
es/c
m)
0 0.1 0.2 0.3 0.4 0.5 0.6 0.7 0.8 0.9 1x (Iso-octane)
17
18
19
20
21
22
23
24
25
Surf
ace
Tens
ion
(dyn
es/c
m)
0 0.1 0.2 0.3 0.4 0.5 0.6 0.7 0.8 0.9 1x (Iso-octane)
Iso-octane - n-DodecaneIso-octane - Cyclohexane
28
29
30
31
32
33Su
rfac
e Te
nsio
n (d
ynes
/cm
)
0 0.1 0.2 0.3 0.4 0.5 0.6 0.7 0.8 0.9 1
26
27
28
29
30
31
32
33
34
Surf
ace
Tens
ion
(dyn
es/c
m)
0 0.1 0.2 0.3 0.4 0.5 0.6 0.7 0.8 0.9 1
x (Carbon disulfide) x (Carbon disulfide)
Carbon disulfide - Benzene Carbon disulfide - Carbon tetrachloride
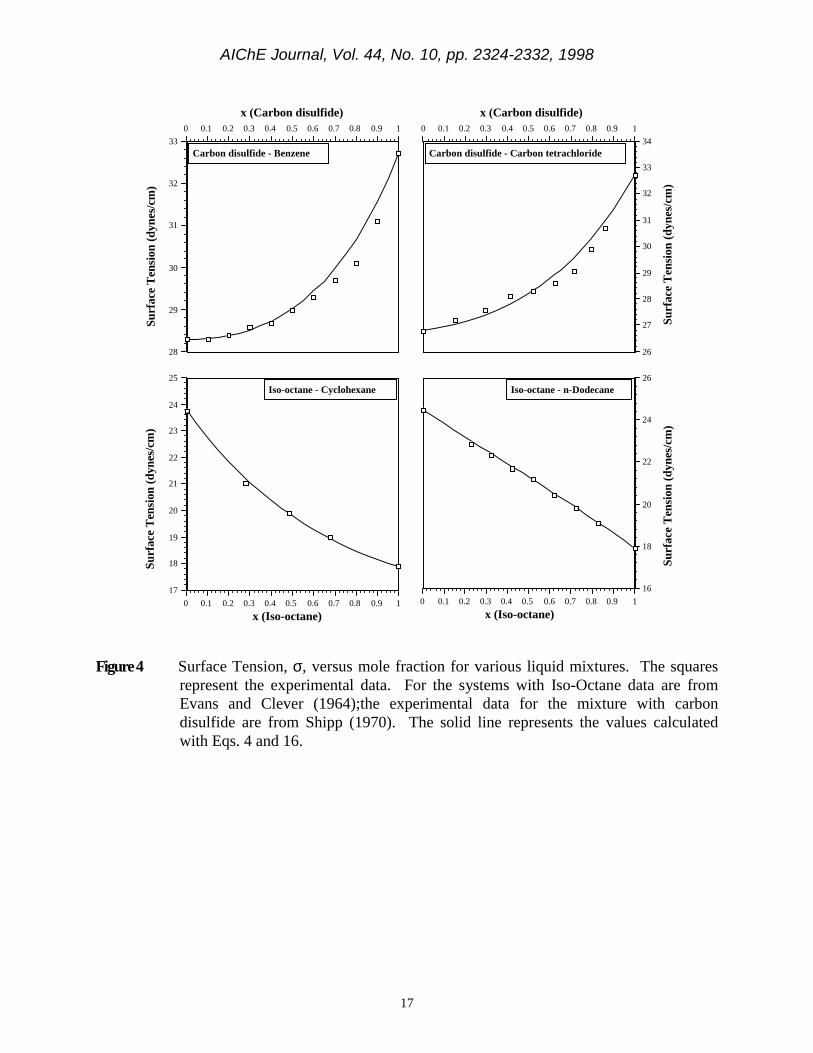
Figure 4 Surface Tension, σ, versus mole fraction for various liquid mixtures. The squaresrepresent the experimental data. For the systems with Iso-Octane data are fromEvans and Clever (1964);the experimental data for the mixture with carbondisulfide are from Shipp (1970). The solid line represents the values calculatedwith Eqs. 4 and 16.
AIChE Journal, Vol. 44, No. 10, pp. 2324-2332, 1998
18
24
25
26
27
28
29
30
31
32
Surf
ace
Tens
ion
(dyn
es/c
m)
0 0.1 0.2 0.3 0.4 0.5 0.6 0.7 0.8 0.9 1x (Iodomethane)
24
25
26
27
28
29
30
31
32
Surf
ace
Tens
ion
(dyn
es/c
m)
0 0.1 0.2 0.3 0.4 0.5 0.6 0.7 0.8 0.9 1x (Iodomethane)
308.15°K303.15°K
25
26
27
28
29
30
31
32Su
rfac
e Te
nsio
n (d
ynes
/cm
)
0 0.1 0.2 0.3 0.4 0.5 0.6 0.7 0.8 0.9 1
25
26
27
28
29
30
31
32
Surf
ace
Tens
ion
(dyn
es/c
m)
0 0.1 0.2 0.3 0.4 0.5 0.6 0.7 0.8 0.9 1
x (Iodomethane) x (Iodomethane)
293.15°K 298 .15°K
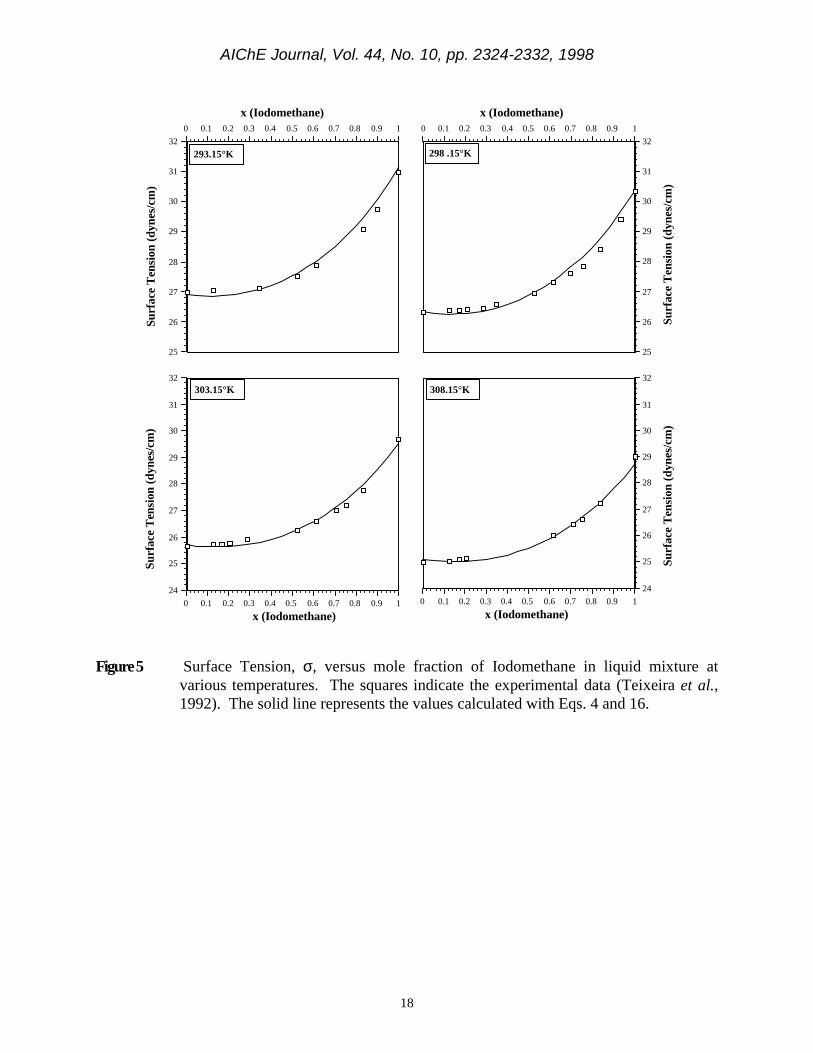
Figure 5 Surface Tension, σ, versus mole fraction of Iodomethane in liquid mixture atvarious temperatures. The squares indicate the experimental data (Teixeira et al.,1992). The solid line represents the values calculated with Eqs. 4 and 16.
AIChE Journal, Vol. 44, No. 10, pp. 2324-2332, 1998
19
22
23
24
25
26
27
28
29
Surf
ace
Tens
ion
(dyn
es/c
m)
0 0.1 0.2 0.3 0.4 0.5 0.6 0.7 0.8 0.9 1x (Acetonitrile)
24
25
26
27
28
Surf
ace
Tens
ion
(dyn
es/c
m)
0 0.1 0.2 0.3 0.4 0.5 0.6 0.7 0.8 0.9 1x (Acetonitrile)
318.15°K308.15°K
24
25
26
27
28
29
30
31Su
rfac
e Te
nsio
n (d
ynes
/cm
)
0 0.1 0.2 0.3 0.4 0.5 0.6 0.7 0.8 0.9 1
25
26
27
28
29
Surf
ace
Tens
ion
(dyn
es/c
m)
0 0.1 0.2 0.3 0.4 0.5 0.6 0.7 0.8 0.9 1
x (Acetonitrile) x (Acetonitrile)
298.15°K 303.15°K
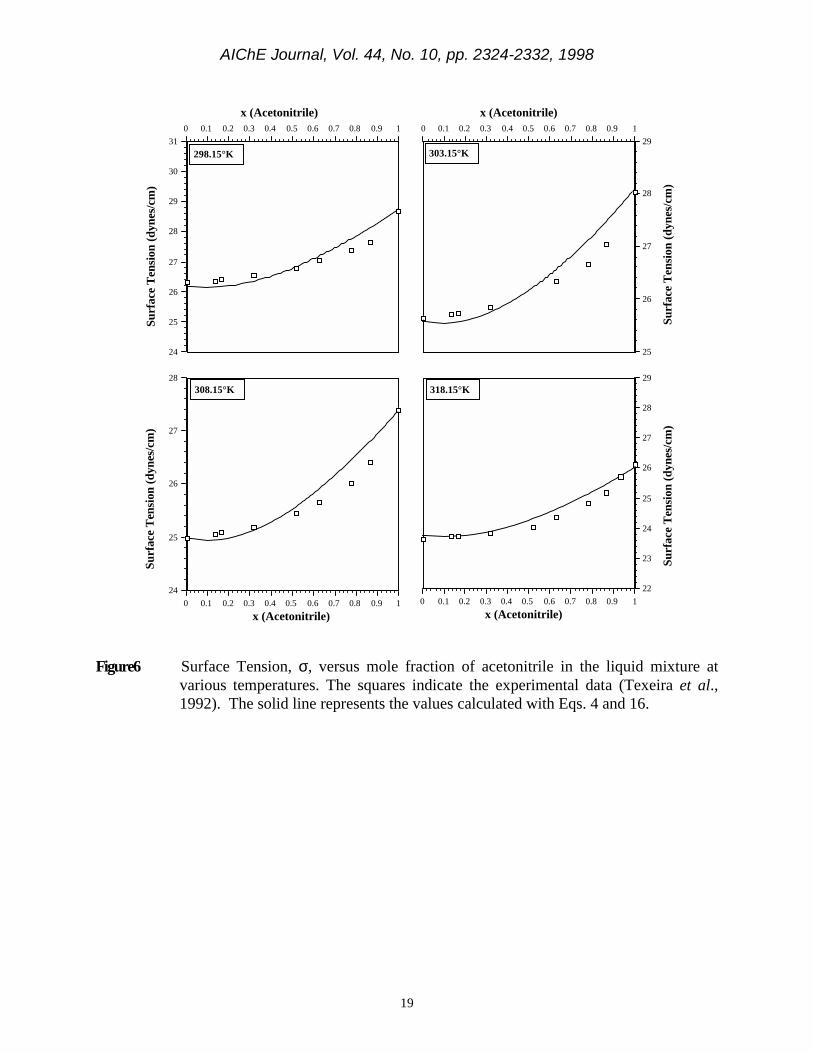
Figure6 Surface Tension, σ, versus mole fraction of acetonitrile in the liquid mixture atvarious temperatures. The squares indicate the experimental data (Texeira et al.,1992). The solid line represents the values calculated with Eqs. 4 and 16.
AIChE Journal, Vol. 44, No. 10, pp. 2324-2332, 1998
20
21
22
23
24
25
26
27
28
29
Surf
ace
Tens
ion
(dyn
es/c
m)
0 0.1 0.2 0.3 0.4 0.5 0.6 0.7 0.8 0.9 1x (Cyclopentane)
21
22
23
24
25
26
27
28
29
30
31
32
Surf
ace
Tens
ion
(dyn
es/c
m)
0 0.1 0.2 0.3 0.4 0.5 0.6 0.7 0.8 0.9 1x (Cyclopentane)
Cyclopentane - TolueneCyclopentane - Tetrachloroethylene
21
22
23
24
25
26
27
28
29Su
rfac
e Te
nsio
n (d
ynes
/cm
)
0 0.1 0.2 0.3 0.4 0.5 0.6 0.7 0.8 0.9 1
21
22
23
24
25
26
27
Surf
ace
Tens
ion
(dyn
es/c
m)
0 0.1 0.2 0.3 0.4 0.5 0.6 0.7 0.8 0.9 1
x (Cyclopentane) x (Cyclopentane)
Cyclopentane - Benzene Cyclopentane - Carbon Tetrachloride
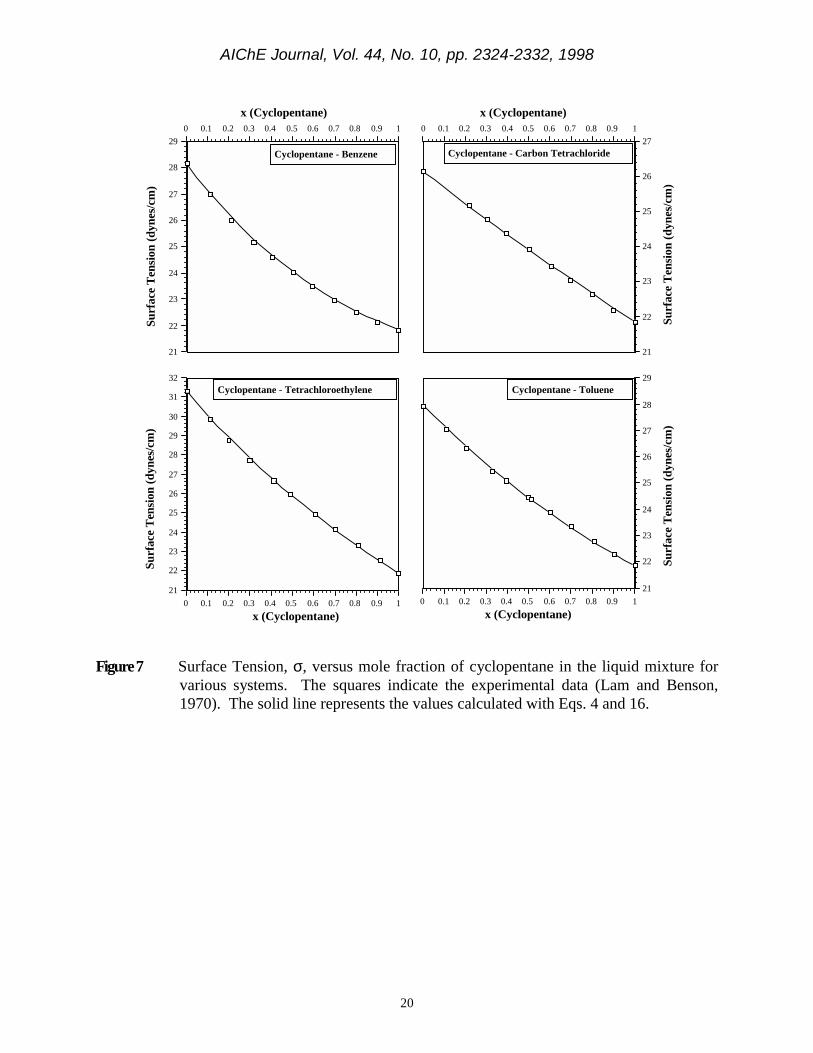
Figure 7 Surface Tension, σ, versus mole fraction of cyclopentane in the liquid mixture forvarious systems. The squares indicate the experimental data (Lam and Benson,1970). The solid line represents the values calculated with Eqs. 4 and 16.
AIChE Journal, Vol. 44, No. 10, pp. 2324-2332, 1998
21
24
25
26
27
28
29
30
31
32
Surf
ace
Tens
ion
(dyn
es/c
m)
0 0.1 0.2 0.3 0.4 0.5 0.6 0.7 0.8 0.9 1x (Cyclohexane)
24
25
26
27
28
29
Surf
ace
Tens
ion
(dyn
es/c
m)
0 0.1 0.2 0.3 0.4 0.5 0.6 0.7 0.8 0.9 1x (Cyclohexane)
Cyclohexane - TolueneCyclohexane - Benzene
24
25
26
27
28
29
30
31
32
33Su
rfac
e Te
nsio
n (d
ynes
/cm
)
0 0.1 0.2 0.3 0.4 0.5 0.6 0.7 0.8 0.9 1
24
25
26
27
28
29
30
31
Surf
ace
Tens
ion
(dyn
es/c
m)
0 0.1 0.2 0.3 0.4 0.5 0.6 0.7 0.8 0.9 1
x (Cyclohexane) x (Cyclohexane)
Cyclohexane - CisDecalin Cyclohexane - TransDecalin
Figure 8 Surface Tension, σ, versus mole fraction of cyclohexane in the liquid mixture forvarious systems. The squares represent the experimental data (Lam and Benson,1970). The solid line represents the values calculated with Eqs. 4 and 16
AIChE Journal, Vol. 44, No. 10, pp. 2324-2332, 1998
22
25
26
27
28
29
30
31
Surf
ace
Tens
ion
(dyn
es/c
m)
0 0.1 0.2 0.3 0.4 0.5 0.6 0.7 0.8 0.9 1x (Dichloromethane)
26
27
28
29
30
31
Surf
ace
Tens
ion
(dyn
es/c
m)
0 0.1 0.2 0.3 0.4 0.5 0.6 0.7 0.8 0.9 1x (Dichloromethane)
308.15°K303.15°K
27
28
29
30
31
32
33Su
rfac
e Te
nsio
n (d
ynes
/cm
)
0 0.1 0.2 0.3 0.4 0.5 0.6 0.7 0.8 0.9 1
27
28
29
30
31
32
33
Surf
ace
Tens
ion
(dyn
es/c
m)
0 0.1 0.2 0.3 0.4 0.5 0.6 0.7 0.8 0.9 1
x (Dichloromethane) x (Dichloromethane)
293.15°K 298 .15°K
Figure 9 Surface Tension, σ, versus mole fraction of dichloromethane in the liquid mixtureat various temperatures. The squares indicate the experimental data (Aracil et al.,1989). The solid line represents the values calculated with Eqs. 4 and 16
AIChE Journal, Vol. 44, No. 10, pp. 2324-2332, 1998
23
References
Aracil, J., Luengo, G., Almeida, B.S., Telo da Gama, M.M., Rubio, R.G., and Diaz Pe– a, M.“Surface properties of Mixtures of Molecular Fluids. An Experimental and TheoreticalStudy of CS2 + CH2Cl2 andCS2 + CCl4,” J. Phys. Chem. (1989) 93, 3210-3218.
Carey, B.S., Scriven, L.E., and Davis, H.T. “Semiempirical Theory of Surface Tension ofBinary Systems,” AIChEJ. (1980) 26, 705.
Chapela, G.A., Saville, G., and Rowlinson, J.S. “Computer Simulation of a Gas-LiquidSurface,” J. Chem Soc. Faraday Trans. II (1977) 73, 1133.
Croxton, C.A., Liquid State Physics - A Statistical Mechanical Introduction, CambridgeUniversity Press, Cambridge, 141-189(1974).
Croxton, C.A., Fluid Interfacial Phenomena, John Wiley & Sons, New York, NY, 1986.
Deam, J.R. and Maddox, R.N. “Interfacial Tensions in Hydrocarbon Systems,” J. Chem. Eng.Data (1970)15, 216.
Escobedo, J. and Mansoori, G.A. “Surface Tension Prediction for Pure fluids,” AIChE J. 42(5):1425,1996.
Escobedo, J. Flow behavior of Heavy Organic Particles Contained in Crude Oils, Dissertation,Univ. of Illinois, Chicago, IL,1995.
Evans, H.B., Jr. and Clever, H.L. “Surface Tensions of Binary Mixtures of Isooctane withBenzene, Cyclohexane, and n-Dodecane at 30¡ ,” J. Phys. Chem. (1964)68, 3433.
Gambill, W.R. “Surface and Interfacial Tensions,” Chem. Eng. (1958) May 5, 143.
Gao, G. “A Simple Correlation to Evaluate Binary Interaction Parameters of the Peng-RobinsonEquation of State,” Fluid Phase Equil. (1992) 74, 85.
Hall, K.R. (Ed.) TRC Thermodynamic Table - Hydrocarbons, Thermodynamic Research Center,Texas A&M University System,1986.
Kwak, T.Y. and Mansoori, G.A. "Van der Waals Mixing Rules for Cubic Equations of State-Applications for Supercritical Fluid Extraction Modelling," Chem.Eng. Sci. (1986) 41( 5),pp.1303-1309.
Lam, V.T. and Benson, G.C. “Surface Tensions of Binary Liquid Systems. I. Mixtures ofNonelecrolytes,” Can. J. Chem. (1970) 48, 3773.
Luengo, G., Aracil, J., Rubio, R.G., and Diaz Pe– a, M. “Bulk and Surface ThermodynamicProperties in Mixtures of Small Rigid Molecules: The CCl4 + CS2 System” J. Phys.Chem. (1988) 92, 228-234.
AIChE Journal, Vol. 44, No. 10, pp. 2324-2332, 1998
24
Massih, A.R. and Mansoori, G.A. "Conformal Solution Theory ofPolar Fluids," Fluid PhaseEquil., (1983) 10, 57-72.
Massoudi, R. and King, A.D. “Effect of Pressure on the Surface Tension of n-Hexane,” J. Phys.Chem. (1975) 79, 1676.
Riazi, M.R. and Mansoori, G.A. "Simple Equation of State Accurately Predicts HydrocarbonDensities," Oil and Gas J. (1993)July 12, 108.
Schmidt, R.L., Randall, J.C., and Clever, H.L. “The Surface Tension and Density of BinaryHydrocarbon Mixtures: Benzene-n-Hexane and Benzene-n-Dodecane,” J. Phys. Chem.(1966) 70, 3912.
Shipp, W.E. “Surface Tension of Binary Mixtures of Several Organic Liquids at 25¡ C,” J.Chem. Eng. Data (1970) 15, 308.
Teixeira, P.I.C., Almeida, B.S., Telo da Gama, M.M, Rueda, J.A., and Rubio, R.G. “InterfacialProperties of Mixtures of Molecular Fluids. Comparison between Theory andExperiment: CH3I + CCl4 and CH3CN + CCl4,” J. Phys. Chem. (1992) 96, 8488.
Weinaug, C.F. and Katz, D.L., “Surface Tensions of Methane Propane-Mixtures,” Ind. Eng.Chem. (1943) 35(2), 239.
Wertheim, M.S., "Correlations in the Liquid-Vapor Interface," J. Phys. Chem. (1976) 65, 2377.
Winterfield, P.H., Scriven, L.E., and Davis, H.T. “An Approximate Theory of InterfacialTension of Multicomponent Systems: Applications Binary Liquid-Vapor Tensions,”AIChE J. (1978) 24, 1010.