Supramolecular double helix from capped γ-peptide · Supramolecular double helix from capped ......
35
1 ESI Supramolecular double helix from capped γ-peptide Suman kumar Maity, Sibaprasad Maity, Poulami Jana and Debasish Haldar* Department of Chemical Sciences, Indian Institute of Science Education and Research Kolkata, Mohanpur, West Bengal 741252, India. Fax: +913325873020; Tel: +913325873119; E-mail: [email protected] ; [email protected] Table of contents Fig. S1, ESI 2 Figure S6 23 Fig. S2, ESI 3 Figure S7 24 Table 1 4 Figure S8 25 Fig. S3, ESI 5 Figure S9 26 Fig. S4, ESI 6 Figure S10 27 Fig. S5, ESI 7 Figure S11 28 Fig. S6, ESI 8 Figure S12 29 Fig. S7, ESI 9 Figure S13 30 Fig. S8, ESI 10 Figure S14 31 Fig. S9, ESI 11 Figure S15 32 Figure S1 12 Figure S16 33 Experimental 13-18 Figure S17 34 Figure S2 19 Figure S18 35 Figure S3 20 Figure S19 36 Figure S4 21 Figure S5 22 Electronic Supplementary Material (ESI) for Chemical Communications This journal is © The Royal Society of Chemistry 2011
Transcript of Supramolecular double helix from capped γ-peptide · Supramolecular double helix from capped ......
1
ESI
Supramolecular double helix from capped γ-peptide
Suman kumar Maity, Sibaprasad Maity, Poulami Jana and Debasish Haldar*
Department of Chemical Sciences, Indian Institute of Science Education and Research
Kolkata, Mohanpur, West Bengal 741252, India.
Fax: +913325873020; Tel: +913325873119;
E-mail: [email protected]; [email protected]
Table of contents
Fig. S1, ESI 2 Figure S6 23
Fig. S2, ESI 3 Figure S7 24
Table 1 4 Figure S8 25
Fig. S3, ESI 5 Figure S9 26
Fig. S4, ESI 6 Figure S10 27
Fig. S5, ESI 7 Figure S11 28
Fig. S6, ESI 8 Figure S12 29
Fig. S7, ESI 9 Figure S13 30
Fig. S8, ESI 10 Figure S14 31
Fig. S9, ESI 11 Figure S15 32
Figure S1 12 Figure S16 33
Experimental 13-18 Figure S17 34
Figure S2 19 Figure S18 35
Figure S3 20 Figure S19 36
Figure S4 21
Figure S5 22
Electronic Supplementary Material (ESI) for Chemical CommunicationsThis journal is © The Royal Society of Chemistry 2011
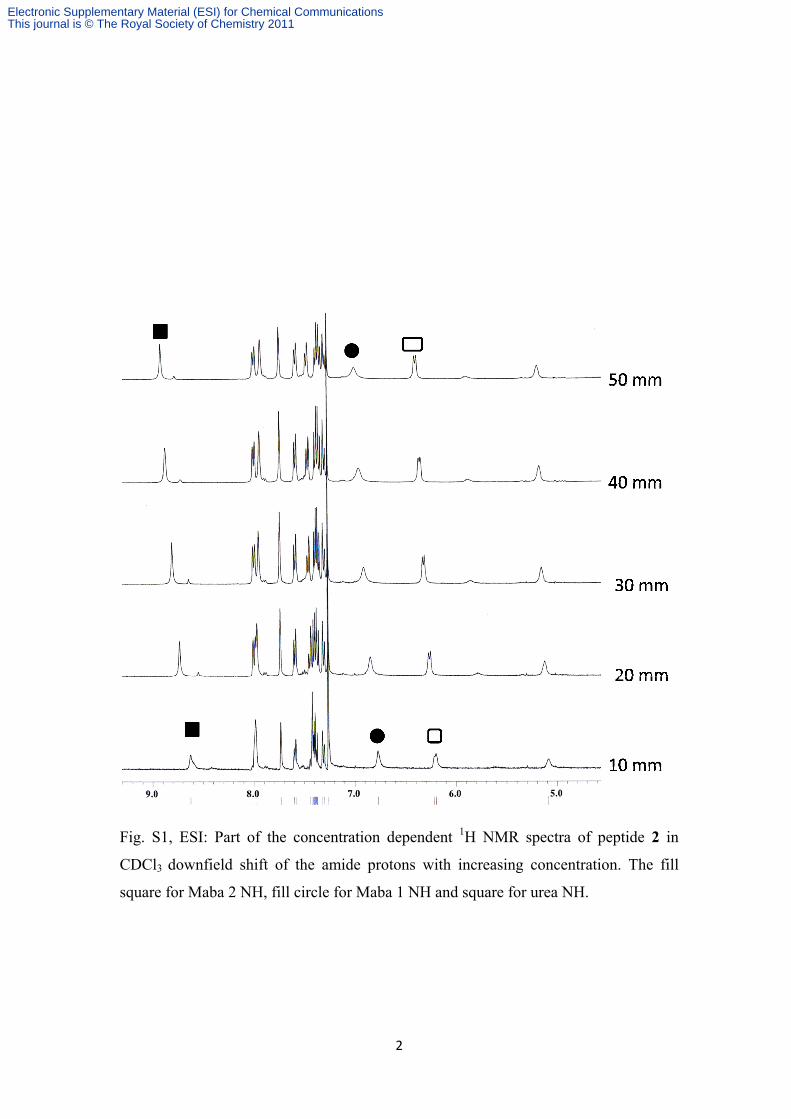
2
Fig. S1, ESI: Part of the concentration dependent 1H NMR spectra of peptide 2 in
CDCl3 downfield shift of the amide protons with increasing concentration. The fill
square for Maba 2 NH, fill circle for Maba 1 NH and square for urea NH.
Electronic Supplementary Material (ESI) for Chemical CommunicationsThis journal is © The Royal Society of Chemistry 2011
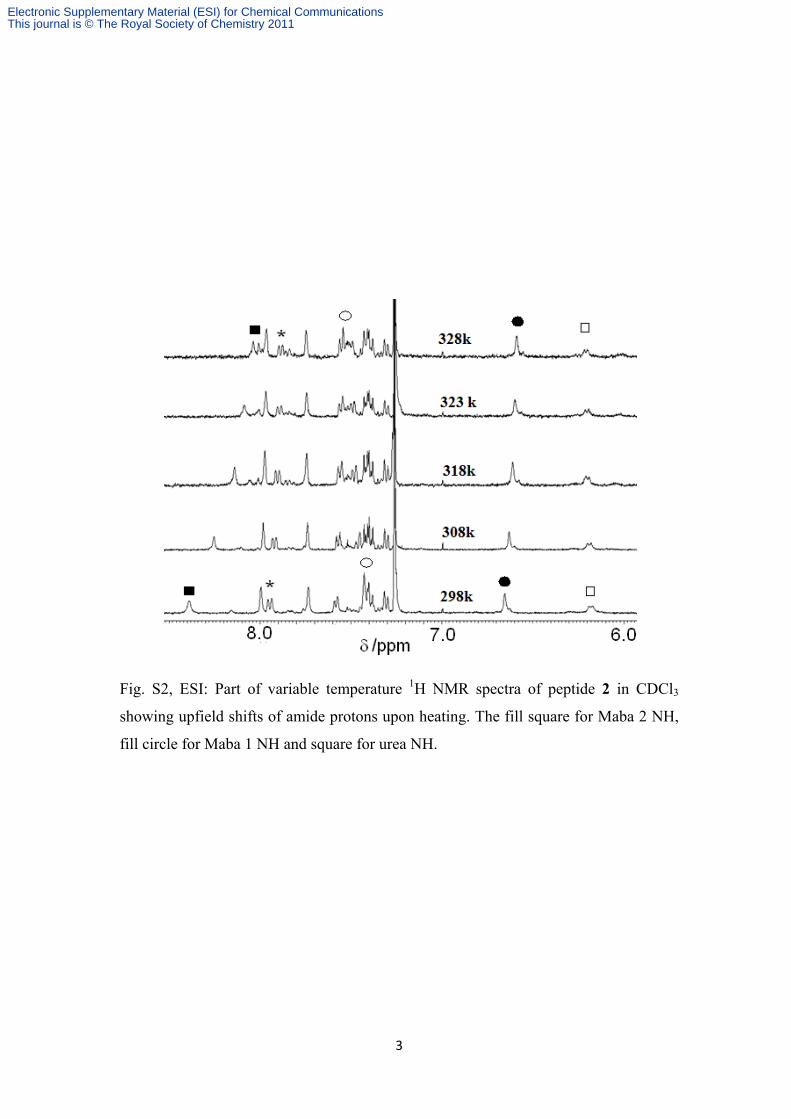
3
Fig. S2, ESI: Part of variable temperature 1H NMR spectra of peptide 2 in CDCl3
showing upfield shifts of amide protons upon heating. The fill square for Maba 2 NH,
fill circle for Maba 1 NH and square for urea NH.
Electronic Supplementary Material (ESI) for Chemical CommunicationsThis journal is © The Royal Society of Chemistry 2011
4
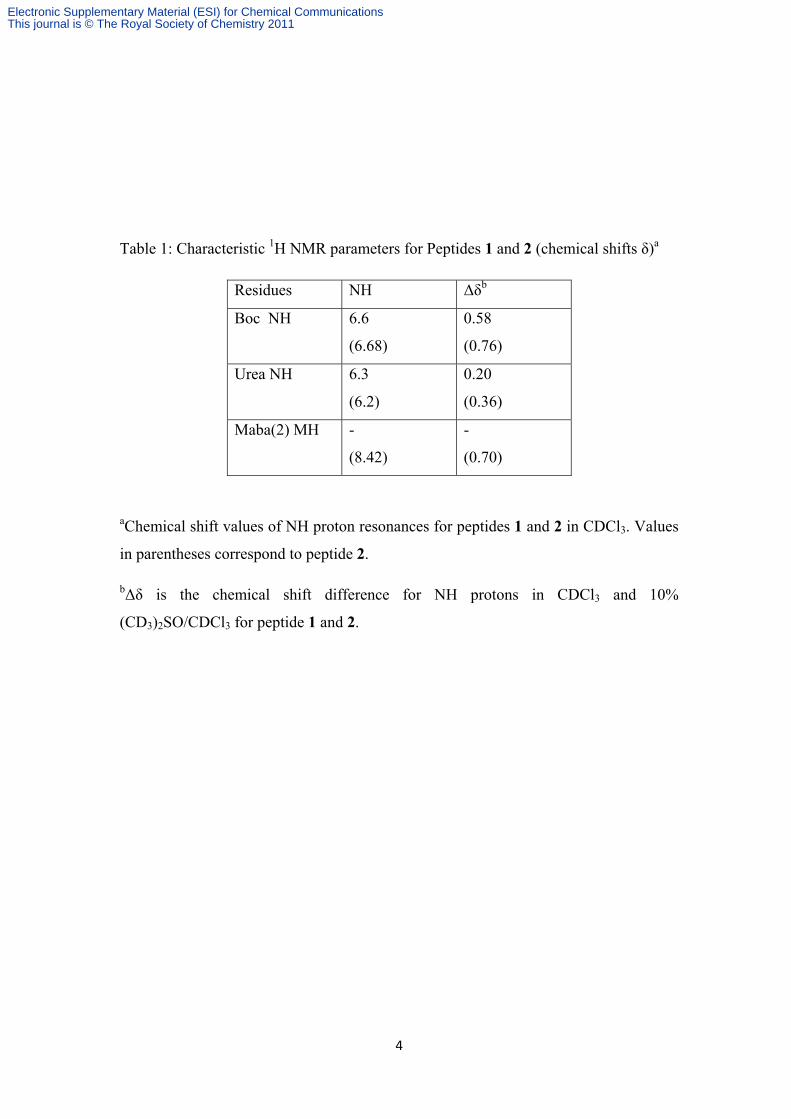
Table 1: Characteristic 1H NMR parameters for Peptides 1 and 2 (chemical shifts δ)a
Residues NH Δδb
Boc NH 6.6
(6.68)
0.58
(0.76)
Urea NH 6.3
(6.2)
0.20
(0.36)
Maba(2) MH -
(8.42)
-
(0.70)
aChemical shift values of NH proton resonances for peptides 1 and 2 in CDCl3. Values
in parentheses correspond to peptide 2.
bΔδ is the chemical shift difference for NH protons in CDCl3 and 10%
(CD3)2SO/CDCl3 for peptide 1 and 2.
Electronic Supplementary Material (ESI) for Chemical CommunicationsThis journal is © The Royal Society of Chemistry 2011
5
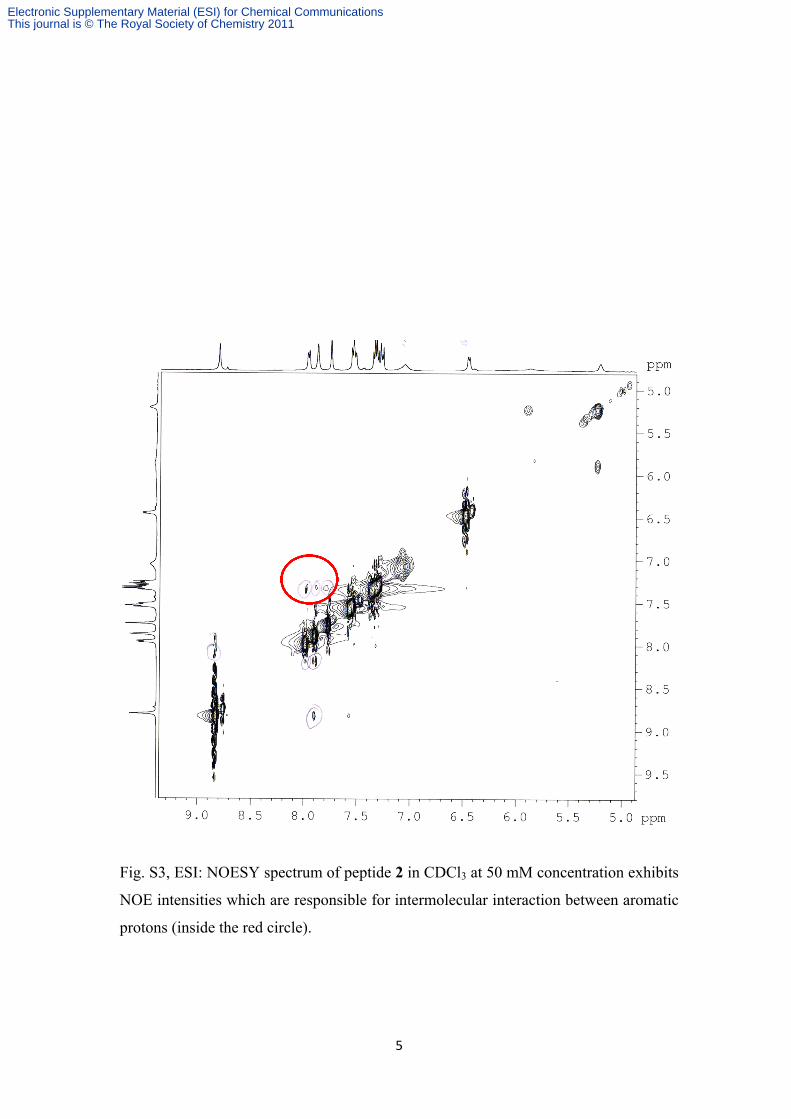
Fig. S3, ESI: NOESY spectrum of peptide 2 in CDCl3 at 50 mM concentration exhibits
NOE intensities which are responsible for intermolecular interaction between aromatic
protons (inside the red circle).
Electronic Supplementary Material (ESI) for Chemical CommunicationsThis journal is © The Royal Society of Chemistry 2011
6
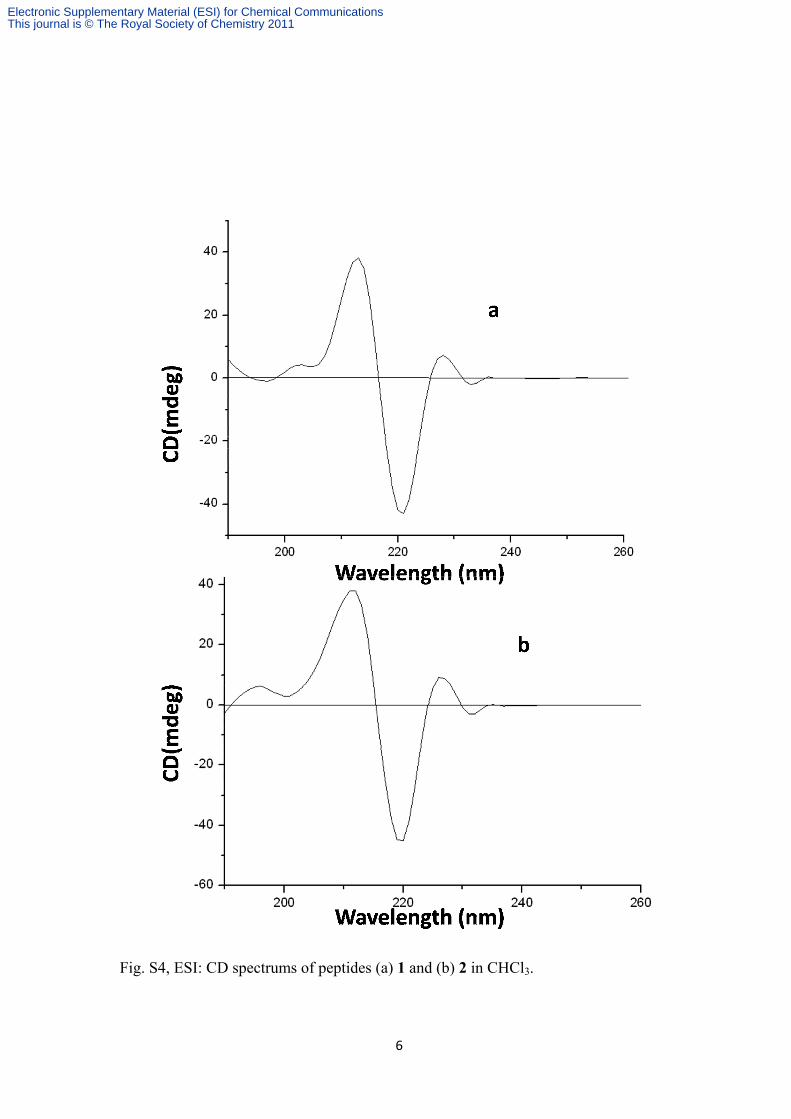
Fig. S4, ESI: CD spectrums of peptides (a) 1 and (b) 2 in CHCl3.
Electronic Supplementary Material (ESI) for Chemical CommunicationsThis journal is © The Royal Society of Chemistry 2011
7
a
b
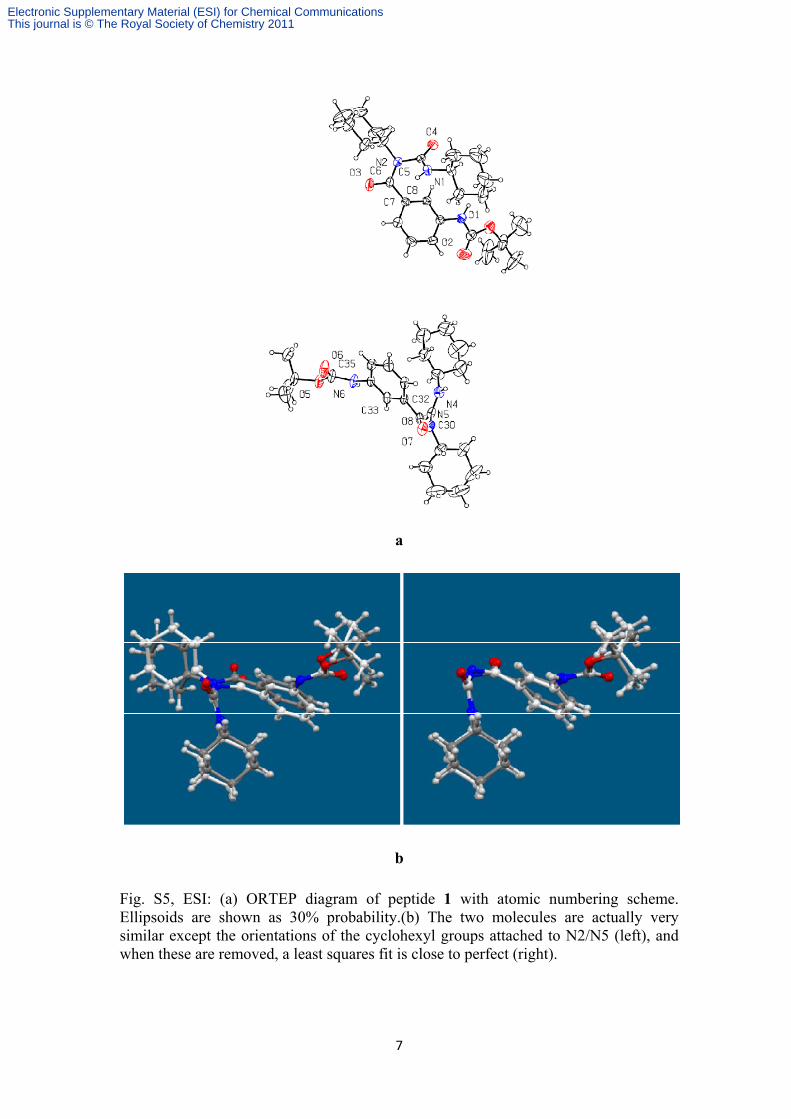
Fig. S5, ESI: (a) ORTEP diagram of peptide 1 with atomic numbering scheme. Ellipsoids are shown as 30% probability.(b) The two molecules are actually very similar except the orientations of the cyclohexyl groups attached to N2/N5 (left), and when these are removed, a least squares fit is close to perfect (right).
Electronic Supplementary Material (ESI) for Chemical CommunicationsThis journal is © The Royal Society of Chemistry 2011
8
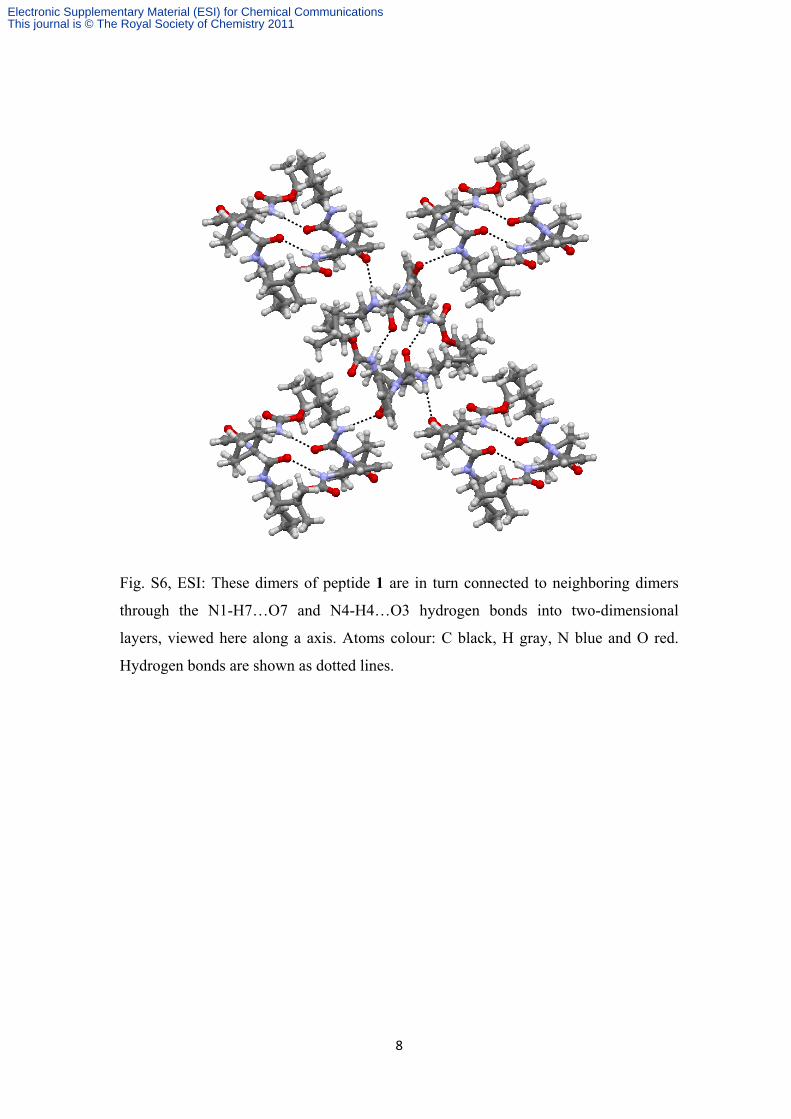
Fig. S6, ESI: These dimers of peptide 1 are in turn connected to neighboring dimers
through the N1-H7…O7 and N4-H4…O3 hydrogen bonds into two-dimensional
layers, viewed here along a axis. Atoms colour: C black, H gray, N blue and O red.
Hydrogen bonds are shown as dotted lines.
Electronic Supplementary Material (ESI) for Chemical CommunicationsThis journal is © The Royal Society of Chemistry 2011
9
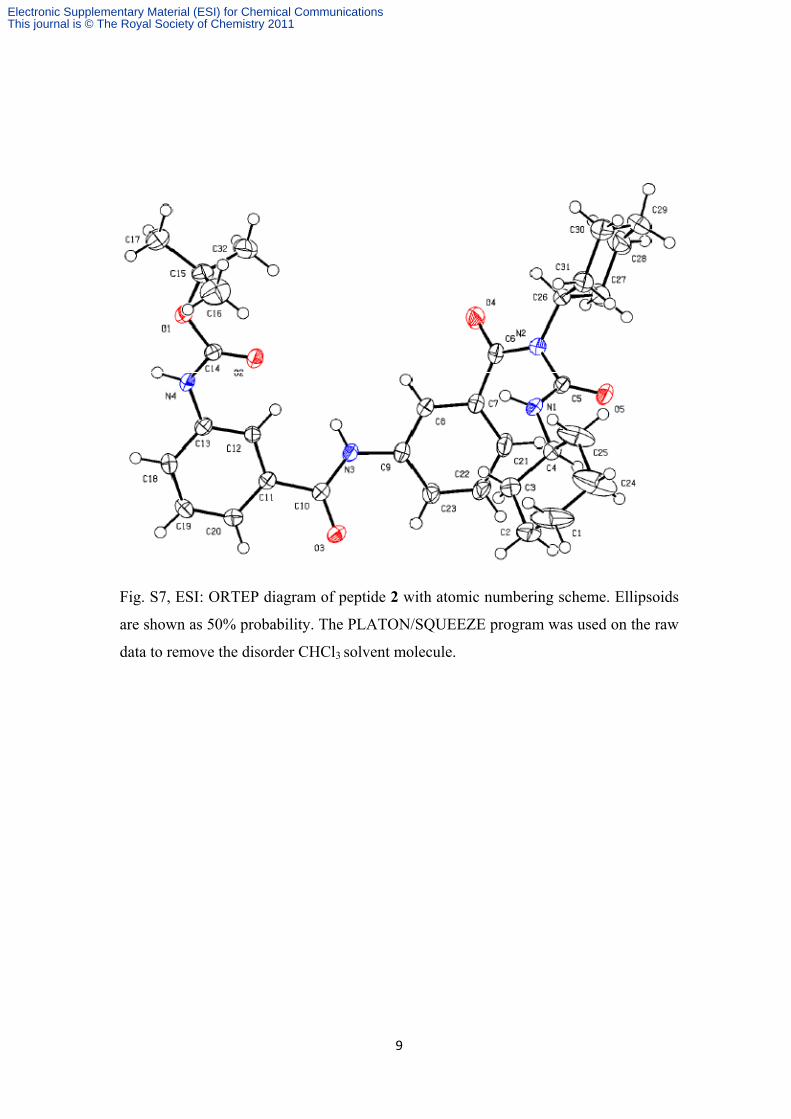
Fig. S7, ESI: ORTEP diagram of peptide 2 with atomic numbering scheme. Ellipsoids
are shown as 50% probability. The PLATON/SQUEEZE program was used on the raw
data to remove the disorder CHCl3 solvent molecule.
Electronic Supplementary Material (ESI) for Chemical CommunicationsThis journal is © The Royal Society of Chemistry 2011
10
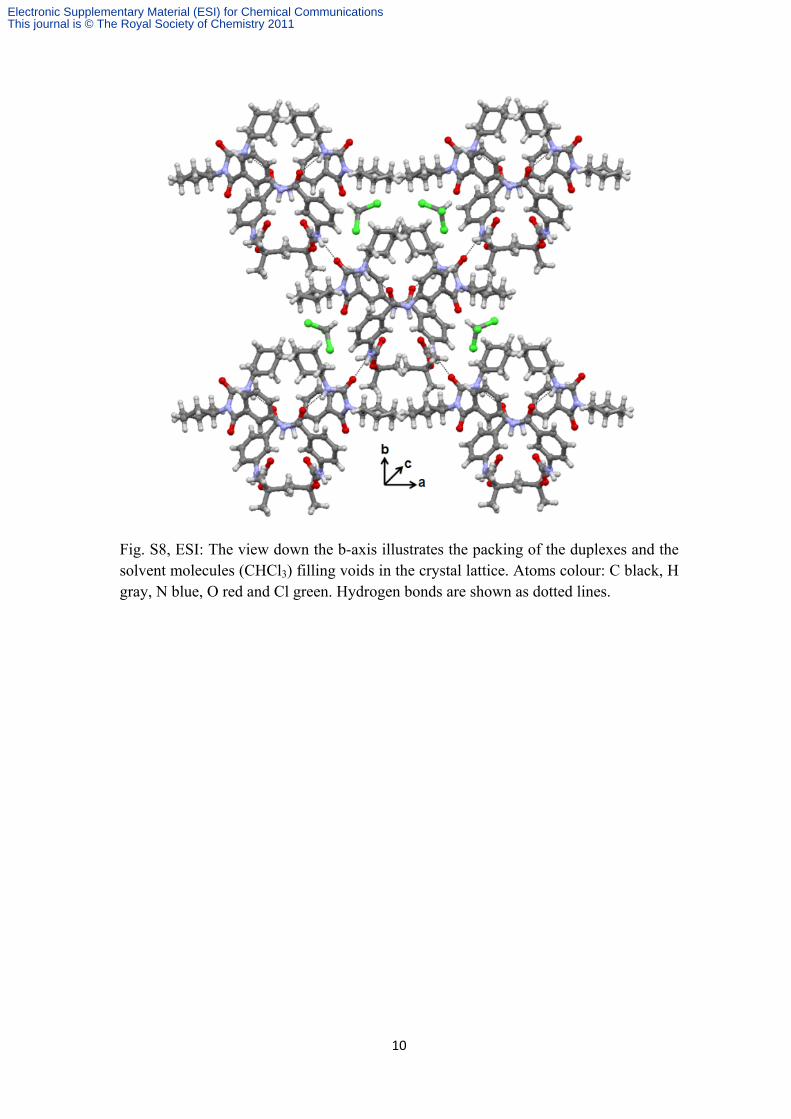
Fig. S8, ESI: The view down the b-axis illustrates the packing of the duplexes and the solvent molecules (CHCl3) filling voids in the crystal lattice. Atoms colour: C black, H gray, N blue, O red and Cl green. Hydrogen bonds are shown as dotted lines.
Electronic Supplementary Material (ESI) for Chemical CommunicationsThis journal is © The Royal Society of Chemistry 2011
11
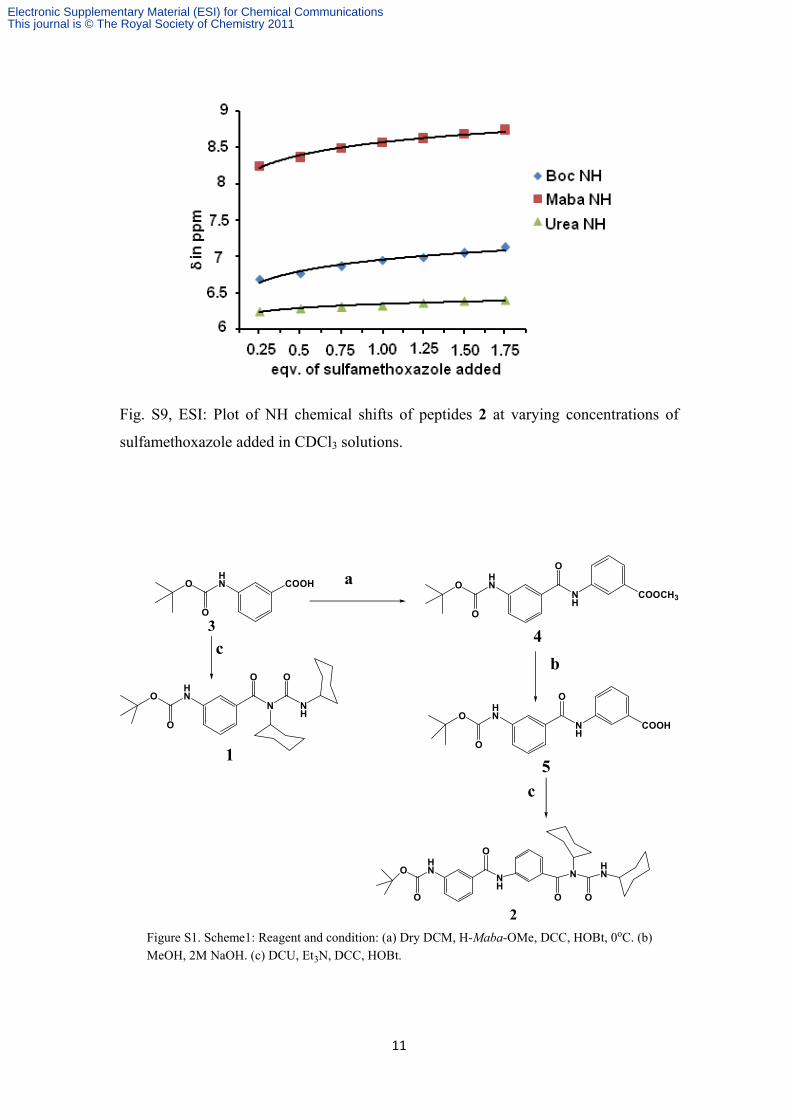
Fig. S9, ESI: Plot of NH chemical shifts of peptides 2 at varying concentrations of
sulfamethoxazole added in CDCl3 solutions.
COOHHNO
O3
HNO
O
NH
COOCH3
O
4
HNO
NH
COOH
O
O
5
HN
N NH
O
O
O O
1
OHN
NH
NHN
OO
O
O
2
a
b
c
c
Figure S1. Scheme1: Reagent and condition: (a) Dry DCM, H-Maba-OMe, DCC, HOBt, 0oC. (b) MeOH, 2M NaOH. (c) DCU, Et3N, DCC, HOBt.
Electronic Supplementary Material (ESI) for Chemical CommunicationsThis journal is © The Royal Society of Chemistry 2011
12
Experimental Section
General Methods and Materials. Meta-aminobenzoic acid was purchased from
Spectochem. HOBt (1-hydroxybenzotriazole) and DCC (dicyclohexylcarbodiimide)
were purchased from SRL.
Peptide Synthesis. The peptides were synthesized by conventional solution-phase
methods using fragment condensation strategy. The Boc group was used for N-
terminal protection and the C-terminus was protected as a methyl ester. Couplings
were mediated by dicyclohexylcarbodiimide/1- hydroxybenzotriazole (DCC/HOBt).
Methyl ester deprotection was performed via the saponification method. All the
intermediates were characterized by 500 MHz or 400 MHz 1H NMR and mass
spectrometry. The final compounds were fully characterized by 500 MHz or 400 MHz 1H NMR spectroscopy, 13C NMR spectroscopy, mass spectrometry, and IR
spectroscopy. The peptide 1, 2 were characterized by X-ray crystallography. The
products were purified by column chromatography using silica (100-200-mesh size)
gel as stationary phase and n-hexane –ethyl acetate mixture as eluent.
(a) Boc-Maba(1)-OH (3). A solution of m-aminobenzoic acid (4.1 g, 30 mmol) in a
mixture of dioxane (60 mL), water (30 mL) and 1M NaOH (30 mL) was stirred and
cooled in an ice-water bath. Di-tert-butylpyrocarbonate (7.0 g, 32 mmol) was added
and stirring was continued at room temperature for 6 h. Then the solution was
concentrated in vacuum to about 20-30 mL, cooled in an ice-water bath, covered with a
layer of ethyl acetate (about 50 mL) and acidified with a dilute solution of KHSO4 to
pH 2-3 (Congo red). The aqueous phase was extracted with ethyl acetate and this
operation was done repeatedly. The ethyl acetate extracts were pooled, washed with
water and drier over anhydrous Na2SO4 and evaporated in a vacuum. The pure material
was obtained as a white solid.
Yield: 5.42g (22.8 mmol, 76 %).
Melting point: 177oC.
1H NMR (DMSO-d6, 400 MHz, δ in ppm): 12.87 [1H, s, COOH], 9.54 [1H, s, aromatic
proton], 8.14 [1H, s, NH Maba(1)], 7.61-7.60 [1H, d, J = 7.32 Hz aromatic proton],
Electronic Supplementary Material (ESI) for Chemical CommunicationsThis journal is © The Royal Society of Chemistry 2011
13
7.54-7.52 [1H, d, J = 7.32 Hz aromatic proton], 7.38-7.34 [1H, m, aromatic proton],
1.48 [9H, s, Boc protons]; 13C NMR (DMSO-d6, 125 MHz, δ in ppm): 167.25, 152.73,
139.76, 131.76, 128.77, 122.87, 122.23, 118.74, 79.28, 28.05; FTIR ( in cm-1, KBr):
3353, 2972, 2653, 1694, 1594, 1560, 1478, 1452, 1417, 1292, 1243, 1159, 1058.
Anal. Calcd for C12H15NO4 (237.10): C, 60.75; H, 6.37; N, 5.90.
Found: C, 60.80; H, 6.35; N, 5.92.
(b) Boc-Maba(1)-Maba(2)-OMe (4): 5.2 g (22.0 mmol) of Boc-Maba-OH was
dissolved in 25 mL dry DCM in an ice-water bath. H-Maba-OMe was isolated from
9.3 g (50 mmol) of the corresponding methyl ester hydrochloride by neutralization,
subsequent extraction with ethyl acetate and ethyl acetate extract was concentrated to
10 mL. It was then added to the reaction mixture, followed immediately by 5.0 g (24
mmol) dicyclohexylcarbodiimide (DCC) and 3.2 g (24 mmol) of HOBt. The reaction
mixture was allowed to come to room temperature and stirred for 48 h. DCM was
evaporated and the residue was dissolved in ethyl acetate (60 mL) and
dicyclohexylurea (DCU) was filtered off. The organic layer was washed with 2M HCl
(3 × 50 mL), brine (2 × 50 mL), 1M sodium carbonate (3 × 50 mL) and brine (2 × 50
mL) and dried over anhydrous sodium sulfate; and evaporated in a vacuum to yield
compound 2 as a white solid. The product was purified by silica gel (100-200 mesh)
using n hexane – ethyl acetate (5:1) as eluent.
Yield: 5.55 g (14.36 mmol, 64%).
Melting point: 140o-141°C.
1H NMR (CDCl3, 500 MHz, δ in ppm): 8.17 [1H, s, aromatic proton], 8.14 [1H, s,
aromatic proton], 8.06-8.03 [1H, d, J = 8.31 Hz aromatic proton], 7.97 [1H, s, NH
Maba(1)], 7.83-7.81 [1H, d, J = 7.50 Hz aromatic proton], 7.57-7.55 [1H, d, J = 8.50
Hz aromatic proton], 7.49-7.41 [3H, m, aromatic proton], 6.68 [1H, s, NH Maba(2)],
3.93 [3H, s, OCH3] 1.53 [9H, s, Boc protons]; 13C NMR (CDCl3, 125 MHz, δ in ppm):
166.76, 165.76, 152.75, 138.95, 138.19, 135.38, 130.77, 129.38, 129.09, 125.49,
124.91, 121.82, 121.65, 121.32, 117.03, 80.97, 28.27; FTIR ( in cm-1, KBr):
3297,2929, 1725, 1697, 1661, 1611, 1592, 1489, 1443, 1367, 1321, 1288, 1263, 1216,
1160, 1100, 1066.
Electronic Supplementary Material (ESI) for Chemical CommunicationsThis journal is © The Royal Society of Chemistry 2011
14
Anal. Calcd for C20H22N2O5 (370.15): C, 64.85; H, 5.99; N, 7.56.
Found: C, 64.82; H, 6.00; N, 7.60.
TOF MS m/z 393.01 [M + Na]+; Mcalcd: 370.15.
(c) Boc-Maba(1)-Maba(2)-OH (5): To 3.7g (10.00 mmol) of compound 2, 25 mL
MeOH and 2M 15 mL NaOH were added and the progress of saponification was
monitored by thin layer chromatography (TLC). The reaction mixture was stirred.
After 10 h, methanol was removed under vacuum; the residue was dissolve in 50 mL
of water, and washed with diethyl ether (2 × 50 mL). Then the pH of the aqueous layer
was adjusted to 2 using 1M HCl and it was extracted with ethyl acetate (3 × 50 mL).
The extracts were pooled, dried over anhydrous sodium sulfate, and evaporated under
vacuum to obtained compound 5 as a white solid.
Yield: 3.1 g (8.6 mmol, 87%).
Melting point: 200o-202°C.
1H NMR (DMSO-d6, 400 MHz, δ in ppm): 12.98 [1H, br, COOH ], 10.41 [1H, s, NH
maba(1)], 9.57 [1H, s, NH Maba(2)], 8.42 [1H, s, aromatic proton], 8.06-8.01 (2H, m,
aromatic protons], 7.67 [1H, d, aromatic proton], 7.58 [1H, d, aromatic proton], 7.55
[1H, d, aromatic proton], 7.49-7.41 [2H, m, aromatic protons], 1.49 [9H, s, Boc
protons]; 13C NMR (DMSO-d6, 125 MHz, δ in ppm): 167.21, 165.92, 152.81, 139.77,
139.44 135.50, 131.21, 121.86, 128.64, 124.41, 124.36, 121.29, 121.07, 117.65, 79.30,
28.11. FTIR (cm-1, in KBr): 3354, 2977, 2361, 1702, 1649, 1590, 1542, 1489, 1409,
1304, 1243, 1172, 1065.
Anal. Calcd for C19H20N2O5 (356.14): C, 64.04; H, 5.66; N, 7.86.
Found: C, 64.00; H, 5.68; N, 7.87.
(d) Boc-Maba(1)-DCU (1): 1.06 g (4.5 mmol) compound Boc-Maba-OH was
dissolved in 15 mL dry DCM on an ice-water bath. 0.9 g (4.5 mmol) DCC was added
to the solution. 0.62 mL (4.5 mmol) of triethyl amine was added to 1.0 g (4.5 mmol)
Electronic Supplementary Material (ESI) for Chemical CommunicationsThis journal is © The Royal Society of Chemistry 2011
15
dicyclohexylurea in 15 mL dry DCM. This solution was added to the previous solution.
The reaction mixture was allowed to come to room temperature and stirred for 48 h.
DCM was evaporeted under vacuum and ethyl acetate was added to the solid mass.
Dicyclohexylurea (DCU) was filtered off. The organic layer was washed with 2 M
HCL (3 × 50 mL), brine (2 × 50 mL), then 1 M sodium carbonate (3 × 30 mL) and
brine (2 × 30 mL) and dried over anhydrous sodium sulfate and evaporated under
vacuum to yield the desired compound as a white solid. Purification was done by silica
gel column (100-200 mesh size) and ethyl acetate and hexane (1:3) as eluent.
Yield: 1.7 g (3.9 mmol, 89%).
Melting point: 185o-186oC
1H NMR (CDCl3, 400 MHz, δ in ppm): 7.50 [2H, d, aromatic protons], 7.30-7.16 [2H,
m, aromatic protons], 6.60 [1H, s, NH Maba(1)], 6.30 [1H, b, NH DCU], 4.06 [1H,
m,CαH cyh], 3.49 [1H, m, CαH cyh], 2.07-1.99 [2H, m, cyh ], 1.82-1.76 [4H, m, cyh],
1.60-1.51 [6H, m, cyh], 1.51 [9H, s, Boc protons], 1.3-1.12 [5H, m, cyh], 1.12-1.06
[1H, m, cyh], 0.95-0.87 [2H, m, cyh]; 13C NMR (CDCl3, 125 MHz, δ in ppm): 170.69,
154.12, 152.52, 138.83, 137.50, 129.13, 120.81, 120.32, 116.50, 80.73, 57.09, 49.62,
32.16, 30.64, 28.22, 26.12, 24.49; FTIR ( in cm-1, KBr): 3280, 3055, 2933, 2855, 2359,
2341, 1726, 1687, 1628, 1606, 1539, 1490, 1412, 1366, 1235, 1164, 1060.
Anal. Calcd for C25H37N3O4 (443.28): C, 67.69; H, 8.41; N, 9.47.
Found: C, 67.70; H, 8.45; N, 9.45.
TOF MS m/z 466.09 [M + Na]+; Mcalcd: 443.28.
(e) Boc-Maba(1)-Maba(2)-DCU (2): 0.46 g (1.29 mmol) compound Boc-Maba-Maba-
OH was dissolved in 15 mL dry DCM on an ice-water bath. 0.226 g (1.29 mmol) DCC
was added to the solution. 0.18 mL (1.29 mmol) of triethyl amine was added to 0.29 g
(1.29 mmol) dicyclohexylureain 15 mL dry DCM. This solution was added to the
previous solution. The reaction mixture was allowed to come to room temperature and
stirred for 48 h. DCM was evaporeted under vacuum and ethyl acetate was added to
the solid mass. Dicyclohexylurea (DCU) was filtered off. The organic layer was
washed with 2 M HCL (3 × 50 mL), brine (2 × 50 mL), then 1 M sodium carbonate (3
Electronic Supplementary Material (ESI) for Chemical CommunicationsThis journal is © The Royal Society of Chemistry 2011
16
× 30 mL) and brine (2 × 30 mL) and dried over anhydrous sodium sulfate and
evaporated under vacuum to yield the desired compound as a white solid. Purification
was done by silica gel column (100-200 mesh size) and ethyl acetate and hexane (1:3)
as eluent.
Yield: 0.6 g (1.06 mmol, 82%).
Melting point: 196o-197oC.
1H NMR (CDCl3, 500 MHz, δ in ppm): 8.42 [1H, s, NH Maba(2)], 7.98 [1H, s,
aromatic proton], 7.94-7.93 [1H, d, aromatic proton], 7.74 [1H, s, aromatic proton],
7.47-7.38 [3H, d, aromatic protons], 7.31-7.30 [1H, d, aromatic proton], 6.68 (1H, s,
NH Maba(1)], 6.20 (1H, b, NH DCU), 4.12-4.3 [1H, m,CαH cyh], 3.49 [1H, m, CαH
cyh], 2.01-1.99 [2H, m, cyh] , 1.85-1.77 [5H, m, cyh], 1.53 [9H, s, Boc protons], 1.33-
1.16 [8H, m, cyh], 0.91-0.87 [4H, m, cyh]; 13C NMR (CDCl3, 125 MHz, δ in ppm):
169.87, 165.84, 154.25, 152.87, 138.75, 138.56, 137.34, 135.47, 129.29, 129.00,
122.39, 122.31, 122.01, 121.88, 118.80, 117.18, 56.29, 49.90, 32.02, 31.87, 30.66,
29.64, 29.60, 29.30, 28.26, 26.05, 25.36, 25.22, 24.71, 24.59, 22.64, 14.06; FTIR ( in
cm-1, KBr): 3297, 2932, 2855, 2358, 2341, 1644, 1614, 1539, 1338, 1312, 1245, 1161,
1081, 1056.
Anal. Calcd for C32H42N4O5 (562.32): C, 68.30; H, 7.52; N, 9.96.
Found: C, 68.32; H, 7.54; N, 9.95.
TOF MS m/z 585.12 [M + Na]+; Mcalcd: 562.32.
Abbreviation we used:
Cyh= cyclohexane.
Maba = m-aminobenzoic acid
DCU = dicyclohexyl urea
NMR experiments
All NMR studies were carried out on a Brüker AVANCE 500 MHz spectrometer at
278 K. Compound concentrations were in the range 1–10 mmol in CDCl3 and
Electronic Supplementary Material (ESI) for Chemical CommunicationsThis journal is © The Royal Society of Chemistry 2011
17
(CD3)2SO.
FT-IR spectroscopy
All reported solid-state and fibrill FT-IR spectra were obtained with a Perkin
Elmer Spectrum RX1 spectrophotometer with the KBr disk technique.
Mass spectrometry
Mass spectra were recorded on a Q-Tof Micro YA263 high-resolution (Waters
Corporation) mass spectrometer by positive-mode electrospray ionization.
X-ray Crystallography
Single crystal X-ray analysis of peptide 1 and 2 was recorded on a Bruker high
resolution X-ray diffractometer instruments. Intensity data were collected with
MoKα radiation for peptide 1 at 296 K and MoKα radiation for peptide 2 at 100 K
using Bruker APEX-2 CCD diffractometer. Data were processed using the Bruker
SAINT package and the structure solution and refinement procedures were
performed using SHELX97. For peptide 1, the non-hydrogen atoms were refined
with anisotropic thermal parameters. For peptide 2, the non-hydrogen atoms were
refined with isotropic thermal parameters due to closely space Cl atoms in the
solvent molecule. The PLATON/SQUEEZE program was used on the raw data to
generate a new dataset that removed the scattering contribution of disorder solvent
molecule.The hydrogen atoms were included in geometric positions and given
thermal parameters. The data have been deposited at the Cambridge
Crystallographic Data Centre with reference number CCDC 832275 and 832274 for
peptides 1 and 2 respectively.
Electronic Supplementary Material (ESI) for Chemical CommunicationsThis journal is © The Royal Society of Chemistry 2011
18
COOHHNO
O
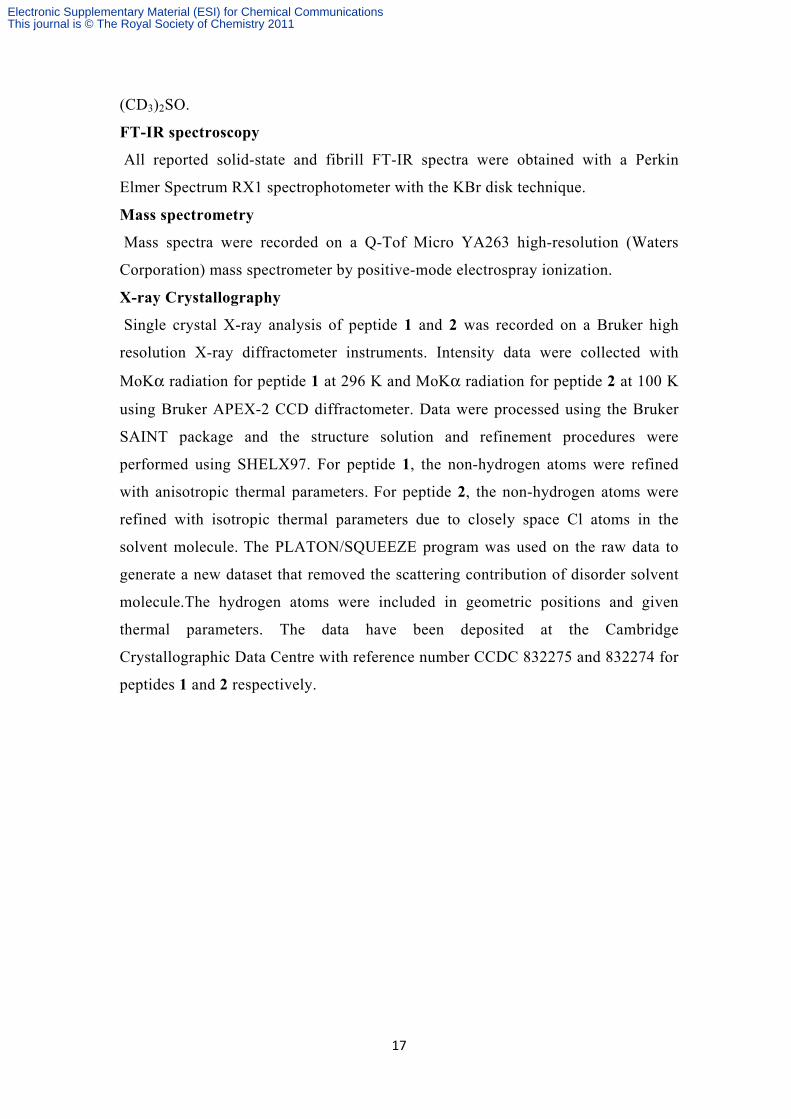
Figure S2: 1H NMR (400 MHz, DMSO-d6) spectra of Boc-Maba(1)-OH 3.
Electronic Supplementary Material (ESI) for Chemical CommunicationsThis journal is © The Royal Society of Chemistry 2011
19
COOHHNO
O
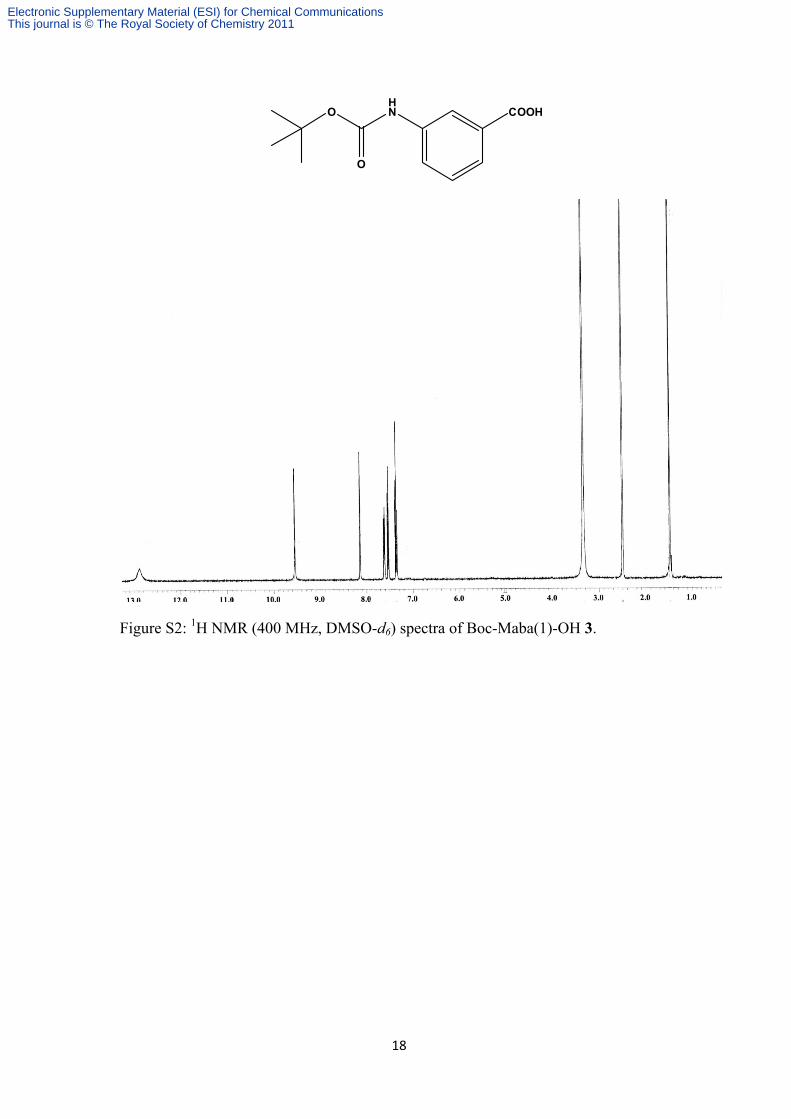
Figure S3: 13C NMR (125 MHz, DMSO-d6) spectra of Boc-Maba(1)-OH 3.
Electronic Supplementary Material (ESI) for Chemical CommunicationsThis journal is © The Royal Society of Chemistry 2011
20
HNO
O
NH
COOCH3
O
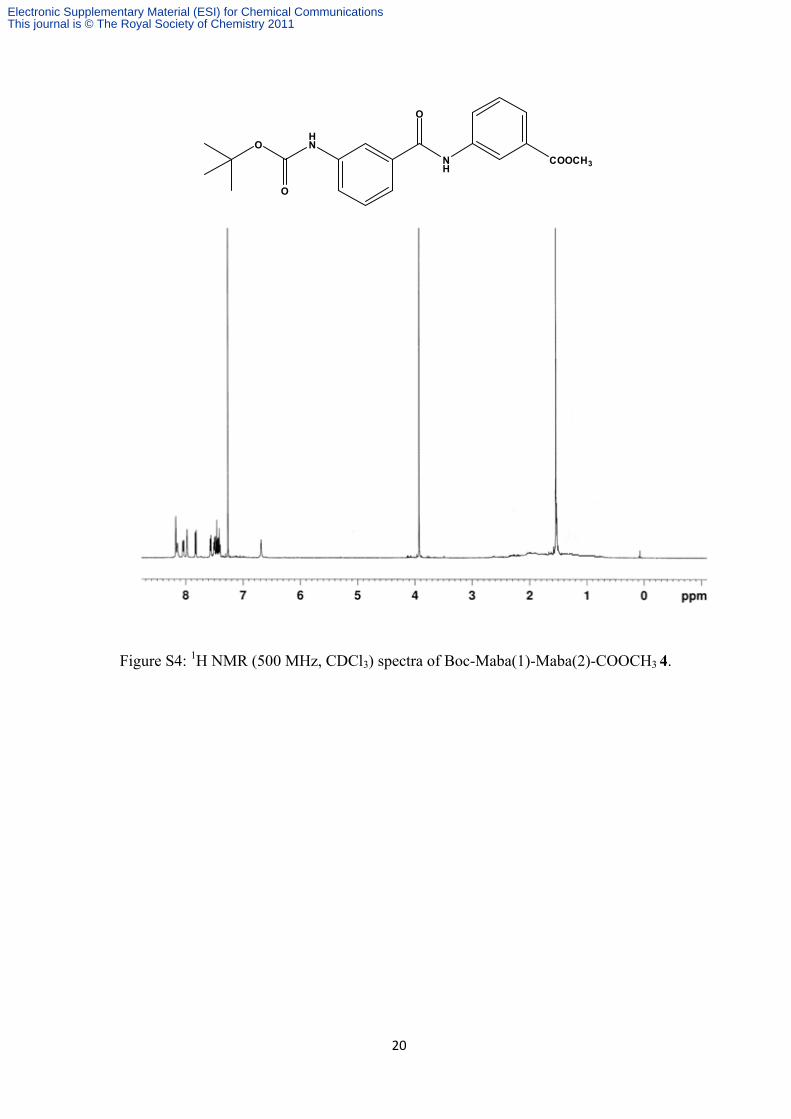
Figure S4: 1H NMR (500 MHz, CDCl3) spectra of Boc-Maba(1)-Maba(2)-COOCH3 4.
Electronic Supplementary Material (ESI) for Chemical CommunicationsThis journal is © The Royal Society of Chemistry 2011
21
HNO
O
NH
COOCH3
O
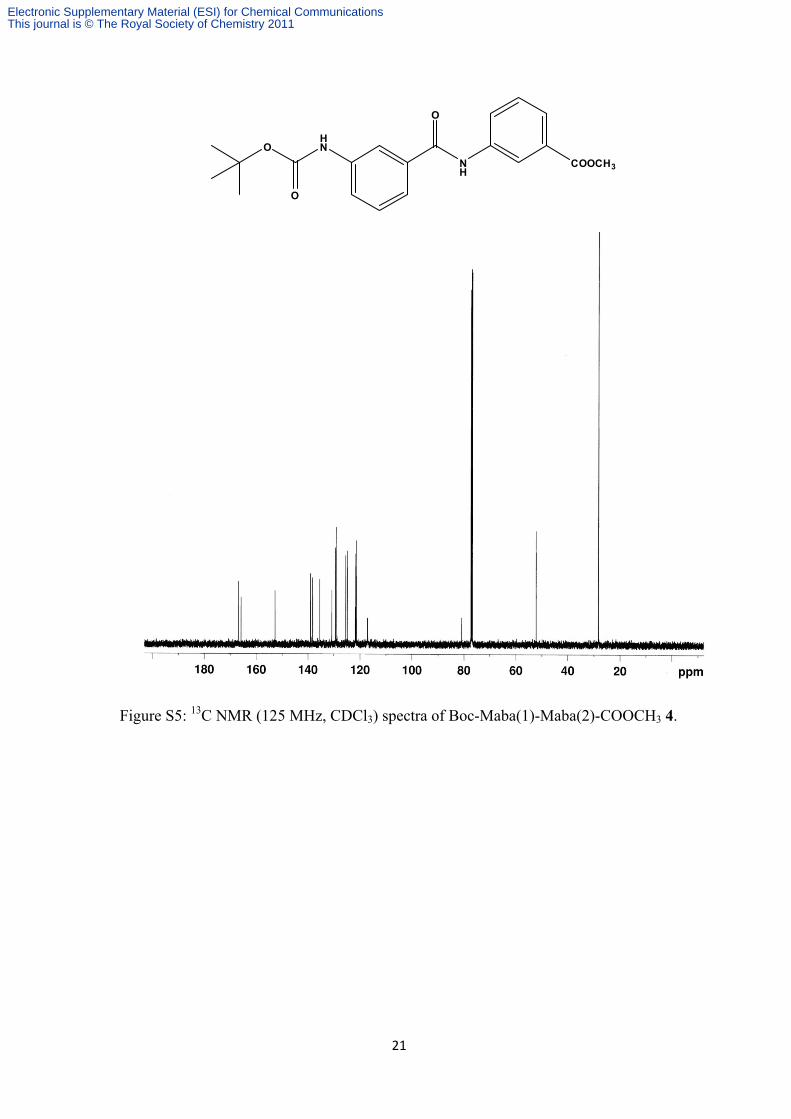
Figure S5: 13C NMR (125 MHz, CDCl3) spectra of Boc-Maba(1)-Maba(2)-COOCH3 4.
Electronic Supplementary Material (ESI) for Chemical CommunicationsThis journal is © The Royal Society of Chemistry 2011
22
HNO
NH
COOH
O
O
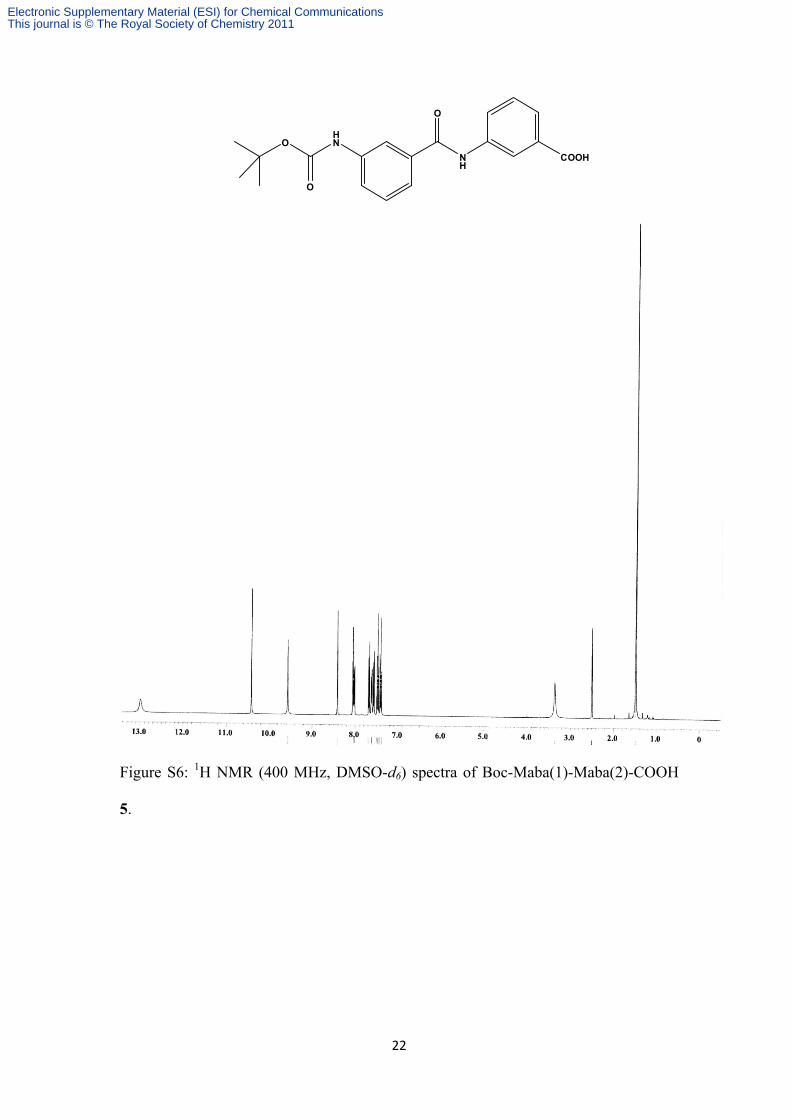
Figure S6: 1H NMR (400 MHz, DMSO-d6) spectra of Boc-Maba(1)-Maba(2)-COOH
5.
Electronic Supplementary Material (ESI) for Chemical CommunicationsThis journal is © The Royal Society of Chemistry 2011
23
HNO
NH
COOH
O
O
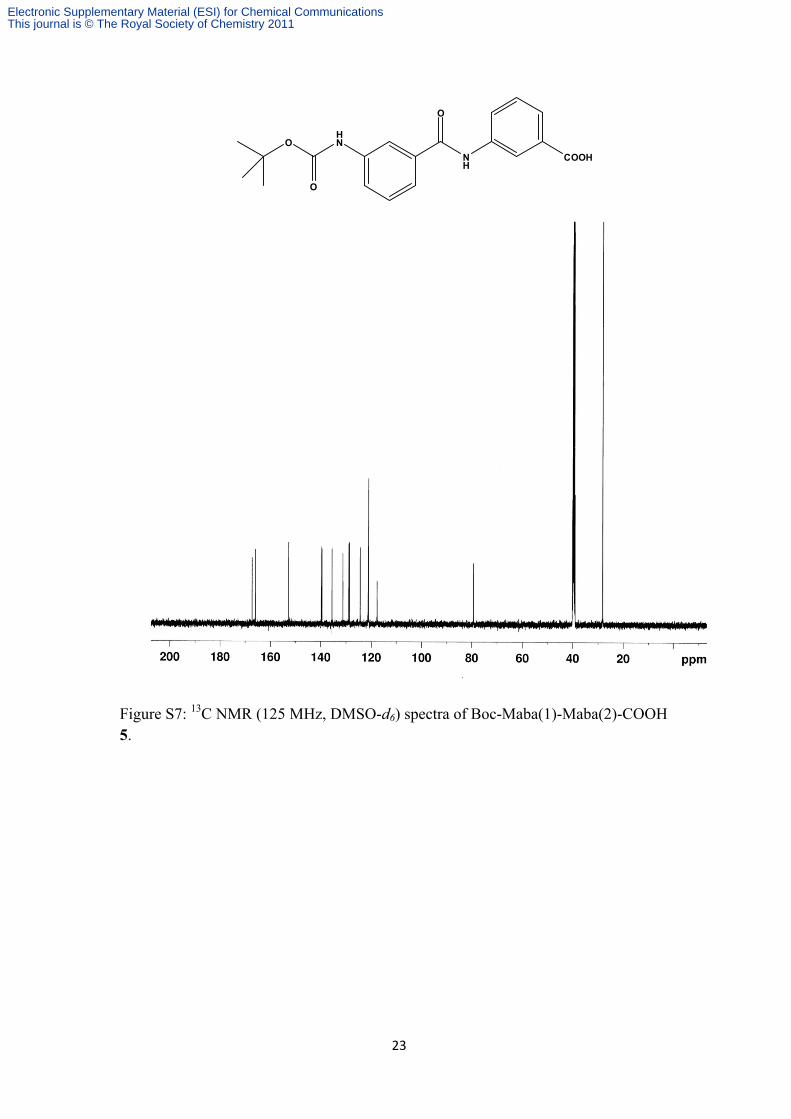
Figure S7: 13C NMR (125 MHz, DMSO-d6) spectra of Boc-Maba(1)-Maba(2)-COOH 5.
Electronic Supplementary Material (ESI) for Chemical CommunicationsThis journal is © The Royal Society of Chemistry 2011
24
HN
N NH
O
O
O O
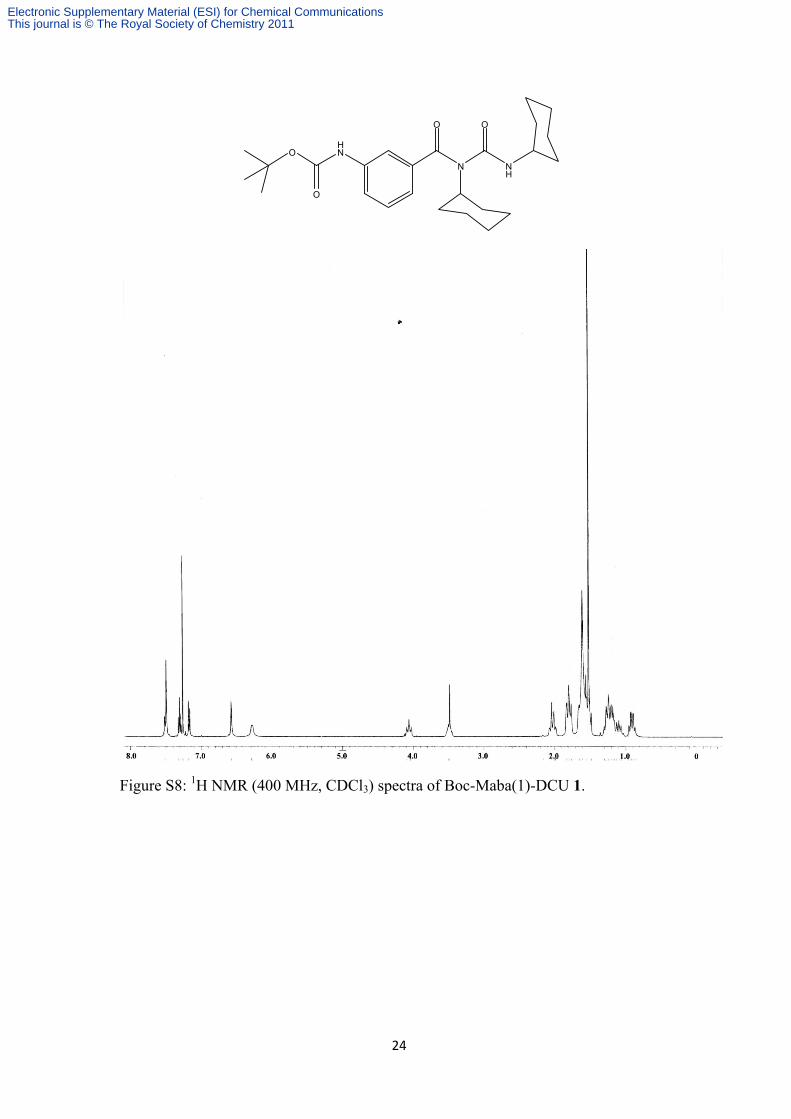
Figure S8: 1H NMR (400 MHz, CDCl3) spectra of Boc-Maba(1)-DCU 1.
Electronic Supplementary Material (ESI) for Chemical CommunicationsThis journal is © The Royal Society of Chemistry 2011
25
HN
N NH
O
O
O O
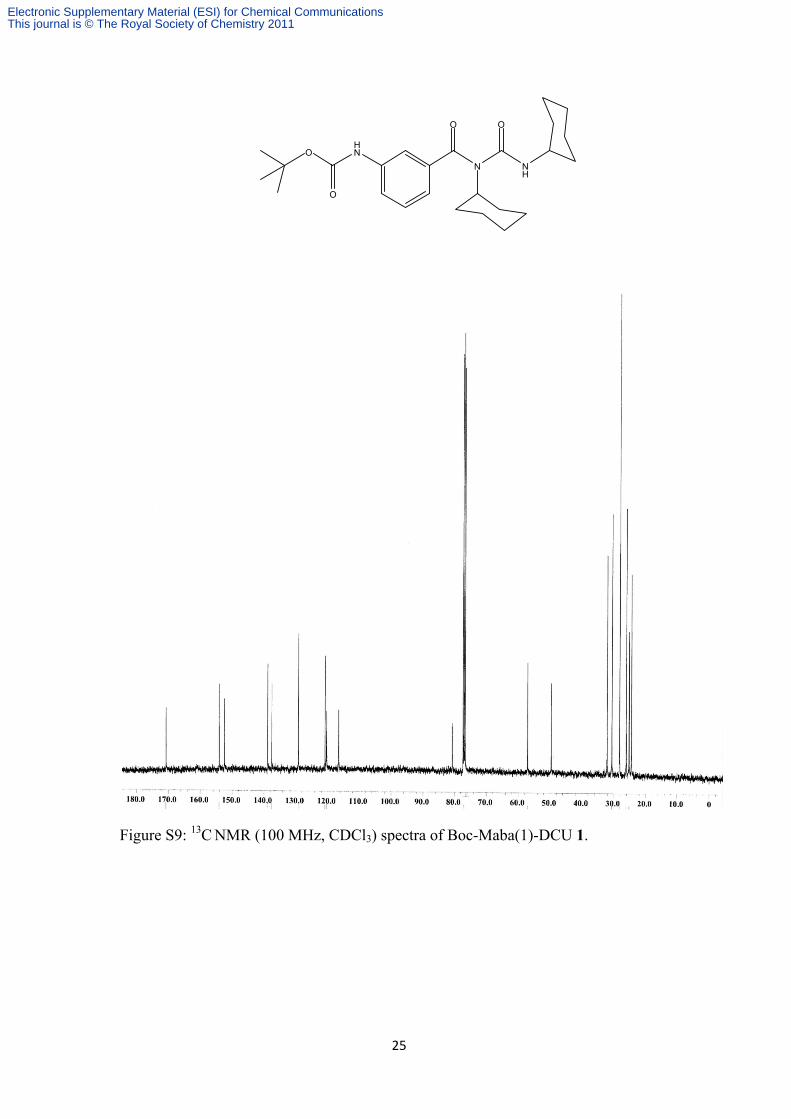
Figure S9: 13C NMR (100 MHz, CDCl3) spectra of Boc-Maba(1)-DCU 1.
Electronic Supplementary Material (ESI) for Chemical CommunicationsThis journal is © The Royal Society of Chemistry 2011
26
HNO
NH
NHN
O
O
O O
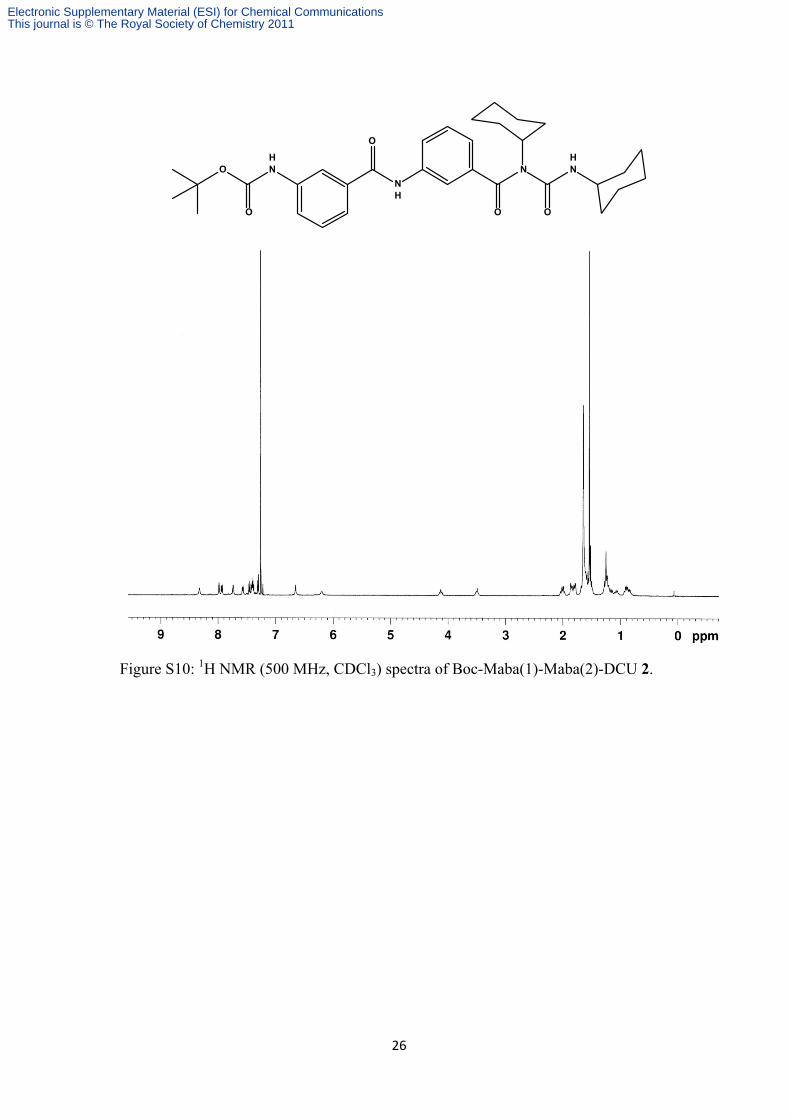
Figure S10: 1H NMR (500 MHz, CDCl3) spectra of Boc-Maba(1)-Maba(2)-DCU 2.
Electronic Supplementary Material (ESI) for Chemical CommunicationsThis journal is © The Royal Society of Chemistry 2011
27
HNO
NH
NHN
O
O
O O
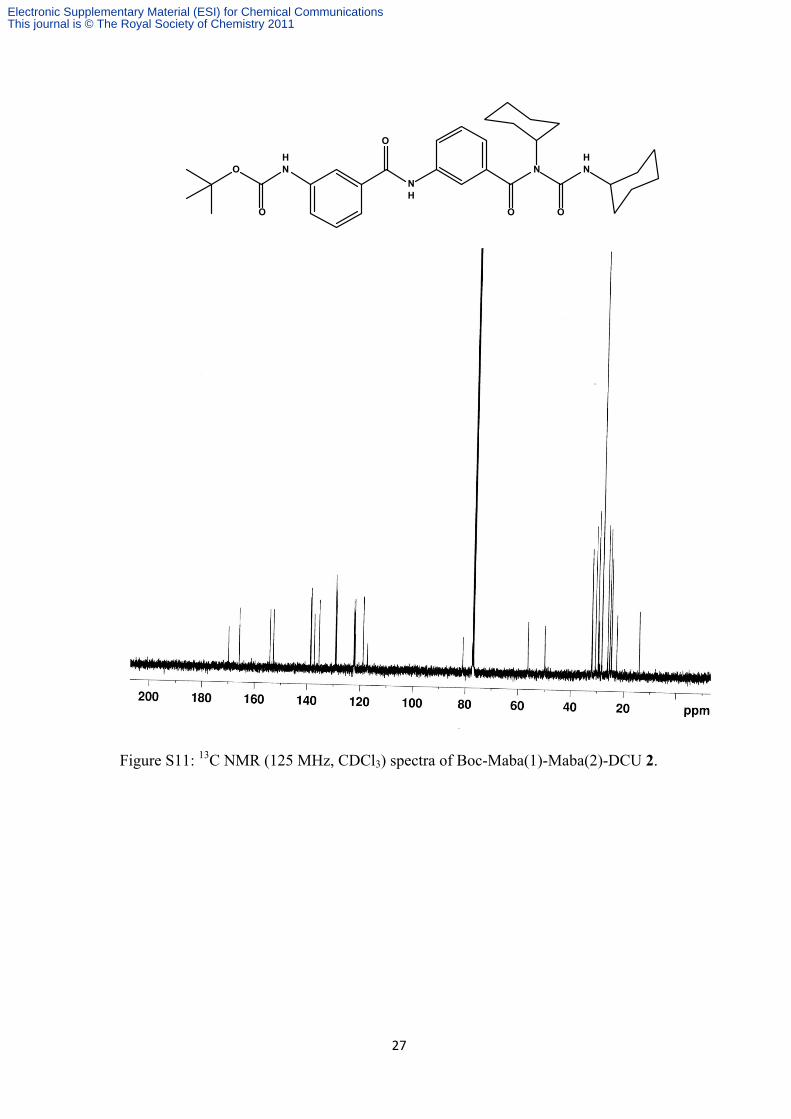
Figure S11: 13C NMR (125 MHz, CDCl3) spectra of Boc-Maba(1)-Maba(2)-DCU 2.
Electronic Supplementary Material (ESI) for Chemical CommunicationsThis journal is © The Royal Society of Chemistry 2011
28
COOHHNO
O
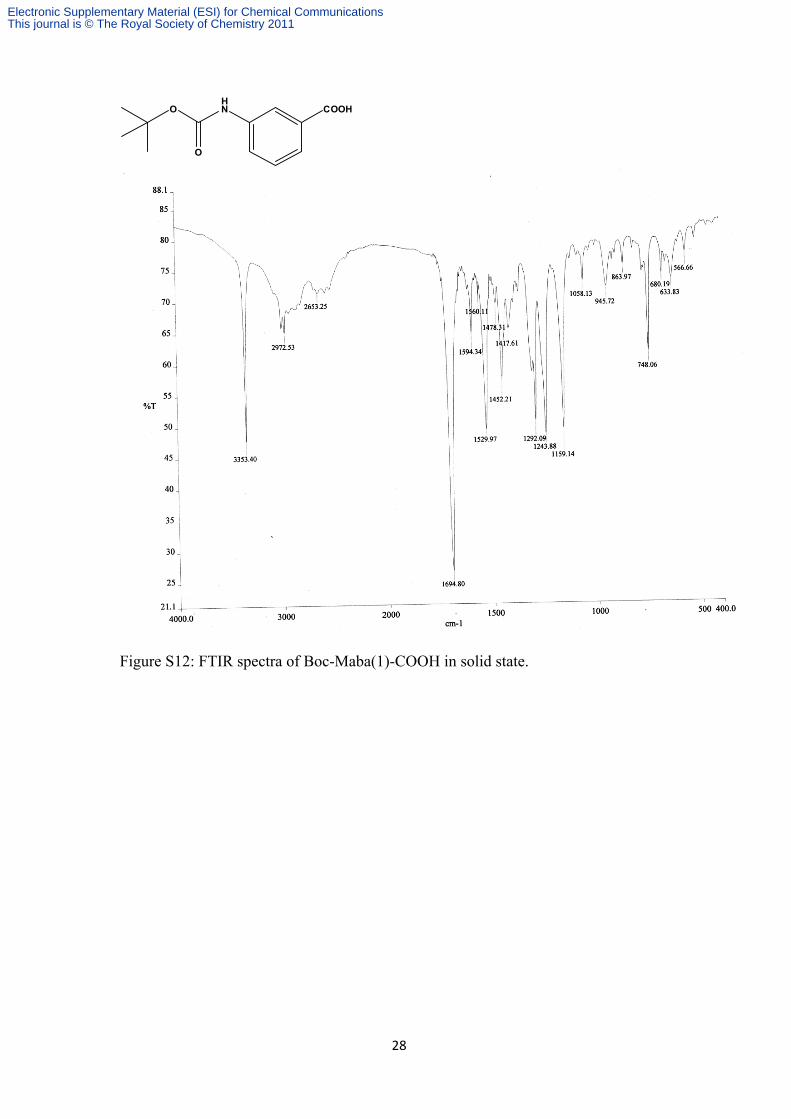
Figure S12: FTIR spectra of Boc-Maba(1)-COOH in solid state.
Electronic Supplementary Material (ESI) for Chemical CommunicationsThis journal is © The Royal Society of Chemistry 2011
29
HNO
O
NH
COOCH3
O
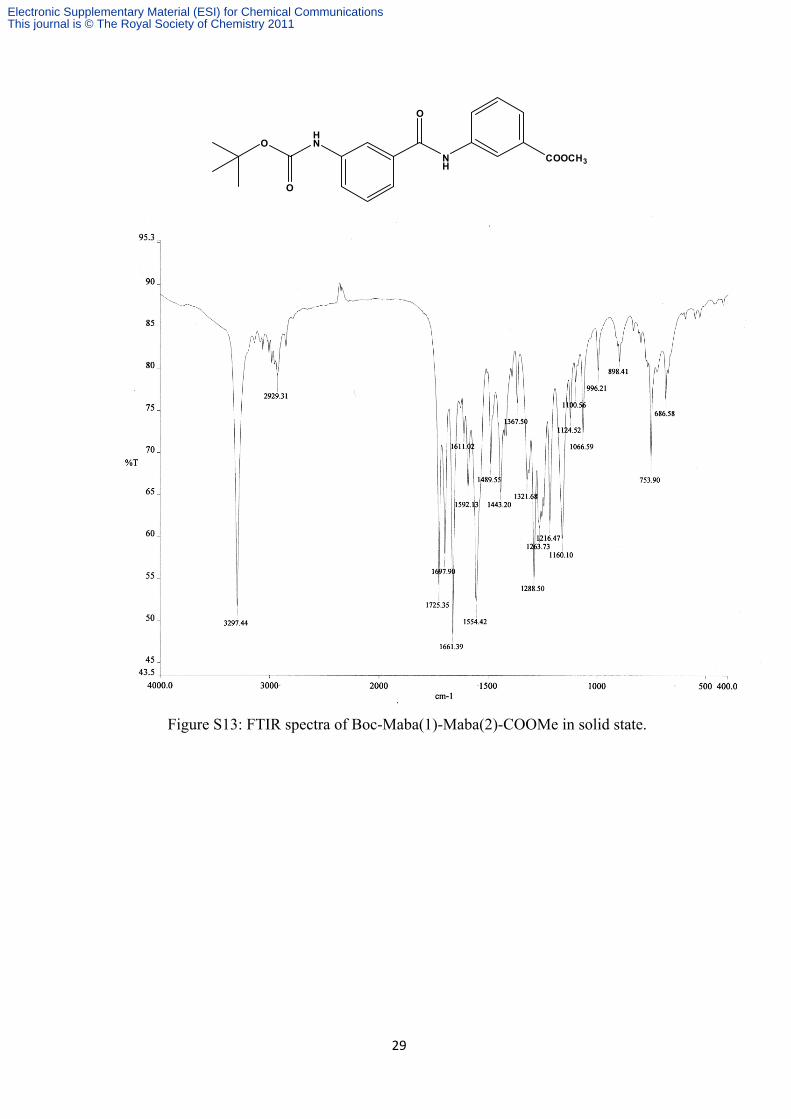
Figure S13: FTIR spectra of Boc-Maba(1)-Maba(2)-COOMe in solid state.
Electronic Supplementary Material (ESI) for Chemical CommunicationsThis journal is © The Royal Society of Chemistry 2011
30
.
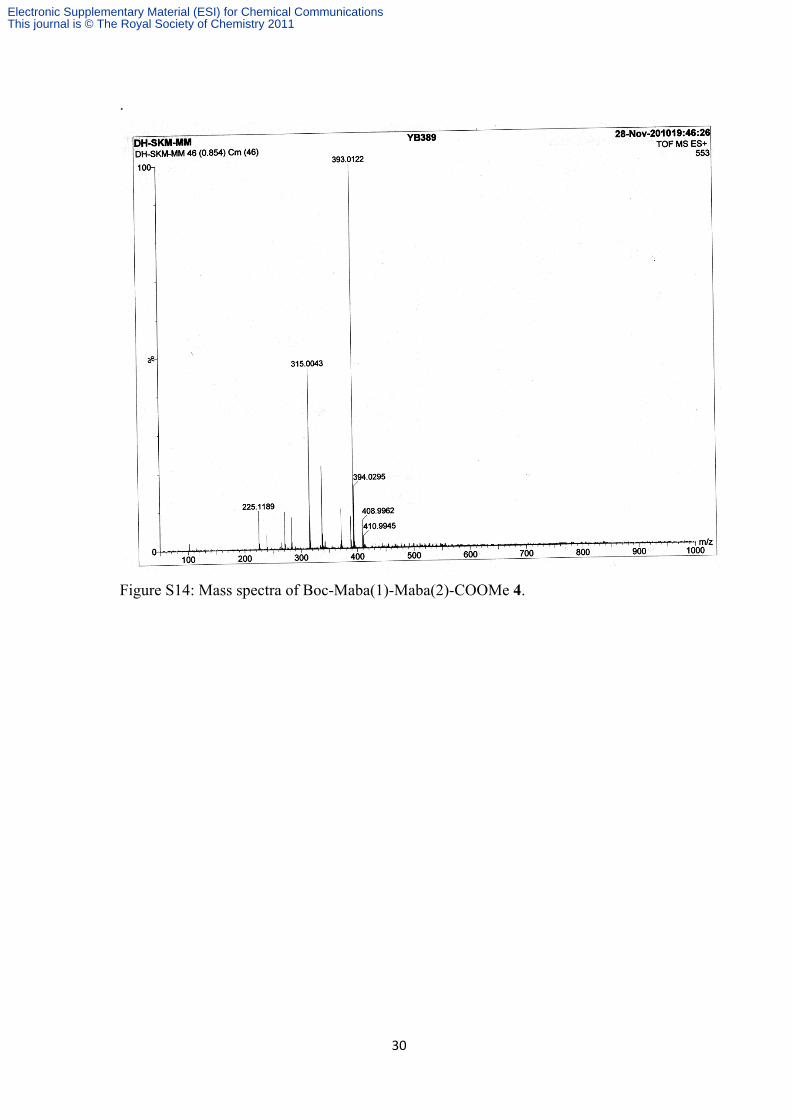
Figure S14: Mass spectra of Boc-Maba(1)-Maba(2)-COOMe 4.
Electronic Supplementary Material (ESI) for Chemical CommunicationsThis journal is © The Royal Society of Chemistry 2011
31
HNO
NH
COOH
O
O
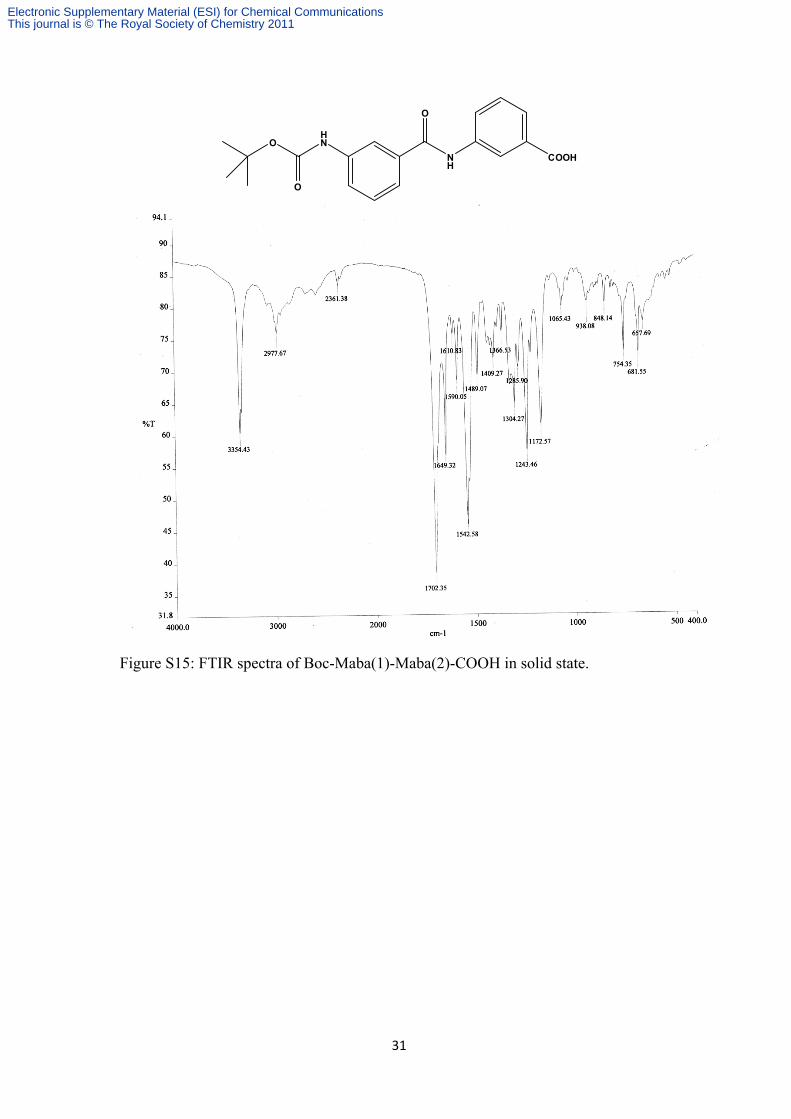
Figure S15: FTIR spectra of Boc-Maba(1)-Maba(2)-COOH in solid state.
Electronic Supplementary Material (ESI) for Chemical CommunicationsThis journal is © The Royal Society of Chemistry 2011
32
HN
N NH
O
O
O O
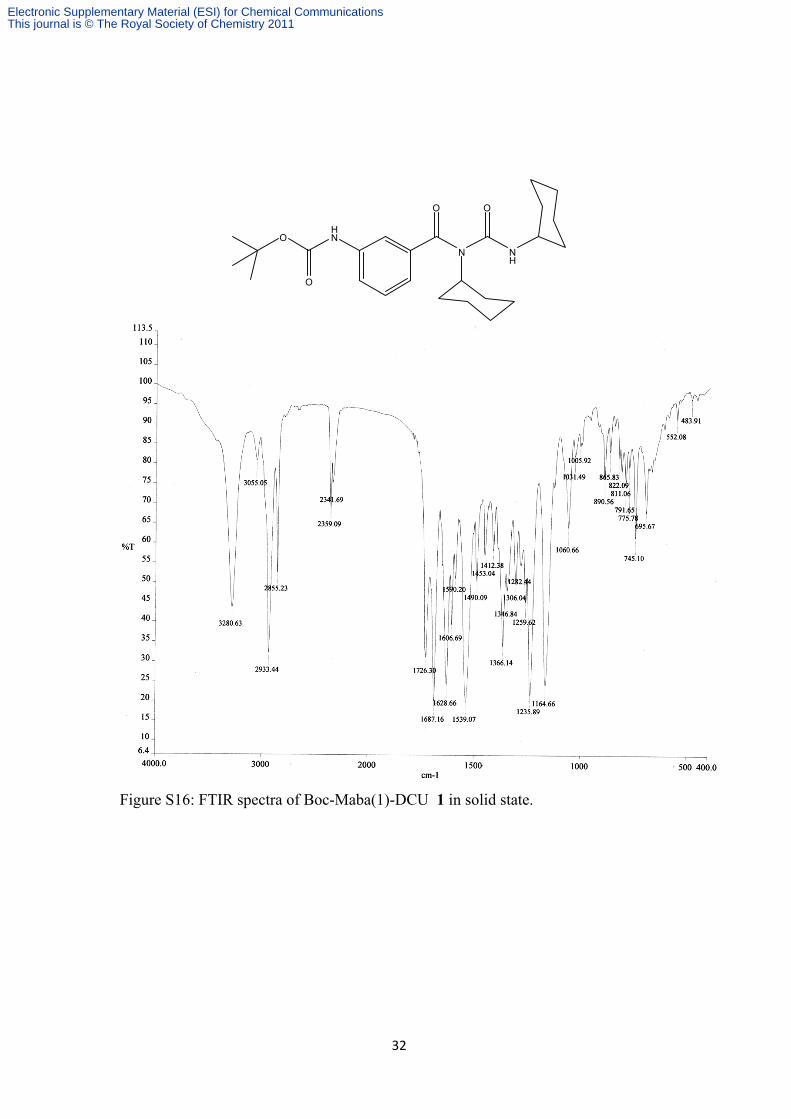
Figure S16: FTIR spectra of Boc-Maba(1)-DCU 1 in solid state.
Electronic Supplementary Material (ESI) for Chemical CommunicationsThis journal is © The Royal Society of Chemistry 2011
33
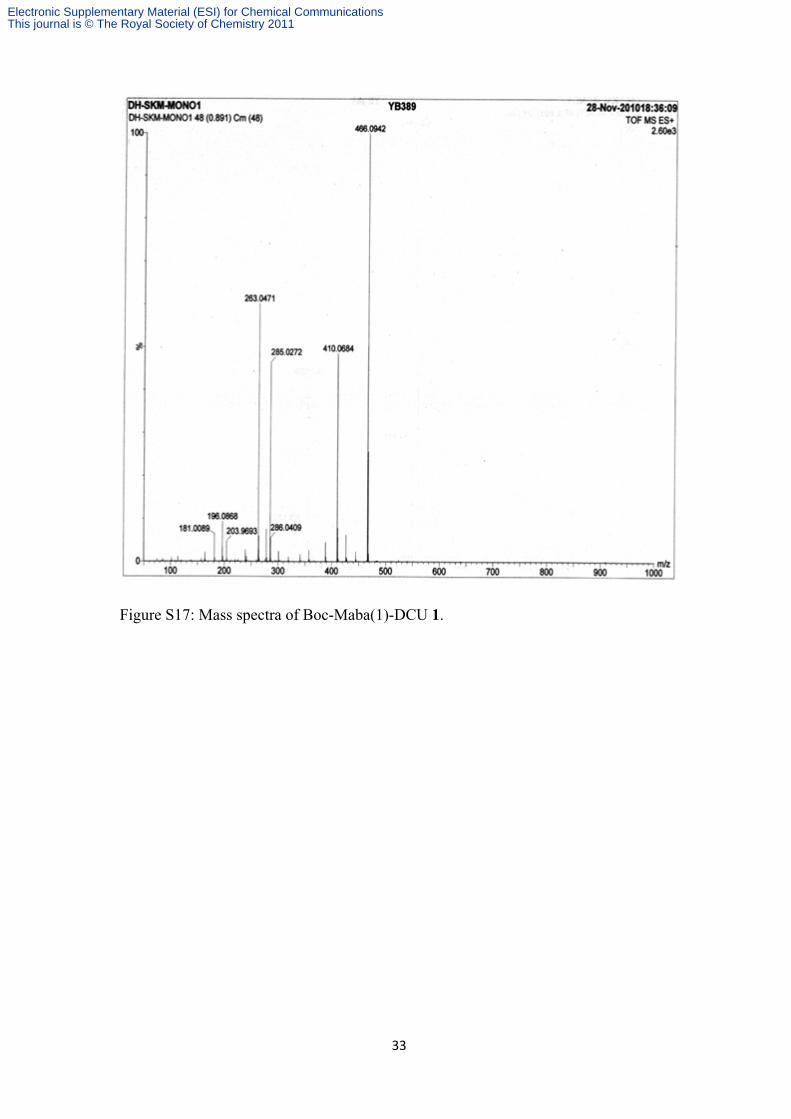
Figure S17: Mass spectra of Boc-Maba(1)-DCU 1.
Electronic Supplementary Material (ESI) for Chemical CommunicationsThis journal is © The Royal Society of Chemistry 2011
34
HNO
NH
NHN
O
O
O O
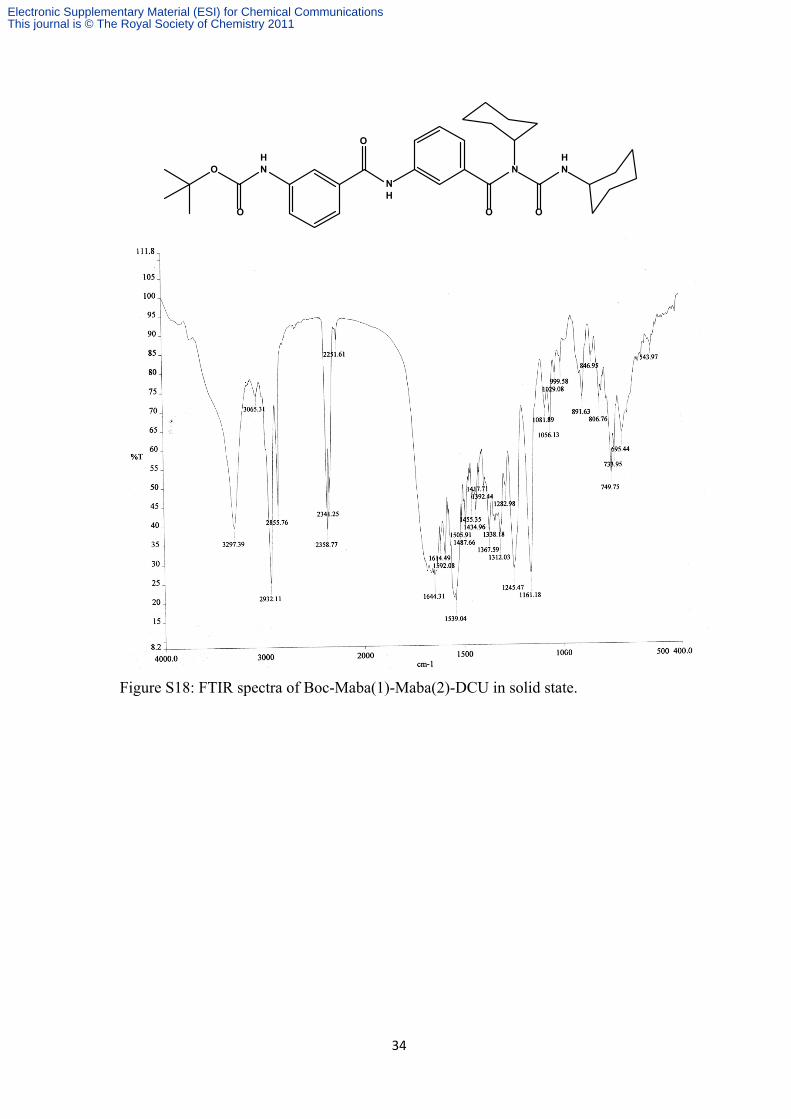
Figure S18: FTIR spectra of Boc-Maba(1)-Maba(2)-DCU in solid state.
Electronic Supplementary Material (ESI) for Chemical CommunicationsThis journal is © The Royal Society of Chemistry 2011
35
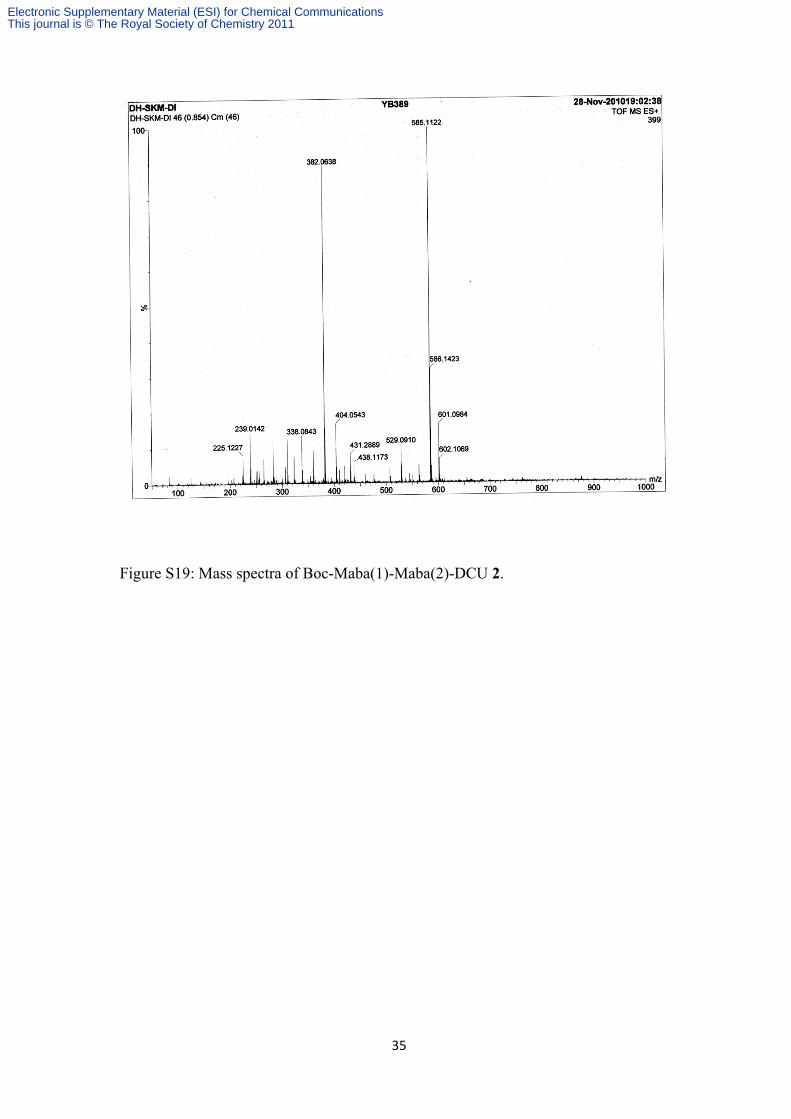
Figure S19: Mass spectra of Boc-Maba(1)-Maba(2)-DCU 2.
Electronic Supplementary Material (ESI) for Chemical CommunicationsThis journal is © The Royal Society of Chemistry 2011