Supporting Information Insights into the durability of Co ... · 1 Dipartimento di Scienze...
12
Supporting Information Insights into the durability of Co-Fe spinel oxygen evolution electrocatalysts via operando studies of catalyst structure Laura Calvillo 1,* , Francesco Carraro 1 , Olena Vozniuk 2 , Verónica Celorrio 3,Φ , Luca Nodari 4 , Andrea E. Russell 5 , Doriana Debellis, 6 David Fermin 3 , Fabrizio Cavani 2 , Stefano Agnoli 1 , Gaetano Granozzi 1 1 Dipartimento di Scienze Chimiche, Università di Padova and INSTM Research Unit, Via Marzolo 1, 35131 Padova, Italia 2 Dipartimento di Chimica Industriale “Toso Montanari”, Università di Bologna, Viale Risorgimento 4, 40136 Bologna, Italia 3 School of Chemistry, University of Bristol, Cantocks Close, BS8 1TS, Bristol, UK 4 Istituto per l’Energetica e le Interfasi CNR-IENI and INSTM, Corso Stati Uniti, 4, 35127 Padova, Italia 5 Chemistry, University of Southampton, Highfield, Southampton SO17 1BJ, UK 6 Istituto Italiano di Tecnologia, Via Morego 30, 16163 Genova, Italia * Corresponding author: [email protected] Φ Current Address: UK Catalysis Hub, Research Complex at Harwell, RAL, Oxford, OX11 0FA, UK. And Kathleen Lonsdale Building, Department of Chemistry, University College London, Gordon Street, London, WC1H 0AJ, UK. Electronic Supplementary Material (ESI) for Journal of Materials Chemistry A. This journal is © The Royal Society of Chemistry 2018
Transcript of Supporting Information Insights into the durability of Co ... · 1 Dipartimento di Scienze...
Supporting Information
Insights into the durability of Co-Fe spinel oxygen evolution
electrocatalysts via operando studies of catalyst structure
Laura Calvillo1,*, Francesco Carraro1, Olena Vozniuk2, Verónica Celorrio3,Φ, Luca Nodari4,
Andrea E. Russell5, Doriana Debellis,6 David Fermin3, Fabrizio Cavani2, Stefano Agnoli1,
Gaetano Granozzi1
1 Dipartimento di Scienze Chimiche, Università di Padova and INSTM Research Unit, Via
Marzolo 1, 35131 Padova, Italia
2 Dipartimento di Chimica Industriale “Toso Montanari”, Università di Bologna, Viale
Risorgimento 4, 40136 Bologna, Italia
3 School of Chemistry, University of Bristol, Cantocks Close, BS8 1TS, Bristol, UK
4 Istituto per l’Energetica e le Interfasi CNR-IENI and INSTM, Corso Stati Uniti, 4, 35127
Padova, Italia
5 Chemistry, University of Southampton, Highfield, Southampton SO17 1BJ, UK
6 Istituto Italiano di Tecnologia, Via Morego 30, 16163 Genova, Italia
*Corresponding author: [email protected]
ΦCurrent Address:
UK Catalysis Hub, Research Complex at Harwell, RAL, Oxford, OX11 0FA, UK. And
Kathleen Lonsdale Building, Department of Chemistry, University College London, Gordon
Street, London, WC1H 0AJ, UK.
Electronic Supplementary Material (ESI) for Journal of Materials Chemistry A.This journal is © The Royal Society of Chemistry 2018
Description of the UHV system
The system consists of two independent UHV chambers: a preparation/analysis chamber
and an electrochemical (EC) chamber. In the former, the sample is prepared using the
procedure described below and characterised by XPS. The EC chamber is coupled to the
preparation chamber by means of a UHV-EC transfer system. This consists of two
manipulators (horizontal and vertical) and is attached to the main preparation chamber
through a gate valve. The horizontal manipulator is used to transfer the sample from the
preparation to the EC chamber, whereas the vertical one allows the coupling of the sample to
the EC cell, which is connected to the EC chamber from the top.
Preparation and characterization of the Co-Fe oxide films on Pd(100)
First, the surface of the Pd(100) single crystal (MaTeck), was cleaned by repeated cycles
of sputtering (2 keV Argon ions at 300 K) and annealing (at 900 K). The residual carbon was
removed by annealing in 2.0×10⁻⁵ Pa of oxygen at 700 K and, subsequently, the adsorbed
oxygen was removed by flash at 900 K. The Co-Fe oxide films were deposited by
consecutive reactive evaporation of Co and/or Fe (0.35 ML min-1) onto clean Pd(100)
substrate in 1×10⁻⁴ Pa O2 partial pressure at room temperature (RT). Then, the samples were
annealed in oxygen atmosphere at 673 K for 60 min in P(O2)=1×10⁻³ Pa in order to favour
the formation of the mixed Co-Fe spinel structure. The thickness of the films was 2-3 nm.
The chemical composition of the samples and the chemical changes induced by the
exposure to the EC environment were investigated by XPS using an EA 125 Omicron
electron analyzer equipped with five channeltrons, working at a base pressure of 10-8 Pa. The
XPS data were collected at RT with the Al Kα line (hυ = 1486.6 eV) of a non-
monochromatized dual-anode DAR400 X-ray source using 0.1 eV energy steps, 0.5 s
collection time, and 20 eV pass energy. The binding energy (BE) scale was calibrated using a
gold sample (Au 4f at 84 eV).
Figure S1. High-resolution Fe 2p and Co 2p photoemission spectra of the as-prepared Co-Fe oxide
films on Pd(100) substrate. The monometallic Fe3O4 and Co3O4 films were also prepared as reference.
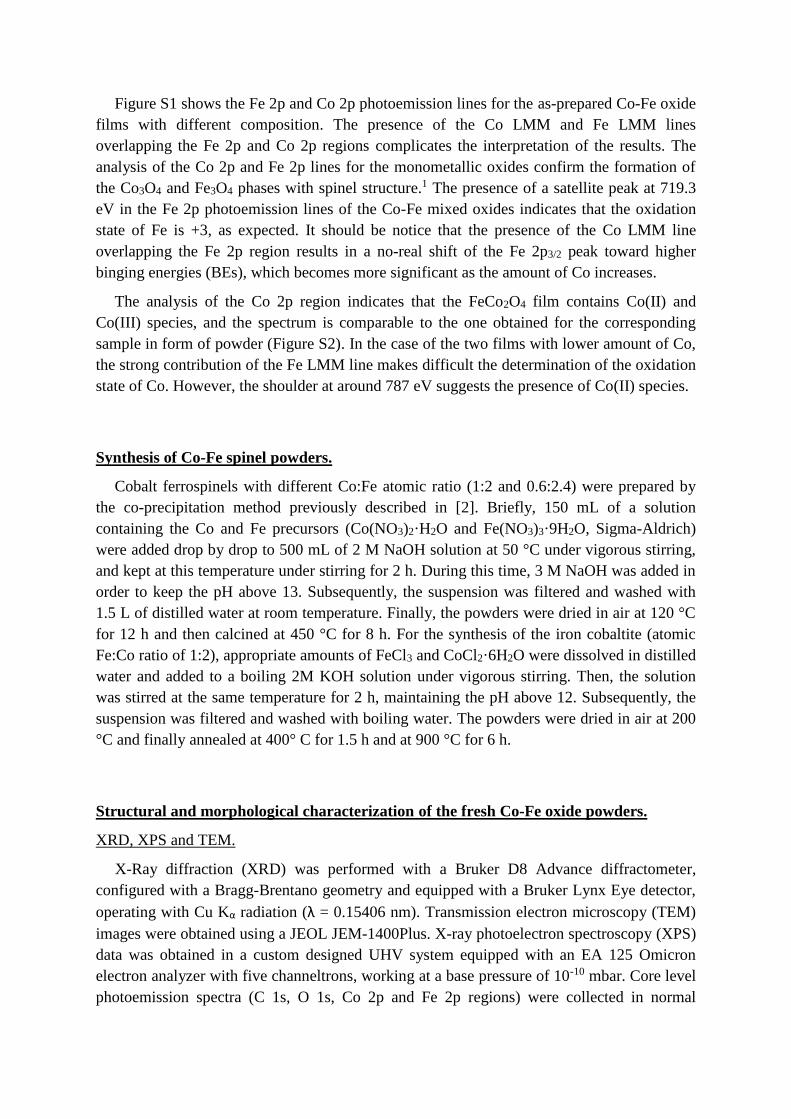
Figure S1 shows the Fe 2p and Co 2p photoemission lines for the as-prepared Co-Fe oxide
films with different composition. The presence of the Co LMM and Fe LMM lines
overlapping the Fe 2p and Co 2p regions complicates the interpretation of the results. The
analysis of the Co 2p and Fe 2p lines for the monometallic oxides confirm the formation of
the Co3O4 and Fe3O4 phases with spinel structure.1 The presence of a satellite peak at 719.3
eV in the Fe 2p photoemission lines of the Co-Fe mixed oxides indicates that the oxidation
state of Fe is +3, as expected. It should be notice that the presence of the Co LMM line
overlapping the Fe 2p region results in a no-real shift of the Fe 2p3/2 peak toward higher
binging energies (BEs), which becomes more significant as the amount of Co increases.
The analysis of the Co 2p region indicates that the FeCo2O4 film contains Co(II) and
Co(III) species, and the spectrum is comparable to the one obtained for the corresponding
sample in form of powder (Figure S2). In the case of the two films with lower amount of Co,
the strong contribution of the Fe LMM line makes difficult the determination of the oxidation
state of Co. However, the shoulder at around 787 eV suggests the presence of Co(II) species.
Synthesis of Co-Fe spinel powders.
Cobalt ferrospinels with different Co:Fe atomic ratio (1:2 and 0.6:2.4) were prepared by
the co-precipitation method previously described in [2]. Briefly, 150 mL of a solution
containing the Co and Fe precursors (Co(NO3)2·H2O and Fe(NO3)3·9H2O, Sigma-Aldrich)
were added drop by drop to 500 mL of 2 M NaOH solution at 50 °C under vigorous stirring,
and kept at this temperature under stirring for 2 h. During this time, 3 M NaOH was added in
order to keep the pH above 13. Subsequently, the suspension was filtered and washed with
1.5 L of distilled water at room temperature. Finally, the powders were dried in air at 120 °C
for 12 h and then calcined at 450 °C for 8 h. For the synthesis of the iron cobaltite (atomic
Fe:Co ratio of 1:2), appropriate amounts of FeCl3 and CoCl2·6H2O were dissolved in distilled
water and added to a boiling 2M KOH solution under vigorous stirring. Then, the solution
was stirred at the same temperature for 2 h, maintaining the pH above 12. Subsequently, the
suspension was filtered and washed with boiling water. The powders were dried in air at 200
°C and finally annealed at 400° C for 1.5 h and at 900 °C for 6 h.
Structural and morphological characterization of the fresh Co-Fe oxide powders.
XRD, XPS and TEM.
X-Ray diffraction (XRD) was performed with a Bruker D8 Advance diffractometer,
configured with a Bragg-Brentano geometry and equipped with a Bruker Lynx Eye detector,
operating with Cu Kα radiation (λ = 0.15406 nm). Transmission electron microscopy (TEM)
images were obtained using a JEOL JEM-1400Plus. X-ray photoelectron spectroscopy (XPS)
data was obtained in a custom designed UHV system equipped with an EA 125 Omicron
electron analyzer with five channeltrons, working at a base pressure of 10-10 mbar. Core level
photoemission spectra (C 1s, O 1s, Co 2p and Fe 2p regions) were collected in normal
emission at room temperature with a non-monochromatized Mg Kα X-ray source (1253.6
eV).
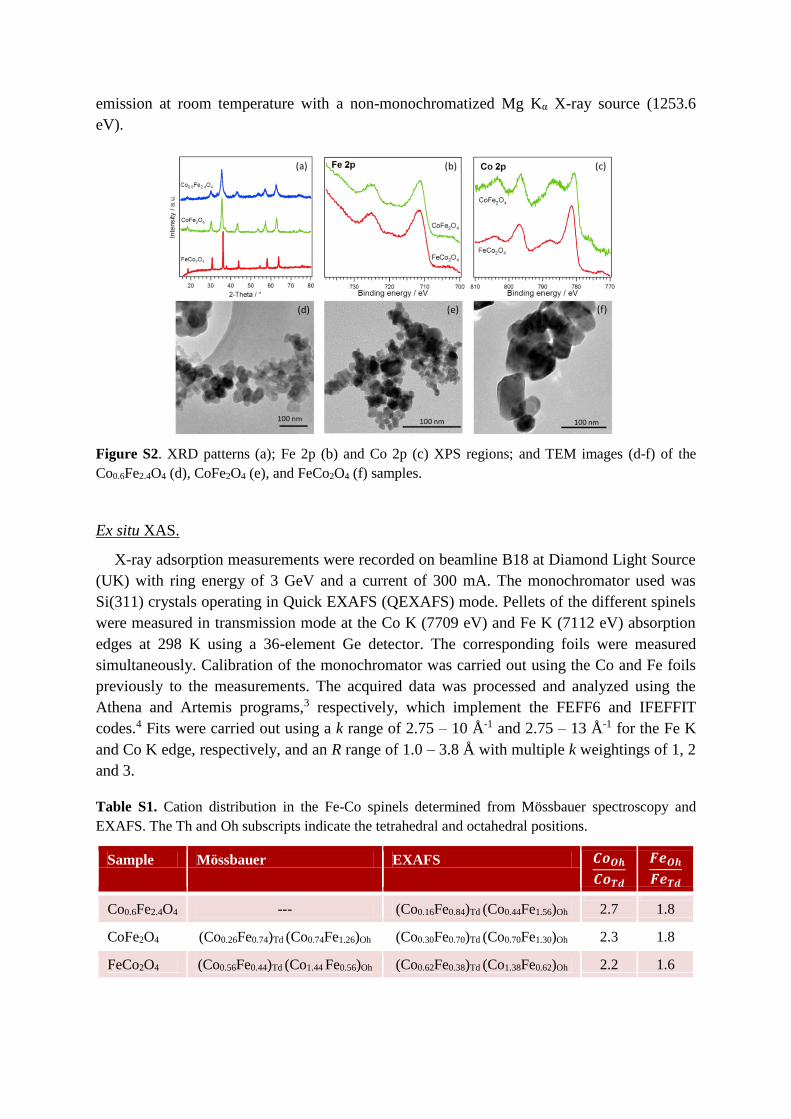
Figure S2. XRD patterns (a); Fe 2p (b) and Co 2p (c) XPS regions; and TEM images (d-f) of the
Co0.6Fe2.4O4 (d), CoFe2O4 (e), and FeCo2O4 (f) samples.
Ex situ XAS.
X-ray adsorption measurements were recorded on beamline B18 at Diamond Light Source
(UK) with ring energy of 3 GeV and a current of 300 mA. The monochromator used was
Si(311) crystals operating in Quick EXAFS (QEXAFS) mode. Pellets of the different spinels
were measured in transmission mode at the Co K (7709 eV) and Fe K (7112 eV) absorption
edges at 298 K using a 36-element Ge detector. The corresponding foils were measured
simultaneously. Calibration of the monochromator was carried out using the Co and Fe foils
previously to the measurements. The acquired data was processed and analyzed using the
Athena and Artemis programs,3 respectively, which implement the FEFF6 and IFEFFIT
codes.4 Fits were carried out using a k range of 2.75 – 10 Å-1 and 2.75 – 13 Å-1 for the Fe K
and Co K edge, respectively, and an R range of 1.0 – 3.8 Å with multiple k weightings of 1, 2
and 3.
Table S1. Cation distribution in the Fe-Co spinels determined from Mössbauer spectroscopy and
EXAFS. The Th and Oh subscripts indicate the tetrahedral and octahedral positions.
Sample Mössbauer EXAFS 𝑪𝒐𝑶𝒉𝑪𝒐𝑻𝒅
𝑭𝒆𝑶𝒉𝑭𝒆𝑻𝒅
Co0.6Fe2.4O4 --- (Co0.16Fe0.84)Td (Co0.44Fe1.56)Oh 2.7 1.8
CoFe2O4 (Co0.26Fe0.74)Td (Co0.74Fe1.26)Oh (Co0.30Fe0.70)Td (Co0.70Fe1.30)Oh 2.3 1.8
FeCo2O4 (Co0.56Fe0.44)Td (Co1.44 Fe0.56)Oh (Co0.62Fe0.38)Td (Co1.38Fe0.62)Oh 2.2 1.6
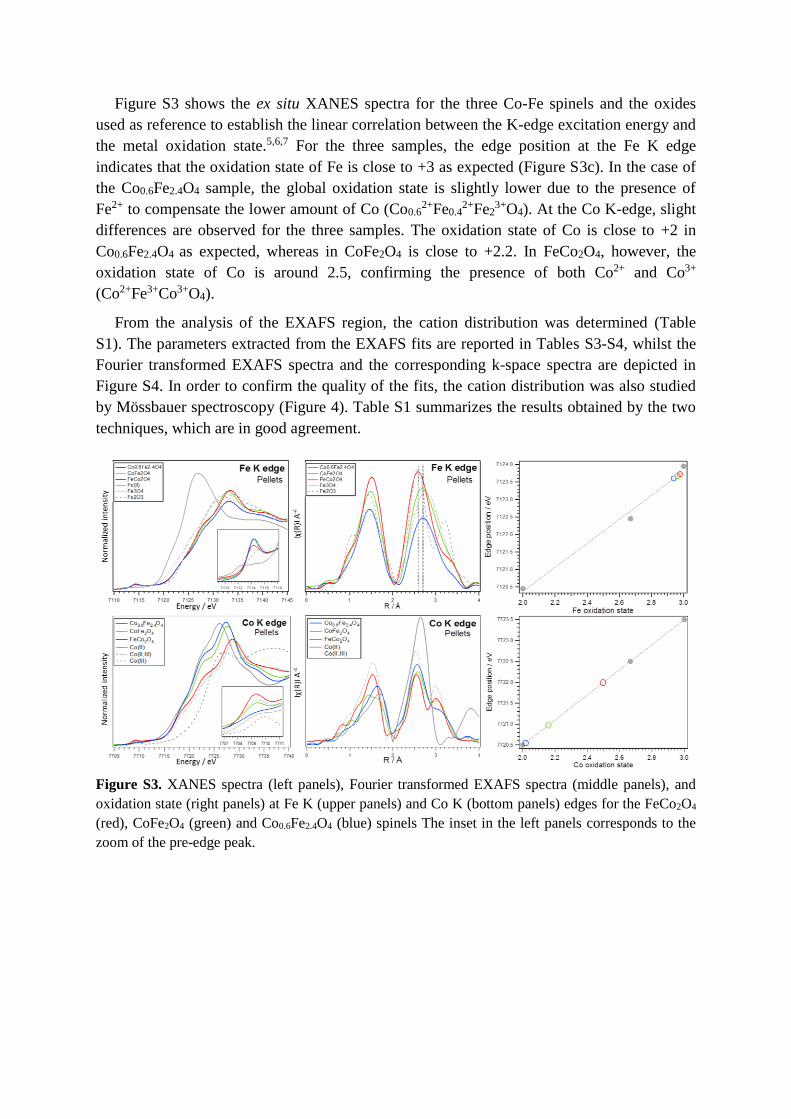
Figure S3 shows the ex situ XANES spectra for the three Co-Fe spinels and the oxides
used as reference to establish the linear correlation between the K-edge excitation energy and
the metal oxidation state.5,6,7 For the three samples, the edge position at the Fe K edge
indicates that the oxidation state of Fe is close to +3 as expected (Figure S3c). In the case of
the Co0.6Fe2.4O4 sample, the global oxidation state is slightly lower due to the presence of
Fe2+ to compensate the lower amount of Co (Co0.62+Fe0.4
2+Fe23+O4). At the Co K-edge, slight
differences are observed for the three samples. The oxidation state of Co is close to +2 in
Co0.6Fe2.4O4 as expected, whereas in CoFe2O4 is close to +2.2. In FeCo2O4, however, the
oxidation state of Co is around 2.5, confirming the presence of both Co2+ and Co3+
(Co2+Fe3+Co3+O4).
From the analysis of the EXAFS region, the cation distribution was determined (Table
S1). The parameters extracted from the EXAFS fits are reported in Tables S3-S4, whilst the
Fourier transformed EXAFS spectra and the corresponding k-space spectra are depicted in
Figure S4. In order to confirm the quality of the fits, the cation distribution was also studied
by Mössbauer spectroscopy (Figure 4). Table S1 summarizes the results obtained by the two
techniques, which are in good agreement.
Figure S3. XANES spectra (left panels), Fourier transformed EXAFS spectra (middle panels), and
oxidation state (right panels) at Fe K (upper panels) and Co K (bottom panels) edges for the FeCo2O4
(red), CoFe2O4 (green) and Co0.6Fe2.4O4 (blue) spinels The inset in the left panels corresponds to the
zoom of the pre-edge peak.
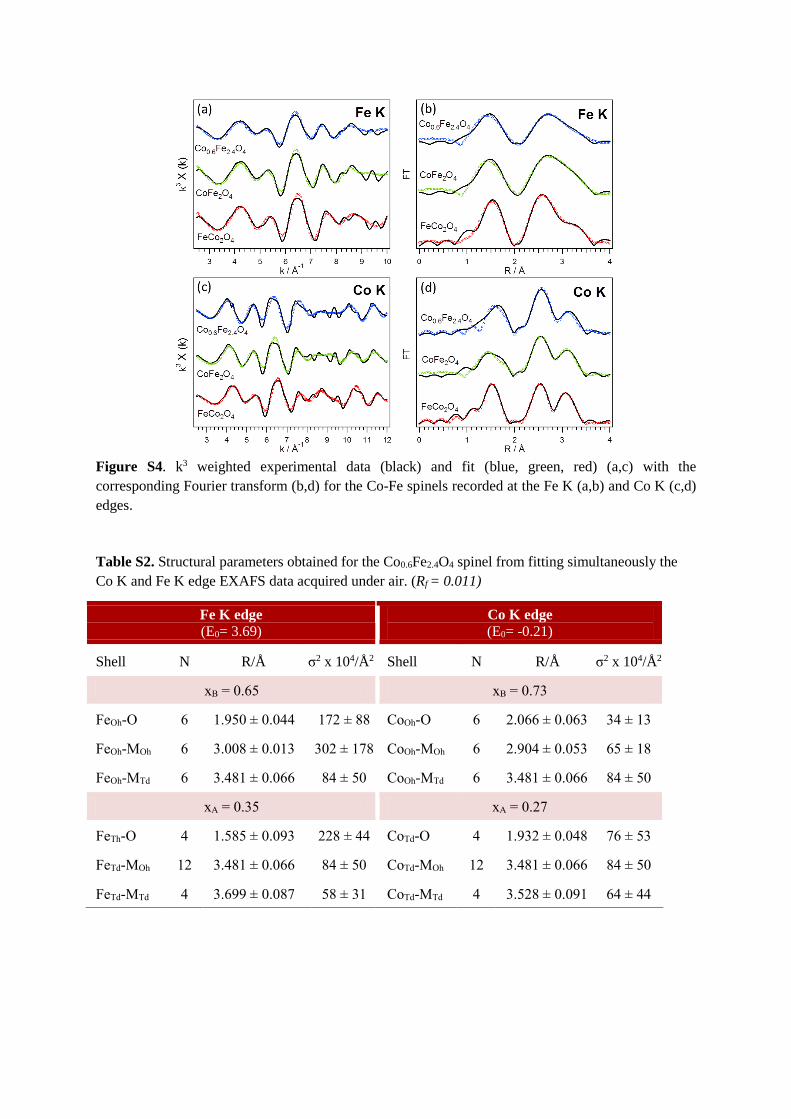
Figure S4. k3 weighted experimental data (black) and fit (blue, green, red) (a,c) with the
corresponding Fourier transform (b,d) for the Co-Fe spinels recorded at the Fe K (a,b) and Co K (c,d)
edges.
Table S2. Structural parameters obtained for the Co0.6Fe2.4O4 spinel from fitting simultaneously the
Co K and Fe K edge EXAFS data acquired under air. (Rf = 0.011)
Fe K edge
(E0= 3.69) Co K edge
(E0= -0.21)
Shell N R/Å σ2 x 10⁴/Å2 Shell N R/Å σ2 x 10⁴/Å2
xB = 0.65 xB = 0.73
FeOh-O 6 1.950 ± 0.044 172 ± 88 CoOh-O 6 2.066 ± 0.063 34 ± 13
FeOh-MOh 6 3.008 ± 0.013 302 ± 178 CoOh-MOh 6 2.904 ± 0.053 65 ± 18
FeOh-MTd 6 3.481 ± 0.066 84 ± 50 CoOh-MTd 6 3.481 ± 0.066 84 ± 50
xA = 0.35 xA = 0.27
FeTh-O 4 1.585 ± 0.093 228 ± 44 CoTd-O 4 1.932 ± 0.048 76 ± 53
FeTd-MOh 12 3.481 ± 0.066 84 ± 50 CoTd-MOh 12 3.481 ± 0.066 84 ± 50
FeTd-MTd 4 3.699 ± 0.087 58 ± 31 CoTd-MTd 4 3.528 ± 0.091 64 ± 44
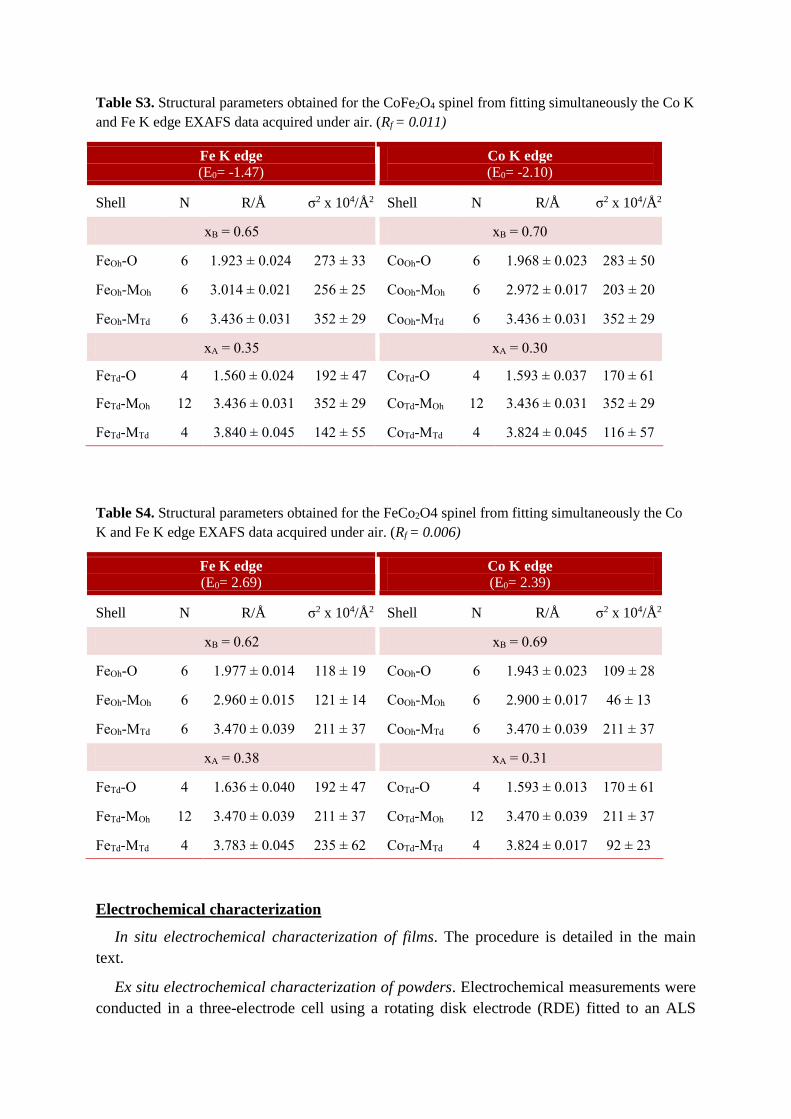
Table S3. Structural parameters obtained for the CoFe2O4 spinel from fitting simultaneously the Co K
and Fe K edge EXAFS data acquired under air. (Rf = 0.011)
Fe K edge
(E0= -1.47) Co K edge
(E0= -2.10)
Shell N R/Å σ2 x 10⁴/Å2 Shell N R/Å σ2 x 10⁴/Å2
xB = 0.65 xB = 0.70
FeOh-O 6 1.923 ± 0.024 273 ± 33 CoOh-O 6 1.968 ± 0.023 283 ± 50
FeOh-MOh 6 3.014 ± 0.021 256 ± 25 CoOh-MOh 6 2.972 ± 0.017 203 ± 20
FeOh-MTd 6 3.436 ± 0.031 352 ± 29 CoOh-MTd 6 3.436 ± 0.031 352 ± 29
xA = 0.35 xA = 0.30
FeTd-O 4 1.560 ± 0.024 192 ± 47 CoTd-O 4 1.593 ± 0.037 170 ± 61
FeTd-MOh 12 3.436 ± 0.031 352 ± 29 CoTd-MOh 12 3.436 ± 0.031 352 ± 29
FeTd-MTd 4 3.840 ± 0.045 142 ± 55 CoTd-MTd 4 3.824 ± 0.045 116 ± 57
Table S4. Structural parameters obtained for the FeCo2O4 spinel from fitting simultaneously the Co
K and Fe K edge EXAFS data acquired under air. (Rf = 0.006)
Fe K edge
(E0= 2.69) Co K edge
(E0= 2.39)
Shell N R/Å σ2 x 10⁴/Å2 Shell N R/Å σ2 x 10⁴/Å2
xB = 0.62 xB = 0.69
FeOh-O 6 1.977 ± 0.014 118 ± 19 CoOh-O 6 1.943 ± 0.023 109 ± 28
FeOh-MOh 6 2.960 ± 0.015 121 ± 14 CoOh-MOh 6 2.900 ± 0.017 46 ± 13
FeOh-MTd 6 3.470 ± 0.039 211 ± 37 CoOh-MTd 6 3.470 ± 0.039 211 ± 37
xA = 0.38 xA = 0.31
FeTd-O 4 1.636 ± 0.040 192 ± 47 CoTd-O 4 1.593 ± 0.013 170 ± 61
FeTd-MOh 12 3.470 ± 0.039 211 ± 37 CoTd-MOh 12 3.470 ± 0.039 211 ± 37
FeTd-MTd 4 3.783 ± 0.045 235 ± 62 CoTd-MTd 4 3.824 ± 0.017 92 ± 23
Electrochemical characterization
In situ electrochemical characterization of films. The procedure is detailed in the main
text.
Ex situ electrochemical characterization of powders. Electrochemical measurements were
conducted in a three-electrode cell using a rotating disk electrode (RDE) fitted to an ALS
rotation controller and connected to CompactStat bipotentiostat (Ivium). The RDE electrode
consisted of 4 mm glassy carbon disk. A mercury/mercurous oxide (Hg/HgO, calibrated as
+0.918 V vs RHE) electrode (in 1M NaOH, IJ Cambria) was used as reference electrode and
a Pt gauze as counter electrode. The potentials in this work have been converted to a
reversible hydrogen electrode (RHE) reference electrode. Measurements were carried out in
0.1 M KOH saturated with O2 (BOC). A thin-film catalyst layer was deposited on the glassy
carbon electrode using a two-step drop-casting method with two different inks. An ink
containing Vulcan XC-72 carbon and Na+-exchanged Nafion® (5 wt.%, Sigma-Aldrich) was
deposited on the glassy carbon disk; followed by a deposition of an aqueous suspension of
the oxide. The final loading in the catalyst layer for each electrode was controlled at 50
μgspinel cm-2 and 40 and μgVulcan cm-2 (per geometric surface area of the electrode).
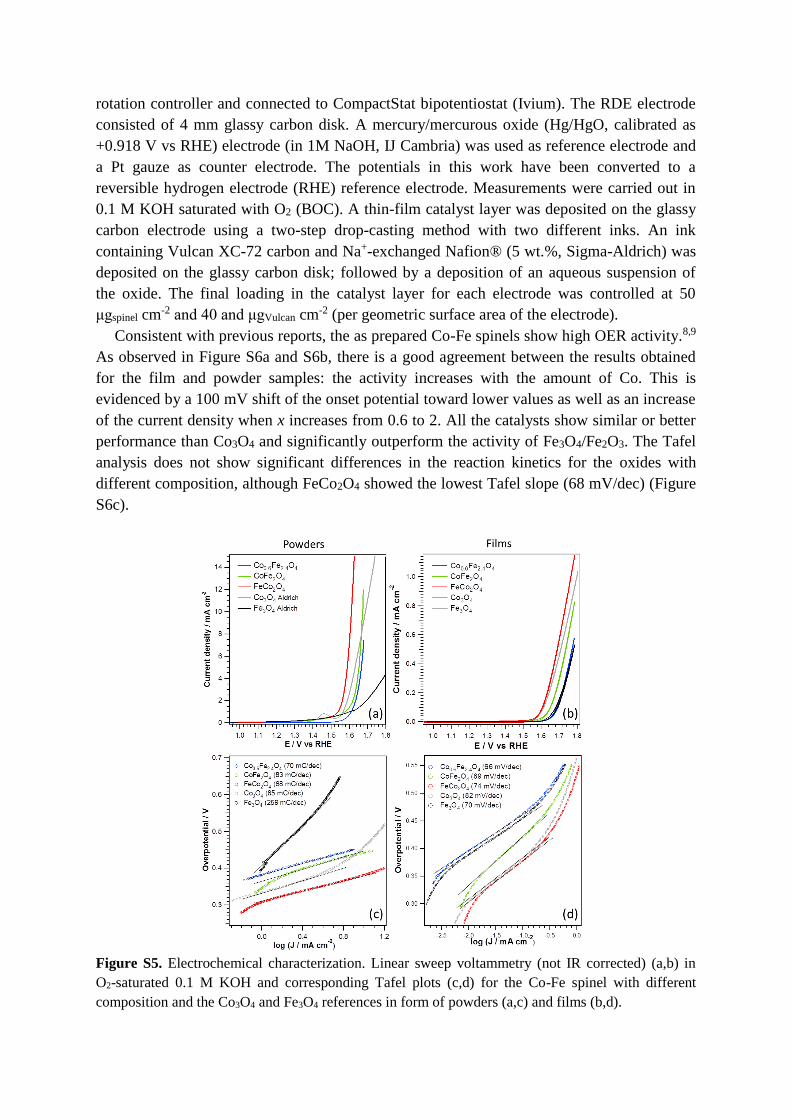
Consistent with previous reports, the as prepared Co-Fe spinels show high OER activity.8,9
As observed in Figure S6a and S6b, there is a good agreement between the results obtained
for the film and powder samples: the activity increases with the amount of Co. This is
evidenced by a 100 mV shift of the onset potential toward lower values as well as an increase
of the current density when x increases from 0.6 to 2. All the catalysts show similar or better
performance than Co3O4 and significantly outperform the activity of Fe3O4/Fe2O3. The Tafel
analysis does not show significant differences in the reaction kinetics for the oxides with
different composition, although FeCo2O4 showed the lowest Tafel slope (68 mV/dec) (Figure
S6c).
Figure S5. Electrochemical characterization. Linear sweep voltammetry (not IR corrected) (a,b) in
O2-saturated 0.1 M KOH and corresponding Tafel plots (c,d) for the Co-Fe spinel with different
composition and the Co3O4 and Fe3O4 references in form of powders (a,c) and films (b,d).
In the case of the powders, a structure/activity relationship can be established by
combining the structural and electrochemical characterization. In the literature, it has been
previously reported that the catalytic performance of spinels is geometry-site-
dependent;10,11,12 therefore, the structural characterization of these materials is crucial to
rationalize their properties, in particular under working conditions. In order to investigate if
the increase of the OER activity with the amount of Co is related to the geometric distribution
of the Co atoms, the cation distribution was determined by EXAFS and Mössbauer
Spectroscopy (Tables S1-S4). As seen in Table S1, the ratio between Co atoms in octahedral
and tetrahedral sites (CoOh/CoTd) decreases when the amount of Co increases, suggesting that
the differences in OER activity should be related to Co atoms.
The results obtained from the in situ XAS measurements indicate that the Co(II) ions in
tetrahedral sites are the most reactive ones and experience a chemical and structural evolution
under the working conditions, leading to the formation of CoOOH which is considered the
active catalytic phase. Actually, the activity of the Co-Fe spinel increases with the amount of
Co(II)Td species, confirming that the activity is related to the Co atoms and in particular, to
Co(II) with tetrahedral coordination.
In situ chemical/structural characterization of the Co-Fe oxide thin films after the
electrochemistry
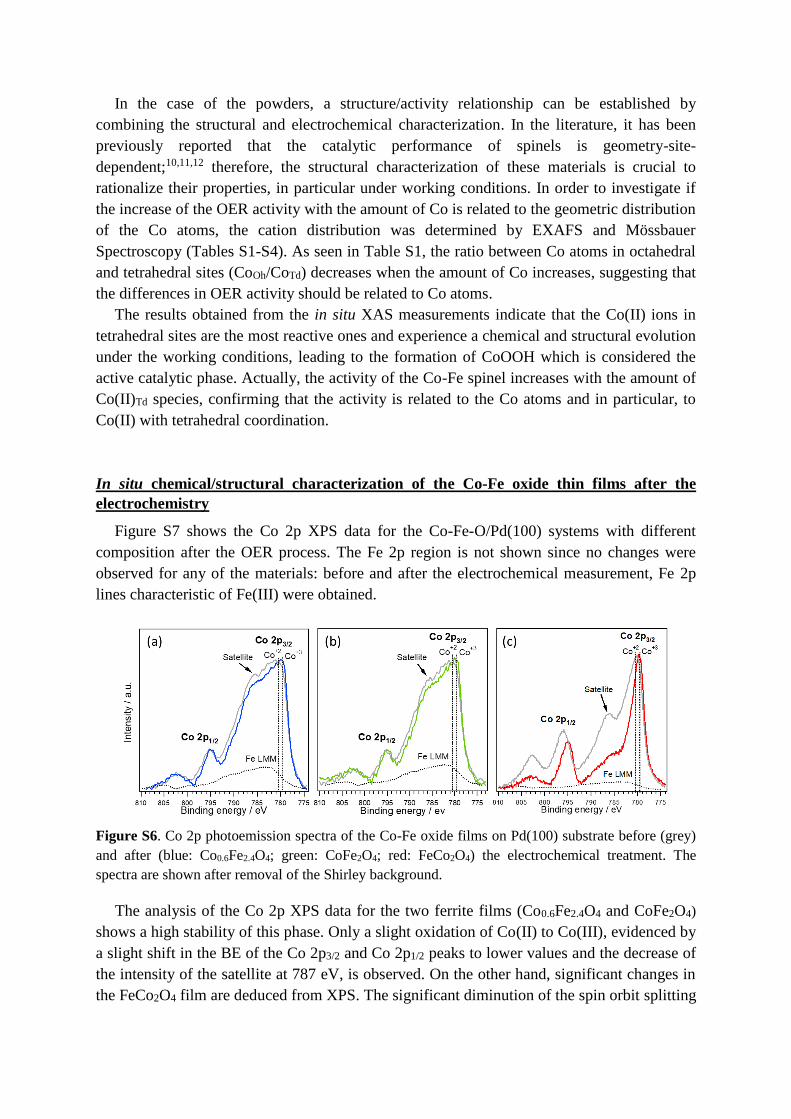
Figure S7 shows the Co 2p XPS data for the Co-Fe-O/Pd(100) systems with different
composition after the OER process. The Fe 2p region is not shown since no changes were
observed for any of the materials: before and after the electrochemical measurement, Fe 2p
lines characteristic of Fe(III) were obtained.
Figure S6. Co 2p photoemission spectra of the Co-Fe oxide films on Pd(100) substrate before (grey)
and after (blue: Co0.6Fe2.4O4; green: CoFe2O4; red: FeCo2O4) the electrochemical treatment. The
spectra are shown after removal of the Shirley background.
The analysis of the Co 2p XPS data for the two ferrite films (Co0.6Fe2.4O4 and CoFe2O4)
shows a high stability of this phase. Only a slight oxidation of Co(II) to Co(III), evidenced by
a slight shift in the BE of the Co 2p3/2 and Co 2p1/2 peaks to lower values and the decrease of
the intensity of the satellite at 787 eV, is observed. On the other hand, significant changes in
the FeCo2O4 film are deduced from XPS. The significant diminution of the spin orbit splitting

energy and the intensity of the satellite at 787 eV indicate a strong oxidation of the film
leading to the formation of Co3O4, as deduced from the Co 2p spectrum and the results for the
CoO film showed in Figure 1.
Therefore, the in situ XPS/EC measurements suggest that the cobaltite phase is oxidized
under OER conditions leading to the formation of Co3O4 and/or CoOOH. As a consequence
of the Co oxidation, it is expected that Fe2O3 will also be formed, as seen in Figure 1. The
ferrite phase, however, resulted to be very stable under OER conditions with only a slight
oxidation of Co(II) to Co(III).
In situ XANES characterization of the Co-Fe oxide powders
Figure S7. Detail of the shift of the Fe K (upper panels) and Co K (bottom panels) edges with the
applied potential for the FeCo2O4 (red), CoFe2O4 (green) and Co0.6Fe2.4O4 (blue) spinels.
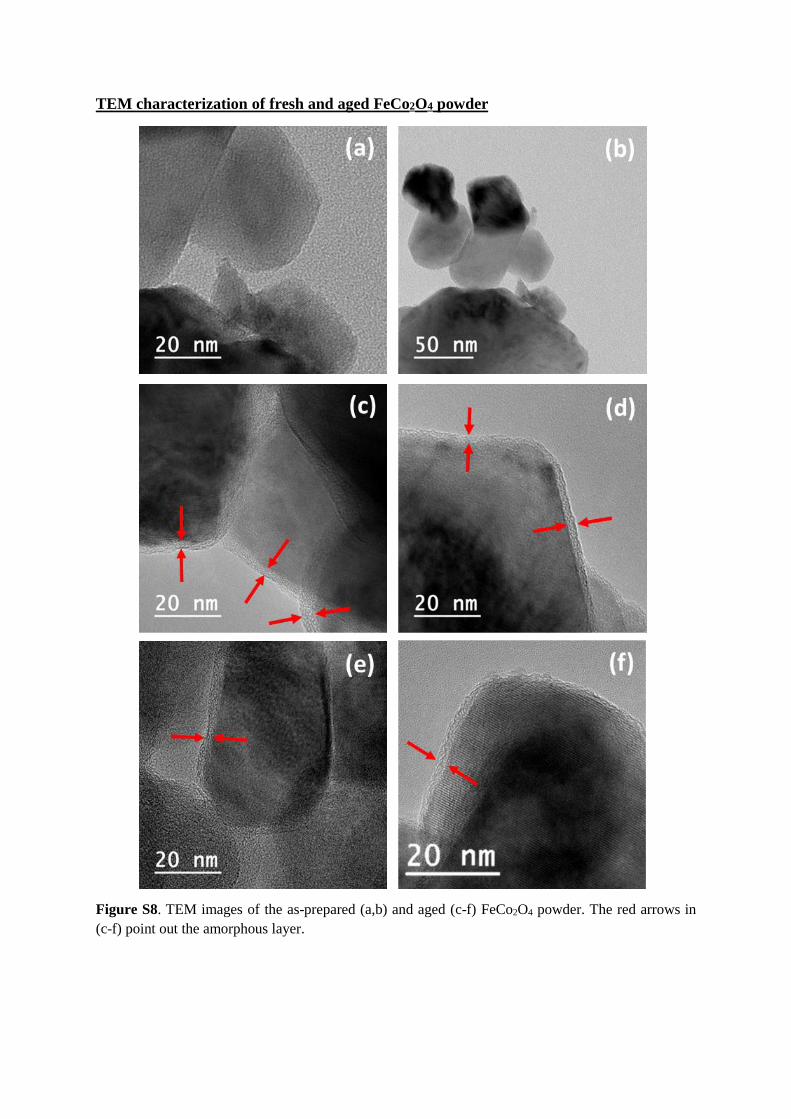
TEM characterization of fresh and aged FeCo2O4 powder
Figure S8. TEM images of the as-prepared (a,b) and aged (c-f) FeCo2O4 powder. The red arrows in
(c-f) point out the amorphous layer.
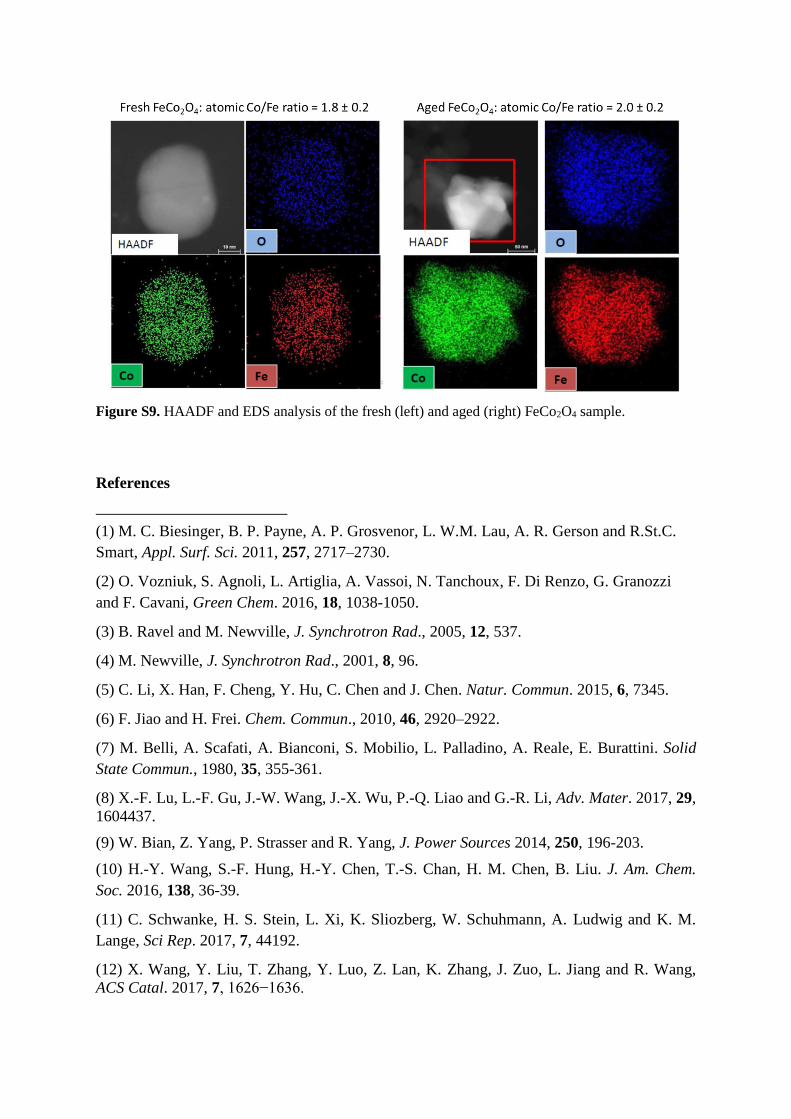
Figure S9. HAADF and EDS analysis of the fresh (left) and aged (right) FeCo2O4 sample.
References
(1) M. C. Biesinger, B. P. Payne, A. P. Grosvenor, L. W.M. Lau, A. R. Gerson and R.St.C.
Smart, Appl. Surf. Sci. 2011, 257, 2717–2730.
(2) O. Vozniuk, S. Agnoli, L. Artiglia, A. Vassoi, N. Tanchoux, F. Di Renzo, G. Granozzi
and F. Cavani, Green Chem. 2016, 18, 1038-1050.
(3) B. Ravel and M. Newville, J. Synchrotron Rad., 2005, 12, 537.
(4) M. Newville, J. Synchrotron Rad., 2001, 8, 96.
(5) C. Li, X. Han, F. Cheng, Y. Hu, C. Chen and J. Chen. Natur. Commun. 2015, 6, 7345.
(6) F. Jiao and H. Frei. Chem. Commun., 2010, 46, 2920–2922.
(7) M. Belli, A. Scafati, A. Bianconi, S. Mobilio, L. Palladino, A. Reale, E. Burattini. Solid
State Commun., 1980, 35, 355-361.
(8) X.-F. Lu, L.-F. Gu, J.-W. Wang, J.-X. Wu, P.-Q. Liao and G.-R. Li, Adv. Mater. 2017, 29,
1604437.
(9) W. Bian, Z. Yang, P. Strasser and R. Yang, J. Power Sources 2014, 250, 196-203.
(10) H.-Y. Wang, S.-F. Hung, H.-Y. Chen, T.-S. Chan, H. M. Chen, B. Liu. J. Am. Chem.
Soc. 2016, 138, 36-39.
(11) C. Schwanke, H. S. Stein, L. Xi, K. Sliozberg, W. Schuhmann, A. Ludwig and K. M.
Lange, Sci Rep. 2017, 7, 44192.
(12) X. Wang, Y. Liu, T. Zhang, Y. Luo, Z. Lan, K. Zhang, J. Zuo, L. Jiang and R. Wang,
ACS Catal. 2017, 7, 1626−1636.