Supporting Information Diimide) Derivatives by …1 Supporting Information Tuning Charge Transport...
21
1 Supporting Information Tuning Charge Transport from Unipolar (n-type) to Ambipolar in Bis(Naphthalene Diimide) Derivatives by Introducing π-conjugated Heterocyclic Bridging Moieties Zongrui Wang, ‡ Xiangguang Li, ‡ Ye Zou, Jiahui Tan, Xiaolong Fu, Jie Liu, Chengyi Xiao, Huanli Dong,* Wei Jiang,* Feng Liu*,Yonggang Zhen, Zhaohui Wang,* Thomas P. Russell*, Wenping Hu* ‡ These authors contributed equally * Email: [email protected], [email protected], [email protected], [email protected], [email protected], [email protected] Electronic Supplementary Material (ESI) for Journal of Materials Chemistry C. This journal is © The Royal Society of Chemistry 2016
Transcript of Supporting Information Diimide) Derivatives by …1 Supporting Information Tuning Charge Transport...
1
Supporting Information
Tuning Charge Transport from Unipolar (n-type) to Ambipolar in Bis(Naphthalene
Diimide) Derivatives by Introducing π-conjugated Heterocyclic Bridging Moieties
Zongrui Wang,‡ Xiangguang Li,‡ Ye Zou, Jiahui Tan, Xiaolong Fu, Jie Liu, Chengyi Xiao, Huanli
Dong,* Wei Jiang,* Feng Liu*,Yonggang Zhen, Zhaohui Wang,* Thomas P. Russell*, Wenping Hu*
‡ These authors contributed equally
* Email: [email protected], [email protected], [email protected], [email protected], [email protected], [email protected]
Electronic Supplementary Material (ESI) for Journal of Materials Chemistry C.This journal is © The Royal Society of Chemistry 2016
2
Table of Contents
Experimental section.
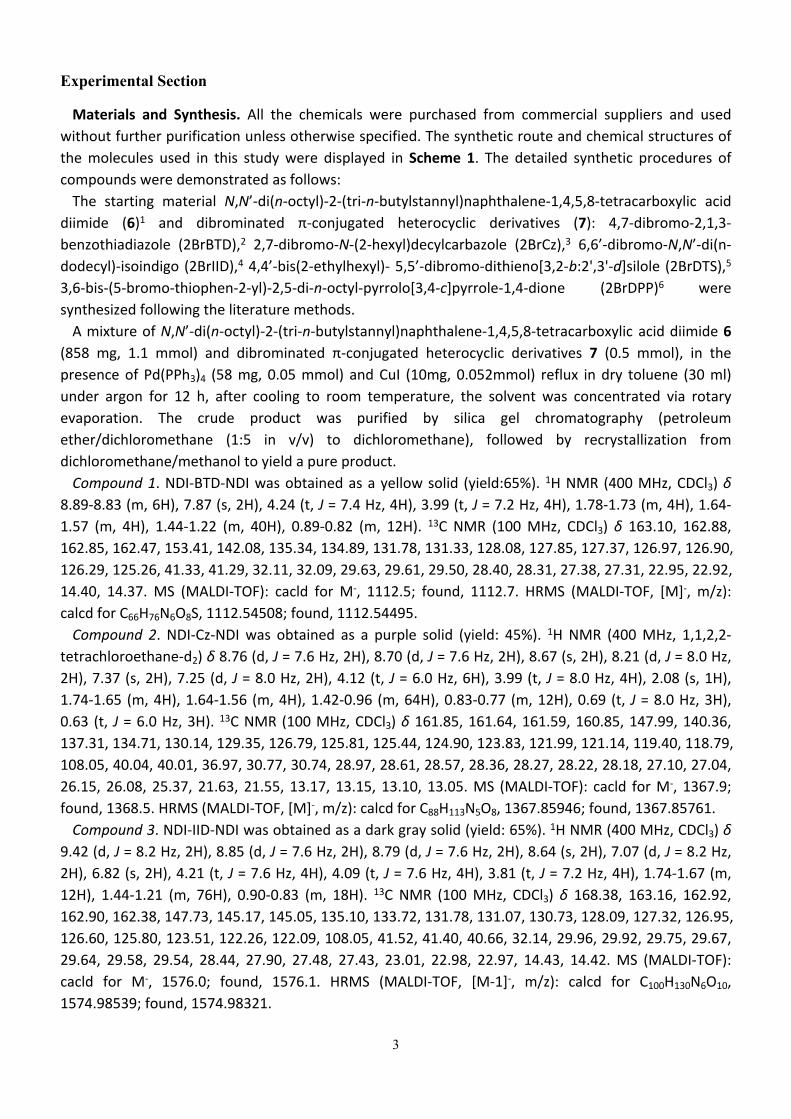
Figure S1. (a) Thermogravimetric analysis and (b) differential scanning calorimetry analysis of
compounds 1-5
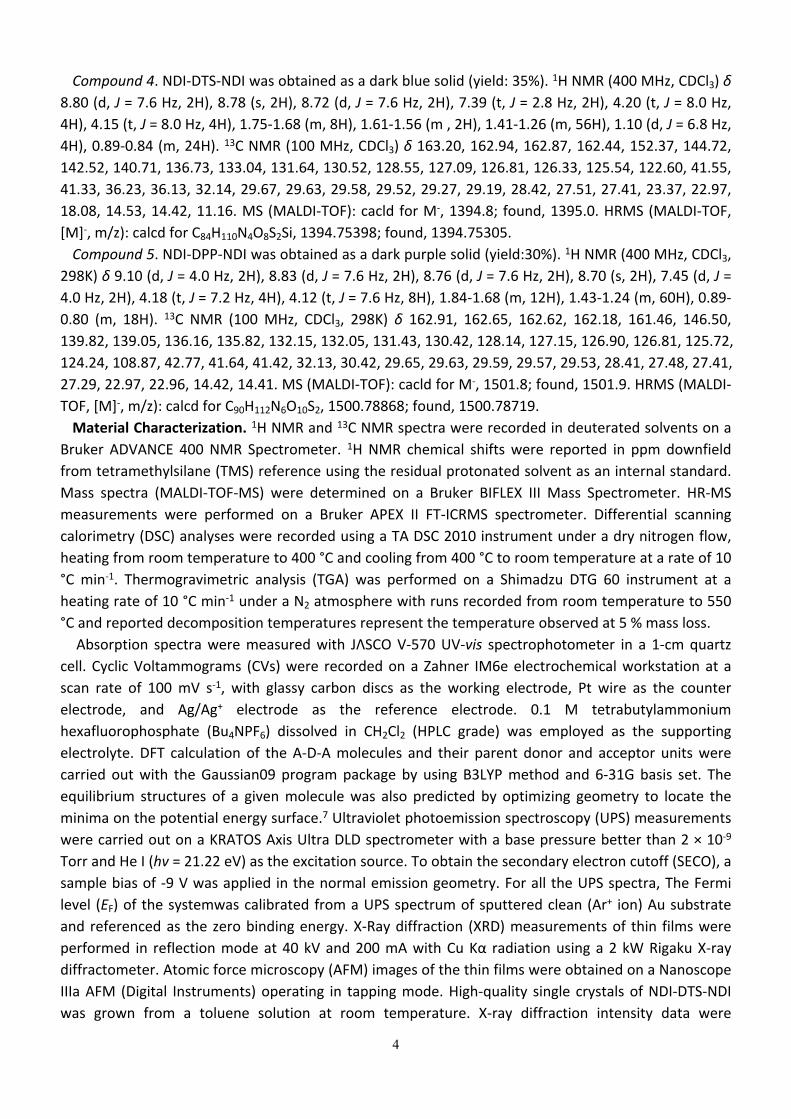
Figure S2. Electron-state density distribution of the HOMO and LUMO orbitals for NDI, BTD, Cz, IID, DTS
and DPP and their calculated HOMO/LUMO energy levels by DFT method.
Table S1. Calculated HOMO/LUMO energy levels, band gaps, and torsion angles of compounds 1-5.
Figure S3. UV-vis absorption spectra of compounds 1-5 at different annealing temperatures.
Figure S4. The measured UPS spectra of the SEC region and HOMO region of compounds 1-5 thin films
spin-coated on the Au surface.
Figure S5. Transfer and output characteristics of BGTC OTFT based on compound 5 annealed at 260 °C
tested in atmospheric environment.
Figure S6. AFM images of thin films of compounds 1, 2, 3, and 5 after annealing at 80 °C and 230 °C.
Figure S7. The roughness change of compounds 1-5 with annealed temperature increase.
Table S2. Crystallographic information obtained from the scattering profiles of compounds 1-5 films
along qz and qxy direction.
1H NMR, 13C NMR, MALDI-TOF mass Spectrum and HRMS of compounds 1-5.
Reference
3
Experimental Section
Materials and Synthesis. All the chemicals were purchased from commercial suppliers and used without further purification unless otherwise specified. The synthetic route and chemical structures of the molecules used in this study were displayed in Scheme 1. The detailed synthetic procedures of compounds were demonstrated as follows:
The starting material N,N’-di(n-octyl)-2-(tri-n-butylstannyl)naphthalene-1,4,5,8-tetracarboxylic acid diimide (6)1 and dibrominated π-conjugated heterocyclic derivatives (7): 4,7-dibromo-2,1,3-benzothiadiazole (2BrBTD),2 2,7-dibromo-N-(2-hexyl)decylcarbazole (2BrCz),3 6,6’-dibromo-N,N’-di(n-dodecyl)-isoindigo (2BrIID),4 4,4’-bis(2-ethylhexyl)- 5,5’-dibromo-dithieno[3,2-b:2',3'-d]silole (2BrDTS),5 3,6-bis-(5-bromo-thiophen-2-yl)-2,5-di-n-octyl-pyrrolo[3,4-c]pyrrole-1,4-dione (2BrDPP)6 were synthesized following the literature methods.
A mixture of N,N’-di(n-octyl)-2-(tri-n-butylstannyl)naphthalene-1,4,5,8-tetracarboxylic acid diimide 6 (858 mg, 1.1 mmol) and dibrominated π-conjugated heterocyclic derivatives 7 (0.5 mmol), in the presence of Pd(PPh3)4 (58 mg, 0.05 mmol) and CuI (10mg, 0.052mmol) reflux in dry toluene (30 ml) under argon for 12 h, after cooling to room temperature, the solvent was concentrated via rotary evaporation. The crude product was purified by silica gel chromatography (petroleum ether/dichloromethane (1:5 in v/v) to dichloromethane), followed by recrystallization from dichloromethane/methanol to yield a pure product.
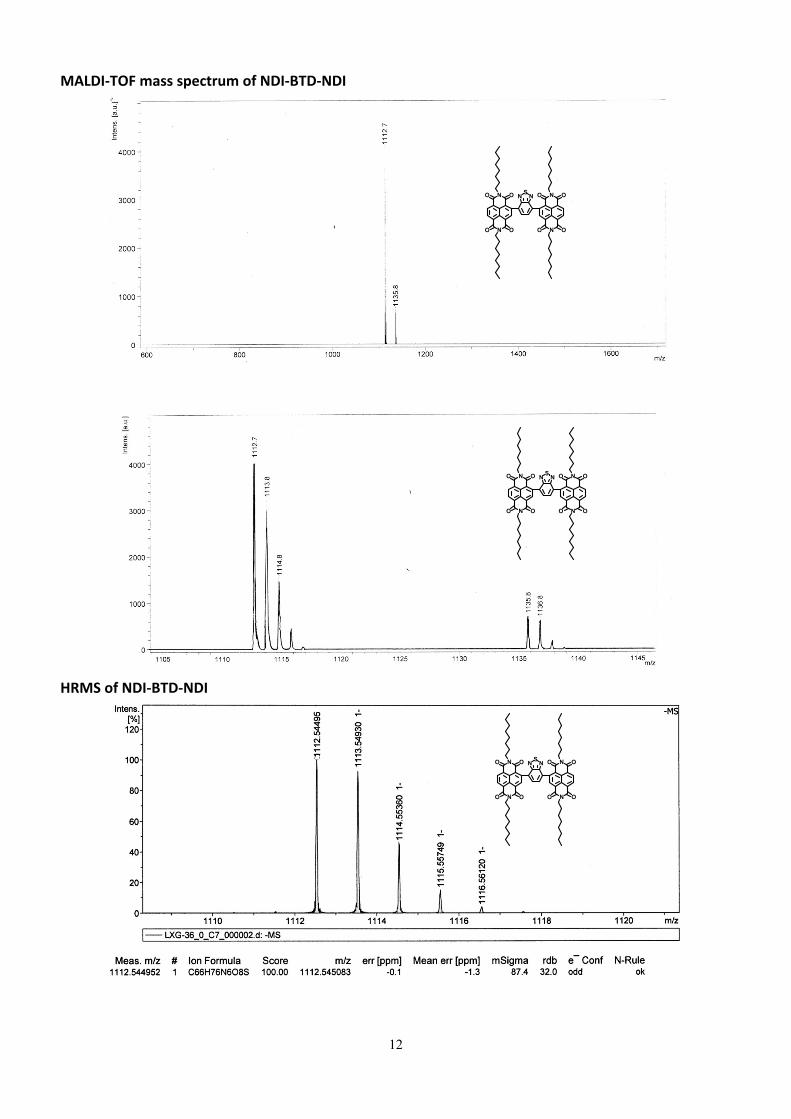
Compound 1. NDI-BTD-NDI was obtained as a yellow solid (yield:65%). 1H NMR (400 MHz, CDCl3) δ 8.89-8.83 (m, 6H), 7.87 (s, 2H), 4.24 (t, J = 7.4 Hz, 4H), 3.99 (t, J = 7.2 Hz, 4H), 1.78-1.73 (m, 4H), 1.64-1.57 (m, 4H), 1.44-1.22 (m, 40H), 0.89-0.82 (m, 12H). 13C NMR (100 MHz, CDCl3) δ 163.10, 162.88, 162.85, 162.47, 153.41, 142.08, 135.34, 134.89, 131.78, 131.33, 128.08, 127.85, 127.37, 126.97, 126.90, 126.29, 125.26, 41.33, 41.29, 32.11, 32.09, 29.63, 29.61, 29.50, 28.40, 28.31, 27.38, 27.31, 22.95, 22.92, 14.40, 14.37. MS (MALDI-TOF): cacld for M-, 1112.5; found, 1112.7. HRMS (MALDI-TOF, [M]-, m/z): calcd for C66H76N6O8S, 1112.54508; found, 1112.54495.
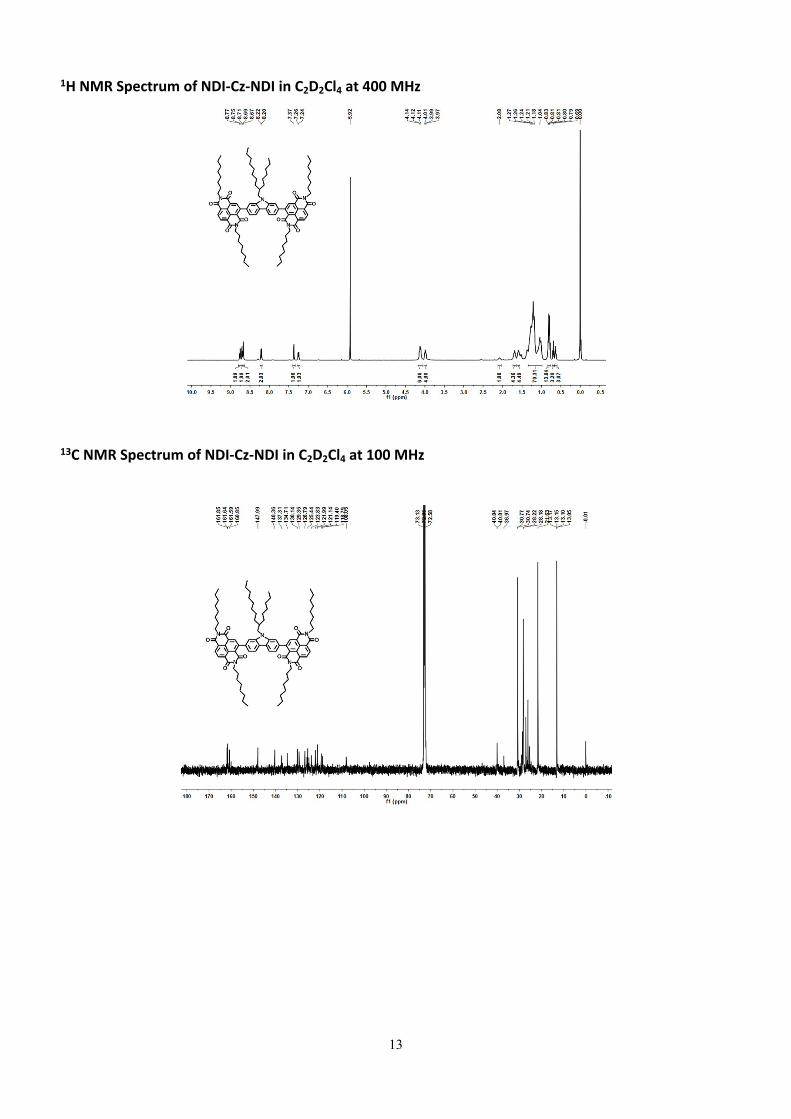
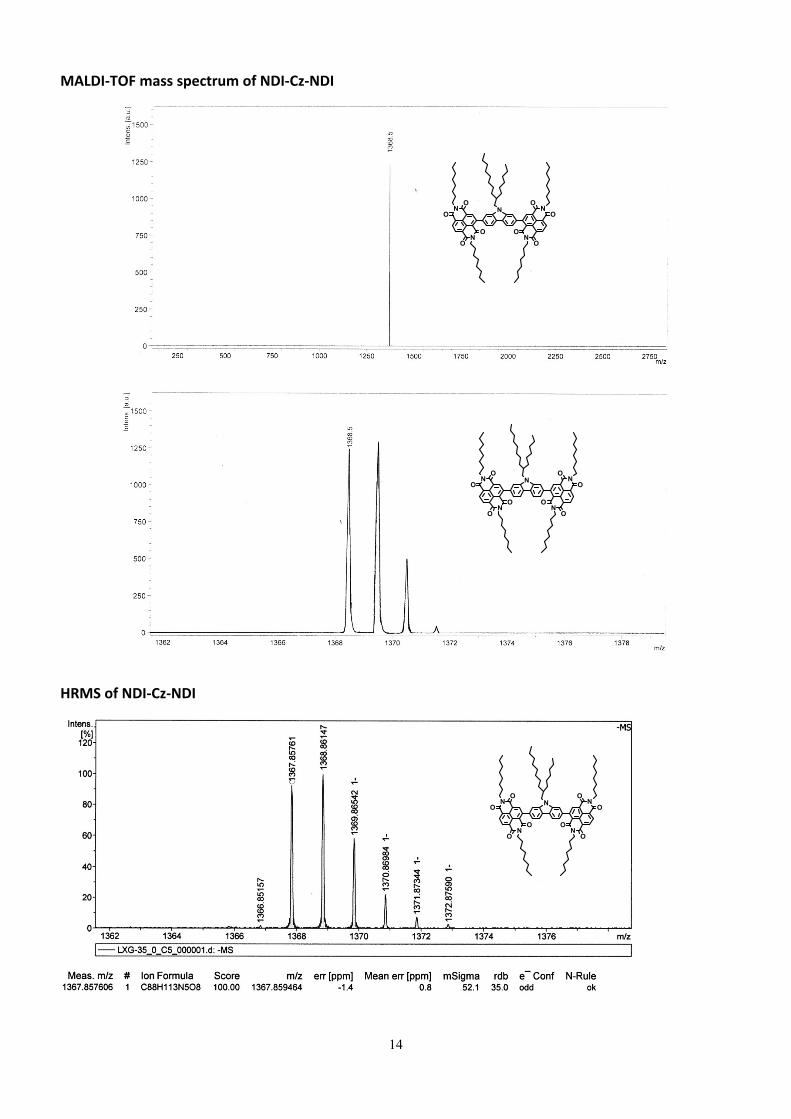
Compound 2. NDI-Cz-NDI was obtained as a purple solid (yield: 45%). 1H NMR (400 MHz, 1,1,2,2-tetrachloroethane-d2) δ 8.76 (d, J = 7.6 Hz, 2H), 8.70 (d, J = 7.6 Hz, 2H), 8.67 (s, 2H), 8.21 (d, J = 8.0 Hz, 2H), 7.37 (s, 2H), 7.25 (d, J = 8.0 Hz, 2H), 4.12 (t, J = 6.0 Hz, 6H), 3.99 (t, J = 8.0 Hz, 4H), 2.08 (s, 1H), 1.74-1.65 (m, 4H), 1.64-1.56 (m, 4H), 1.42-0.96 (m, 64H), 0.83-0.77 (m, 12H), 0.69 (t, J = 8.0 Hz, 3H), 0.63 (t, J = 6.0 Hz, 3H). 13C NMR (100 MHz, CDCl3) δ 161.85, 161.64, 161.59, 160.85, 147.99, 140.36, 137.31, 134.71, 130.14, 129.35, 126.79, 125.81, 125.44, 124.90, 123.83, 121.99, 121.14, 119.40, 118.79, 108.05, 40.04, 40.01, 36.97, 30.77, 30.74, 28.97, 28.61, 28.57, 28.36, 28.27, 28.22, 28.18, 27.10, 27.04, 26.15, 26.08, 25.37, 21.63, 21.55, 13.17, 13.15, 13.10, 13.05. MS (MALDI-TOF): cacld for M-, 1367.9; found, 1368.5. HRMS (MALDI-TOF, [M]-, m/z): calcd for C88H113N5O8, 1367.85946; found, 1367.85761.
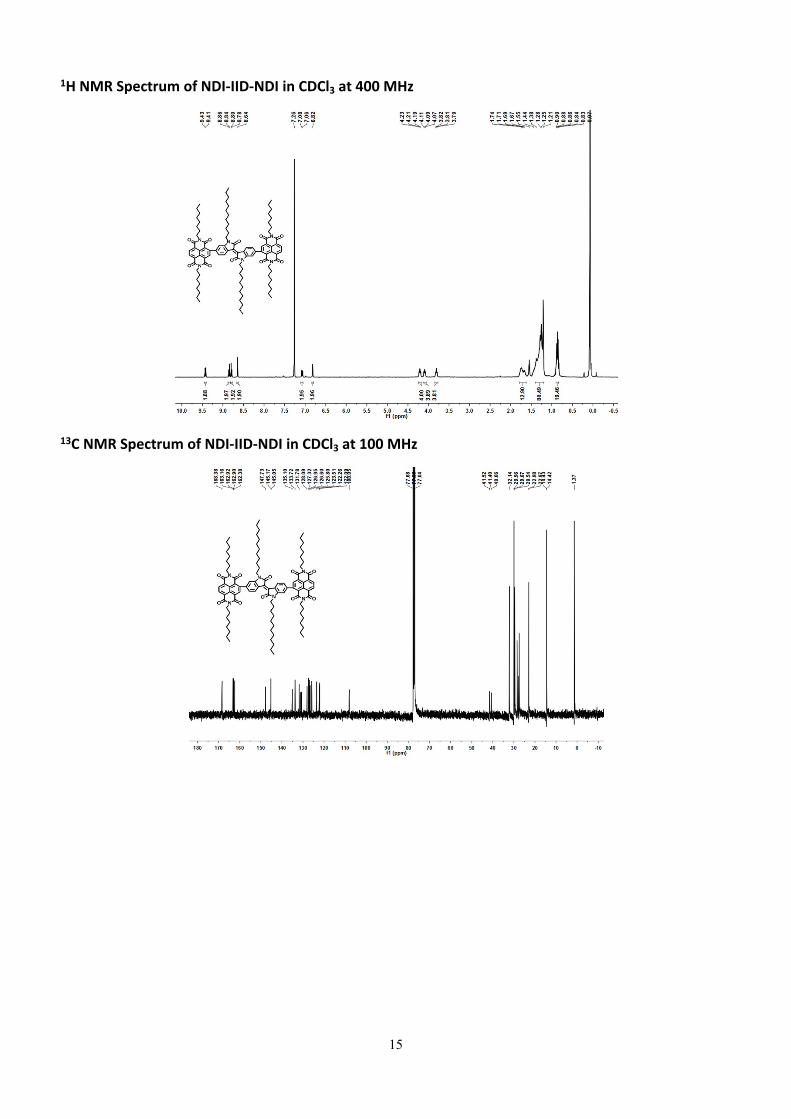
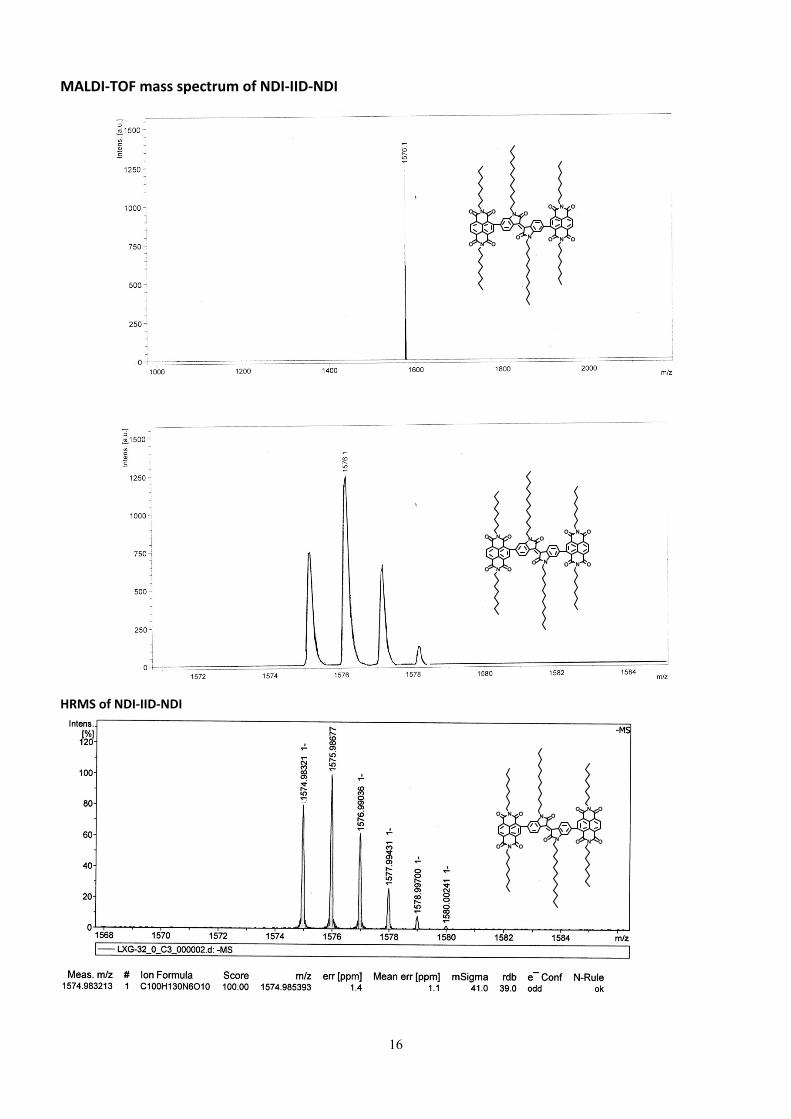
Compound 3. NDI-IID-NDI was obtained as a dark gray solid (yield: 65%). 1H NMR (400 MHz, CDCl3) δ 9.42 (d, J = 8.2 Hz, 2H), 8.85 (d, J = 7.6 Hz, 2H), 8.79 (d, J = 7.6 Hz, 2H), 8.64 (s, 2H), 7.07 (d, J = 8.2 Hz, 2H), 6.82 (s, 2H), 4.21 (t, J = 7.6 Hz, 4H), 4.09 (t, J = 7.6 Hz, 4H), 3.81 (t, J = 7.2 Hz, 4H), 1.74-1.67 (m, 12H), 1.44-1.21 (m, 76H), 0.90-0.83 (m, 18H). 13C NMR (100 MHz, CDCl3) δ 168.38, 163.16, 162.92, 162.90, 162.38, 147.73, 145.17, 145.05, 135.10, 133.72, 131.78, 131.07, 130.73, 128.09, 127.32, 126.95, 126.60, 125.80, 123.51, 122.26, 122.09, 108.05, 41.52, 41.40, 40.66, 32.14, 29.96, 29.92, 29.75, 29.67, 29.64, 29.58, 29.54, 28.44, 27.90, 27.48, 27.43, 23.01, 22.98, 22.97, 14.43, 14.42. MS (MALDI-TOF): cacld for M-, 1576.0; found, 1576.1. HRMS (MALDI-TOF, [M-1]-, m/z): calcd for C100H130N6O10, 1574.98539; found, 1574.98321.
4
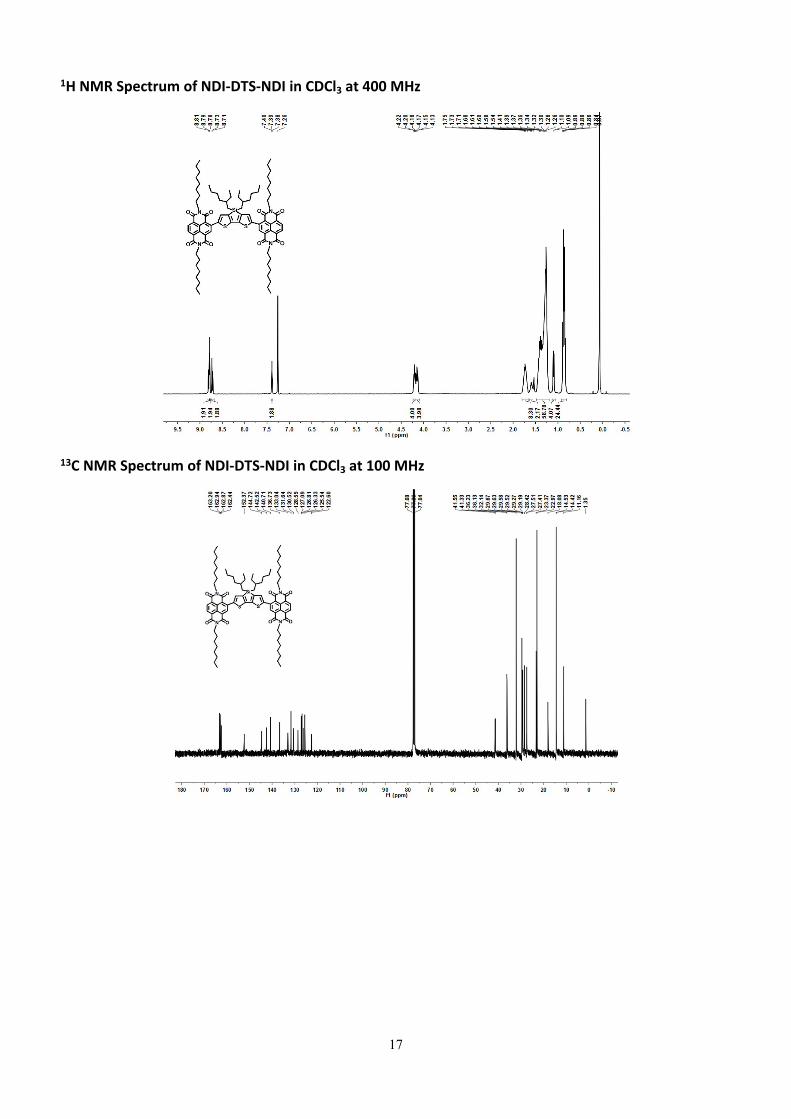
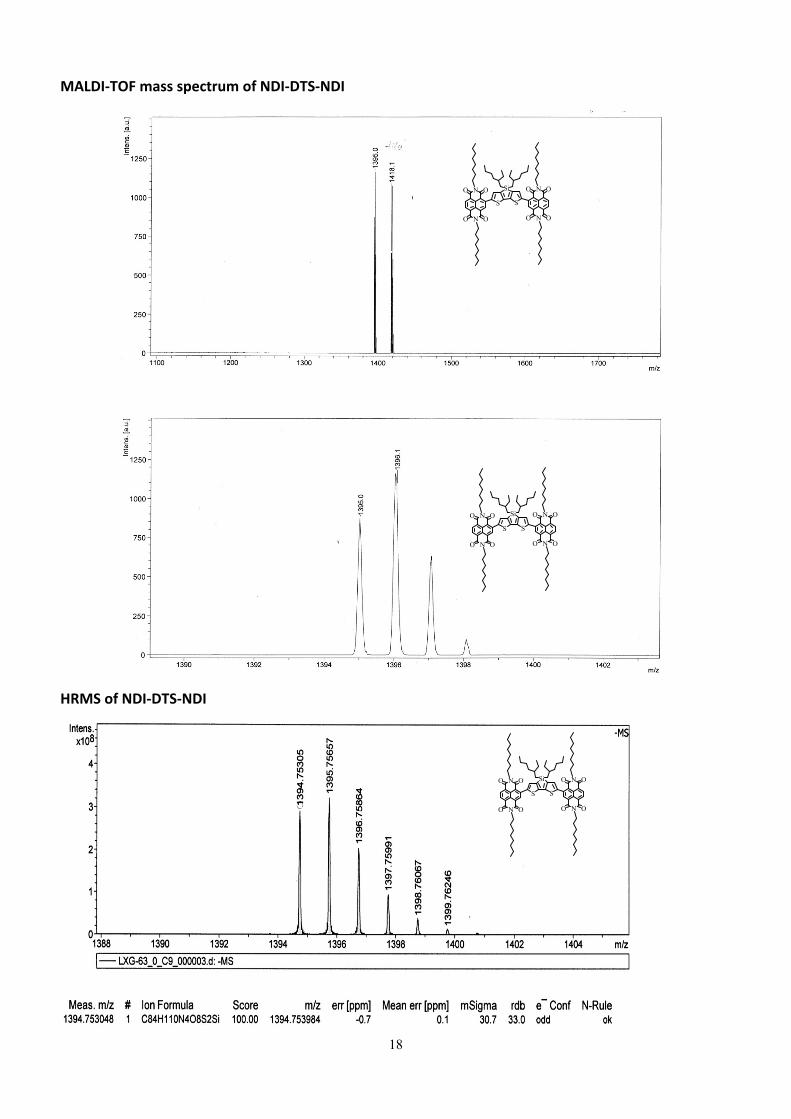
Compound 4. NDI-DTS-NDI was obtained as a dark blue solid (yield: 35%). 1H NMR (400 MHz, CDCl3) δ 8.80 (d, J = 7.6 Hz, 2H), 8.78 (s, 2H), 8.72 (d, J = 7.6 Hz, 2H), 7.39 (t, J = 2.8 Hz, 2H), 4.20 (t, J = 8.0 Hz, 4H), 4.15 (t, J = 8.0 Hz, 4H), 1.75-1.68 (m, 8H), 1.61-1.56 (m , 2H), 1.41-1.26 (m, 56H), 1.10 (d, J = 6.8 Hz, 4H), 0.89-0.84 (m, 24H). 13C NMR (100 MHz, CDCl3) δ 163.20, 162.94, 162.87, 162.44, 152.37, 144.72, 142.52, 140.71, 136.73, 133.04, 131.64, 130.52, 128.55, 127.09, 126.81, 126.33, 125.54, 122.60, 41.55, 41.33, 36.23, 36.13, 32.14, 29.67, 29.63, 29.58, 29.52, 29.27, 29.19, 28.42, 27.51, 27.41, 23.37, 22.97, 18.08, 14.53, 14.42, 11.16. MS (MALDI-TOF): cacld for M-, 1394.8; found, 1395.0. HRMS (MALDI-TOF, [M]-, m/z): calcd for C84H110N4O8S2Si, 1394.75398; found, 1394.75305.
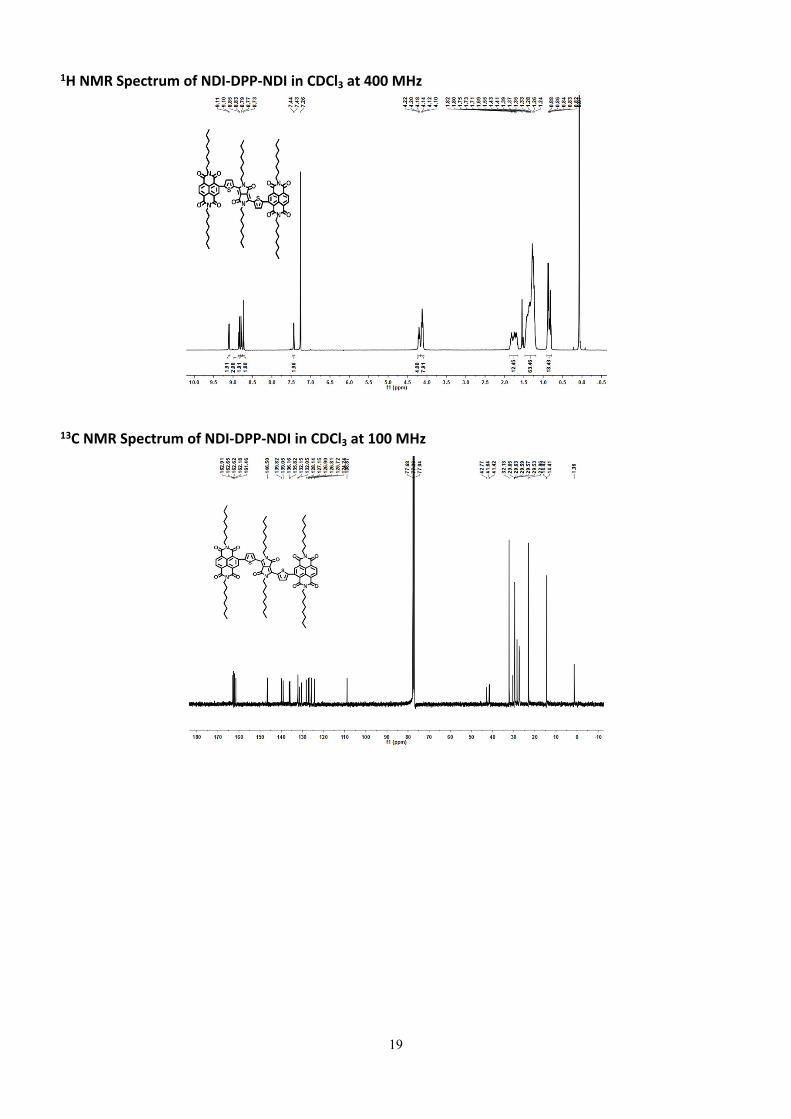
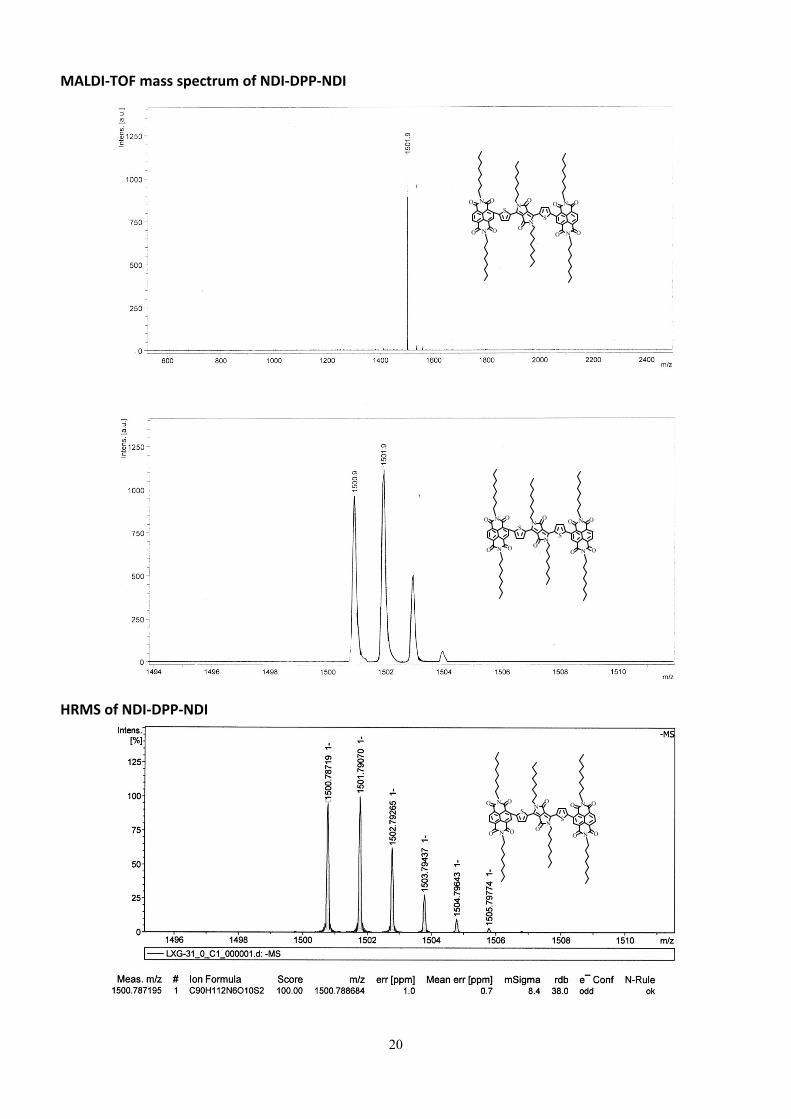
Compound 5. NDI-DPP-NDI was obtained as a dark purple solid (yield:30%). 1H NMR (400 MHz, CDCl3, 298K) δ 9.10 (d, J = 4.0 Hz, 2H), 8.83 (d, J = 7.6 Hz, 2H), 8.76 (d, J = 7.6 Hz, 2H), 8.70 (s, 2H), 7.45 (d, J = 4.0 Hz, 2H), 4.18 (t, J = 7.2 Hz, 4H), 4.12 (t, J = 7.6 Hz, 8H), 1.84-1.68 (m, 12H), 1.43-1.24 (m, 60H), 0.89-0.80 (m, 18H). 13C NMR (100 MHz, CDCl3, 298K) δ 162.91, 162.65, 162.62, 162.18, 161.46, 146.50, 139.82, 139.05, 136.16, 135.82, 132.15, 132.05, 131.43, 130.42, 128.14, 127.15, 126.90, 126.81, 125.72, 124.24, 108.87, 42.77, 41.64, 41.42, 32.13, 30.42, 29.65, 29.63, 29.59, 29.57, 29.53, 28.41, 27.48, 27.41, 27.29, 22.97, 22.96, 14.42, 14.41. MS (MALDI-TOF): cacld for M-, 1501.8; found, 1501.9. HRMS (MALDI-TOF, [M]-, m/z): calcd for C90H112N6O10S2, 1500.78868; found, 1500.78719.
Material Characterization. 1H NMR and 13C NMR spectra were recorded in deuterated solvents on a Bruker ADVANCE 400 NMR Spectrometer. 1H NMR chemical shifts were reported in ppm downfield from tetramethylsilane (TMS) reference using the residual protonated solvent as an internal standard. Mass spectra (MALDI-TOF-MS) were determined on a Bruker BIFLEX III Mass Spectrometer. HR-MS measurements were performed on a Bruker APEX II FT-ICRMS spectrometer. Differential scanning calorimetry (DSC) analyses were recorded using a TA DSC 2010 instrument under a dry nitrogen flow, heating from room temperature to 400 °C and cooling from 400 °C to room temperature at a rate of 10 °C min-1. Thermogravimetric analysis (TGA) was performed on a Shimadzu DTG 60 instrument at a heating rate of 10 °C min-1 under a N2 atmosphere with runs recorded from room temperature to 550 °C and reported decomposition temperatures represent the temperature observed at 5 % mass loss.
Absorption spectra were measured with JΛSCO V-570 UV-vis spectrophotometer in a 1-cm quartz cell. Cyclic Voltammograms (CVs) were recorded on a Zahner IM6e electrochemical workstation at a scan rate of 100 mV s-1, with glassy carbon discs as the working electrode, Pt wire as the counter electrode, and Ag/Ag+ electrode as the reference electrode. 0.1 M tetrabutylammonium hexafluorophosphate (Bu4NPF6) dissolved in CH2Cl2 (HPLC grade) was employed as the supporting electrolyte. DFT calculation of the A-D-A molecules and their parent donor and acceptor units were carried out with the Gaussian09 program package by using B3LYP method and 6-31G basis set. The equilibrium structures of a given molecule was also predicted by optimizing geometry to locate the minima on the potential energy surface.7 Ultraviolet photoemission spectroscopy (UPS) measurements were carried out on a KRATOS Axis Ultra DLD spectrometer with a base pressure better than 2 × 10⁻⁹ Torr and He I (hv = 21.22 eV) as the excitation source. To obtain the secondary electron cutoff (SECO), a sample bias of -9 V was applied in the normal emission geometry. For all the UPS spectra, The Fermi level (EF) of the systemwas calibrated from a UPS spectrum of sputtered clean (Ar+ ion) Au substrate and referenced as the zero binding energy. X-Ray diffraction (XRD) measurements of thin films were performed in reflection mode at 40 kV and 200 mA with Cu Kα radiation using a 2 kW Rigaku X-ray diffractometer. Atomic force microscopy (AFM) images of the thin films were obtained on a Nanoscope IIIa AFM (Digital Instruments) operating in tapping mode. High-quality single crystals of NDI-DTS-NDI was grown from a toluene solution at room temperature. X-ray diffraction intensity data were
5
collected at 173 K on a Saturn724 + CCD diffractometer with graphite monochromated Mo K\α radiation. And the structure and refinement were carried out using the Crystal Clear (Rigaku Inc., 2008). Grazing incidence X-ray diffraction (GIXD) measurements are performed on Beamline 7.3.3 at ChemComm Page 6 of 15 S3 the Advanced Light Source (ALS) at the Lawrence Berkeley National Laboratory. An X-ray beam impinged onto the sample at a grazing angle above and below the critical angle of the polymer film (αc = 0.16) but below the critical angle of the silicon substrate (αc = 0.22). The wavelength of X-rays used is 1.240 Å, and the scattered intensity is detected by PILATUS 1M detector.
Device Fabrication and Characterization. Organic thin film transistors (OTFTs) based on these five compounds with a bottom-gate top-contact (BGTC) geometry were fabricated on a highly n-doped silicon wafer with a 300 nm thermally oxidized SiO2 dielectric layer (Ci = 11 nF/cm2), where the silicon served as the gate electrode and oxide layer was the insulator. Prior to fabricating the semiconductors, the silanol groups on SiO2 surface were passivated by modifying the surface with n-octadecyltrimethoxylsilane (OTS) monolayer to reduce electron trapping. Thereafter, ~ 40 nm thin films of NDI-π-NDI were spin-coated on the OTS modified substrates from their CHCl3/hexane (2:1-4:1 v/v) solution (10 mg/mL) at 2500 rpm for 30 s. Then, the thin films were thermally annealed each for ~ 60 min in a vacuum chamber at various temperatures, 20 °C, 80 °C, 140 °C, 200 °C, 230 °C, 260 °C. The devices were finished by thermally evaporating gold source and drain contacts (20 nm thickness) through a copper grid shadow mask with W/L of ca. 200/25.
The performances of the OTFTs were characterized at room temperature using a Keithley 4200 parameter analyzer in a N2-filled glove box. The mobility is calculated from the saturation region with the following equation: IDS = (W/2L)Ciμ(VG-VT)2, where IDS is the drain-source current, W is the channel width, L is the channel length, μ is the field-effect mobility, Ci is the capacitance per unit area of the gate dielectric layer, and VG and VT are the gate voltage and threshold voltage, respectively.
6
100 200 300 400
Temperature (°C)
1
2
34
5
100 200 300 400 500 60020
40
60
80
100
Wei
ght (
%)
Temperature (°C)
1 2 3 4 5
(a) (b)
Figure S1. (a) Thermogravimetric analysis and (b) differential scanning calorimetry analysis of compounds 1-5
HOMO
LUMO
BTD Cz IID DTS DPPNDI
-7.22 eV
-3.95 eV
-6.83 eV -5.64 eV -5.84 eV -5.53 eV -5.48 eV
-3.12 eV -1.90 eV -3.38 eV -2.29 eV -3.15 eV
Figure S2. Electron-state density distribution of the HOMO and LUMO orbitals for NDI, BTD, Cz, IID, DTS and DPP calculated using DFT/ B3LYP and the 6-31G basis set in their optimized ground-state structures and their correspondingly calculated HOMO/LUMO energy levels.
Table S1. Calculated HOMO/LUMO energy levels, band gaps, and torsion angles of D-A compounds 1-5.Compounds HOMO (eV) LUMO (eV) Band Gap (eV) Torsion Angle (deg)
1 -6.69 -3.95 2.74 67.62/67.61
2 -5.92 -3.90 2.02 46.30/47.37
3 -5.92 -3.93 1.99 84.42/84.43
4 -5.71 -3.95 1.76 59.99/59.97
5 -5.43 -4.04 1.39 85.86/88.26
We also predict the minimum-energy conformation of the five small molecules, but the calculated dihedral angles between the donor and acceptor unit seemed out of step with our experimental analysis and prediction, which might owe to the absence consideration of the influence of alkyl chain on the conformation and more importantly the neglect of the influence of the molecular chemical environment.

7
8
300 400 500 600 700 800
0.2
0.4
0.6
0.8
1.0
Norm
alize
d Ab
sorb
ance
(a. u
.)Wavelength (nm)
Pristine 80 ℃ 140 ℃ 200 ℃ 260 ℃
300 400 500 600 700 8000.0
0.2
0.4
0.6
0.8
1.0
Pristine 80 ℃ 140 ℃ 200 ℃ 260 ℃
Norm
aliz
ed A
bsor
banc
e (a
. u.)
Wavelength (nm)
(a) (b) (c)
(d) (e)
300 400 500 600 700
0.2
0.4
0.6
0.8
1.0
545 nm
527 nm
Norm
aliz
ed A
bsor
banc
e (a
. u.)
Wavelength (nm)
Pristine 80 ℃140 ℃ 200 ℃ 260 ℃
400 600 800 1000
0.2
0.4
0.6
0.8
1.0
1.2
820 nm
896 nm
Norm
aliz
ed A
bsor
banc
e (a
. u.)
Wavelength (nm)
Pristine 80 ℃ 140 ℃ 200 ℃
300 600 900 12000.0
0.2
0.4
0.6
0.8
1.0
1.2
Norm
alize
d Ab
sorb
ance
(a. u
.)
Wavelength (nm)
Pristine 80 ℃ 140 ℃ 200 ℃ 260 ℃
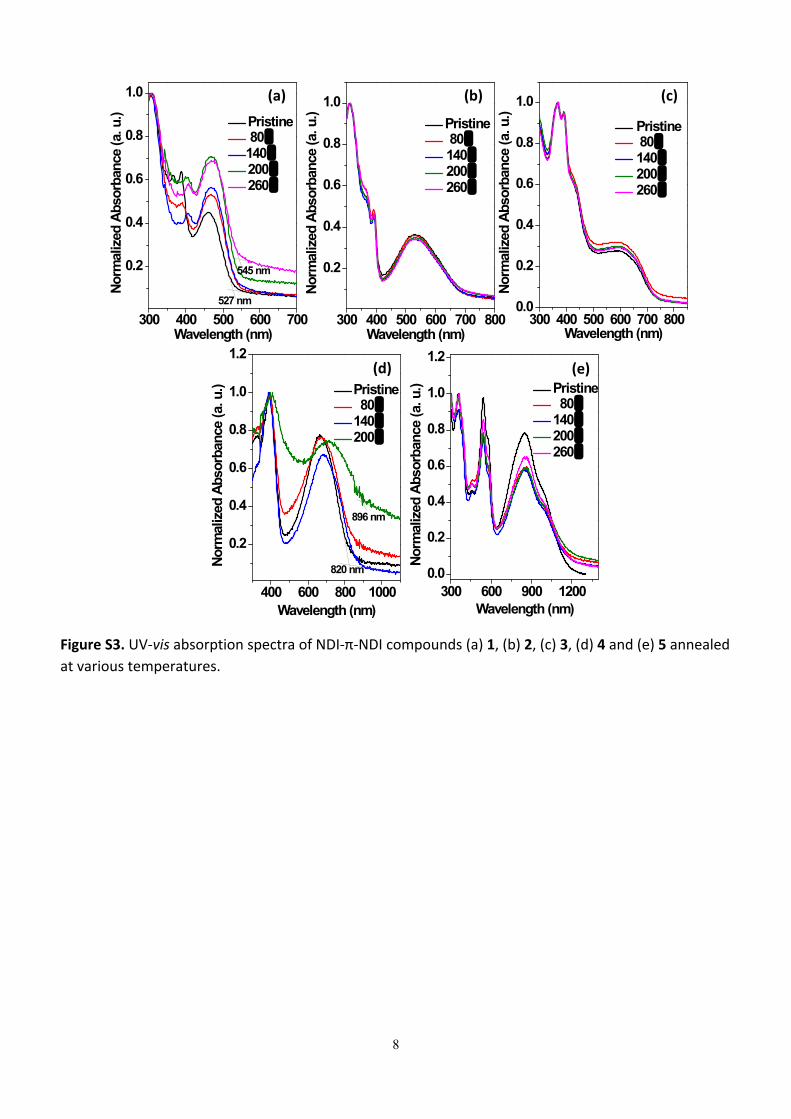
Figure S3. UV-vis absorption spectra of NDI-π-NDI compounds (a) 1, (b) 2, (c) 3, (d) 4 and (e) 5 annealed at various temperatures.
9
20 19 18 17 16
17.01
17.32
17.12
Inte
nsity
(a.u
.)
Binding Energy (eV)
SECO
1
2
3
4
5 16.92
17.19
4 3 2 1 0
Binding Energy (eV)
HOMO
2.80
1.97
1.79
1.07
1.45
EF
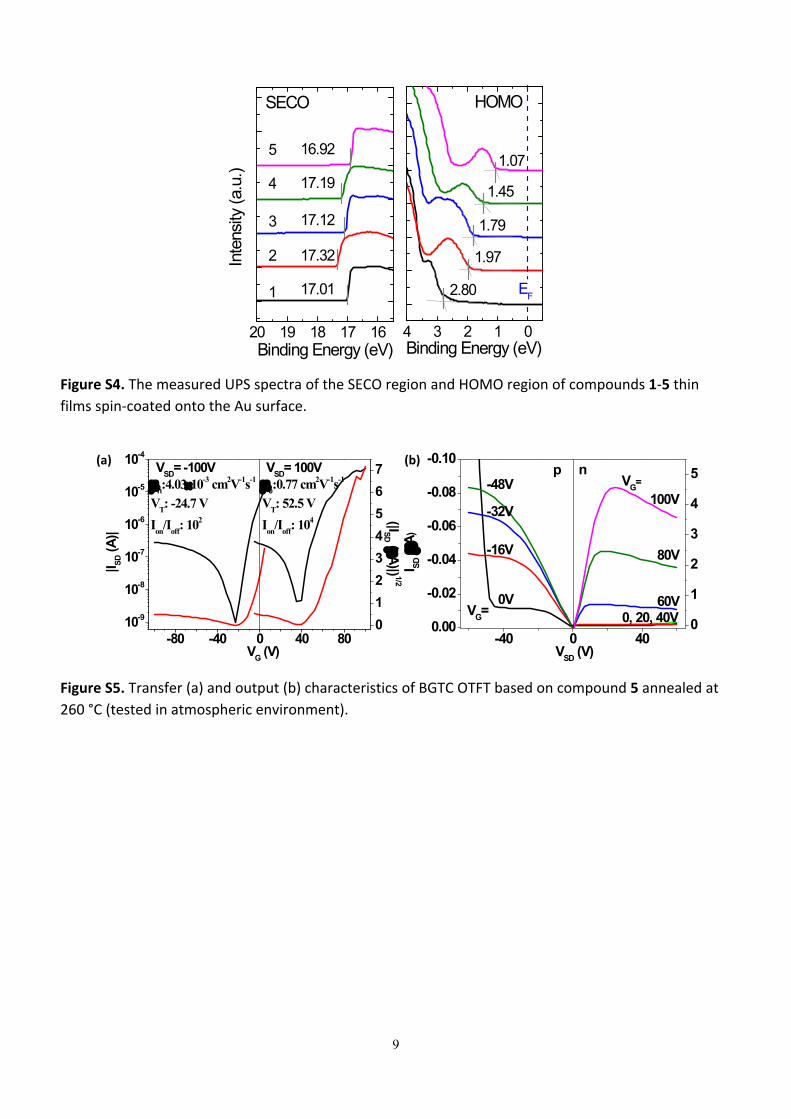
Figure S4. The measured UPS spectra of the SECO region and HOMO region of compounds 1-5 thin films spin-coated onto the Au surface.
-40 0 400.00
-0.02
-0.04
-0.06
-0.08
-0.10
VG=
-48V
-32V
-16V
0V0, 20, 40V
60V
80V
n
I SD (
A)
VSD (V)
p
100VVG=
0
1
2
3
4
5
-80 -40 0 40 8010-9
10-8
10-7
10-6
10-5
10-4
h:4.0310-3 cm2V-1s-1
VT: -24.7 VIon/Ioff: 102
VSD= 100VVSD= -100V
VG (V)
|I SD (A
)|
e:0.77 cm2V-1s-1
VT: 52.5 VIon/Ioff: 104
01234567
(|ISD (A)|) 1/2
(a) (b)
Figure S5. Transfer (a) and output (b) characteristics of BGTC OTFT based on compound 5 annealed at 260 °C (tested in atmospheric environment).
10
(1a) (2b)(2a)
(3a) (5a)
(1b)
(5b)(3b)
80℃ 230℃
d=2.2nm
0nm
30nm
0nm
80nm
0nm
80nm 100nm
0nm80℃ 230℃
80℃ 230℃
80℃ 230℃
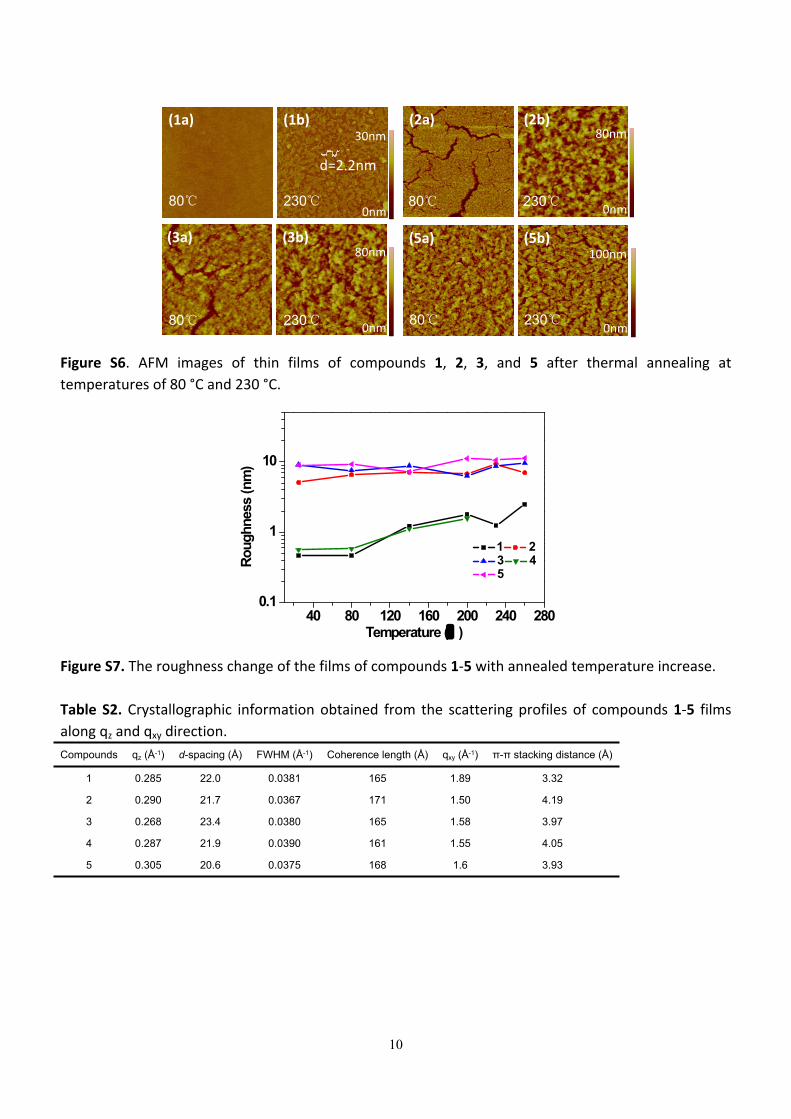
Figure S6. AFM images of thin films of compounds 1, 2, 3, and 5 after thermal annealing at temperatures of 80 °C and 230 °C.
40 80 120 160 200 240 2800.1
1
10
1 2 3 4 5
Roug
hnes
s (n
m)
Temperature (℃ )
Figure S7. The roughness change of the films of compounds 1-5 with annealed temperature increase.
Table S2. Crystallographic information obtained from the scattering profiles of compounds 1-5 films along qz and qxy direction.Compounds qz (Å-1) d-spacing (Å) FWHM (Å-1) Coherence length (Å) qxy (Å-1) π-π stacking distance (Å)
1 0.285 22.0 0.0381 165 1.89 3.32
2 0.290 21.7 0.0367 171 1.50 4.19
3 0.268 23.4 0.0380 165 1.58 3.97
4 0.287 21.9 0.0390 161 1.55 4.05
5 0.305 20.6 0.0375 168 1.6 3.93
11
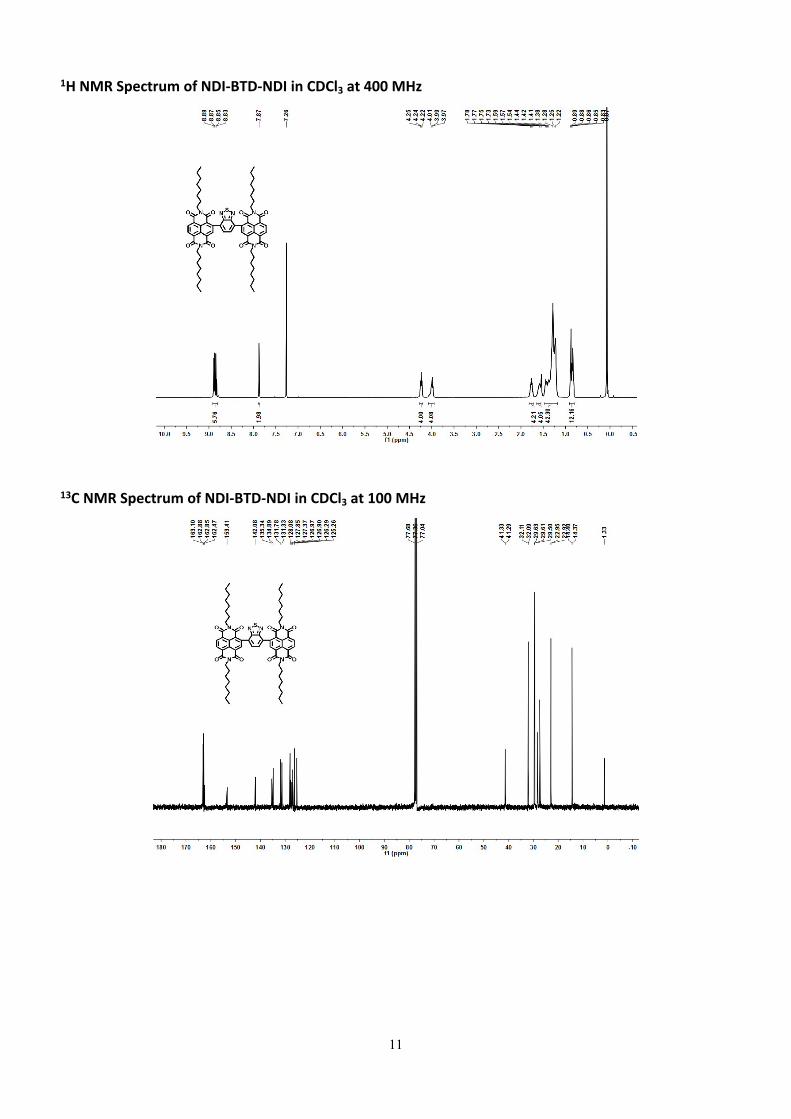
1H NMR Spectrum of NDI-BTD-NDI in CDCl3 at 400 MHz
13C NMR Spectrum of NDI-BTD-NDI in CDCl3 at 100 MHz
12
MALDI-TOF mass spectrum of NDI-BTD-NDI
HRMS of NDI-BTD-NDI
N
NO O
O O
NSN N
N
O O
O O
N
NO O
O O
NSN N
N
O O
O O
N
NO O
O O
NSN N
N
O O
O O
13
1H NMR Spectrum of NDI-Cz-NDI in C2D2Cl4 at 400 MHz
13C NMR Spectrum of NDI-Cz-NDI in C2D2Cl4 at 100 MHz
14
MALDI-TOF mass spectrum of NDI-Cz-NDI
HRMS of NDI-Cz-NDI
N
N
N
N
OO
OO
OO
OON
N
N
N
N
OO
OO
OO
OON
N
N
N
N
OO
OO
OO
OON
15
1H NMR Spectrum of NDI-IID-NDI in CDCl3 at 400 MHz
13C NMR Spectrum of NDI-IID-NDI in CDCl3 at 100 MHz
16
MALDI-TOF mass spectrum of NDI-IID-NDI
HRMS of NDI-IID-NDI
N
N O
O N
N
N
NO O
O O
O O
O O
N
N O
O N
N
N
NO O
O O
O O
O O
N
N O
O N
N
N
NO O
O O
O O
O O
17
1H NMR Spectrum of NDI-DTS-NDI in CDCl3 at 400 MHz
13C NMR Spectrum of NDI-DTS-NDI in CDCl3 at 100 MHz
18
MALDI-TOF mass spectrum of NDI-DTS-NDI
HRMS of NDI-DTS-NDI
Si
SS
O N O
N OO
O N O
N OO
Si
SS
O N O
N OO
O N O
N OO
Si
SS
O N O
N OO
O N O
N OO
19
1H NMR Spectrum of NDI-DPP-NDI in CDCl3 at 400 MHz
13C NMR Spectrum of NDI-DPP-NDI in CDCl3 at 100 MHz
20
MALDI-TOF mass spectrum of NDI-DPP-NDI
HRMS of NDI-DPP-NDI
N
N
O
OS
SO N O
N OO
O N O
N OO
N
N
O
OS
SO N O
N OO
O N O
N OO
N
N
O
OS
SO N O
N OO
O N O
N OO
21
Reference:1 L. E. Polander, A. S. Romanov, S. Barlow, D. K. Hwang, B. Kippelen, T. V. Timofeeva, S. R. Marder,
Org. Lett., 2012, 14, 918-921.2 B. Wang, S.-W. Tsang, W. Zhang, Y. Tao, M. S. Wong, Chem. Commun., 2011, 47, 9471-9473.3 F. Lemasson, N. Berton, J. Tittmann, F. Hennrich, M. M. Kappes, M. Mayor, Macromoleculesm
2011, 45, 713-722..4 T. Lei, Y. Cao, Y. Fan, C.-J. Liu, S.-C. Yuan, J. Pei, J. Am. Chem. Soc., 2011, 133, 6099-6101.5 J. Hou, H.-Y. Chen, S. Zhang, G. Li, Y. Yang, J. Am. Chem. Soc., 2008, 130, 16144-16145.6 A. B. Tamayo, M. Tantiwiwat, B. Walker, T.-Q. Nguyen, J. Phys. Chem. C, 2008, 112, 15543-15552.7 Y. Zhu, A. P. Kulkarni, P.-T. Wu, S. A. Jenekhe, Chem. Mater., 2008, 20, 4200-4211.


![Supporting Information - Royal Society of Chemistry · Supporting Information N-Heterocyclic Carbene-Catalyzed [3+2] Annulation of Bromoenals with 3-Aminooxindoles: Highly Enantioselective](https://static.fdocument.org/doc/165x107/5f0dee5b7e708231d43cc95a/supporting-information-royal-society-of-supporting-information-n-heterocyclic.jpg)