Supplementary Table 1: Metabolite concentration file4.5 mol% 2.5 A600 that correspond to 2.5-5 ×...
13
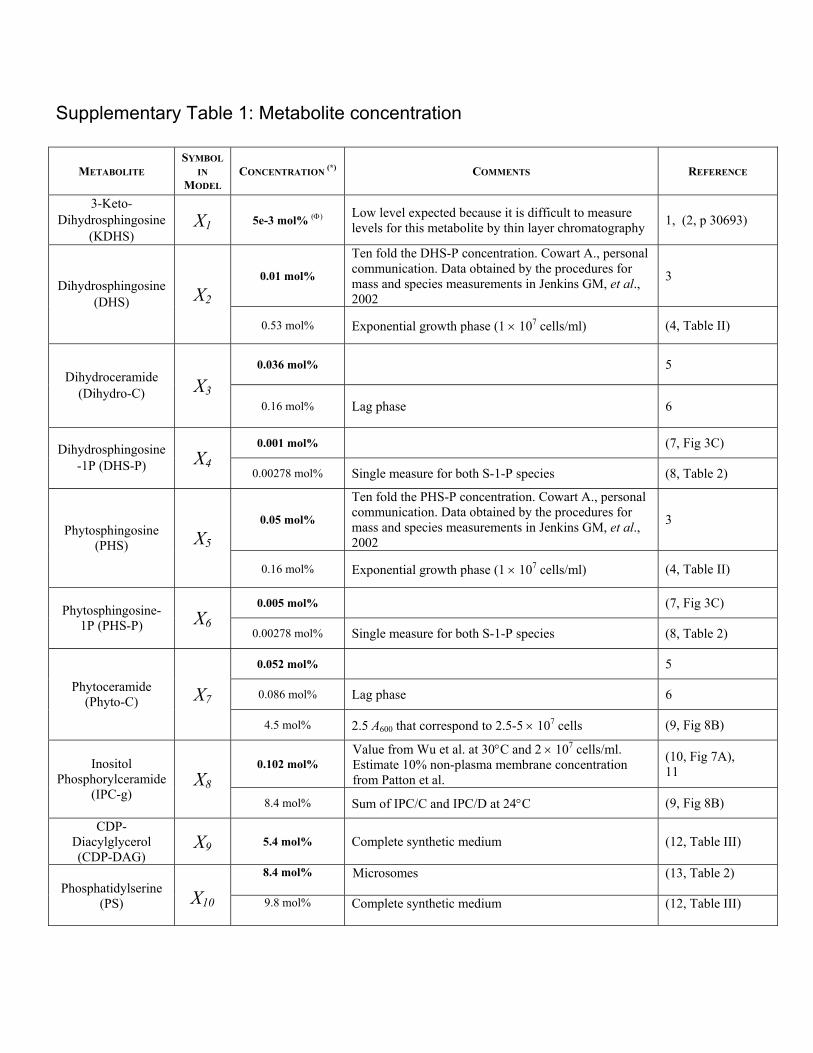
Supplementary Table 1: Metabolite concentration METABOLITE SYMBOL IN MODEL CONCENTRATION (*) COMMENTS REFERENCE 3-Keto- Dihydrosphingosine (KDHS) X 1 5e-3 mol% (Φ) Low level expected because it is difficult to measure levels for this metabolite by thin layer chromatography 1, (2, p 30693) 0.01 mol% Ten fold the DHS-P concentration. Cowart A., personal communication. Data obtained by the procedures for mass and species measurements in Jenkins GM, et al., 2002 3 Dihydrosphingosine (DHS) X 2 0.53 mol% Exponential growth phase (1 × 10 7 cells/ml) (4, Table II) 0.036 mol% 5 Dihydroceramide (Dihydro-C) X 3 0.16 mol% Lag phase 6 0.001 mol% (7, Fig 3C) Dihydrosphingosine -1P (DHS-P) X 4 0.00278 mol% Single measure for both S-1-P species (8, Table 2) 0.05 mol% Ten fold the PHS-P concentration. Cowart A., personal communication. Data obtained by the procedures for mass and species measurements in Jenkins GM, et al., 2002 3 Phytosphingosine (PHS) X 5 0.16 mol% Exponential growth phase (1 × 10 7 cells/ml) (4, Table II) 0.005 mol% (7, Fig 3C) Phytosphingosine- 1P (PHS-P) X 6 0.00278 mol% Single measure for both S-1-P species (8, Table 2) 0.052 mol% 5 0.086 mol% Lag phase 6 Phytoceramide (Phyto-C) X 7 4.5 mol% 2.5 A 600 that correspond to 2.5-5 × 10 7 cells (9, Fig 8B) 0.102 mol% Value from Wu et al. at 30°C and 2 × 10 7 cells/ml. Estimate 10% non-plasma membrane concentration from Patton et al. (10, Fig 7A), 11 Inositol Phosphorylceramide (IPC-g) X 8 8.4 mol% Sum of IPC/C and IPC/D at 24°C (9, Fig 8B) CDP- Diacylglycerol (CDP-DAG) X 9 5.4 mol% Complete synthetic medium (12, Table III) 8.4 mol% Microsomes (13, Table 2) Phosphatidylserine (PS) X 10 9.8 mol% Complete synthetic medium (12, Table III)
Transcript of Supplementary Table 1: Metabolite concentration file4.5 mol% 2.5 A600 that correspond to 2.5-5 ×...
Supplementary Table 1: Metabolite concentration
METABOLITE SYMBOL
IN MODEL
CONCENTRATION (*) COMMENTS REFERENCE
3-Keto-Dihydrosphingosine
(KDHS) X1 5e-3 mol% (Φ) Low level expected because it is difficult to measure
levels for this metabolite by thin layer chromatography 1, (2, p 30693)
0.01 mol%
Ten fold the DHS-P concentration. Cowart A., personal communication. Data obtained by the procedures for mass and species measurements in Jenkins GM, et al., 2002
3 Dihydrosphingosine
(DHS) X2
0.53 mol% Exponential growth phase (1 × 10⁷ cells/ml) (4, Table II)
0.036 mol% 5 Dihydroceramide
(Dihydro-C) X30.16 mol% Lag phase 6
0.001 mol% (7, Fig 3C) Dihydrosphingosine -1P (DHS-P) X4
0.00278 mol% Single measure for both S-1-P species (8, Table 2)
0.05 mol%
Ten fold the PHS-P concentration. Cowart A., personal communication. Data obtained by the procedures for mass and species measurements in Jenkins GM, et al., 2002
3 Phytosphingosine
(PHS) X5
0.16 mol% Exponential growth phase (1 × 10⁷ cells/ml) (4, Table II)
0.005 mol% (7, Fig 3C) Phytosphingosine-1P (PHS-P) X6
0.00278 mol% Single measure for both S-1-P species (8, Table 2)
0.052 mol% 5
0.086 mol% Lag phase 6 Phytoceramide (Phyto-C) X7
4.5 mol% 2.5 A600 that correspond to 2.5-5 × 10⁷ cells (9, Fig 8B)
0.102 mol% Value from Wu et al. at 30°C and 2 × 10⁷ cells/ml. Estimate 10% non-plasma membrane concentration from Patton et al.
(10, Fig 7A), 11 Inositol
Phosphorylceramide (IPC-g)
X88.4 mol% Sum of IPC/C and IPC/D at 24°C (9, Fig 8B)
CDP- Diacylglycerol (CDP-DAG)
X9 5.4 mol% Complete synthetic medium (12, Table III)
8.4 mol% Microsomes (13, Table 2) Phosphatidylserine
(PS)
X10 9.8 mol% Complete synthetic medium (12, Table III)
- 1 -
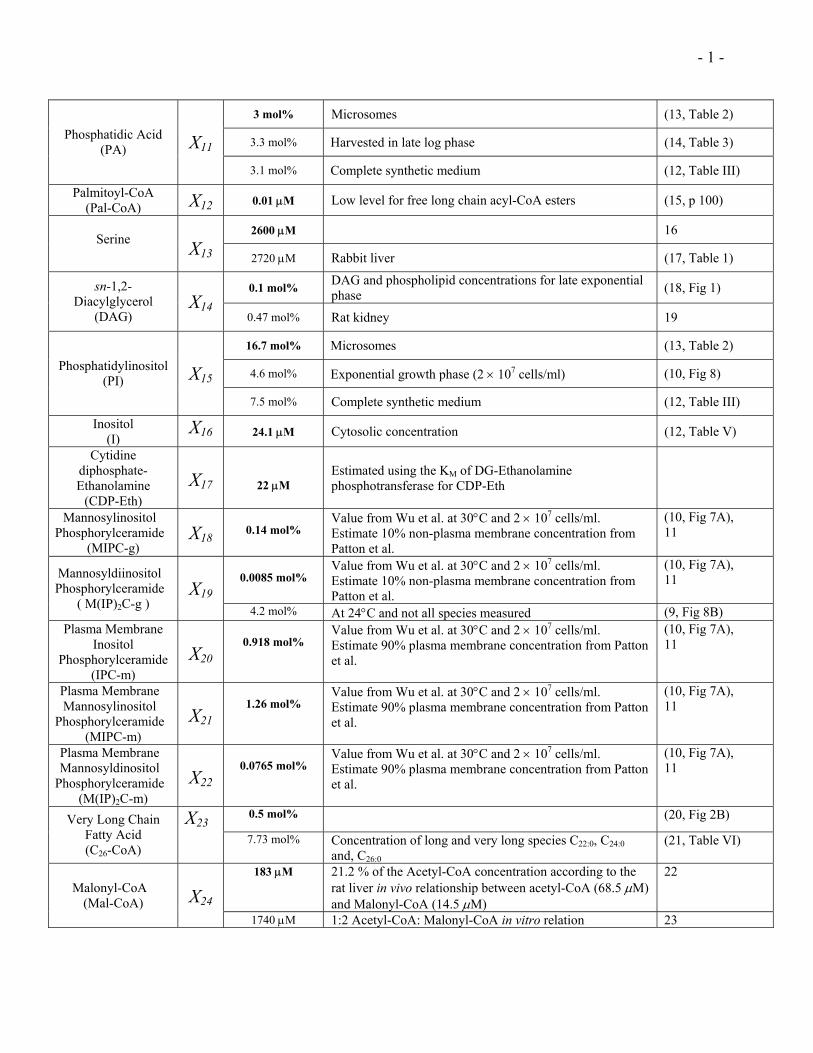
3 mol% Microsomes (13, Table 2)
3.3 mol% Harvested in late log phase (14, Table 3) Phosphatidic Acid (PA) X11
3.1 mol% Complete synthetic medium (12, Table III)
Palmitoyl-CoA (Pal-CoA) X12 0.01 µM Low level for free long chain acyl-CoA esters (15, p 100)
2600 µM 16 Serine
X13 2720 µM Rabbit liver (17, Table 1)
0.1 mol% DAG and phospholipid concentrations for late exponential phase (18, Fig 1) sn-1,2-
Diacylglycerol (DAG)
X140.47 mol% Rat kidney 19
16.7 mol% Microsomes (13, Table 2)
4.6 mol% Exponential growth phase (2 × 10⁷ cells/ml) (10, Fig 8) Phosphatidylinositol (PI) X15
7.5 mol% Complete synthetic medium (12, Table III)
Inositol (I)
X16 24.1 µM Cytosolic concentration (12, Table V)
Cytidine diphosphate- Ethanolamine
(CDP-Eth)
X17
22 µM
Estimated using the KM of DG-Ethanolamine phosphotransferase for CDP-Eth
Mannosylinositol Phosphorylceramide
(MIPC-g) X18
0.14 mol%
Value from Wu et al. at 30°C and 2 × 10⁷ cells/ml. Estimate 10% non-plasma membrane concentration from Patton et al.
(10, Fig 7A), 11
0.0085 mol%
Value from Wu et al. at 30°C and 2 × 10⁷ cells/ml. Estimate 10% non-plasma membrane concentration from Patton et al.
(10, Fig 7A), 11 Mannosyldiinositol
Phosphorylceramide ( M(IP)2C-g )
X194.2 mol% At 24°C and not all species measured (9, Fig 8B)
Plasma Membrane Inositol
Phosphorylceramide (IPC-m)
X20
0.918 mol%
Value from Wu et al. at 30°C and 2 × 10⁷ cells/ml. Estimate 90% plasma membrane concentration from Patton et al.
(10, Fig 7A), 11
Plasma Membrane Mannosylinositol
Phosphorylceramide (MIPC-m)
X21
1.26 mol%
Value from Wu et al. at 30°C and 2 × 10⁷ cells/ml. Estimate 90% plasma membrane concentration from Patton et al.
(10, Fig 7A), 11
Plasma Membrane Mannosyldinositol
Phosphorylceramide (M(IP)2C-m)
X22
0.0765 mol%
Value from Wu et al. at 30°C and 2 × 10⁷ cells/ml. Estimate 90% plasma membrane concentration from Patton et al.
(10, Fig 7A), 11
0.5 mol% (20, Fig 2B) Very Long Chain Fatty Acid (C26-CoA)
X237.73 mol% Concentration of long and very long species C22:0, C24:0
and, C26:0 (21, Table VI)
183 µM 21.2 % of the Acetyl-CoA concentration according to the rat liver in vivo relationship between acetyl-CoA (68.5 µM) and Malonyl-CoA (14.5 µM)
22Malonyl-CoA
(Mal-CoA)
X24
1740 µM 1:2 Acetyl-CoA: Malonyl-CoA in vitro relation 23
- 2 -
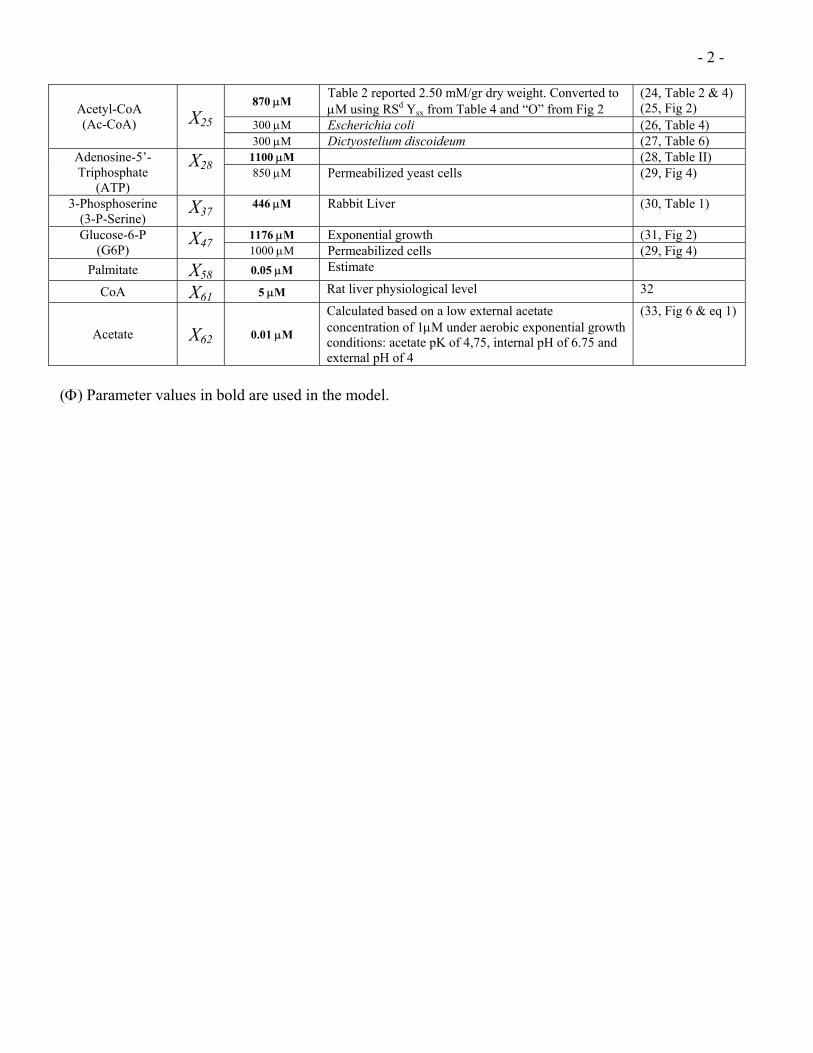
870 µM Table 2 reported 2.50 mM/gr dry weight. Converted to µM using RSd Ysx from Table 4 and “O” from Fig 2
(24, Table 2 & 4) (25, Fig 2)
300 µM Escherichia coli (26, Table 4) Acetyl-CoA (Ac-CoA)
X25
300 µM Dictyostelium discoideum (27, Table 6) 1100 µM (28, Table II) Adenosine-5’-
Triphosphate (ATP)
X28 850 µM Permeabilized yeast cells (29, Fig 4)
3-Phosphoserine (3-P-Serine)
X37446 µM
Rabbit Liver (30, Table 1)
1176 µM Exponential growth (31, Fig 2) Glucose-6-P (G6P)
X47 1000 µM Permeabilized cells (29, Fig 4) Palmitate X58 0.05 µM Estimate
CoA X61 5 µM Rat liver physiological level 32
Acetate X62 0.01 µM
Calculated based on a low external acetate concentration of 1µM under aerobic exponential growth conditions: acetate pK of 4,75, internal pH of 6.75 and external pH of 4
(33, Fig 6 & eq 1)
(Φ) Parameter values in bold are used in the model.
- 3 -
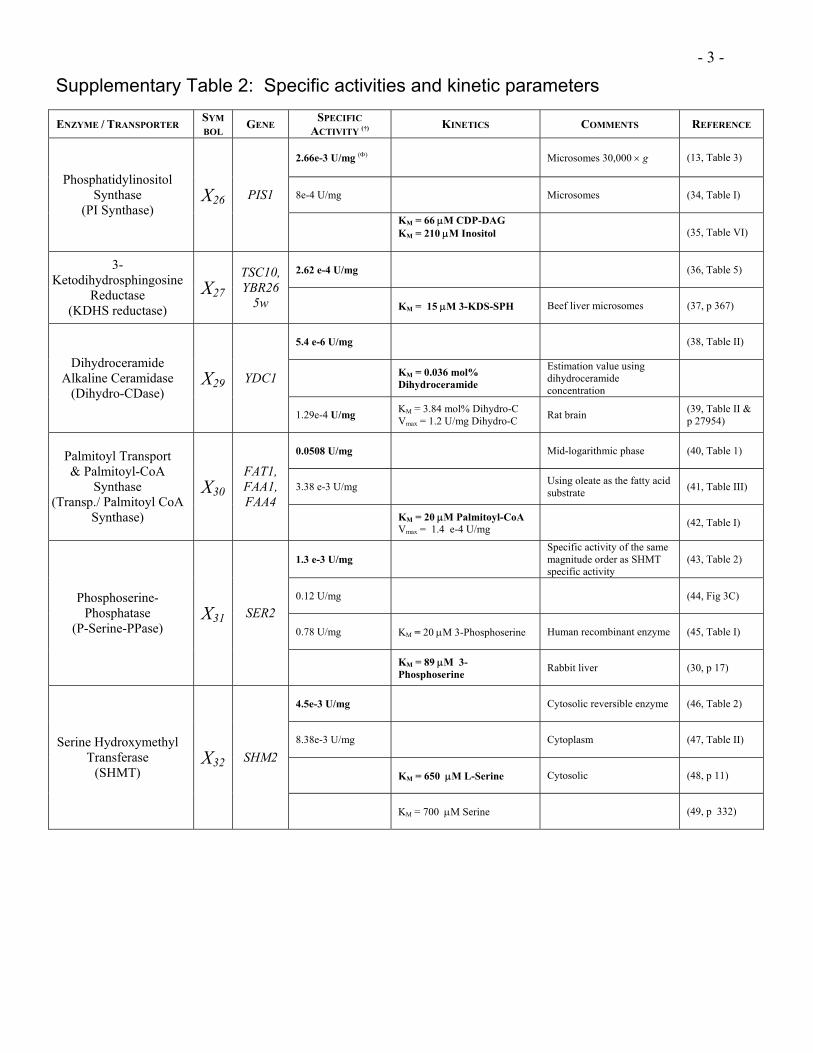
Supplementary Table 2: Specific activities and kinetic parameters
ENZYME / TRANSPORTER SYMBOL GENE SPECIFIC
ACTIVITY (†) KINETICS COMMENTS REFERENCE
2.66e-3 U/mg (Φ) Microsomes 30,000 × g (13, Table 3)
8e-4 U/mg Microsomes (34, Table I) Phosphatidylinositol
Synthase (PI Synthase)
X26 PIS1
KM = 66 µM CDP-DAG KM = 210 µM Inositol
(35, Table VI)
2.62 e-4 U/mg (36, Table 5) 3-Ketodihydrosphingosine
Reductase (KDHS reductase)
X27
TSC10, YBR26
5w KM = 15 µM 3-KDS-SPH Beef liver microsomes (37, p 367)
5.4 e-6 U/mg (38, Table II)
KM = 0.036 mol% Dihydroceramide
Estimation value using dihydroceramide concentration
Dihydroceramide
Alkaline Ceramidase (Dihydro-CDase)
X29 YDC1
1.29e-4 U/mg KM = 3.84 mol% Dihydro-C Vmax = 1.2 U/mg Dihydro-C Rat brain (39, Table II &
p 27954)
0.0508 U/mg Mid-logarithmic phase (40, Table 1)
3.38 e-3 U/mg Using oleate as the fatty acid substrate (41, Table III)
Palmitoyl Transport & Palmitoyl-CoA
Synthase (Transp./ Palmitoyl CoA
Synthase)
X30
FAT1, FAA1, FAA4
KM = 20 µM Palmitoyl-CoA Vmax = 1.4 e-4 U/mg (42, Table I)
1.3 e-3 U/mg Specific activity of the same magnitude order as SHMT specific activity
(43, Table 2)
0.12 U/mg (44, Fig 3C)
0.78 U/mg KM = 20 µM 3-Phosphoserine Human recombinant enzyme (45, Table I)
Phosphoserine-Phosphatase
(P-Serine-PPase) X31 SER2
KM = 89 µM 3-Phosphoserine Rabbit liver (30, p 17)
4.5e-3 U/mg Cytosolic reversible enzyme (46, Table 2)
8.38e-3 U/mg Cytoplasm (47, Table II)
KM = 650 µM L-Serine Cytosolic (48, p 11)
Serine Hydroxymethyl Transferase
(SHMT) X32 SHM2
KM = 700 µM Serine (49, p 332)
- 4 -
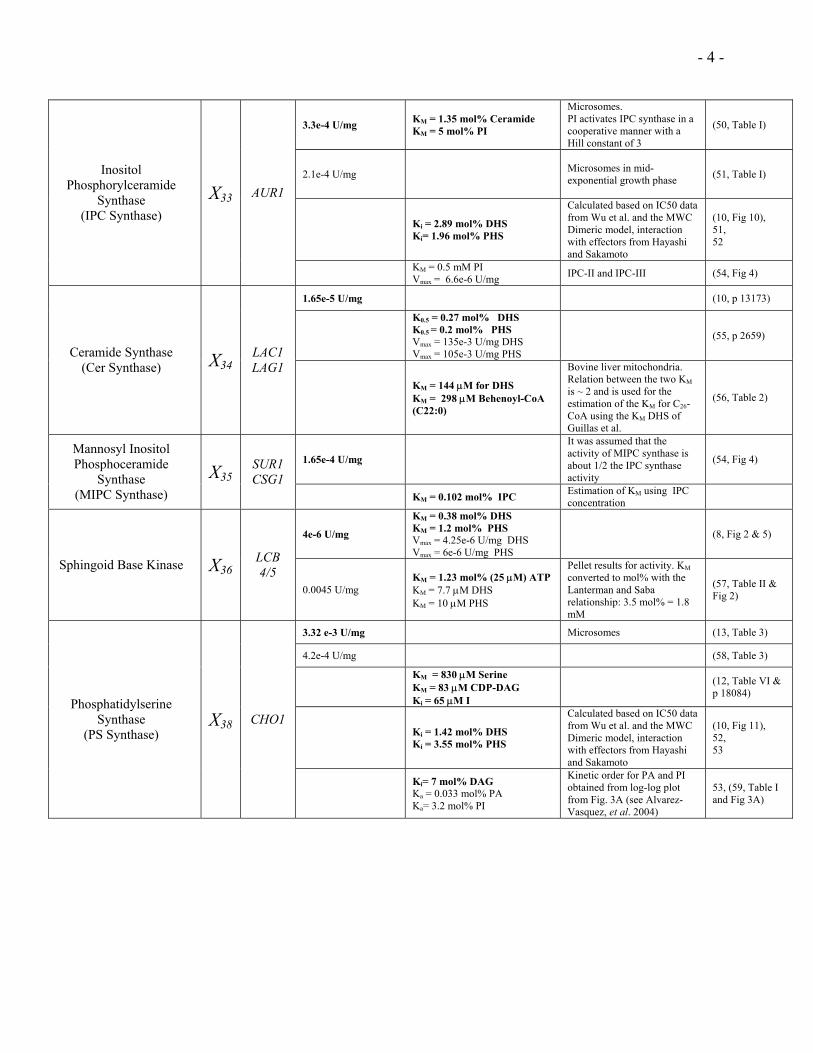
3.3e-4 U/mg KM = 1.35 mol% Ceramide KM = 5 mol% PI
Microsomes. PI activates IPC synthase in a cooperative manner with a Hill constant of 3
(50, Table I)
2.1e-4 U/mg Microsomes in mid-exponential growth phase (51, Table I)
Ki = 2.89 mol% DHS Ki= 1.96 mol% PHS
Calculated based on IC50 data from Wu et al. and the MWC Dimeric model, interaction with effectors from Hayashi and Sakamoto
(10, Fig 10), 51, 52
Inositol Phosphorylceramide
Synthase (IPC Synthase)
X33 AUR1
KM = 0.5 mM PI Vmax = 6.6e-6 U/mg IPC-II and IPC-III (54, Fig 4)
1.65e-5 U/mg (10, p 13173)
K0.5 = 0.27 mol% DHS K0.5 = 0.2 mol% PHS Vmax = 135e-3 U/mg DHS Vmax = 105e-3 U/mg PHS
(55, p 2659)
Ceramide Synthase (Cer Synthase) X34
LAC1 LAG1
KM = 144 µM for DHS KM = 298 µM Behenoyl-CoA (C22:0)
Bovine liver mitochondria. Relation between the two KM is ~ 2 and is used for the estimation of the KM for C26-CoA using the KM DHS of Guillas et al.
(56, Table 2)
1.65e-4 U/mg
It was assumed that the activity of MIPC synthase is about 1/2 the IPC synthase activity
(54, Fig 4) Mannosyl Inositol Phosphoceramide
Synthase (MIPC Synthase)
X35SUR1 CSG1
KM = 0.102 mol% IPC Estimation of KM using IPC concentration
4e-6 U/mg
KM = 0.38 mol% DHS KM = 1.2 mol% PHS Vmax = 4.25e-6 U/mg DHS Vmax = 6e-6 U/mg PHS
(8, Fig 2 & 5)
Sphingoid Base Kinase X36LCB 4/5
0.0045 U/mg KM = 1.23 mol% (25 µM) ATP KM = 7.7 µM DHS KM = 10 µM PHS
Pellet results for activity. KM converted to mol% with the Lanterman and Saba relationship: 3.5 mol% = 1.8 mM
(57, Table II & Fig 2)
3.32 e-3 U/mg Microsomes (13, Table 3)
4.2e-4 U/mg (58, Table 3)
KM = 830 µM Serine KM = 83 µM CDP-DAG Ki = 65 µM I
(12, Table VI & p 18084)
Ki = 1.42 mol% DHS Ki = 3.55 mol% PHS
Calculated based on IC50 data from Wu et al. and the MWC Dimeric model, interaction with effectors from Hayashi and Sakamoto
(10, Fig 11), 52, 53
Phosphatidylserine Synthase
(PS Synthase) X38 CHO1
Ki= 7 mol% DAG Ka = 0.033 mol% PA Ka= 3.2 mol% PI
Kinetic order for PA and PI obtained from log-log plot from Fig. 3A (see Alvarez-Vasquez, et al. 2004)
53, (59, Table I and Fig 3A)
- 5 -
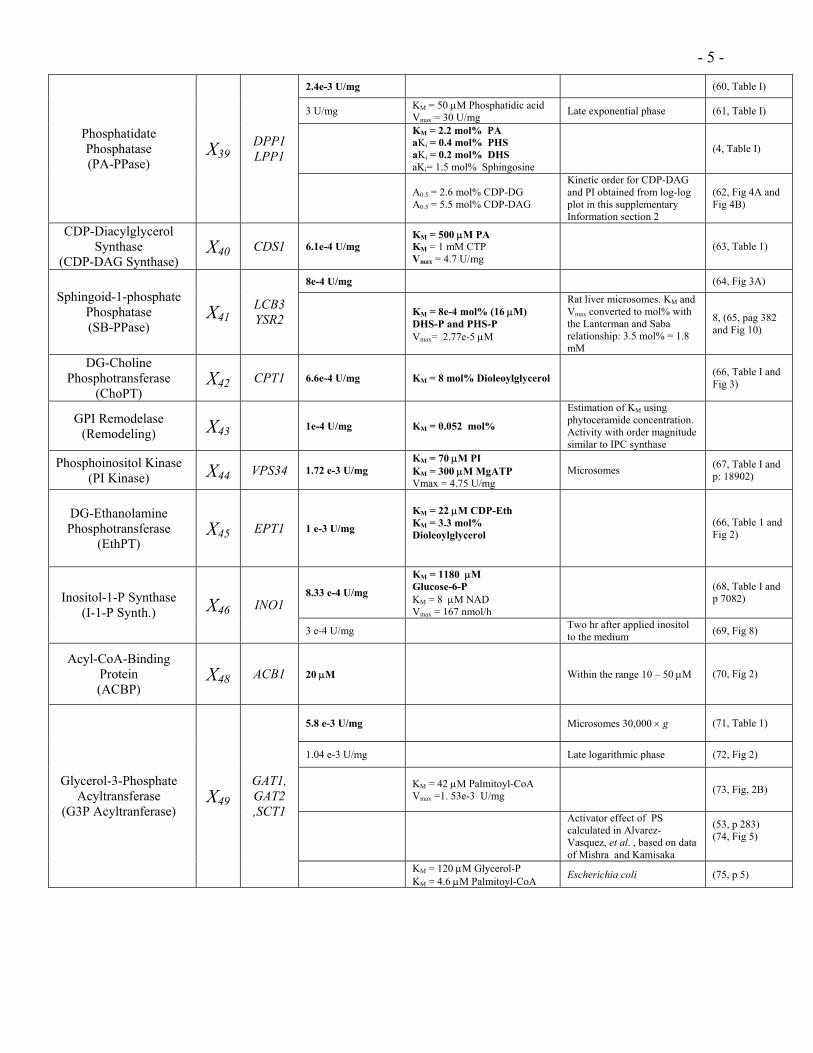
2.4e-3 U/mg (60, Table I)
3 U/mg KM = 50 µM Phosphatidic acid Vmax = 30 U/mg Late exponential phase (61, Table I)
KM = 2.2 mol% PA aKi = 0.4 mol% PHS aKi = 0.2 mol% DHS aKi= 1.5 mol% Sphingosine
(4, Table I) Phosphatidate Phosphatase (PA-PPase)
X39DPP1 LPP1
A0.5 = 2.6 mol% CDP-DG A0.5 = 5.5 mol% CDP-DAG
Kinetic order for CDP-DAG and PI obtained from log-log plot in this supplementary Information section 2
(62, Fig 4A and Fig 4B)
CDP-Diacylglycerol Synthase
(CDP-DAG Synthase) X40 CDS1 6.1e-4 U/mg
KM = 500 µM PA KM = 1 mM CTP Vmax = 4.7 U/mg
(63, Table 1)
8e-4 U/mg (64, Fig 3A) Sphingoid-1-phosphate
Phosphatase (SB-PPase)
X41LCB3 YSR2
KM = 8e-4 mol% (16 µM) DHS-P and PHS-P Vmax= 2.77e-5 µM
Rat liver microsomes. KM and Vmax converted to mol% with the Lanterman and Saba relationship: 3.5 mol% = 1.8 mM
8, (65, pag 382 and Fig 10)
DG-Choline Phosphotransferase
(ChoPT) X42 CPT1 6.6e-4 U/mg KM = 8 mol% Dioleoylglycerol (66, Table I and
Fig 3)
GPI Remodelase (Remodeling) X43 1e-4 U/mg KM = 0.052 mol%
Estimation of KM using phytoceramide concentration. Activity with order magnitude similar to IPC synthase
Phosphoinositol Kinase (PI Kinase) X44 VPS34 1.72 e-3 U/mg
KM = 70 µM PI KM = 300 µM MgATP Vmax = 4.75 U/mg
Microsomes (67, Table I and p: 18902)
DG-Ethanolamine Phosphotransferase
(EthPT)
X45 EPT1 1 e-3 U/mg
KM = 22 µM CDP-Eth KM = 3.3 mol% Dioleoylglycerol
(66, Table 1 and Fig 2)
8.33 e-4 U/mg
KM = 1180 µM Glucose-6-P KM = 8 µM NAD Vmax = 167 nmol/h
(68, Table I and p 7082) Inositol-1-P Synthase
(I-1-P Synth.) X46 INO1
3 e-4 U/mg Two hr after applied inositol to the medium (69, Fig 8)
Acyl-CoA-Binding Protein (ACBP)
X48 ACB1 20 µM Within the range 10 – 50 µM (70, Fig 2)
5.8 e-3 U/mg Microsomes 30,000 × g (71, Table 1)
1.04 e-3 U/mg Late logarithmic phase (72, Fig 2)
KM = 42 µM Palmitoyl-CoA Vmax =1. 53e-3 U/mg (73, Fig, 2B)
Activator effect of PS calculated in Alvarez-Vasquez, et al. , based on data of Mishra and Kamisaka
(53, p 283) (74, Fig 5)
Glycerol-3-Phosphate Acyltransferase
(G3P Acyltranferase) X49
GAT1, GAT2 ,SCT1
KM = 120 µM Glycerol-P KM = 4.6 µM Palmitoyl-CoA Escherichia coli (75, p 5)
- 6 -
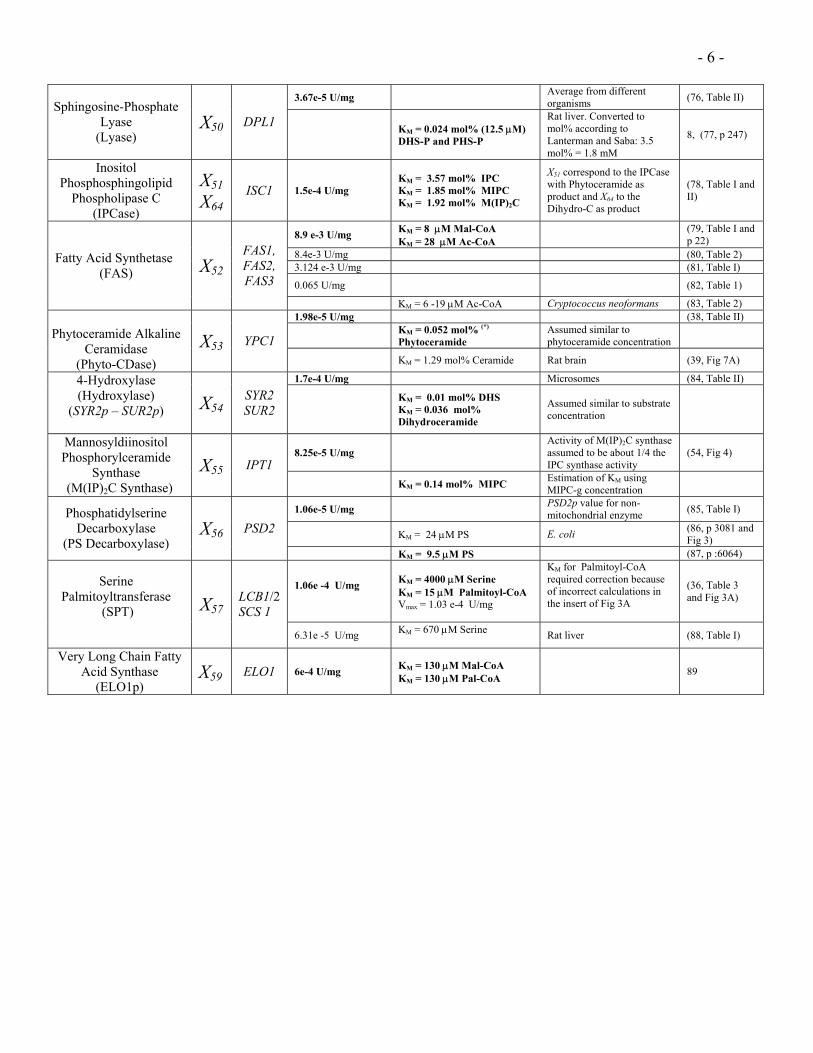
3.67e-5 U/mg Average from different organisms (76, Table II)
Sphingosine-Phosphate Lyase
(Lyase) X50 DPL1
KM = 0.024 mol% (12.5 µM) DHS-P and PHS-P
Rat liver. Converted to mol% according to Lanterman and Saba: 3.5 mol% = 1.8 mM
8, (77, p 247)
Inositol Phosphosphingolipid
Phospholipase C (IPCase)
X51 X64
ISC1 1.5e-4 U/mg KM = 3.57 mol% IPC KM = 1.85 mol% MIPC KM = 1.92 mol% M(IP)2C
X51 correspond to the IPCase with Phytoceramide as product and X64 to the Dihydro-C as product
(78, Table I and II)
8.9 e-3 U/mg KM = 8 µM Mal-CoA KM = 28 µM Ac-CoA
(79, Table I and p 22)
8.4e-3 U/mg (80, Table 2) 3.124 e-3 U/mg (81, Table I)
0.065 U/mg (82, Table 1)
Fatty Acid Synthetase (FAS) X52
FAS1, FAS2, FAS3
KM = 6 -19 µM Ac-CoA Cryptococcus neoformans (83, Table 2) 1.98e-5 U/mg (38, Table II)
KM = 0.052 mol% (*)
Phytoceramide Assumed similar to phytoceramide concentration
Phytoceramide Alkaline
Ceramidase (Phyto-CDase)
X53 YPC1 KM = 1.29 mol% Ceramide Rat brain (39, Fig 7A)
1.7e-4 U/mg Microsomes (84, Table II) 4-Hydroxylase (Hydroxylase)
(SYR2p – SUR2p)
X54SYR2 SUR2
KM = 0.01 mol% DHS KM = 0.036 mol% Dihydroceramide
Assumed similar to substrate concentration
8.25e-5 U/mg Activity of M(IP)2C synthase assumed to be about 1/4 the IPC synthase activity
(54, Fig 4) Mannosyldiinositol Phosphorylceramide
Synthase (M(IP)2C Synthase)
X55 IPT1 KM = 0.14 mol% MIPC Estimation of KM using
MIPC-g concentration
1.06e-5 U/mg PSD2p value for non-mitochondrial enzyme (85, Table I)
KM = 24 µM PS E. coli (86, p 3081 and Fig 3)
Phosphatidylserine Decarboxylase
(PS Decarboxylase) X56 PSD2
KM = 9.5 µM PS (87, p :6064)
1.06e -4 U/mg
KM = 4000 µM Serine KM = 15 µM Palmitoyl-CoA Vmax = 1.03 e-4 U/mg
KM for Palmitoyl-CoA required correction because of incorrect calculations in the insert of Fig 3A
(36, Table 3 and Fig 3A)
Serine Palmitoyltransferase
(SPT)
X57LCB1/2 SCS 1
6.31e -5 U/mg KM = 670 µM Serine Rat liver (88, Table I)
Very Long Chain Fatty Acid Synthase
(ELO1p) X59 ELO1 6e-4 U/mg KM = 130 µM Mal-CoA
KM = 130 µM Pal-CoA 89
- 7 -
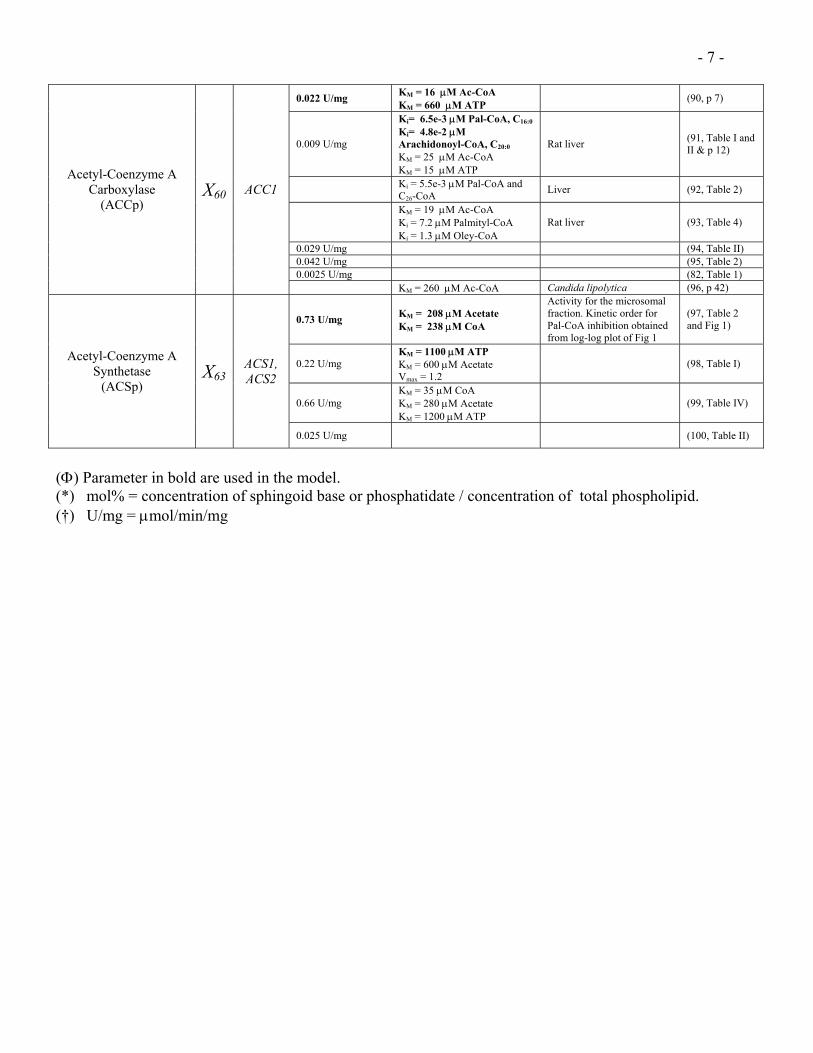
0.022 U/mg KM = 16 µM Ac-CoA KM = 660 µM ATP
(90, p 7)
0.009 U/mg
Ki= 6.5e-3 µM Pal-CoA, C16:0
Ki= 4.8e-2 µM Arachidonoyl-CoA, C20:0 KM = 25 µM Ac-CoA KM = 15 µM ATP
Rat liver (91, Table I and II & p 12)
Ki = 5.5e-3 µM Pal-CoA and C26-CoA Liver (92, Table 2)
KM = 19 µM Ac-CoA Ki = 7.2 µM Palmityl-CoA Ki = 1.3 µM Oley-CoA
Rat liver (93, Table 4)
0.029 U/mg (94, Table II) 0.042 U/mg (95, Table 2) 0.0025 U/mg (82, Table 1)
Acetyl-Coenzyme A Carboxylase
(ACCp) X60 ACC1
KM = 260 µM Ac-CoA Candida lipolytica (96, p 42)
0.73 U/mg KM = 208 µM Acetate KM = 238 µM CoA
Activity for the microsomal fraction. Kinetic order for Pal-CoA inhibition obtained from log-log plot of Fig 1
(97, Table 2 and Fig 1)
0.22 U/mg KM = 1100 µM ATP KM = 600 µM Acetate Vmax = 1.2
(98, Table I)
0.66 U/mg KM = 35 µM CoA KM = 280 µM Acetate KM = 1200 µM ATP
(99, Table IV)
Acetyl-Coenzyme A Synthetase
(ACSp) X63
ACS1, ACS2
0.025 U/mg (100, Table II)
(Φ) Parameter in bold are used in the model. (*) mol% = concentration of sphingoid base or phosphatidate / concentration of total phospholipid. (†) U/mg = µmol/min/mg
- 8 - References
1. Hannun Y., personal communication. 2. Beeler T, et al.,The Saccharomyces cerevisiae TSC10/YBR265w gene encoding 3-ketosphinganine
reductase is identified in a screen for temperature-sensitive suppressors of the Ca2+-sensitive csg2Delta mutant. J Biol Chem. 273, 30688 (1998).
3. Jenkins GM, et al. Acute activation of de novo sphingolipid biosynthesis upon heat shock causes an accumulation of ceramide and subsequent dephosphorylation of SR proteins. J Biol Chem. 277, 42572 (2002).
4. W.I., Wu et al., Regulation of phosphatidate phosphatase activity from the yeast Saccharomyces cerevisiae by sphingoid bases. J Biol Chem.; 268, 13830 (1993).
5. Cungui M., personal communication. Yeast cell labeled with 3H-palmitic acid for 30 or 60 minutes. After labeling, total sphingolipids were extracted and analyzed by TLC, which was autoradiographed. The autoradiography image was scanned and lipids were quantitated by an ImageQuant software.
6. Okamoto Y., personal communication. 7. Skrzypek M.S., Nagiec M.M., Lester R.L., Dickson R.C., Analysis of phosphorylated sphingolipid
long-chain bases reveals potential roles in heat stress and growth control in Saccharomyces. J Bacteriol; 181. 1134 (1999).
8. Lanterman M.M., Saba J.D., Characterization of sphingosine kinase (SK) activity in Saccharomyces cerevisiae and isolation of SK-deficient mutants, Biochem J 332, Pt 2, 525 (1998).
9. Reggiori F., Conzelmann A., Biosynthesis of inositol phosphoceramides and remodeling of glycosylphosphatidylinositol anchors in Saccharomyces cerevisiae are mediated by different enzymes. J Biol Chem. 273, 30550 (1998).
10. Wu W.I., et al., Regulation of lipid biosynthesis in Saccharomyces cerevisiae by fumonisin B1. J Biol Chem 270, 13171 (1995).
11. Patton J.L., Lester R.L., The phosphoinositol sphingolipids of Saccharomyces cerevisiae are highly localized in the plasma membrane. J Bacteriol 173, 3101 (1991).
12. Kelley M.J., Bailis A.M., Henry S.A., Carman G.M., Regulation of phospholipid biosynthesis in Saccharomyces cerevisiae by inositol. Inositol is an inhibitor of phosphatidylserine synthase activity. J Biol Chem. 263,18078 (1988).
13. Pichler H., et al., A subfraction of the yeast endoplasmic reticulum associates with the plasma membrane and has a high capacity to synthesize lipids. Eur J Biochem. 268, 2351 (2001).
14. Summers E.F., Letts V.A., McGraw P., Henry S.A., Saccharomyces cerevisiae cho2 mutants are deficient in phospholipid methylation and cross-pathway regulation of inositol synthesis. Genetics. 120, 909 (1988).
15. Knudsen J., et al., Role of acylCoA binding protein in acylCoA transport, metabolism and cell signaling. Mol Cell Biochem 192, 95 (1999).
16. Messenguy F., Colin D., ten Have J.P., Regulation of compartmentation of amino acid pools in Saccharomyces cerevisiae and its effects on metabolic control. Eur J Biochem. 108, 439 (1980).
17. Snell K., Fell D.A., Metabolic control analysis of mammalian serine metabolism. Adv Enzyme Regul. 30, 13 (1990).
18. Taylor F.R., Parks L.W., Triaglycerol metabolism in Saccharomyces cerevisiae. Relation to phospholipid synthesis. Biochim Biophys Acta. 575, 204 (1979).
19. Preiss J. et al., Quantitative measurement of sn-1,2-diacylglycerols present in platelets, hepatocytes, and ras- and sis-transformed normal rat kidney cells. J Biol Chem. 261, 8597 (1986).
20. Gaigg B. et al., Depletion of acyl-coenzyme A-binding protein affects sphingolipid synthesis and causes vesicle accumulation and membrane defects in Saccharomyces cerevisiae. Mol Biol Cell.12, 1147 (2001).
- 9 - 21. Choi J.Y., Martin C.E., The Saccharomyces cerevisiae FAT1 gene encodes an acyl-
CoA synthetase that is required for maintenance of very long chain fatty acid levels. J Biol Chem. 274, 4671 (1999).
22. Hansen H.J., Letter: Significance of malonyl-CoA as an intermediate in fatty acid biosynthesis. Lipids. Lipids. 8, 595 (1973).
23. Sumper M., Oesterhelt D., Riepertinger C., Lynen F., [Synthesis of various carboxylic acids by the fatty acid synthetase multienzyme complex of yeast and the explanation for their structure]. Eur J Biochem. 10, 377 (1969).
24. Gombert A.K., Moreira dos Santos M., Christensen B., Nielsen J., Network identification and flux quantification in the central metabolism of Saccharomyces cerevisiae under different conditions of glucose repression. J Bacteriol. 183, 1441 (2001).
25. Ertugay N., Hamamci H., Bayindirli A., Fed-batch cultivation of bakers' yeast: effect of nutrient depletion and heat stress on cell composition. Folia Microbiol (Praha). 42, 214 (1997).
26. Buchholz A, Takors R, Wandrey C., Quantification of intracellular metabolites in Escherichia coli K12 using liquid chromatographic-electrospray ionization tandem mass spectrometric techniques. Anal Biochem. 295, 129 (2001).
27. Wright B.E., Butler M.H., Albe K.R., Systems analysis of the tricarboxylic acid cycle in Dictyostelium discoideum. I. The basis for model construction. J. Biol. Chem. 267, 3101 (1992).
28. Gancedo J.M., Gancedo C., Concentrations of intermediary metabolites in yeast. Biochimie. 55, 205 (1973).
29. Bañuelos M., Gancedo C., In situ study of the glycolytic pathway in Saccharomyces cerevisiae. Arch Microbiol. 117, 197 (1978).
30. Snell K., Fell D.A., Metabolic control analysis of mammalian serine metabolism. Adv Enzyme Regul. 30, 13 (1990).
31. Lagunas R., Dominguez C., Busturia A., Saez M.J., Mechanisms of appearance of the Pasteur effect in Saccharomyces cerevisiae: inactivation of sugar transport systems. J Bacteriol.152, 19 (1982).
32. Yeh L.A., Lee K.H., Kim K.H., Regulation of rat liver acetyl-CoA carboxylase. Regulation of phosphorylation and inactivation of acetyl-CoA carboxylase by the adenylate energy charge. J Biol Chem. 255, 2308 (1980).
33. Keulers M., Satroutdinov A.D., Suzuki T., Kuriyama H., Synchronization affector of autonomous short-period-sustained oscillation of Saccharomyces cerevisiae. Yeast. 12, 673 (1996).
34. Fischl A.S., Carman G.M., Phosphatidylinositol biosynthesis in Saccharomyces cerevisiae: purification and properties of microsome-associated phosphatidylinositol synthase. J Bacteriol. 154, 304 (1983).
35. Kelley M.J., Bailis A.M., Henry S.A., Carman G.M., Regulation of phospholipid biosynthesis in Saccharomyces cerevisiae by inositol. Inositol is an inhibitor of phosphatidylserine synthase activity. J Biol Chem. 263, 18078 (1988).
36. Pinto W.J., Wells G.W., Lester R.L., Characterization of enzymatic synthesis of sphingolipid long-chain bases in Saccharomyces cerevisiae: mutant strains exhibiting long-chain-base auxotrophy are deficient in serine palmitoyltransferase activity. J Bacteriol. 174, 2575 (1992).
37. Y. Kishimoto. Ch 10. in The Enzymes, (P. Boyer. ed. 3, 1983). vol XVI, pp. 367. 38. Mao C., Xu R., Bielawska A., Szulc Z.M., Obeid L.M., Cloning and characterization of a
Saccharomyces cerevisiae alkaline ceramidase with specificity for dihydroceramide. J Biol Chem. 275, 31369 (2000).
39. El Bawab S., Bielawska A., Hannun Y.A., Purification and characterization of a membrane-bound nonlysosomal ceramidase from rat brain. J Biol Chem. 274, 27948 (1999).
40. Kamiryo T., Parthasarathy S., Numa S., Evidence that acyl coenzyme A synthetase activity is required for repression of yeast acetyl coenzyme A carboxylase by exogenous fatty acids. Proc Natl Acad Sci U S A. 73. 386 (1976).

- 10 - 41. Faergeman N.J., Black P.N., Zhao X.D., Knudsen J., DiRusso C.C., The Acyl-CoA
synthetases encoded within FAA1 and FAA4 in Saccharomyces cerevisiae function as components of the fatty acid transport system linking import, activation, and intracellular utilization. J Biol Chem 276, 37051 (2001).
42. Knoll L.J., Johnson D.R., Gordon J.I., Biochemical studies of three Saccharomyces cerevisiae acyl-CoA synthetases, Faa1p, Faa2p, and Faa3p. J Biol Chem. 269, 16348 (1994).
43. Melcher K., Entian K.D., Genetic analysis of serine biosynthesis and glucose repression in yeast. Curr Genet. 21. 295 (1992).
44. Albers E., Laize V., Blomberg A., Hohmann S., Gustafsson L., Ser3p (Yer081wp) and Ser33p (Yil074cp) are phosphoglycerate dehydrogenases in Saccharomyces cerevisiae. J Biol Chem. 278. 10264 (2003).
45. Collet J.F., Stroobant V., Van Schaftingen E., Mechanistic studies of phosphoserine phosphatase, an enzyme related to P-type ATPases. J Biol Chem. 274, 33985 (1999).
46. Kastanos E.K., Woldman Y.Y., Appling D.R., Role of mitochondrial and cytoplasmic serine hydroxymethyltransferase isozymes in de novo purine synthesis in Saccharomyces cerevisiae. Biochemistry. 36, 14956 (1997).
47. McNeil J.B. et al., Cloning and molecular characterization of three genes, including two genes encoding serine hydroxymethyltransferases, whose inactivation is required to render yeast auxotrophic for glycine. J Biol Chem. 269, 9155 (1994).
48. Zelikson R., Luzzati M., Two forms of serine transhydroxymethylase, one absent in a thymidylate-less mutant in Saccharomyces cerevisiae. Eur J Biochem. 64, 7 (1976).
49. Nakamura K.D., Trewyn R.W., Parks L.W., Purification and characterization of serine transhydroxy-methylase from Saccharomyces cerevisiae. Biochim Biophys Acta. 19, 327(2), 328 (1973).
50. Fischl A.S., Liu Y., Browdy A., Cremesti A.E., Inositolphosphoryl ceramide synthase from yeast. Browdy, A.E. Cremesti. Methods Enzymol. 311, 123 (2000)
51. Ko J., Cheah S., Fischl A.S., Regulation of phosphatidylinositol:ceramide phosphoinositol transferase in Saccharomyces cerevisiae. J Bacteriol. 176, 5181 (1994).
52. Hayashi K., Sakamoto N., Dynamic Analysis of Enzyme Systems: An Introduction. (Springer-Verlag, Japan Scientific Societies Press Tokyo, 1985).
53. Alvarez-Vasquez F., Sims K., Hannun Y. and Voit E.O., Integration of Kinetic Information on Yeast Sphingolipid Metabolism in Dynamical Pathway Models. J Theor Biol. 226, 265 (2004).
54. Becker G.W., Lester R.L., Biosynthesis of phosphoinositol-containing sphingolipids from phosphatidylinositol by a membrane preparation from Saccharomyces cerevisiae. J Bacteriol. 142, 747 (1980).
55. Guillas I. et al., C26-CoA-dependent ceramide synthesis of Saccharomyces cerevisiae is operated by Lag1p and Lac1p. EMBO J. 20, 2655 (2001).
56. Shimeno H. et al., Partial purification and characterization of sphingosine N-acyltransferase (ceramide synthase) from bovine liver mitochondrion-rich fraction. Lipids. 33, 601 (1998).
57. Nagiec M.M., M. Skrzypek, E.E. Nagiec, R.L. Lester, R.C. Dickson. The LCB4 (YOR171c) and LCB5 (YLR260w) genes of Saccharomyces encode sphingoid long chain base kinases. J Biol Chem. 273, 19437 (1998).
58. Homann M.J., Bailis A.M., Henry S.A., Carman G.M., Coordinate regulation of phospholipid biosynthesis by serine in Saccharomyces cerevisiae. J Bacteriol. 169, 3276 (1987).
59. Bae-Lee M., Carman G.M., Regulation of yeast phosphatidylserine synthase and phosphatidylinositol synthase activities by phospholipids in Triton X-100/phospholipid mixed micelles. J Biol Chem. 265, 7221 (1990).
60. Hosaka K., Yamashita S., Partial purification and properties of phosphatidate phosphatase in Saccharomyces cerevisiae. Biochim Biophys Acta. 796, 102 (1984).
- 11 - 61. Lin Y.P., Carman G.M., Purification and characterization of phosphatidate
phosphatase from Saccharomyces cerevisiae. J Biol Chem. 264, 8641 (1989). 62. Wu WI, Carman GM. Regulation of phosphatidate phosphatase activity from the yeast
Saccharomyces cerevisiae by phospholipids. Biochemistry. 35, 3790 (1996). 63. Kelley M.J., Carman G.M., Purification and characterization of CDP-diacylglycerol synthase from
Saccharomyces cerevisiae. J Biol Chem. 262, 14563 (1987). 64. Mandala S.M. et al., Sphingoid base 1-phosphate phosphatase: a key regulator of sphingolipid
metabolism and stress response. Proc Natl Acad Sci U S A. 95, 150 (1998) 65. Stoffel W., Grol M., Chemistry and biochemistry of 1-desoxysphinganine 1-phosphonate
(dihydrosphingosine-1-phosphonate). Chem Phys Lipids. 13, 372 (1974). 66. Hjelmstad R.H., Bell R.M., sn-1,2-diacylglycerol choline- and ethanolaminephosphotransferases in
Saccharomyces cerevisiae. Mixed micellar analysis of the CPT1 and EPT1 gene products. J Biol Chem. 266, 4357 (1991).
67. Belunis C.J., Bae-Lee M., Kelley M.J., Carman G.M., Purification and characterization of phosphatidylinositol kinase from Saccharomyces cerevisiae. J Biol Chem. 263, 18897 (1988).
68. Donahue T.F., Henry S.A., myo-Inositol-1-phosphate synthase. Characteristics of the enzyme and identification of its structural gene in yeast. J Biol Chem. 256, 7077 (1981).
69. M.R. Culbertson, T.F. Donahue, S.A. Henry. Control of inositol biosynthesis in Saccharomyces cerevisiae: properties of a repressible enzyme system in extracts of wild-type (Ino+) cells. J Bacteriol. 126, 232 (1976).
70. Knudsen J. et al., Role of acylCoA binding protein in acylCoA transport, metabolism and cell signaling. Mol Cell Biochem 192, 95 (1999).
71. Athenstaedt K., Weys S., Paltauf F., Daum G., Redundant systems of phosphatidic acid biosynthesis via acylation of glycerol-3-phosphate or dihydroxyacetone phosphate in the yeast Saccharomyces cerevisiae. J Bacteriol. 181, 1458 (1999).
72. Zheng Z., Zou J. The initial step of the glycerolipid pathway: identification of glycerol 3-phosphate/dihydroxyacetone phosphate dual substrate acyltransferases in Saccharomyces cerevisiae. J Biol Chem. 276, 41710 (2001).
73. Schlossman D.M., Bell R.M., Glycerolipid biosynthesis in Saccharomyces cerevisiae: sn-glycerol-3-phosphate and dihydroxyacetone phosphate acyltransferase activities. J Bacteriol. 133, 1368 (1978).
74. Mishra S., Kamisaka Y., Purification and characterization of thiol-reagent-sensitive glycerol-3-phosphate acyltransferase from the membrane fraction of an oleaginous fungus. Biochem J. 355, 315 (2001).
75. Wilkison W.O., Bell R.M., sn-Glycerol-3-phosphate acyltransferase from Escherichia coli. Biochim Biophys Acta. 1348, 3 (1997).
76. Van Veldhoven P.P., Mannaerts G.P., Sphingosine-phosphate lyase. Adv Lipid Res. 26, 69 (1993). 77. Van Veldhoven P.P., Sphingosine-1-phosphate lyase. Methods Enzymol. 311, 244 (2000). 78. Sawai H. et al., Identification of ISC1 (YER019w) as inositol phosphosphingolipid phospholipase C
in Saccharomyces cerevisiae. J Biol Chem. 275, 39793 (2000). 79. Lynen F., Yeast Fatty Acid Synthase. Methods Enzymol. Vol XIV, 17 (1969). 80. Roggenkamp R., Numa S., Schweizer E., Fatty acid-requiring mutant of Saccharomyces cerevisiae
defective in acetyl-CoA carboxylase. Proc Natl Acad Sci U S A. 77, 1814 (1980). 81. Stoops J.K., Wakil S.J., The yeast fatty acid synthetase. Structure-function relationship and the role
of the active cysteine-SH and pantetheine-SH. J Biol Chem. 256, 8364 (1981). 82. Chirala S.S., Coordinated regulation and inositol-mediated and fatty acid-mediated repression of fatty
acid synthase genes in Saccharomyces cerevisiae. Proc Natl Acad Sci U S A. 89, 10232 (1992). 83. Mahmoud Y.A., Abu el Souod S.M., Niehaus W.G., Purification and characterization of fatty acid
synthetase from Cryptococcus neoformans. Mycopathologia. 136, 75 (1996-97).
- 12 - 84. Grilley M.M., Stock S.D., Dickson R.C., Lester R.L., Takemoto J.Y., Syringomycin
action gene SYR2 is essential for sphingolipid 4-hydroxylation in Saccharomyces cerevisiae. J Biol Chem. 273, 11062 (1998).
85. Trotter P.J., Pedretti J., Yates R., Voelker D.R., Phosphatidylserine decarboxylase 2 of Saccharomyces cerevisiae. Cloning and mapping of the gene, heterologous expression, and creation of the null allele. J Biol Chem. 270, 6071 (1995).
86. Dowhan W., Wickner W.T., Kennedy E.P., Purification and properties of phosphatidylserine decarboxylase from Escherichia coli. J Biol Chem. 249, 3079 (1974).
87. Trotter P.J., Voelker D.R., Identification of a non-mitochondrial phosphatidylserine decarboxylase activity (PSD2) in the yeast Saccharomyces cerevisiae. J Biol Chem. 270, 6062 (1995).
88. Williams R.D., Wang E., Merrill A.H. Jr., Enzymology of long-chain base synthesis by liver: characterization of serine palmitoyltransferase in rat liver microsomes. Arch Biochem Biophys. 228, 282 (1984).
89. Dittrich F. et al., Fatty acid elongation in yeast--biochemical characteristics of the enzyme system and isolation of elongation-defective mutants. Eur J Biochem. 252, 477 (1998).
90. Matsuhashi M., Acetyl-CoA Carboxilase from Yeast. Methods Enzymol. Vol XIV, Pt C, 3 (1969). 91. Tanabe T.,et al., Acetyl-CoA carboxylase from rat liver. Methods Enzymol. 71, Pt C, 5 (1981). 92. Faergeman N.J., Knudsen J., Role of long-chain fatty acyl-CoA esters in the regulation of
metabolism and in cell signalling. Biochem J. 323, 1 (1997). 93. Lynen F., Matsuhashi M., Numa S., Schweizer E., The cellular control of fatty acid synthesis at the
enzymatic level. Biochem Soc Symp. 24, 43 (1963). 94. Hasslacher M., Ivessa A.S., Paltauf F., Kohlwein S.D., Acetyl-CoA carboxylase from yeast is an
essential enzyme and is regulated by factors that control phospholipid metabolism. J Biol Chem. 268, 10946 (1993).
95. Roggenkamp R., Numa S., Schweizer E., Fatty acid-requiring mutant of Saccharomyces cerevisiae defective in acetyl-CoA carboxylase. Proc Natl Acad Sci U S A. 77, 1814 (1980).
96. Mishina M., Kamiryo T., Tanaka A., Numa S., Acetyl-coenzyme-A carboxylase from Candida lipolytica. Methods Enzymol. 71, 37 (1981).
97. Satyanarayana T., Klein H.P., Studies on acetyl-coenzyme A synthetase of yeast: inhibition by long-chain acyl-coenzyme A esters. J Bacteriol. 115, 600 (1973).
98. Van den Berg M.A. et al., The two acetyl-coenzyme A synthetases of Saccharomyces cerevisiae differ with respect to kinetic properties and transcriptional regulation. J Biol Chem. 271, 28953 (1996).
99. Frenkel E.P., Kitchens R.L., Purification and properties of acetyl coenzyme A synthetase from bakers' yeast. J Biol Chem. 252, 504 (1977 ).
100. Kratzer S., Schuller H.J., Carbon source-dependent regulation of the acetyl-coenzyme A synthetase-encoding gene ACS1 from Saccharomyces cerevisiae. Gene. 161, 75 (1995).