Supplemental Figure 1
8
C Supplemental Figure 1 A B
-
Upload
fatima-york -
Category
Documents
-
view
36 -
download
0
description
Supplemental Figure 1. A B. C. Supplemental Figure 2. RWPE-1. DU-145. AR- CaP -M. PC-3. AR- CaP -E. PC-3-ML. 70 kDa. c- myc. 57 kDa. β-actin. 42 kDa. Supplemental Figure 3. A B. Supplemental Figure 4. pPEG -Luc. pAEG -Luc. 24h 48h. - PowerPoint PPT Presentation
Transcript of Supplemental Figure 1
C
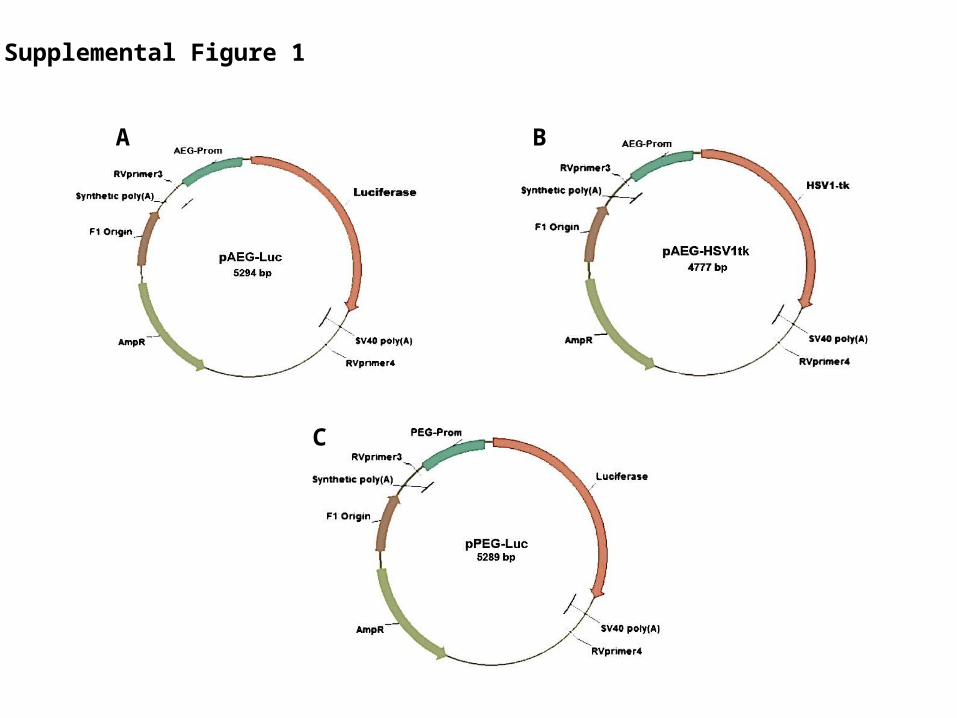
Supplemental Figure 1
A B
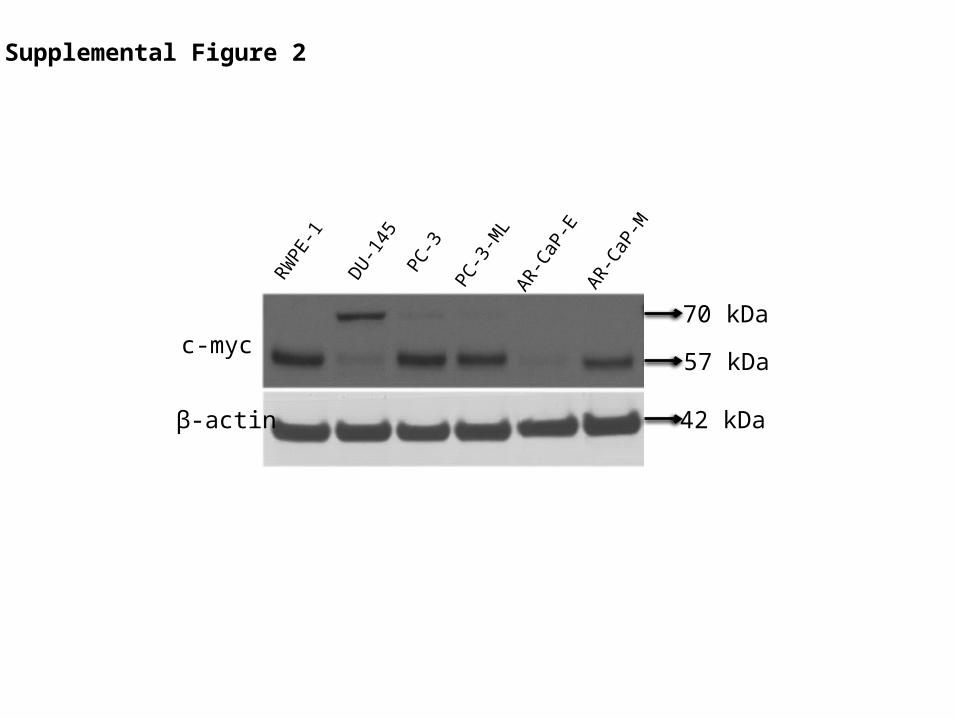
57 kDa
70 kDa
RWPE
-1
DU-145
PC-3
PC-3
-ML
AR-Ca
P-E
AR-Ca
P-M
c-myc
42 kDaβ-actin
Supplemental Figure 2
A
B
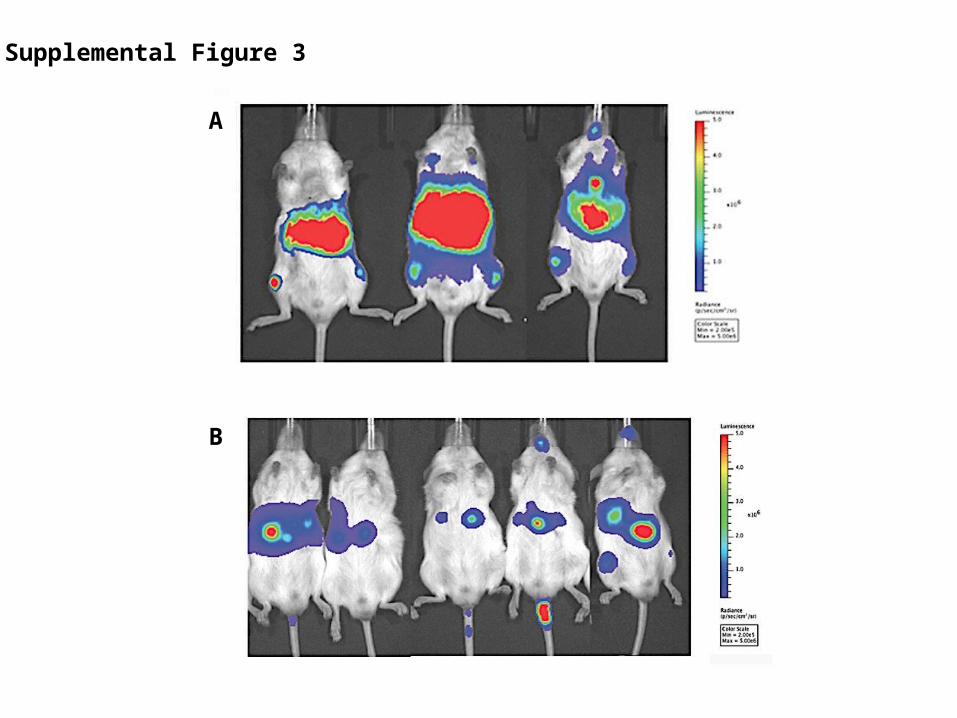
Supplemental Figure 3

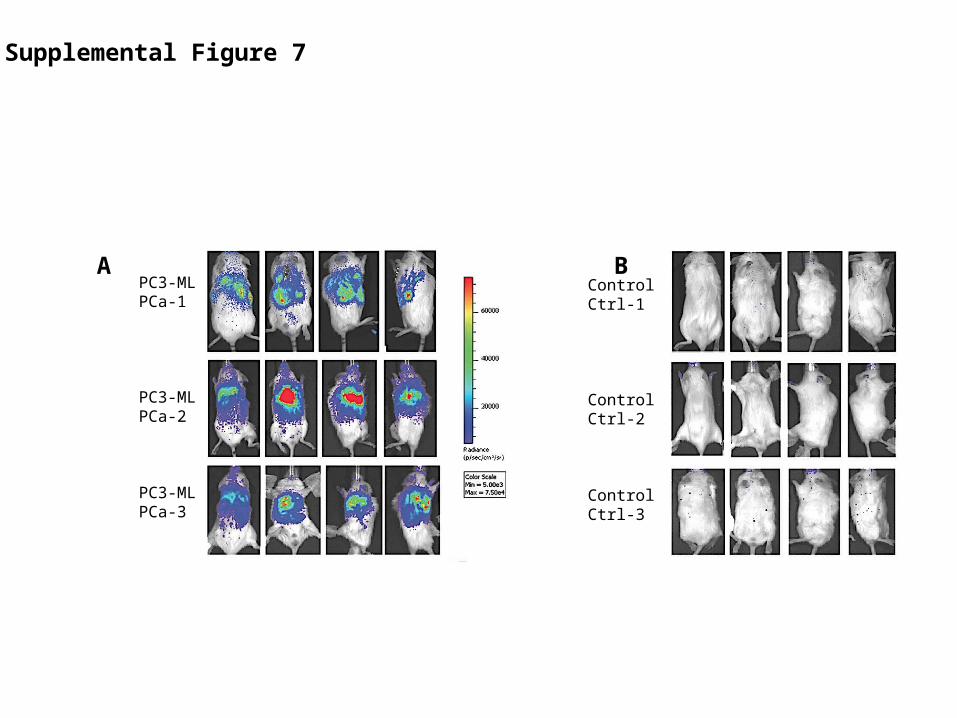
PC3-ML PCa-1
PC3-ML PCa-2
PC3-ML PCa-3
Control Ctrl-1
Control Ctrl-2
Control Ctrl-3
PC3-ML PCa-1
PC3-ML PCa-2
PC3-ML PCa-3
PC3-ML PCa-4
Control Ctrl-1
Control Ctrl-2
Control Ctrl-3
pPEG-Luc pAEG-Luc
24h 48h 24h 48h
D V L R D V L R D V L R D V L R
Supplemental Figure 4
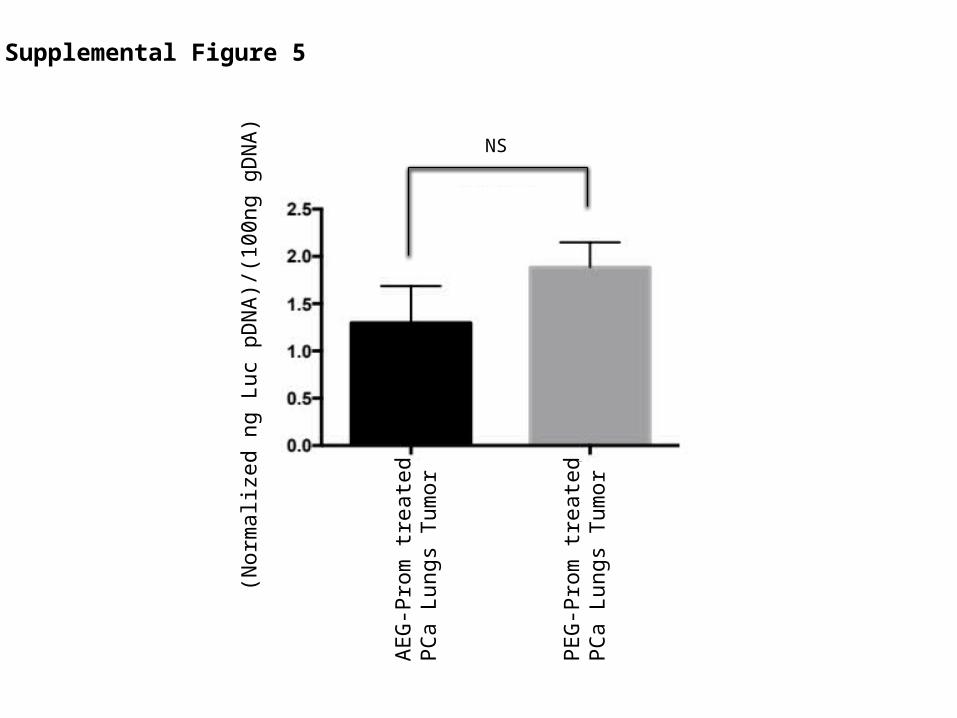
Supplemental Figure 5
(Nor
mal
ized
ng
Luc
pDN
A)/
(100
ng g
DN
A)
AE
G-P
rom
trea
ted
PC
a Lu
ngs
Tum
or
PE
G-P
rom
trea
ted
PC
a Lu
ngs
Tum
or
NS
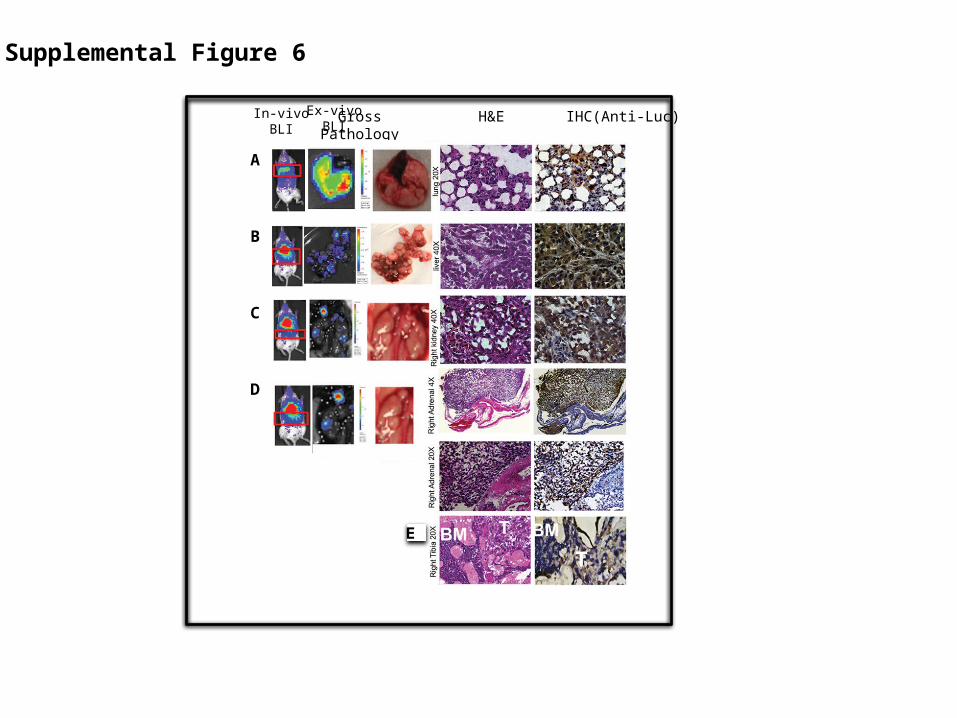
Gross H&E IHC(Anti-Luc)Pathology
In-vivo BLI
Ex-vivo BLI
A
B
C
D
T
Supplemental Figure 6
E
PC3-MLPCa-1
PC3-MLPCa-2
PC3-MLPCa-3
Control Ctrl-1
Control Ctrl-2
Control Ctrl-3
A B
Supplemental Figure 7
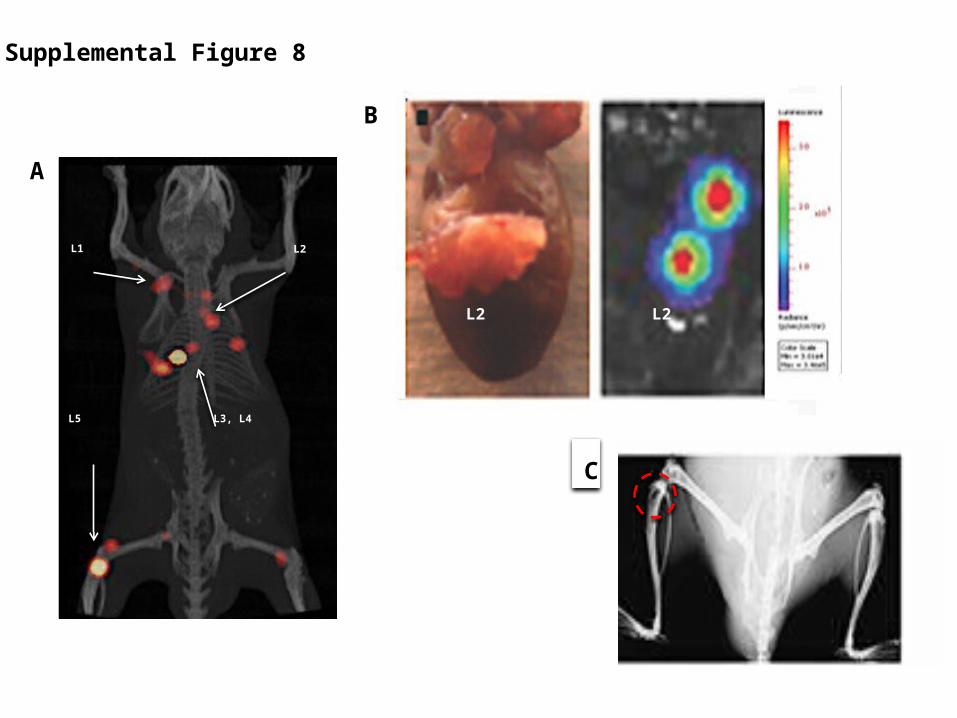
A
B
C
L2 L2
L2L1
L3, L4L5
Supplemental Figure 8