SUPP MATERIALS Fatigability 6-14-17circheartfailure.ahajournals.org/highwire/filestream/...exercise...
9
1 SUPPLEMENTAL MATERIAL Fatigability, exercise intolerance and abnormal skeletal muscle energetics in heart failure Kilian Weiss 1-3 , Michael Schär 2 , Gurusher S. Panjrath 1,4 , Yi Zhang 2 , Kavita Sharma 1 , Paul A. Bottomley 2 , Asieh Golozar 5 , Angela Steinberg 1 , Gary Gerstenblith 1 , Stuart D. Russell 1 , Robert G. Weiss 1 Affiliations 1 Division of Cardiology, Department of Medicine, Johns Hopkins University School of Medicine, Baltimore, MD 2 Division of Magnetic Resonance Research, Department of Radiology, Johns Hopkins University School of Medicine, Baltimore, MD 3 Philips Healthcare Germany, Hamburg, Germany 4 Heart Failure and Circulatory Support Program, George Washington University School of Medicine, Washington DC 5 Johns Hopkins School of Public Health, Baltimore, MD Running title: Heart failure fatigability and skeletal muscle energetics Submission: Word count: 2404 Address for correspondence: Robert G. Weiss, MD Blalock 544, The Johns Hopkins Hospital 600 N. Wolfe St. Baltimore, MD 21287-6568 Phone: 410-955-1703 Email: [email protected]
Transcript of SUPP MATERIALS Fatigability 6-14-17circheartfailure.ahajournals.org/highwire/filestream/...exercise...
1
SUPPLEMENTAL MATERIAL
Fatigability, exercise intolerance and abnormal skeletal muscle energetics in heart failure
Kilian Weiss1-3, Michael Schär2, Gurusher S. Panjrath1,4, Yi Zhang2, Kavita Sharma1, Paul A. Bottomley2, Asieh Golozar5, Angela Steinberg1, Gary
Gerstenblith1, Stuart D. Russell1, Robert G. Weiss1
Affiliations 1Division of Cardiology, Department of Medicine, Johns Hopkins University School of Medicine, Baltimore, MD 2Division of Magnetic Resonance Research, Department of Radiology, Johns Hopkins University School of Medicine, Baltimore, MD 3Philips Healthcare Germany, Hamburg, Germany 4Heart Failure and Circulatory Support Program, George Washington University School of Medicine, Washington DC 5Johns Hopkins School of Public Health, Baltimore, MD Running title: Heart failure fatigability and skeletal muscle energetics Submission: Word count: 2404 Address for correspondence: Robert G. Weiss, MD Blalock 544, The Johns Hopkins Hospital 600 N. Wolfe St. Baltimore, MD 21287-6568 Phone: 410-955-1703 Email: [email protected]
2
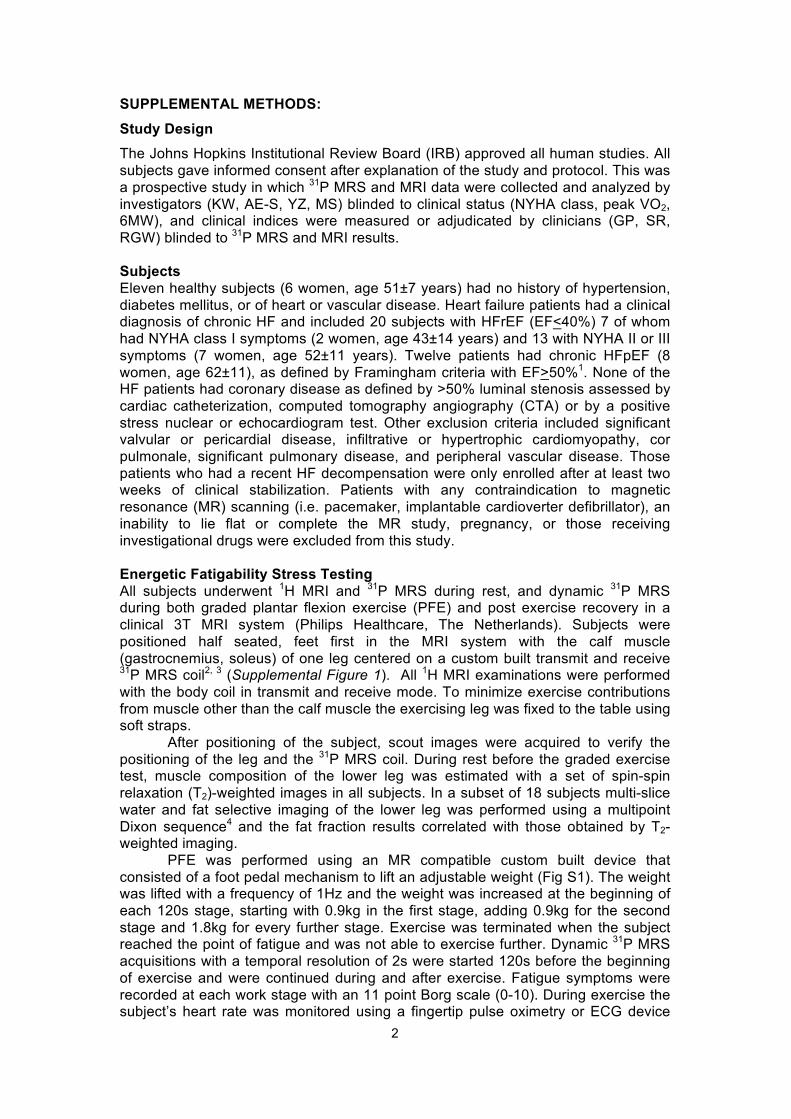
SUPPLEMENTAL METHODS: Study Design The Johns Hopkins Institutional Review Board (IRB) approved all human studies. All subjects gave informed consent after explanation of the study and protocol. This was a prospective study in which 31P MRS and MRI data were collected and analyzed by investigators (KW, AE-S, YZ, MS) blinded to clinical status (NYHA class, peak VO2, 6MW), and clinical indices were measured or adjudicated by clinicians (GP, SR, RGW) blinded to 31P MRS and MRI results. Subjects Eleven healthy subjects (6 women, age 51±7 years) had no history of hypertension, diabetes mellitus, or of heart or vascular disease. Heart failure patients had a clinical diagnosis of chronic HF and included 20 subjects with HFrEF (EF<40%) 7 of whom had NYHA class I symptoms (2 women, age 43±14 years) and 13 with NYHA II or III symptoms (7 women, age 52±11 years). Twelve patients had chronic HFpEF (8 women, age 62±11), as defined by Framingham criteria with EF>50%1. None of the HF patients had coronary disease as defined by >50% luminal stenosis assessed by cardiac catheterization, computed tomography angiography (CTA) or by a positive stress nuclear or echocardiogram test. Other exclusion criteria included significant valvular or pericardial disease, infiltrative or hypertrophic cardiomyopathy, cor pulmonale, significant pulmonary disease, and peripheral vascular disease. Those patients who had a recent HF decompensation were only enrolled after at least two weeks of clinical stabilization. Patients with any contraindication to magnetic resonance (MR) scanning (i.e. pacemaker, implantable cardioverter defibrillator), an inability to lie flat or complete the MR study, pregnancy, or those receiving investigational drugs were excluded from this study. Energetic Fatigability Stress Testing All subjects underwent 1H MRI and 31P MRS during rest, and dynamic 31P MRS during both graded plantar flexion exercise (PFE) and post exercise recovery in a clinical 3T MRI system (Philips Healthcare, The Netherlands). Subjects were positioned half seated, feet first in the MRI system with the calf muscle (gastrocnemius, soleus) of one leg centered on a custom built transmit and receive 31P MRS coil2, 3 (Supplemental Figure 1). All 1H MRI examinations were performed with the body coil in transmit and receive mode. To minimize exercise contributions from muscle other than the calf muscle the exercising leg was fixed to the table using soft straps.
After positioning of the subject, scout images were acquired to verify the positioning of the leg and the 31P MRS coil. During rest before the graded exercise test, muscle composition of the lower leg was estimated with a set of spin-spin relaxation (T2)-weighted images in all subjects. In a subset of 18 subjects multi-slice water and fat selective imaging of the lower leg was performed using a multipoint Dixon sequence4 and the fat fraction results correlated with those obtained by T2-weighted imaging.
PFE was performed using an MR compatible custom built device that consisted of a foot pedal mechanism to lift an adjustable weight (Fig S1). The weight was lifted with a frequency of 1Hz and the weight was increased at the beginning of each 120s stage, starting with 0.9kg in the first stage, adding 0.9kg for the second stage and 1.8kg for every further stage. Exercise was terminated when the subject reached the point of fatigue and was not able to exercise further. Dynamic 31P MRS acquisitions with a temporal resolution of 2s were started 120s before the beginning of exercise and were continued during and after exercise. Fatigue symptoms were recorded at each work stage with an 11 point Borg scale (0-10). During exercise the subject’s heart rate was monitored using a fingertip pulse oximetry or ECG device
3
and recorded at every exercise stage. Blood pressure was measured and recorded at every exercise stage using a blood pressure cuff on the upper arm. 1H MRI image acquisition and analysis All 1H imaging was performed using the body coil for signal transmission and reception. T2-weighted images (FOV = 220 x 220 x 175 mm³, resolution = 0.78 x 0.78 x 10 mm³, 16 slices, pulse repetition time (TR) = 2141 ms, echo time (TE) = 100 ms) were acquired before and after PFE. Multipoint Dixon images (FOV = 180 x 180 x 296 mm³, resolution = 1 x 1 x 10 mm³, 27 slices, TR = 500 ms, TE = 1.85, 5.3, 8.75, 12.2, 15.65 ms, flip angle = 20°) were acquired before PFE. Images were processed in Matlab (version 2012b; Mathworks, Natick, MA). To estimate the muscular fat content a central slice from the Dixon fat images (when available) and T2-weighted images were selected. Calf muscles were segmented manually to remove bones and the subcutaneous fat layer. For Dixon images muscular fat content was estimated as described by Triplett et al.4. To allow comparison among groups the reported fat fraction was additionally calculated from the T2-weighted images that were available for all subjects. T2-weighted images were normalized by the signal intensity of the subcutaneous fat layer, and pixel values above a threshold of 10% in the calf muscle segment were averaged for fat fraction estimation. 31P MRS data analysis Absolute concentrations of HEPs were estimated as previously described by El-Sharkawy et al2, 3. The unidirectional rate of ATP synthesis through the creatine kinase reaction (PCr to ATP) were analysed as previously described Schar et al.5. The unidirectional rate of ATP synthesis from Pi (Pi to ATP) was analysed the same way by estimating the magnetization of Pi instead of PCr in the γ-ATP saturated spectra and acquiring an additional control saturation scan referenced to the Pi resonance.
Dynamic 31P MRS data were fitted using the AMARES function of the jMRUI package6. To estimate HEP dynamics during exercise the last ten spectra obtained at baseline and at every exercise stage were averaged prior to fitting. Intracellular pH was calculated from the chemical shift difference of the PCr and Pi resonances7. Cytosolic ADP concentration was calculated according to
𝐴𝐷𝑃 =𝐴𝑇𝑃 [𝐶𝑟]
𝑃𝐶𝑟 𝐻$ 𝐾𝑒𝑞
assuming that 15% of the total creatine is unphosphorylated at rest8, and an equilibrium constant of Keq = 1.66x1099. Normalized rates of PCr decline during exercise were estimated by linear regression of the PCr concentration versus the individual work performed at every stage in every subject. Gibbs free energy of ATP hydrolysis (ΔG~ATP) was determined via10:
∆𝐺~𝐴𝑇𝑃 = ∆𝐺' + 𝑅 ∙ 𝑇 ∙ 𝑙𝑜𝑔𝐴𝐷𝑃 [𝑃𝑖][𝐴𝑇𝑃]
where ΔG0 is the standard free energy change, R is the universal gas constant and T is the absolute temperature. Post exercise recovery of PCr after the time point of fatigue was fitted using a mono-exponential function to estimate the individual recovery time of PCr. The calculation of the maximal oxidative capacity (VmaxPCr) was based on Michaelis-Menten kinetics with a Km of 25µM11:
𝑉𝑚𝑎𝑥𝑃𝐶𝑟 = 𝑉𝑖𝑃𝐶𝑟 1 +𝐾𝑚
[𝐴𝐷𝑃]𝑒𝑛𝑑
where [ADP]end is the ADP concentration at end of exercise and ViPCr is the initial rate of PCr recovery according to:
4
𝑉𝑖𝑃𝐶𝑟 =1
𝜏𝑃𝐶𝑟∆𝑃𝐶𝑟
With τPCr being the estimated recovery time of PCr and ΔPCr the concentration difference of PCr between end exercise and baseline conditions during rest.
Finally, some small amount of 31P signal may derive from non-exercising muscle in small subjects or in those with atrophy. However, in those cases, the energetic abnormalities observed here would underestimate, rather than overestimate, the extent of exercise-induced energetic changes in HF. In addition, it is important to emphasize that the PCr recovery kinetics are independent of muscle mass and of the fraction of the muscle sampled. Cardiopulmonary exercise testing Six-minute walk and Cardiopulmonary Exercise Testing (CPET): Six-minute walk tests were performed on a 60-foot section of an enclosed corridor that is free of traffic and with chairs at each end to serve as markers. Patients sat quietly for 10 minutes before initiating the walk. The subjects were observed as they walked their maximum level distance during six minutes. At the conclusion, the distance and BORG symptoms were recorded12. CPET was performed at least 2-3 hours after taking medications with gas-exchange analysis on a MedGraphics Ultima cart during a cycle ergometer protocol with a 25-watt step increase in intensity every 3 minutes. Heart rate, blood pressure, symptoms, and the ECG were recorded at each stage and during recovery and BORG symptoms recorded during each exercise stage13-15. All patients exercise to exhaustion to a goal RER > 1.1 and an RPE > 18. Breath by breath oxygen consumption was measured and reported in 15 second averaged intervals. Peak oxygen consumption was defined as the average of the two highest oxygen uptake values during the last minute of exercise. Six-minute walk test was performed in all subjects except for one HFpEF patient and peak VO2 by CPET was measured in all subjects except in one HFrEF and three HFpEF patients.
Both peak oxygen consumption per kg of true body weight and per kg of ideal body weight were calculated and both showed similar correlations to total exercise work and total exercise time (Supplemental Figure 2). Statistical Methods: Continuous and categorical variables are presented as mean±standard deviation (SD) and numbers (percentages), respectively. We used Shapiro-Wilk test to assess the normality of all continuous variables. Normally distributed variables according to the Shapiro-Wilk test results were age, BMI, 6MW, baseline ADP, pH, ΔG~ATP and CK and Pi->ATP flux, fatigue PCr, pH and ΔG~ATP. The normality test indicated that all other contiguous variables were not normally distributed. These variables were peak VO2; LVEF; baseline PCr, Pi, ATP and PDE; fatigue ATP and ADP; PCr recovery; maximum aerobic capacity; average and initial PCr decline rates; muscle fat fraction; total exercise time; and total work. We used one-way analysis of variance (ANOVA) to determine differences among the four groups and the Student’s t-test for comparisons between HFrEF I group and HFrEF II-III group, when the data were normally distributed. Kruskal Wallis test and Wilcoxon Ranksum test were used for non-normally distributed data for comparisons among the four groups and the pair-wise testing, respectively. We used Bonferroni adjustment for all pairwise comparisons. A Spearman correlation test was used to calculate correlation coefficients. All Statistical analyses were performed using Stata Version 14 (StataCorp LP, College Station, Texas, USA). All tests of hypothesis were conducted at a confidence level of 0.95 under the two-sided alternative.
5
SUPPLEMENTAL REFERENCES 1. Borlaug BA, Melenovsky V, Russell SD, Kessler K, Pacak K, Becker LC,
Kass DA. Impaired chronotropic and vasodilator reserves limit exercise capacity in patients with heart failure and a preserved ejection fraction. Circulation. 2006;114:2138-2147
2. El-Sharkawy AM, Schar M, Ouwerkerk R, Weiss RG, Bottomley PA. Quantitative cardiac 31p spectroscopy at 3 tesla using adiabatic pulses. Magnetic Resonance in Medicine. 2009;61:785-795
3. El-Sharkawy AM, Gabr RE, Schar M, Weiss RG, Bottomley PA. Quantification of human high-energy phosphate metabolite concentrations at 3 t with partial volume and sensitivity corrections. NMR in Biomedicine. 2013;26:1363-1371
4. Triplett WT, Baligand C, Forbes SC, Willcocks RJ, Lott DJ, DeVos S, Pollaro J, Rooney WD, Sweeney HL, Bonnemann CG, Wang DJ, Vandenborne K, Walter GA. Chemical shift-based mri to measure fat fractions in dystrophic skeletal muscle. Magnetic Resonance in Medicine. 2014;72:8-19
5. Schar M, El-Sharkawy AM, Weiss RG, Bottomley PA. Triple repetition time saturation transfer (trist) 31p spectroscopy for measuring human creatine kinase reaction kinetics. Magnetic resonance in medicine. 2010;63:1493-1501
6. Naressi A, Couturier C, Devos JM, Janssen M, Mangeat C, de Beer R, Graveron-Demilly D. Java-based graphical user interface for the mrui quantitation package. MAGMA. 2001;12:141-152
7. Taylor DJ, Bore PJ, Styles P, Gadian DG, Radda GK. Bioenergetics of intact human muscle. A 31P nuclear magnetic resonance study. Molecular Biology & medicine. 1983;1:77-94
8. Boska M. Atp production-rates as a function of force level in the human gastrocnemius soleus using p-31 mrs. Magnetic Resonance in Medicine. 1994;32:1-10
9. Veech RL, Lawson JW, Cornell NW, Krebs HA. Cytosolic phosphorylation potential. The Journal of Biological Chemistry. 1979;254:6538-6547
10. Gibbs C. The cytoplasmic phosphorylation potential - its possible role in the control of myocardial respiration and cardiac contractility. J Mol Cell Cardiol. 1985;17:727-731
11. Kemp GJ, Taylor DJ, Thompson CH, Hands LJ, Rajagopalan B, Styles P, Radda GK. Quantitative analysis by 31P magnetic resonance spectroscopy of abnormal mitochondrial oxidation in skeletal muscle during recovery from exercise. NMR in Biomedicine. 1993;6:302-310
12. Guyatt GH, Sullivan MJ, Thompson PJ, Fallen EL, Pugsley SO, Taylor DW, Berman LB. The 6-minute walk: A new measure of exercise capacity in patients with chronic heart failure. Canadian Medical Association Journal. 1985;132:919
13. Russell SD, Koshkarian GM, Medinger AE, Carson PE, Higginbotham MB. Lack of effect of increased inspired oxygen concentrations on maximal exercise capacity or ventilation in stable heart failure. The American Journal of Cardiology. 1999;84:1412-1416
14. Beere PA, Russell SD, Morey MC, Kitzman DW, Higginbotham MB. Aerobic exercise training can reverse age-related peripheral circulatory changes in healthy older men. Circulation. 1999;100:1085-1094
15. Borlaug BA, Melenovsky V, Russell SD, Kessler K, Pacak K, Becker LC, Kass DA. Impaired chronotropic and vasodilator reserves limit exercise capacity in patients with heart failure and a preserved ejection fraction. Circulation. 2006;114:2138-2147
6
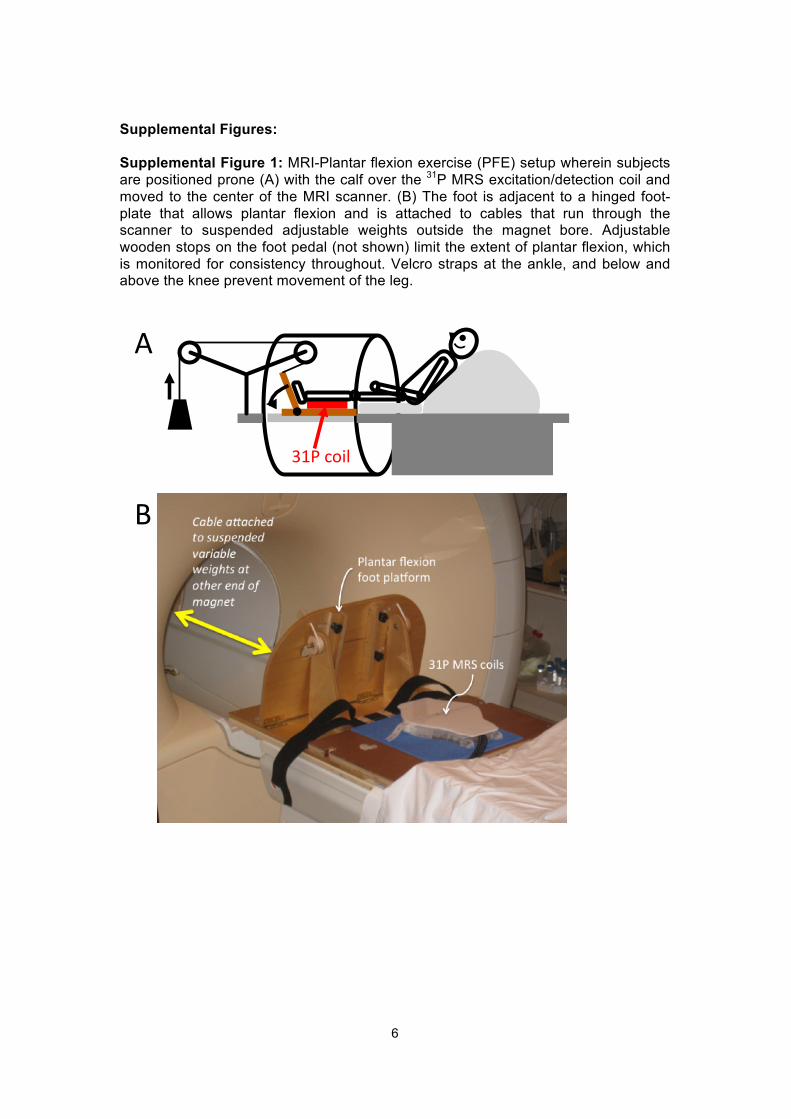
Supplemental Figures: Supplemental Figure 1: MRI-Plantar flexion exercise (PFE) setup wherein subjects are positioned prone (A) with the calf over the 31P MRS excitation/detection coil and moved to the center of the MRI scanner. (B) The foot is adjacent to a hinged foot-plate that allows plantar flexion and is attached to cables that run through the scanner to suspended adjustable weights outside the magnet bore. Adjustable wooden stops on the foot pedal (not shown) limit the extent of plantar flexion, which is monitored for consistency throughout. Velcro straps at the ankle, and below and above the knee prevent movement of the leg.
31P$coil$
A
B
7
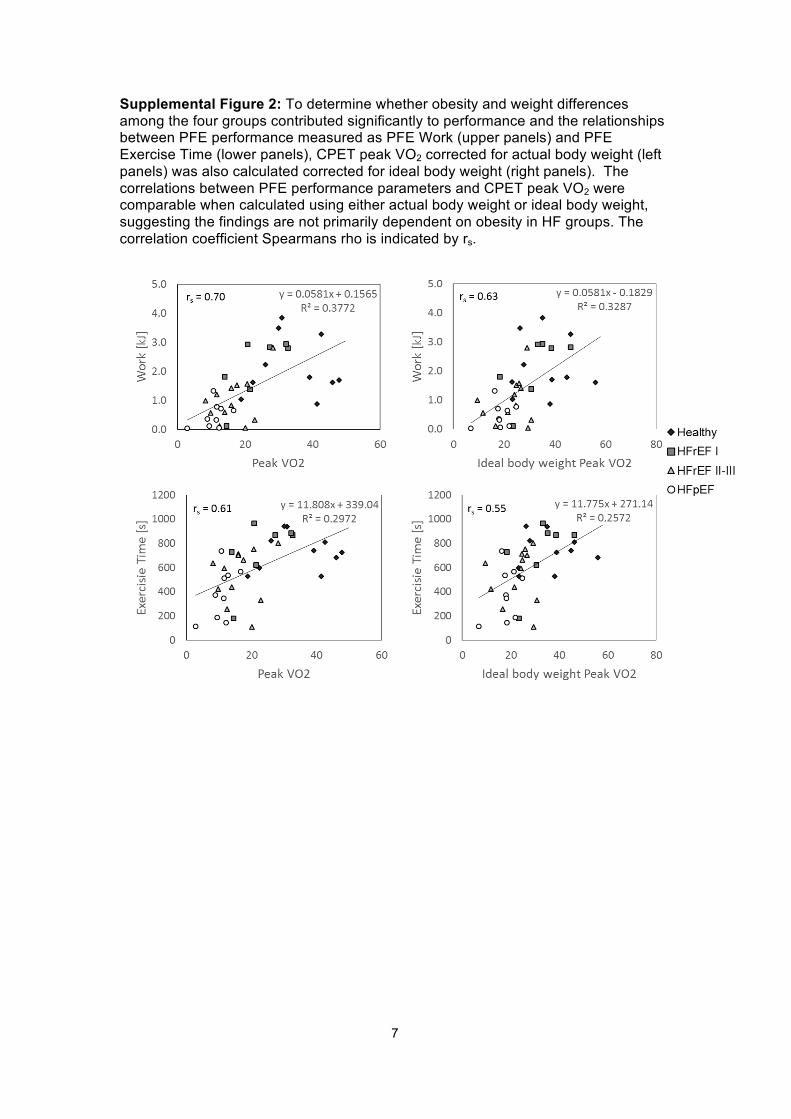
Supplemental Figure 2: To determine whether obesity and weight differences among the four groups contributed significantly to performance and the relationships between PFE performance measured as PFE Work (upper panels) and PFE Exercise Time (lower panels), CPET peak VO2 corrected for actual body weight (left panels) was also calculated corrected for ideal body weight (right panels). The correlations between PFE performance parameters and CPET peak VO2 were comparable when calculated using either actual body weight or ideal body weight, suggesting the findings are not primarily dependent on obesity in HF groups. The correlation coefficient Spearmans rho is indicated by rs.
8
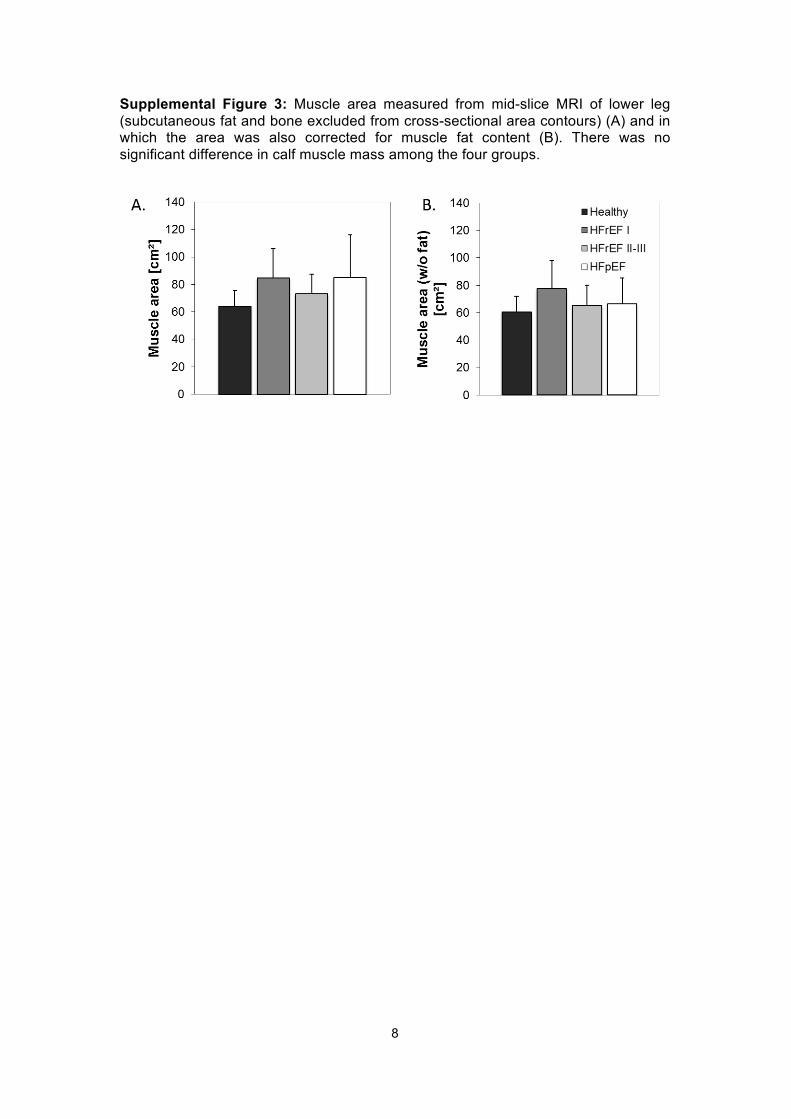
Supplemental Figure 3: Muscle area measured from mid-slice MRI of lower leg (subcutaneous fat and bone excluded from cross-sectional area contours) (A) and in which the area was also corrected for muscle fat content (B). There was no significant difference in calf muscle mass among the four groups.
9
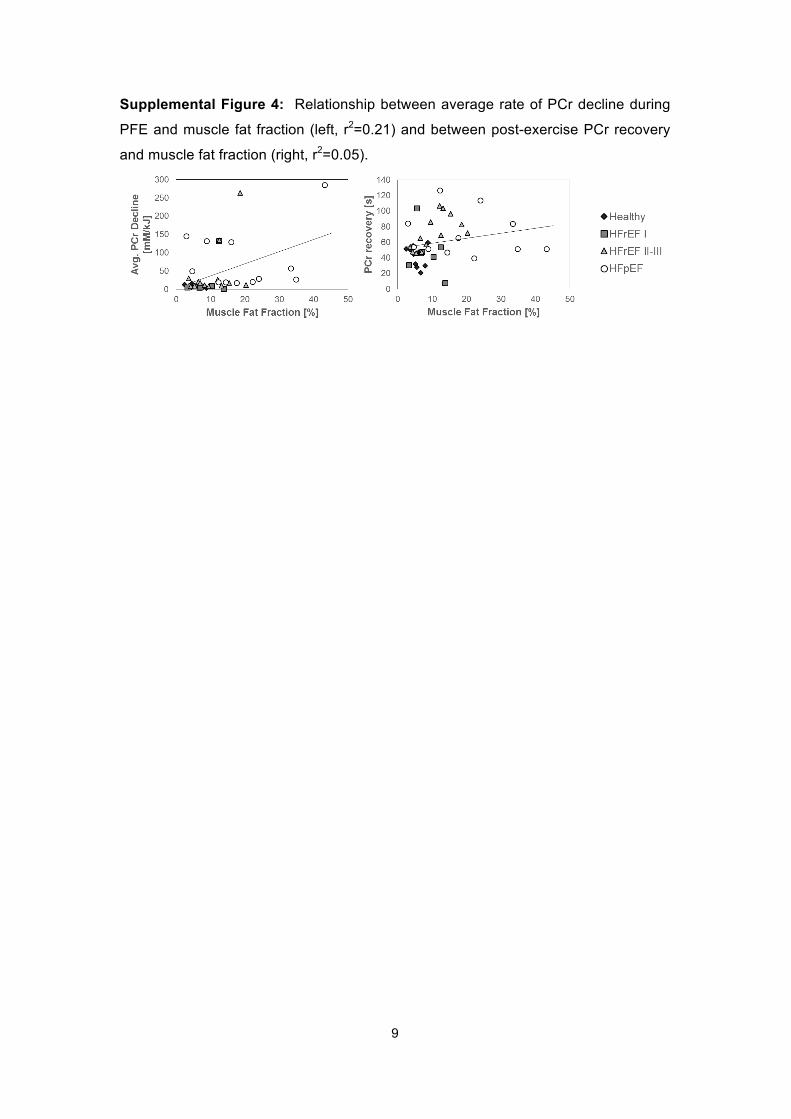
Supplemental Figure 4: Relationship between average rate of PCr decline during
PFE and muscle fat fraction (left, r2=0.21) and between post-exercise PCr recovery
and muscle fat fraction (right, r2=0.05).