Super-hard X-Ray Emission from Carinae Observed with Suzaku · flat power-law or a very hot...
10
arXiv:0903.3307v1 [astro-ph.SR] 19 Mar 2009 PASJ: Publ. Astron. Soc. Japan , 1–??, c 2018. Astronomical Society of Japan. Super-hard X-Ray Emission from η Carinae Observed with Suzaku Akiko Sekiguchi, 1,2 Masahiro Tsujimoto 1,3∗ Shunji Kitamoto 4 , Manabu Ishida 1 , Kenji Hamaguchi 5,6 , Hideyuki Mori 1 , and Yohko Tsuboi 7 1 Japan Aerospace Exploration Agency, Institute of Space and Astronautical Science, 3-1-1 Yoshino-dai, Sagamihara, Kanagawa 229-8510 2 School of Physical Science, Space and Aeronautical Science, The Graduate University for Advanced Studies Hayama-cho, Miura-gun, Kanagawa 240-0193 [email protected] 3 Department of Astronomy & Astrophysics, Pennsylvania State University, 525 Davey Laboratory, University Park, PA 16802, USA 4 Department of Physics, Rikkyo University, 3-34-1 Nishi-Ikebukuro, Toshima-ku, Tokyo 171-8501 5 CRESST and X-ray Astrophysics Laboratory NASA Goddard Space Flight Center, Greenbelt, MD 20771, USA 6 Department of Physics, University of Maryland, Baltimore County, 1000 Hilltop Circle, Baltimore, MD 21250, USA 7 Department of Science and Engineering, Chuo University, 1-13-27 Kasuga, Bunkyo-ku, Tokyo 112-8551 (Received 2018 September 5; accepted 0 0) Abstract We present the Suzaku results of η Carinae in the 5–50 keV range conducted twice around the apastron in 2005 August for 50 ks and in 2006 February for 20 ks. The X-ray Imaging Spectrometer (XIS) produced hard (5–12 keV) band spectra, resolving K shell lines from highly ionized Fe and Ni. The Hard X-ray Detector yielded a significant detection in the super-hard (15–50 keV) band, which is uncontaminated by near-by sources. We constrained the temperature of the optically-thin thermal plasma emission dominant in the hard band as 3–4 keV using the K-shell line features with the XIS. We found significant excess emission above the thermal emission in the super-hard band with the PIN, confirming the previous INTEGRAL ISGRI report. The entire 5–50 keV spectra were fitted by a combination of a thermal plasma model plus a flat power-law or a very hot thermal bremsstrahlung model for the excess emission. No significant change of the excess emission was found at different epochs within the systematic and statistical uncertainties and no flare-like flux amplification was seen in the hard band, indicating that the excess emission is a steady phenomenon. We argue that the super-hard emission is attributable to the inverse Compton of stellar UV photons by non-thermal electrons or to the thermal bremsstrahlung of very hot plasma, and not to the bremsstrahlung by non-thermal electrons colliding with cold ambient matter. Key words: stars: binaries: general — stars: early-type — stars: individual (η Carinae) — X-rays: stars 1. Introduction Colliding wind binaries (CWBs), a binary system com- prised of two early-type stars with stellar winds at high mass loss rates and velocities, are the brightest class of stellar hard X-ray emitters. Theoretical interpreta- tions are given for their luminous hard X-rays as the thermal emission from high-temperature plasma produced by strong shocks due to the colliding winds (Luo et al. 1990; Stevens et al. 1992; Usov 1992). The interpre- tation is supported by the X-ray modulation observed along the orbital motion in some CWBs (Stevens et al. 1996; Ishibashi et al. 1999; Zhekov & Skinner 2000). CWBs are also expected to be an agent of cosmic par- ticle acceleration, which is evidenced by the presence of non-thermal radio emission from e. g., WR 140 (White & Becker 1995). Charged particles with an energy distribu- tion deviating from the Maxwellian distribution give rise * Chandra Fellow to the X-ray emission harder than the thermal emission dominant below 10 keV, thus the presence and the pro- cess of particle acceleration in CWBs can be best studied in the super-hard X-ray band. For convenience, we refer to the 5–12 keV range as “hard” X-ray band, while the >15 keV range as “super-hard” X-ray band. The investigation of the super-hard emission from CWBs is important to unveil their enigmatic nature, and possibly gives a clue to understand the origin of γ -ray emission reported from some massive star clusters con- taining CWBs (Aharonian et al. 2007). We anticipate a great leap in our comprehension of non-thermal phenom- ena in CWBs with the advent of X-ray imaging telescopes in the super-hard band, which will be deployed in the next generation X-ray satellites such as Astro-H (Takahashi et al. 2008). At present, however, our tool is limited to non- imaging or coded-mask techniques in this band, leaving η Carina the only practical target for this subject. η Car is a luminous blue variable in the Carina nebula at a distance of 2.3 kpc (Davidson & Humphreys 1997).
Transcript of Super-hard X-Ray Emission from Carinae Observed with Suzaku · flat power-law or a very hot...
arX
iv:0
903.
3307
v1 [
astr
o-ph
.SR
] 1
9 M
ar 2
009
PASJ: Publ. Astron. Soc. Japan , 1–??,c© 2018. Astronomical Society of Japan.
Super-hard X-Ray Emission from η Carinae Observed with Suzaku
Akiko Sekiguchi,1,2 Masahiro Tsujimoto1,3∗ Shunji Kitamoto4, Manabu Ishida1, Kenji Hamaguchi5,6,Hideyuki Mori1, and Yohko Tsuboi7
1Japan Aerospace Exploration Agency, Institute of Space and Astronautical Science,
3-1-1 Yoshino-dai, Sagamihara, Kanagawa 229-85102School of Physical Science, Space and Aeronautical Science, The Graduate University for Advanced Studies
Hayama-cho, Miura-gun, Kanagawa 240-0193
[email protected] of Astronomy & Astrophysics, Pennsylvania State University,
525 Davey Laboratory, University Park, PA 16802, USA4Department of Physics, Rikkyo University, 3-34-1 Nishi-Ikebukuro, Toshima-ku, Tokyo 171-8501
5CRESST and X-ray Astrophysics Laboratory NASA Goddard Space Flight Center, Greenbelt, MD 20771, USA6Department of Physics, University of Maryland, Baltimore County, 1000 Hilltop Circle, Baltimore, MD 21250, USA
7Department of Science and Engineering, Chuo University, 1-13-27 Kasuga, Bunkyo-ku, Tokyo 112-8551
(Received 2018 September 5; accepted 0 0)
Abstract
We present the Suzaku results of η Carinae in the 5–50 keV range conducted twice around the apastronin 2005 August for 50 ks and in 2006 February for 20 ks. The X-ray Imaging Spectrometer (XIS) producedhard (5–12 keV) band spectra, resolving K shell lines from highly ionized Fe and Ni. The Hard X-rayDetector yielded a significant detection in the super-hard (15–50 keV) band, which is uncontaminated bynear-by sources. We constrained the temperature of the optically-thin thermal plasma emission dominant inthe hard band as 3–4 keV using the K-shell line features with the XIS. We found significant excess emissionabove the thermal emission in the super-hard band with the PIN, confirming the previous INTEGRALISGRI report. The entire 5–50 keV spectra were fitted by a combination of a thermal plasma model plus aflat power-law or a very hot thermal bremsstrahlung model for the excess emission. No significant changeof the excess emission was found at different epochs within the systematic and statistical uncertainties andno flare-like flux amplification was seen in the hard band, indicating that the excess emission is a steadyphenomenon. We argue that the super-hard emission is attributable to the inverse Compton of stellar UVphotons by non-thermal electrons or to the thermal bremsstrahlung of very hot plasma, and not to thebremsstrahlung by non-thermal electrons colliding with cold ambient matter.
Key words: stars: binaries: general — stars: early-type — stars: individual (η Carinae) — X-rays:stars
1. Introduction
Colliding wind binaries (CWBs), a binary system com-prised of two early-type stars with stellar winds at highmass loss rates and velocities, are the brightest classof stellar hard X-ray emitters. Theoretical interpreta-tions are given for their luminous hard X-rays as thethermal emission from high-temperature plasma producedby strong shocks due to the colliding winds (Luo et al.1990; Stevens et al. 1992; Usov 1992). The interpre-tation is supported by the X-ray modulation observedalong the orbital motion in some CWBs (Stevens et al.1996; Ishibashi et al. 1999; Zhekov & Skinner 2000).CWBs are also expected to be an agent of cosmic par-
ticle acceleration, which is evidenced by the presence ofnon-thermal radio emission from e. g., WR140 (White &Becker 1995). Charged particles with an energy distribu-tion deviating from the Maxwellian distribution give rise
∗ Chandra Fellow
to the X-ray emission harder than the thermal emissiondominant below 10 keV, thus the presence and the pro-cess of particle acceleration in CWBs can be best studiedin the super-hard X-ray band. For convenience, we referto the 5–12 keV range as “hard” X-ray band, while the>15 keV range as “super-hard” X-ray band.The investigation of the super-hard emission from
CWBs is important to unveil their enigmatic nature, andpossibly gives a clue to understand the origin of γ-rayemission reported from some massive star clusters con-taining CWBs (Aharonian et al. 2007). We anticipate agreat leap in our comprehension of non-thermal phenom-ena in CWBs with the advent of X-ray imaging telescopesin the super-hard band, which will be deployed in the nextgeneration X-ray satellites such as Astro-H (Takahashi etal. 2008). At present, however, our tool is limited to non-imaging or coded-mask techniques in this band, leaving ηCarina the only practical target for this subject.η Car is a luminous blue variable in the Carina nebula
at a distance of 2.3 kpc (Davidson & Humphreys 1997).
2 A. Sekiguchi et al. [Vol. ,
Table 1. Observation log.
Number Sequence Observation start Observation end Exposure (ks) Orbitalnumber Date Time Date Time XIS HXD phase∗
First 100012010 2005-08-29 01:48 2005-08-30 01:30 50 53 1.39Second 100045010 2006-02-03 09:59 2006-02-03 22:45 21 17 1.47
∗ The orbital phase 1.0 indicates the onset of the Cycle 11 minimum at the Julian date 2452819.8 d (Damineli et al. 2008).
It is considered to constitute a binary system with an-other massive star with an orbital period of 2022.7±1.3 d(Damineli et al. 2008) in a highly eccentric orbit (Nielsenet al. 2007). In this paper, we use the orbital phase suchthat the start of the Cycle 11 minimum is phase 1.0 onthe Julian date of 2452819.8 d (Damineli et al. 2008) or2003 June 29.3. η Car is one of the brightest stellar hardX-ray sources, and the hard X-ray modulation along theproposed ephemeris endorses the colliding-wind origin ofthe emission (Ishibashi et al. 1999).The development of the X-ray light curve through an
orbital phase is as follows; it experiences an eclipse fromphase 0 to 0.03 (we call “minimum”), recovers its bright-ness spending ∼0.02 phases (“recovery”), and graduallyincreases the flux for the rest of the phase (“steady in-crease”) to reach the brightest point (“maximum”), whichis terminated by the repeated eclipse in the next phase(Ishibashi et al. 1999; Pittard & Corcoran 2002). The pe-riastron and the apastron are supposed to occur aroundphase 0.0 and 0.5, respectively (e. g., Fernandez-Lajus etal. 2009). During the development, η Car shows episodicflares (Ishibashi et al. 1999; Hamaguchi et al. 2007a). Thespectrum of η Car below 10 keV has been described bycomplex models comprised of several thin-thermal plasmacomponents with different temperatures, but a singleplasma component of a 3–4 keV temperature dominatesthe hard band emission (Tsuboi et al. 1997; Corcoran etal. 1998).
X-ray studies of η Car in the super-hard band wereconducted by two observatories to date. One is byBeppoSAX using a combination of a gas scintillation pro-portional counter (MECS; Medium Energy ConcentratorSpectrometer) below 10 keV and a non-imaging phoswichscintillators (PDS; Phoswich Detection System) above15 keV. Viotti et al. (2002) and Viotti et al. (2004) con-strained the parameters of the 3–4 keV plasma componentusing the hard band data by the MECS, and extrapolatedthe model to claim that the PDS data contain excess emis-sion upon the 3–4 keV thermal emission. The other is bythe INTErnational Gamma-Ray Astrophysics Laboratory(INTEGRAL) using a coded-mask imager (ISGRI; theINTEGRAL Soft Gamma-Ray Imager) in the 15 keV–1 MeV range. Leyder et al. (2008) unambiguously con-firmed the super-hard emission claimed by the BeppoSAXstudies, showing that the ISGRI image has a significantsignal at the position of η Car.When it comes to characterizing the spectrum of the
super-hard excess emission, the results produced by thetwo observatories have a limited use with some concerns.The PDS is a non-imaging instrument with a wide field
of view of 1.◦3 in the full width at the half maximum(FWHM), thus the contamination by other sources is in-evitable. Indeed, as was pointed out by Leyder et al.(2008), two neighboring super-hard sources (IGRJ10447–6027 and 1E1048.1–5937) are within the PDS field ofview, which significantly contribute to the PDS spectrumof η Car. The ISGRI resolved super hard emission fromη Car and is free from the contamination by these twosources. However, its spectrum does not have rich statis-tics with only three spectral bins for a total of a 1 Msexposure. The flux variation cannot be tested. Also, theexcess emission was examined against the extrapolatedmodel of the 3–4 keV thermal emission obtained by theMECS at a different epoch, which may not be very ap-propriate given the variable nature of the hard X-rays ofη Car.The detection and the characterization of the excess
emission in the super-hard band heavily depend on theaccurate characterization and subtraction of the 3–4 keVthermal emission. The examination of the excess emis-sion is straight-forward, but it requires a careful treat-ment since the extrapolation of the 3–4 keV thermal modelneeds to be stretched for nearly an order of magnitude inthe energy range.With these concerns, it is not surprising that the
BeppoSAX and the INTEGRAL data resulted in a seriousdisagreement with each other for the super-hard excessemission. While the former claims the power-law modelof a photon index of 2.42±0.04, the latter claims 1±0.4.Moreover, the flux estimates are inconsistent significantlyby a factor of 3. It is unclear, in the first place, whetherthe super-hard excess emission is of a thermal or a non-thermal origin.
To mitigate some of these concerns in the previous stud-ies, we present the 5–50 keV results of Suzaku observationsconducted in 2005 August and 2006 February. The non-imaging detector in the super-hard band on board Suzakuhas a narrower field of view than that of the PDS and isfree from the contamination by the two neighboring superhard sources. The X-ray charge coupled devices (CCDs)sensitive below 12 keV have good and well-calibrated re-sponses in the hard band. Their spectroscopic capabilityoutperforms that of the MECS, resolving emission linesin the Fe and Ni K complex in the 6.0–8.5 keV band andthus enabling an accurate temperature determination ofthe 3–4 keV plasma sufficient to extrapolate toward thesuper-hard band.We present the spectral models to explain the 5–50 keV
emission of η Car at two epochs around the apastron. Weexamine the thermal or non-thermal nature of the super
No. ] Suzaku Observation of η Car 3
hard excess emission and investigate its flux variability.The results will set a firm basis to study the developmentof the super-hard emission in an entire orbital cycle, whichwe plan to conduct in a separate paper with the new dataobtained at the end of 2008 during the latest X-ray max-imum and minimum.
2. Observations and Data Reduction
The Suzaku satellite (Mitsuda et al. 2007) observed theCarina nebula multiple times since its launch. We presentthe results of η Car in the first two observations on 2005August 29 and 2006 February 3 in this paper, duringwhich the object was around the apastron at the orbitalphases of 1.39 and 1.47, respectively (table 1). The twoobservations were centered at (RA, Dec) = (10h45m03.s6,−59◦41′04′′) in the equinox J2000.0 with nearly the oppo-site position angles. Using the first data set, Hamaguchiet al. (2007b) studied the soft diffuse emission around ηCar.Suzaku has a low earth orbit with an altitude of
∼570 km. The observatory has two working instruments;the X-ray Imaging Spectrometer (XIS; Koyama et al.2007) and the Hard X-ray Detector (HXD; Takahashi etal. 2007; Kokubun et al. 2007), which respectively coversthe energy range of 0.2–12 keV and 10–600 keV.The XIS is an imaging spectrometer using X-ray CCDs
with a format of 1024×1024 pixels. Four CCD cameras areinstalled in the focal planes of four X-ray telescope mod-ules (Serlemitsos et al. 2007) coaligned with each other.Three of the four cameras (XIS 0, 2, and 3) are front-illuminated (FI) devices and the remaining one (XIS1) isback-illuminated (BI). The FI and the BI CCDs have su-perior sensitivity to each other in the hard and the softbands, respectively. The energy resolution, which is sub-ject to degradation in the orbit, is ∼140 eV and ∼160 eVat 5.9 keV in FWHM respectively for the first and the sec-ond observations. The absolute energy gain is accurate to∼0.2% at 5.9 keV. Together with the XRT, the XIS coversa field of view of 18′×18′ with a pixel scale of 1′′ pixel−1.The half-power diameter of the XRT is 1.′8–2.′3, which isalmost independent of energy.The HXD is a non-imaging spectrometer, consisting
of several components responsible for different energyranges. In this paper, we use the PIN component sen-sitive at 10–70 keV with an FWHM energy resolution of3.0 keV. The PIN detector is composed of 64 Si PIN diodesinstalled at the bottom of 8×8 well-type collimators sur-rounded by GSO scintillators. The fine collimators withineach well restrict the field of view. The effective areamonotonically decreases as an increasing distance from thefield center, which is characterized by the FWHM view of∼34′ or the full width at zero intensity (FWZI) view of70′ square (figure 1). The center of the PIN field is 3.′5offset from that of the the XIS field. Thanks to the sur-rounding anti-coincidence scintillators, the narrow field ofview, and the low background environment in the orbit,the PIN achieves unprecedented sensitivity in the super-hard band.
In both observations, the XIS is operated in the nor-mal clocking mode with a frame time of 8 s. We usedthe cleaned event lists produced by the pipeline process-ing version 2.0. The net exposure times are compiled intable 1. We used the HEASoft version 6.5.11 for the datareduction and Xspec version 11.3.22 for the X-ray spectralanalysis.
3. Analysis
3.1. Constructing the Spectra
3.1.1. XIS
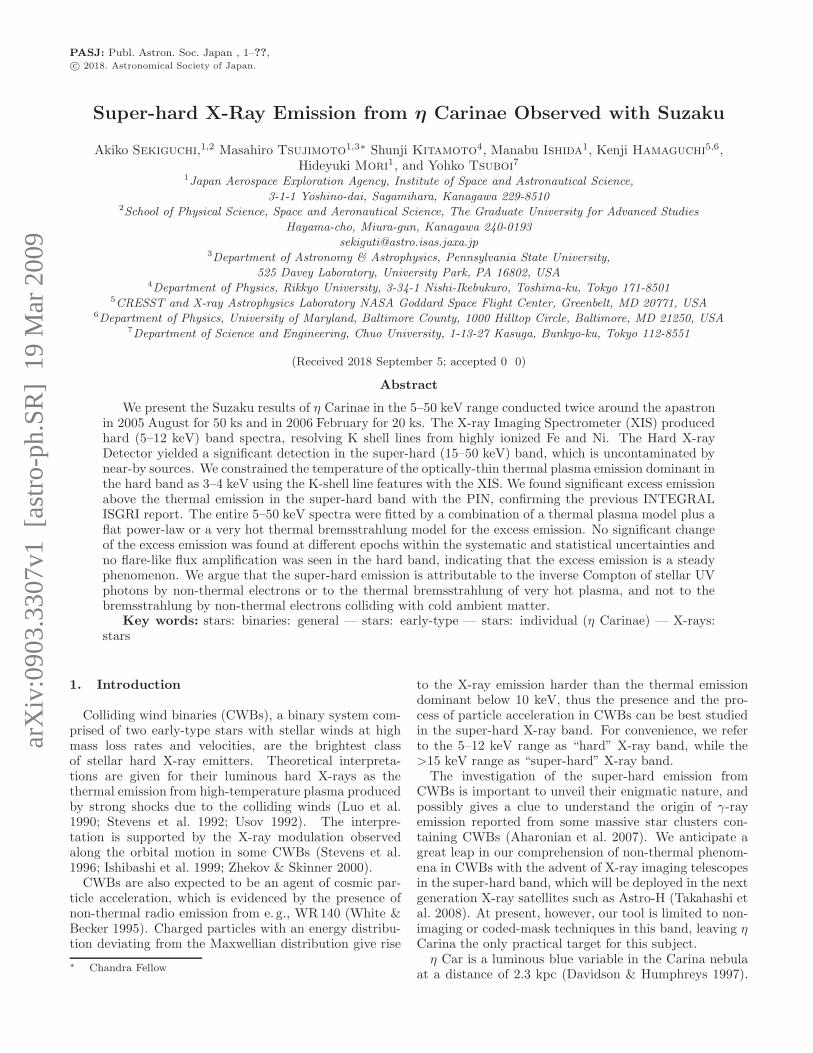
Figure 1 (b) shows the XIS image in the first observa-tion. Three point sources are recognized besides η Car:HD 93250, HD93205, and WR25, all of which are mas-sive stars in this region. The underlying diffuse emission,which is a combination of unresolved point sources andthe soft extended emission (Evans et al. 2003; Evans etal. 2004; Albacete Colombo et al. 2003; Hamaguchi et al.2007b), is noticeable particularly in the western half of theimage. The second observation produced a similar image.In order to construct the XIS spectra, we extracted the
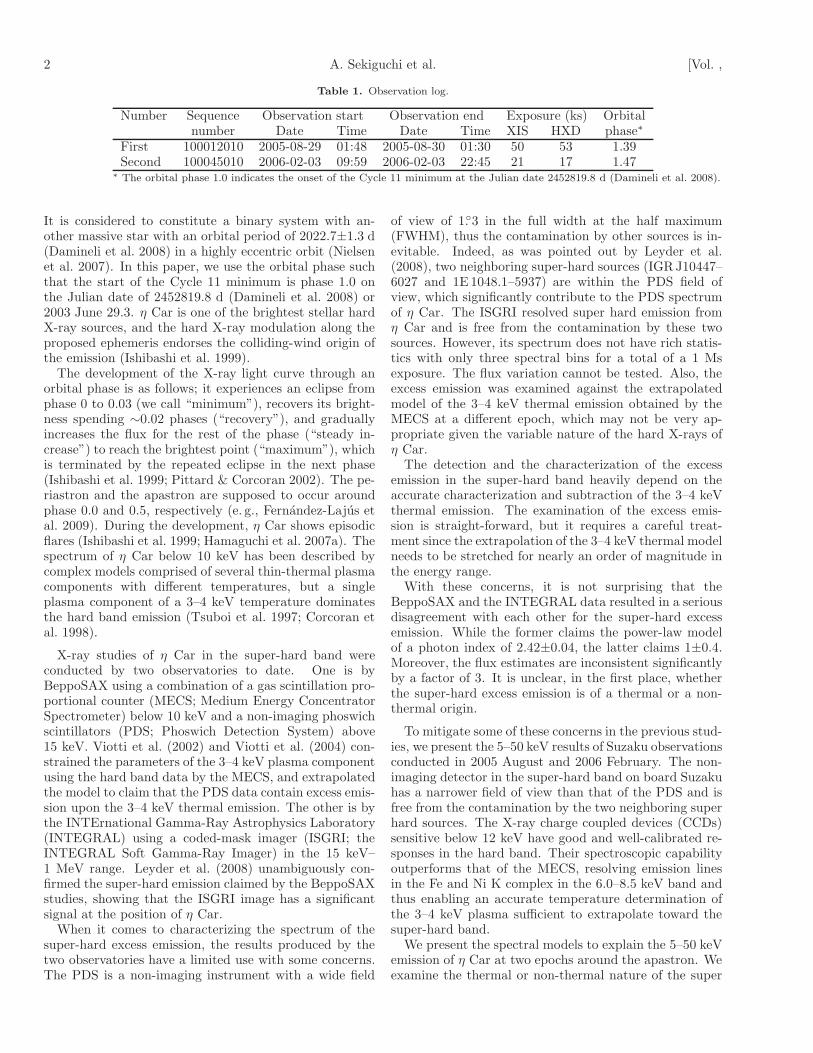
source and the background events from the solid and thedashed circles in figure 1 (b), respectively. The sourceextraction region is a 3′ radius circle containing ∼95%of photons from a point-like source at the circle center.The background region is selected from a region devoidof bright emission. The pile-up is negligible. The wingsof other point sources and the underlying diffuse emis-sion contribute to the background, which is negligible inour targeted energy range. This is illustrated by the factthat the emission above 5 keV at the X-ray minimum ofη Car, which gives the upper limit to the contaminationby irrelevant emission, is roughly two orders of magnitudesmaller than that in the X-ray bright phase (Hamaguchiet al. 2007a).We constructed hard band light curves of the count rate
during the 50 and 21 ks exposures in the first and the sec-ond observations, respectively, and found no significantflux changes such as flare-like variability (figure 2). Forthe spectral modeling, we merged the spectra obtained bythe three FI devices with nearly identical responses. Themerged FI spectrum has a good signal up to ∼12 keV,while the BI spectrum is effective up to ∼9 keV. We gen-erated the redistribution matrix functions and the ancil-lary response files using the xisrmfgen and xissimarfgen
tools (Ishisaki et al. 2007), respectively.3.1.2. PIN
Figure 1 (a) shows the field of view of the PIN detector.One of the two INTEGRAL sources (IGR J10447–6027)is outside of the FWZI view. The other (1E 1048.1–5937)is close to the edge of the view in both observations, atwhich the effective area decreases to less than 5% of thevalue at the field center. Leyder et al. (2008) claimed theINTEGRAL ISGRI count rate of 0.16 s−1 for η Car and
1 See http://heasarc.gsfc.nasa.gov/docs/software/lheasoft/ fordetail.
2 See http://heasarc.gsfc.nasa.gov/docs/xanadu/xspec/index.htmlfor detail.
4 A. Sekiguchi et al. [Vol. ,
10pc at 2.3 kpc
(a) DSS image
10:40:004244464810:50:00
RA (J2000.0)
De
c (
J2
00
0.0
)
-60
:00
:00
-59
:00
:00
20
40
20
XIS
PIN (FWZI)
PIN (F
WHM)
Carη
IGR J10447-6027
1E 1048.1-5937
(b) XIS image
10:44:00303030 10:46 10:45
RA (J2000.0)
-59
:40
:00
-59
:35
-59
:30
-59
:45
-59
:50
Car
HD 93205
HD 93250
WR 25
η
sourcebackground
Fig. 1. (a) Fields of view of the XIS (small solid square) and the PIN (large solid square for FWZI and dashed region for FWHM)in the first observation overlaid on an optical image by the Digitized Sky Survey around η Car. The positions of the INTEGRALsuper-hard sources are shown (Leyder et al. 2008) with crosses. (b) XIS image in the first observation. The events obtained bythe four CCDs are merged. The positions and the names of η Car and the neighboring resolved bright X-ray sources are labeled.The solid and the dashed circles represent the source and the background extraction regions, respectively. The X-ray events in thecorners stem from the calibration sources.
0.4
0.5
0.6
0.7
0.8
0.9
1.0
1.1
1.2
0 10 20 30 40 50 60 70 80
Cou
nt r
ate
(s-1
)
Elapsed time (ks)
(a) First
0 10 20 30 40 50
Elapsed time (ks)
(b) Second
Fig. 2. XIS 5–10 keV light curve binned with 400 s bin−1 in (a) the first and (b) the second observations. The best-fit constantmodel is shown with the dashed lines. The origin of the abscissa is the start of the observation.
No. ] Suzaku Observation of η Car 5
Inte
nsity
(s-1
keV
-1)
(a) First
Fe
I Kα
Fe
K e
dge
Fe
XX
V K
α
Fe
XX
VI K
α
Ni X
XV
II K
α
Fe
XX
V K
βF
e X
XV
I Kβ
Fe
XX
V K
γ
10.
10.
01FIBI
5.0 6.0 7.0 8.0 9.0 10.0
Inte
nsity
(s-1
keV
-1)
Energy (keV)
(b) Second10.
10.
01
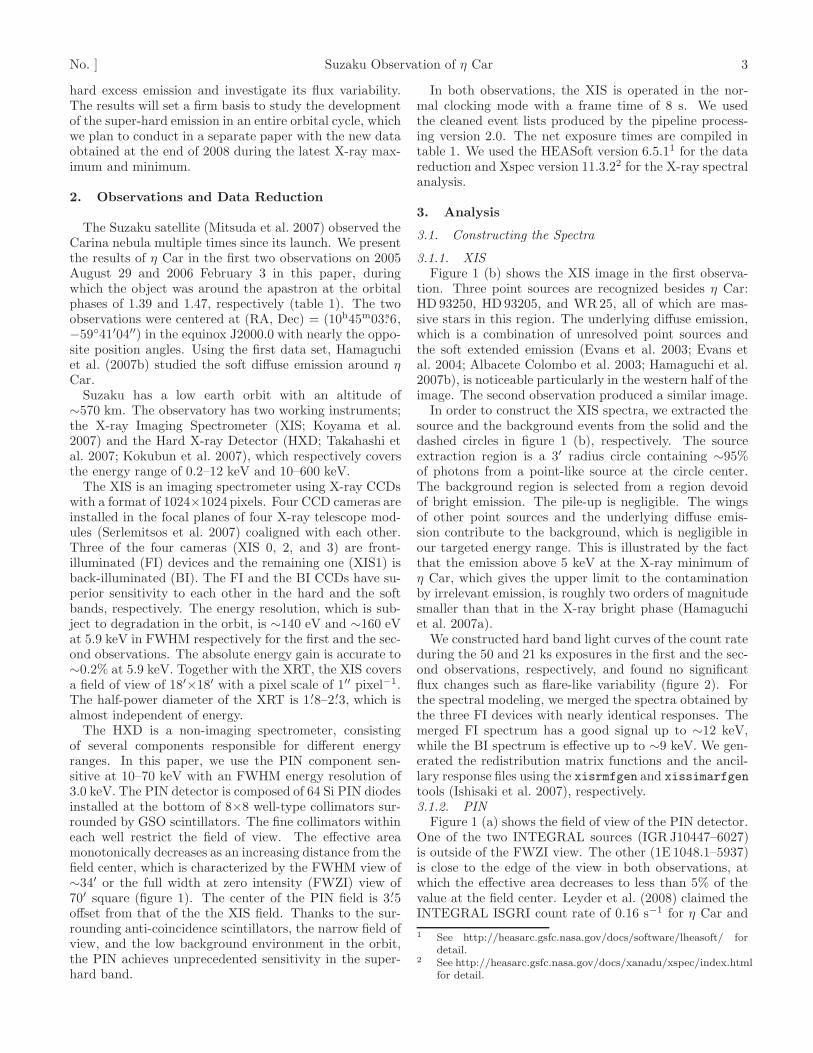
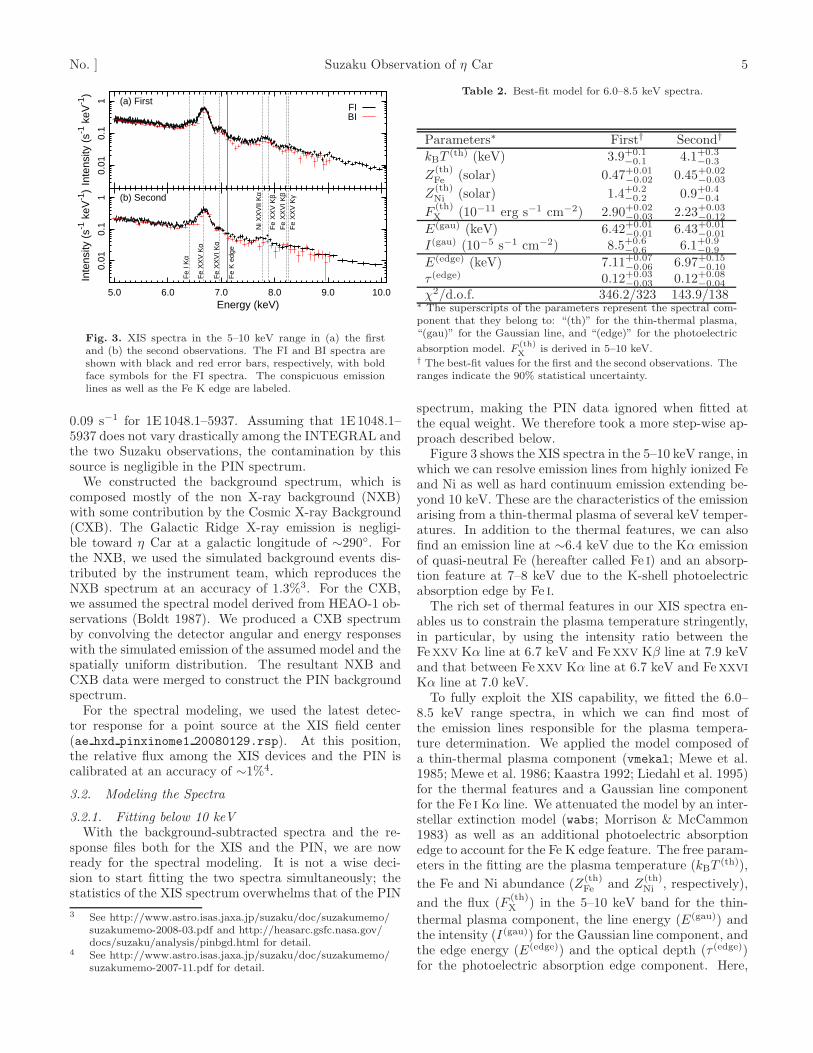
Fig. 3. XIS spectra in the 5–10 keV range in (a) the firstand (b) the second observations. The FI and BI spectra areshown with black and red error bars, respectively, with boldface symbols for the FI spectra. The conspicuous emissionlines as well as the Fe K edge are labeled.
0.09 s−1 for 1E 1048.1–5937. Assuming that 1E1048.1–5937 does not vary drastically among the INTEGRAL andthe two Suzaku observations, the contamination by thissource is negligible in the PIN spectrum.We constructed the background spectrum, which is
composed mostly of the non X-ray background (NXB)with some contribution by the Cosmic X-ray Background(CXB). The Galactic Ridge X-ray emission is negligi-ble toward η Car at a galactic longitude of ∼290◦. Forthe NXB, we used the simulated background events dis-tributed by the instrument team, which reproduces theNXB spectrum at an accuracy of 1.3%3. For the CXB,we assumed the spectral model derived from HEAO-1 ob-servations (Boldt 1987). We produced a CXB spectrumby convolving the detector angular and energy responseswith the simulated emission of the assumed model and thespatially uniform distribution. The resultant NXB andCXB data were merged to construct the PIN backgroundspectrum.For the spectral modeling, we used the latest detec-
tor response for a point source at the XIS field center(ae hxd pinxinome1 20080129.rsp). At this position,the relative flux among the XIS devices and the PIN iscalibrated at an accuracy of ∼1%4.
3.2. Modeling the Spectra
3.2.1. Fitting below 10 keV
With the background-subtracted spectra and the re-sponse files both for the XIS and the PIN, we are nowready for the spectral modeling. It is not a wise deci-sion to start fitting the two spectra simultaneously; thestatistics of the XIS spectrum overwhelms that of the PIN
3 See http://www.astro.isas.jaxa.jp/suzaku/doc/suzakumemo/suzakumemo-2008-03.pdf and http://heasarc.gsfc.nasa.gov/docs/suzaku/analysis/pinbgd.html for detail.
4 See http://www.astro.isas.jaxa.jp/suzaku/doc/suzakumemo/suzakumemo-2007-11.pdf for detail.
Table 2. Best-fit model for 6.0–8.5 keV spectra.
Parameters∗ First† Second†
kBT(th) (keV) 3.9+0.1
−0.1 4.1+0.3−0.3
Z(th)Fe (solar) 0.47+0.01
−0.02 0.45+0.02−0.03
Z(th)Ni (solar) 1.4+0.2
−0.2 0.9+0.4−0.4
F(th)X (10−11 erg s−1 cm−2) 2.90+0.02
−0.03 2.23+0.03−0.12
E(gau) (keV) 6.42+0.01−0.01 6.43+0.01
−0.01
I(gau) (10−5 s−1 cm−2) 8.5+0.6−0.6 6.1+0.9
−0.9
E(edge) (keV) 7.11+0.07−0.06 6.97+0.15
−0.10
τ (edge) 0.12+0.03−0.03 0.12+0.08
−0.04
χ2/d.o.f. 346.2/323 143.9/138∗ The superscripts of the parameters represent the spectral com-ponent that they belong to: “(th)” for the thin-thermal plasma,“(gau)” for the Gaussian line, and “(edge)” for the photoelectric
absorption model. F(th)X
is derived in 5–10 keV.† The best-fit values for the first and the second observations. Theranges indicate the 90% statistical uncertainty.
spectrum, making the PIN data ignored when fitted atthe equal weight. We therefore took a more step-wise ap-proach described below.Figure 3 shows the XIS spectra in the 5–10 keV range, in
which we can resolve emission lines from highly ionized Feand Ni as well as hard continuum emission extending be-yond 10 keV. These are the characteristics of the emissionarising from a thin-thermal plasma of several keV temper-atures. In addition to the thermal features, we can alsofind an emission line at ∼6.4 keV due to the Kα emissionof quasi-neutral Fe (hereafter called Fe I) and an absorp-tion feature at 7–8 keV due to the K-shell photoelectricabsorption edge by Fe I.The rich set of thermal features in our XIS spectra en-
ables us to constrain the plasma temperature stringently,in particular, by using the intensity ratio between theFeXXV Kα line at 6.7 keV and FeXXV Kβ line at 7.9 keVand that between FeXXV Kα line at 6.7 keV and FeXXVI
Kα line at 7.0 keV.To fully exploit the XIS capability, we fitted the 6.0–
8.5 keV range spectra, in which we can find most ofthe emission lines responsible for the plasma tempera-ture determination. We applied the model composed ofa thin-thermal plasma component (vmekal; Mewe et al.1985; Mewe et al. 1986; Kaastra 1992; Liedahl et al. 1995)for the thermal features and a Gaussian line componentfor the Fe I Kα line. We attenuated the model by an inter-stellar extinction model (wabs; Morrison & McCammon1983) as well as an additional photoelectric absorptionedge to account for the Fe K edge feature. The free param-eters in the fitting are the plasma temperature (kBT
(th)),
the Fe and Ni abundance (Z(th)Fe and Z
(th)Ni , respectively),
and the flux (F(th)X ) in the 5–10 keV band for the thin-
thermal plasma component, the line energy (E(gau)) andthe intensity (I(gau)) for the Gaussian line component, andthe edge energy (E(edge)) and the optical depth (τ (edge))for the photoelectric absorption edge component. Here,
6 A. Sekiguchi et al. [Vol. ,In
tens
ity (
s-1 k
eV-1
) (a) First10.
110
-210
-310
-4
ModelsThermalGaussian
(b) SecondData
XIS FIPINPIN (-1.3% NXB)PIN (+1.3% NXB)
χ5
0-5
χ
Energy (keV)
50
-5
5 10 20 30 50
Energy (keV)5 10 20 30 50
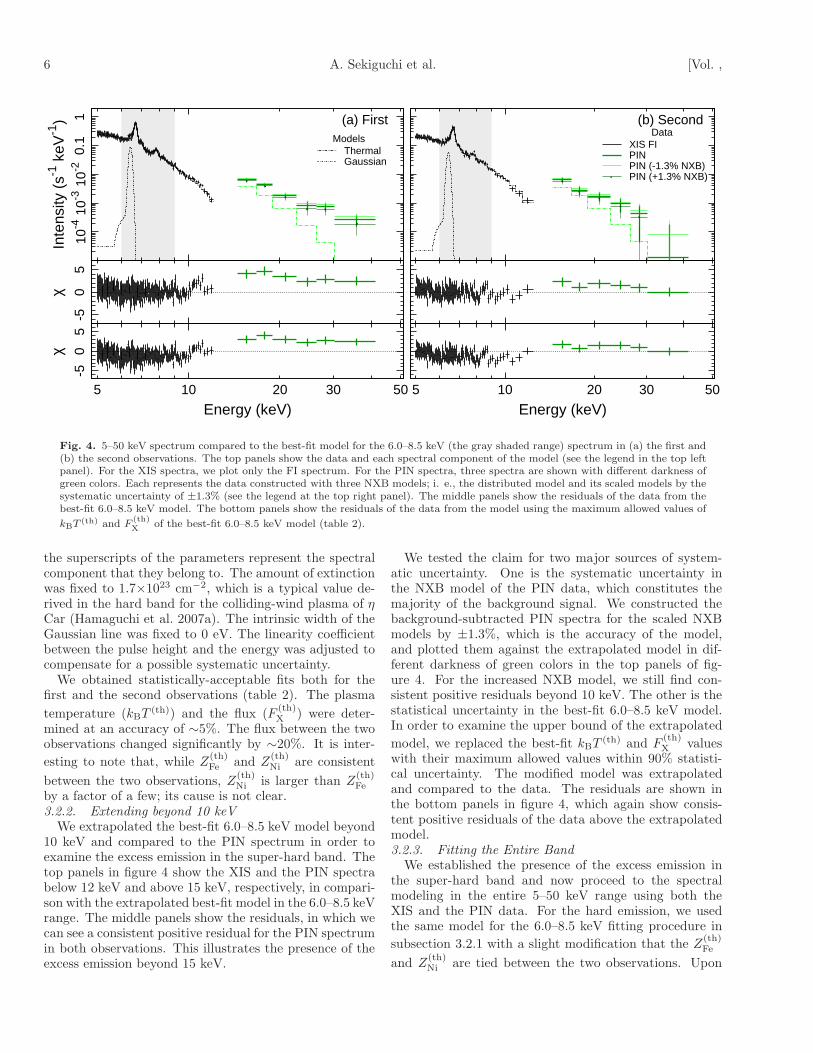
Fig. 4. 5–50 keV spectrum compared to the best-fit model for the 6.0–8.5 keV (the gray shaded range) spectrum in (a) the first and(b) the second observations. The top panels show the data and each spectral component of the model (see the legend in the top leftpanel). For the XIS spectra, we plot only the FI spectrum. For the PIN spectra, three spectra are shown with different darkness ofgreen colors. Each represents the data constructed with three NXB models; i. e., the distributed model and its scaled models by thesystematic uncertainty of ±1.3% (see the legend at the top right panel). The middle panels show the residuals of the data from thebest-fit 6.0–8.5 keV model. The bottom panels show the residuals of the data from the model using the maximum allowed values of
kBT(th) and F
(th)X of the best-fit 6.0–8.5 keV model (table 2).
the superscripts of the parameters represent the spectralcomponent that they belong to. The amount of extinctionwas fixed to 1.7×1023 cm−2, which is a typical value de-rived in the hard band for the colliding-wind plasma of ηCar (Hamaguchi et al. 2007a). The intrinsic width of theGaussian line was fixed to 0 eV. The linearity coefficientbetween the pulse height and the energy was adjusted tocompensate for a possible systematic uncertainty.We obtained statistically-acceptable fits both for the
first and the second observations (table 2). The plasma
temperature (kBT(th)) and the flux (F
(th)X ) were deter-
mined at an accuracy of ∼5%. The flux between the twoobservations changed significantly by ∼20%. It is inter-
esting to note that, while Z(th)Fe and Z
(th)Ni are consistent
between the two observations, Z(th)Ni is larger than Z
(th)Fe
by a factor of a few; its cause is not clear.3.2.2. Extending beyond 10 keV
We extrapolated the best-fit 6.0–8.5 keV model beyond10 keV and compared to the PIN spectrum in order toexamine the excess emission in the super-hard band. Thetop panels in figure 4 show the XIS and the PIN spectrabelow 12 keV and above 15 keV, respectively, in compari-son with the extrapolated best-fit model in the 6.0–8.5 keVrange. The middle panels show the residuals, in which wecan see a consistent positive residual for the PIN spectrumin both observations. This illustrates the presence of theexcess emission beyond 15 keV.
We tested the claim for two major sources of system-atic uncertainty. One is the systematic uncertainty inthe NXB model of the PIN data, which constitutes themajority of the background signal. We constructed thebackground-subtracted PIN spectra for the scaled NXBmodels by ±1.3%, which is the accuracy of the model,and plotted them against the extrapolated model in dif-ferent darkness of green colors in the top panels of fig-ure 4. For the increased NXB model, we still find con-sistent positive residuals beyond 10 keV. The other is thestatistical uncertainty in the best-fit 6.0–8.5 keV model.In order to examine the upper bound of the extrapolated
model, we replaced the best-fit kBT(th) and F
(th)X values
with their maximum allowed values within 90% statisti-cal uncertainty. The modified model was extrapolatedand compared to the data. The residuals are shown inthe bottom panels in figure 4, which again show consis-tent positive residuals of the data above the extrapolatedmodel.3.2.3. Fitting the Entire Band
We established the presence of the excess emission inthe super-hard band and now proceed to the spectralmodeling in the entire 5–50 keV range using both theXIS and the PIN data. For the hard emission, we usedthe same model for the 6.0–8.5 keV fitting procedure in
subsection 3.2.1 with a slight modification that the Z(th)Fe
and Z(th)Ni are tied between the two observations. Upon
No. ] Suzaku Observation of η Car 7
Inte
nsity
(s-1
keV
-1) (a) First1
0.1
10-2
10-3
10-4
ModelsTotalThermalPower-lawGaussian
(b) SecondData
XIS FIPIN
χ
Energy (keV)
50
-5
5 10 20 30 50
Energy (keV)5 10 20 30 50
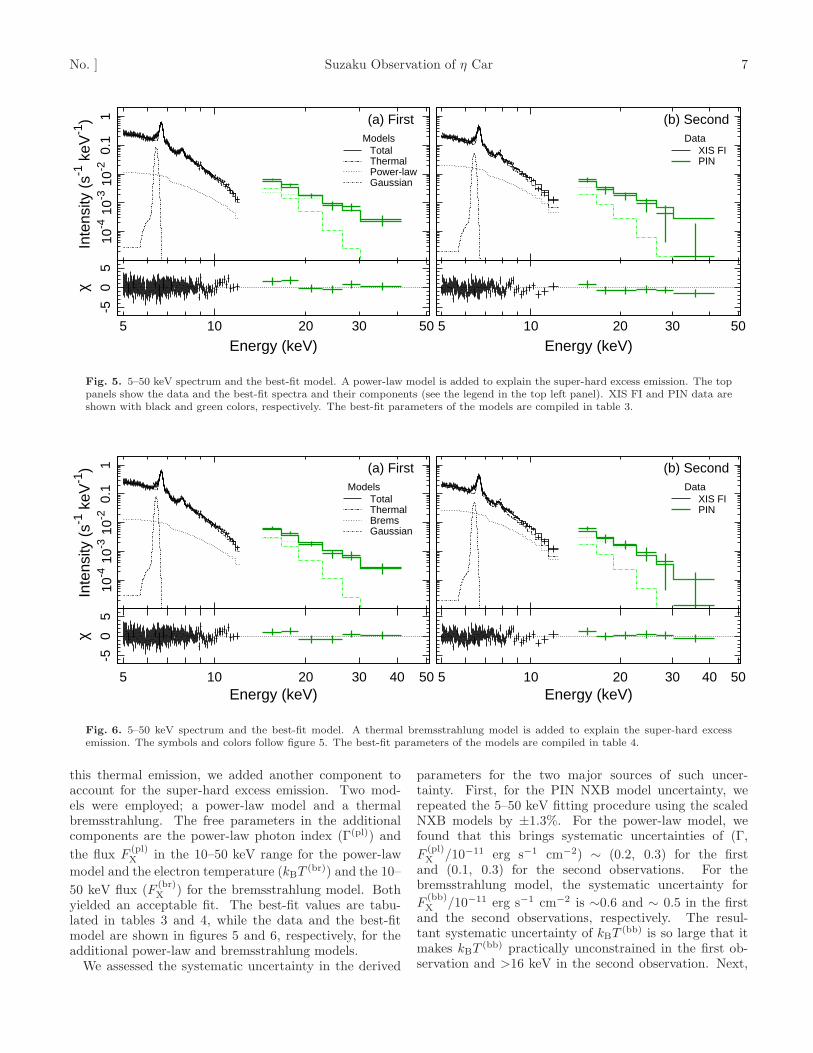
Fig. 5. 5–50 keV spectrum and the best-fit model. A power-law model is added to explain the super-hard excess emission. The toppanels show the data and the best-fit spectra and their components (see the legend in the top left panel). XIS FI and PIN data areshown with black and green colors, respectively. The best-fit parameters of the models are compiled in table 3.
Inte
nsity
(s-1
keV
-1) (a) First1
0.1
10-2
10-3
10-4
ModelsTotalThermalBremsGaussian
(b) SecondData
XIS FIPIN
5 10 20 30 40 50
χ
Energy (keV)
50
-5
5 10 20 30 40 50Energy (keV)
Fig. 6. 5–50 keV spectrum and the best-fit model. A thermal bremsstrahlung model is added to explain the super-hard excessemission. The symbols and colors follow figure 5. The best-fit parameters of the models are compiled in table 4.
this thermal emission, we added another component toaccount for the super-hard excess emission. Two mod-els were employed; a power-law model and a thermalbremsstrahlung. The free parameters in the additionalcomponents are the power-law photon index (Γ(pl)) and
the flux F(pl)X in the 10–50 keV range for the power-law
model and the electron temperature (kBT(br)) and the 10–
50 keV flux (F(br)X ) for the bremsstrahlung model. Both
yielded an acceptable fit. The best-fit values are tabu-lated in tables 3 and 4, while the data and the best-fitmodel are shown in figures 5 and 6, respectively, for theadditional power-law and bremsstrahlung models.We assessed the systematic uncertainty in the derived
parameters for the two major sources of such uncer-tainty. First, for the PIN NXB model uncertainty, werepeated the 5–50 keV fitting procedure using the scaledNXB models by ±1.3%. For the power-law model, wefound that this brings systematic uncertainties of (Γ,
F(pl)X /10−11 erg s−1 cm−2) ∼ (0.2, 0.3) for the first
and (0.1, 0.3) for the second observations. For thebremsstrahlung model, the systematic uncertainty for
F(bb)X /10−11 erg s−1 cm−2 is ∼0.6 and ∼ 0.5 in the first
and the second observations, respectively. The resul-tant systematic uncertainty of kBT
(bb) is so large that itmakes kBT
(bb) practically unconstrained in the first ob-servation and >16 keV in the second observation. Next,
8 A. Sekiguchi et al. [Vol. ,
Table 3. Best-fit model for the 5–50 keV spectra using apower-law model for the super-hard excess emission.
Parameters∗ First† Second†
Γ(pl) 1.30+0.07−0.14 1.51+0.04
−0.15
F(pl)X (10−11 erg s−1 cm−2) 1.4+0.2
−0.1 1.9+0.2−0.2
kBT(th) (keV) 3.61+0.03
−0.03 3.29+0.03−0.03
Z(th)Fe (solar) 0.47+0.01
−0.01
Z(th)Ni (solar) 1.5+0.2
−0.2
F(th)X (10−11 erg s−1 cm−2) 2.76+0.02
−0.01 2.07+0.02−0.02
E(gau) (keV) 6.43+0.01−0.01 6.44+0.01
−0.02
I(gau) (10−5 s−1 cm−2) 7.9+0.5−0.5 5.5+0.8
−0.7
E(edge) (keV) 7.12+0.04−0.04 7.14+0.17
−0.10
τ (edge) 0.16+0.02−0.02 0.14+0.04
−0.04
χ2/d.o.f. 717.0/590 286.1/226∗ The superscripts of the parameters represent the spectral com-ponent that they belong to: “(pl)” for the power-law, “(th)”for the thin-thermal plasma, “(gau)” for the Gaussian line, and
“(edge)” for the photoelectric absorption model. F(th)X is derived
in 5–10 keV, while F(pl)X
is in 10–50 keV.† The best-fit values for the first and the second observations. Theranges indicate the 90% statistical uncertainty.
for the statistical uncertainty in the best-fit 3–4 keVthermal model parameters, we replaced the best-fit set
of kBT(th) and F
(th)X values with those of their maxi-
mum and minimum allowed values within 90% statisti-cal uncertainty. This brings systematic uncertainties of
(Γ, F(pl)X /10−11 erg s−1 cm−2) ∼ (0.02, 0.2) and (0.01,
0.2) respectively for the first and the second observa-tions in the power-law model. For the bremsstrahlungmodel, the kBT
(bb) keV is unconstrained with minimaof >22 keV and >10 keV for the first and the secondobservations. The resultant systematic uncertainty for
F(bb)X /10−11 erg s−1 cm−2 is 0.3 and 0.2, respectively.
4. Discussion
4.1. Comparison with the Previous Results
We compare the results for the super-hard excess emis-sion among the two Suzaku observations and the twoprevious studies. We use the spectral parameters forthe power-law model, which are available both for theBeppoSAX and the INTEGRAL results (table 5). Theflux values of BeppoSAX (Viotti et al. 2004) and Suzaku(table 3) were reevaluated in the 22–100 keV range to fa-cilitate comparison with the INTEGRAL result (Leyderet al. 2008).We see no significant change between the two Suzaku
results both for the flux and the power-law index if weconsider both the statistical and systematic uncertainties.Therefore, we fitted the two 5–50 keV spectra simulta-neously to obtain a much constrained fit. In the fitting,the best-fit parameters of the thin-thermal plasma compo-nents were fixed to the best-fit values for the independentfits. The parameters of the statistically-acceptable bestfit are appended in table 5.The Suzaku results were obtained at different epochs
Table 4. Best-fit model for the 5–50 keV spectra using athermal bremsstrahlung model for the super-hard excess emis-sion.
Parameters∗ First† Second†
kBT(br) (keV) > 61 18+20
−8
F(br)X (10−11 erg s−1 cm−2) 1.7+0.5
−0.4 1.2+0.9−0.8
kBT(th) (keV) 3.58+0.07
−0.11 3.14+0.28−0.14
Z(th)Fe (solar) 0.47+0.01
−0.01
Z(th)Ni (solar) 1.5+0.2
−0.2
F(th)X (10−11 erg s−1 cm−2) 2.74+0.10
−0.12 1.95+0.11−0.18
E(gau) (keV) 6.43+0.01−0.01 6.43+0.01
−0.02
I(gau) (10−5 s−1 cm−2) 7.8+0.3−0.5 5.3+0.8
−0.8
E(edge) (keV) 7.12+0.06−0.04 7.1+0.2
−0.1
τ (edge) 0.16+0.04−0.03 0.14+0.08
−0.06
χ2/d.o.f. 714.1/590 276.2/226∗ The superscripts of the parameters represent the spectral com-ponent that they belong to: “(br)” for the bremsstrahlung, “(th)”for the thin-thermal plasma, “(gau)” for the Gaussian line, and
“(edge)” for the photoelectric absorption model. F(th)X is derived
in 5–10 keV, while F(br)X
is in 10–50 keV.† The best-fit values for the first and the second observations. Theranges indicate the 90% statistical uncertainty or the lower limit.kBT
(br) is unconstrained in the first observation.
Table 5. Comparison with previous results.
Observatory Γ∗† F ∗†X /10−11 Orbital
(erg s−1 cm−2) phase‡
BeppoSAX 2.42+0.04−0.04 3.24 0.46
INTEGRAL 1.0+0.4−0.4 1.11±0.15 0.98–1.36
Suzaku (1st) 1.30+0.07−0.14 2.7+0.2
−0.3 1.39Suzaku (2nd) 1.51+0.04
−0.15 1.9+0.3−0.1 1.47
Suzaku (both) 1.38+0.14−0.13 2.3+0.7
−0.6 1.39, 1.47∗ The best-fit photon index (Γ) and the flux (FX) in the 22–100 keV range of the power-law model.† The ranges indicate the 90% statistical uncertainty. The uncer-tainty for the INTEGRAL value was derived from Leyder et al.(2008).‡ The orbital phase 1.0 indicates the onset of the Cycle 11 mini-mum at the Julian date 2452819.8 d (Damineli et al. 2008).
No. ] Suzaku Observation of η Car 9
Pho
ton
inte
nsity
(s-1
cm
-2 k
eV-1
)
Energy (keV)
10-4
10-5
10-6
20 30 40 50 80 100
Thermal Power-law
Total Suzaku PIN (first)Suzaku PIN (second)INTEGRAL ISGRI
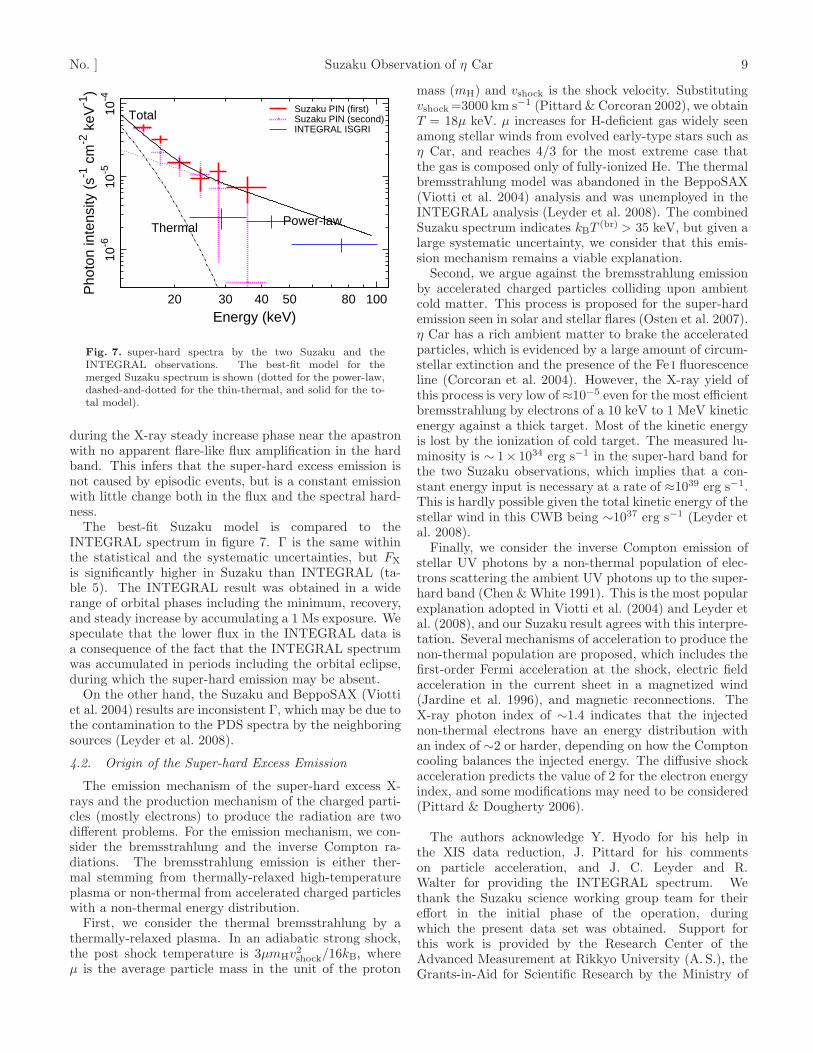
Fig. 7. super-hard spectra by the two Suzaku and theINTEGRAL observations. The best-fit model for themerged Suzaku spectrum is shown (dotted for the power-law,dashed-and-dotted for the thin-thermal, and solid for the to-tal model).
during the X-ray steady increase phase near the apastronwith no apparent flare-like flux amplification in the hardband. This infers that the super-hard excess emission isnot caused by episodic events, but is a constant emissionwith little change both in the flux and the spectral hard-ness.The best-fit Suzaku model is compared to the
INTEGRAL spectrum in figure 7. Γ is the same withinthe statistical and the systematic uncertainties, but FX
is significantly higher in Suzaku than INTEGRAL (ta-ble 5). The INTEGRAL result was obtained in a widerange of orbital phases including the minimum, recovery,and steady increase by accumulating a 1 Ms exposure. Wespeculate that the lower flux in the INTEGRAL data isa consequence of the fact that the INTEGRAL spectrumwas accumulated in periods including the orbital eclipse,during which the super-hard emission may be absent.On the other hand, the Suzaku and BeppoSAX (Viotti
et al. 2004) results are inconsistent Γ, which may be due tothe contamination to the PDS spectra by the neighboringsources (Leyder et al. 2008).
4.2. Origin of the Super-hard Excess Emission
The emission mechanism of the super-hard excess X-rays and the production mechanism of the charged parti-cles (mostly electrons) to produce the radiation are twodifferent problems. For the emission mechanism, we con-sider the bremsstrahlung and the inverse Compton ra-diations. The bremsstrahlung emission is either ther-mal stemming from thermally-relaxed high-temperatureplasma or non-thermal from accelerated charged particleswith a non-thermal energy distribution.First, we consider the thermal bremsstrahlung by a
thermally-relaxed plasma. In an adiabatic strong shock,the post shock temperature is 3µmHv
2shock/16kB, where
µ is the average particle mass in the unit of the proton
mass (mH) and vshock is the shock velocity. Substitutingvshock=3000 km s−1 (Pittard & Corcoran 2002), we obtainT = 18µ keV. µ increases for H-deficient gas widely seenamong stellar winds from evolved early-type stars such asη Car, and reaches 4/3 for the most extreme case thatthe gas is composed only of fully-ionized He. The thermalbremsstrahlung model was abandoned in the BeppoSAX(Viotti et al. 2004) analysis and was unemployed in theINTEGRAL analysis (Leyder et al. 2008). The combinedSuzaku spectrum indicates kBT
(br) > 35 keV, but given alarge systematic uncertainty, we consider that this emis-sion mechanism remains a viable explanation.Second, we argue against the bremsstrahlung emission
by accelerated charged particles colliding upon ambientcold matter. This process is proposed for the super-hardemission seen in solar and stellar flares (Osten et al. 2007).η Car has a rich ambient matter to brake the acceleratedparticles, which is evidenced by a large amount of circum-stellar extinction and the presence of the Fe I fluorescenceline (Corcoran et al. 2004). However, the X-ray yield ofthis process is very low of ≈10−5 even for the most efficientbremsstrahlung by electrons of a 10 keV to 1 MeV kineticenergy against a thick target. Most of the kinetic energyis lost by the ionization of cold target. The measured lu-minosity is ∼ 1× 1034 erg s−1 in the super-hard band forthe two Suzaku observations, which implies that a con-stant energy input is necessary at a rate of ≈1039 erg s−1.This is hardly possible given the total kinetic energy of thestellar wind in this CWB being ∼1037 erg s−1 (Leyder etal. 2008).Finally, we consider the inverse Compton emission of
stellar UV photons by a non-thermal population of elec-trons scattering the ambient UV photons up to the super-hard band (Chen &White 1991). This is the most popularexplanation adopted in Viotti et al. (2004) and Leyder etal. (2008), and our Suzaku result agrees with this interpre-tation. Several mechanisms of acceleration to produce thenon-thermal population are proposed, which includes thefirst-order Fermi acceleration at the shock, electric fieldacceleration in the current sheet in a magnetized wind(Jardine et al. 1996), and magnetic reconnections. TheX-ray photon index of ∼1.4 indicates that the injectednon-thermal electrons have an energy distribution withan index of ∼2 or harder, depending on how the Comptoncooling balances the injected energy. The diffusive shockacceleration predicts the value of 2 for the electron energyindex, and some modifications may need to be considered(Pittard & Dougherty 2006).
The authors acknowledge Y. Hyodo for his help inthe XIS data reduction, J. Pittard for his commentson particle acceleration, and J. C. Leyder and R.Walter for providing the INTEGRAL spectrum. Wethank the Suzaku science working group team for theireffort in the initial phase of the operation, duringwhich the present data set was obtained. Support forthis work is provided by the Research Center of theAdvanced Measurement at Rikkyo University (A. S.), theGrants-in-Aid for Scientific Research by the Ministry of
10 A. Sekiguchi et al. [Vol. ,
Education, Culture, Sports, Science and Technology ofJapan (grant numbers 19654032 and 19340047 for S.K.and 20540237 for Y.T.), a Chuo University Grant forSpecial Research (Y.T.), and the National Aeronauticsand Space Administration through Chandra PostdoctoralFellowship Award Number PF6-70044 (M.T.) issued bythe Chandra X-ray Observatory Center, which is operatedby the Smithsonian Astrophysical Observatory for and onbehalf of the National Aeronautics Space Administrationunder contract NAS8-03060.
References
Aharonian, F., et al. 2007, A&A, 467, 1075Albacete Colombo, J. F., Mendez, M., & Morrell, N. I. 2003,
MNRAS, 346, 704Boldt, E. 1987, Observational Cosmology, 124, 611Chen, W., & White, R. L. 1991, ApJ, 366, 512Corcoran, M. F., et al. 1998, ApJ, 494, 381Corcoran, M. F., et al. 2004, ApJ, 613, 381Damineli, A., et al. 2008, MNRAS, 384, 1649Davidson, K., & Humphreys, R. M. 1997, ARA&A, 35, 1Evans, N. R., Seward, F. D., Krauss, M. I., Isobe, T., Nichols,
J., Schlegel, E. M., & Wolk, S. J. 2003, ApJ, 589, 509Evans, N. R., Schlegel, E. M., Waldron, W. L., Seward, F. D.,
Krauss, M. I., Nichols, J., & Wolk, S. J. 2004, ApJ, 612,1065
Fernandez-Lajus, E., et al. 2009, A&A, 493, 1093Hamaguchi, K., et al. 2007a, ApJ, 663, 522Hamaguchi, K., et al. 2007b, PASJ, 59, 151Ishibashi, K., Corcoran, M. F., Davidson, K., Swank, J. H.,
Petre, R., Drake, S. A., Damineli, A., & White, S. 1999,ApJ, 524, 983
Ishisaki, Y., et al. 2007, PASJ, 59, S113Jardine, M., Allen, H. R., & Pollock, A. M. T. 1996, A&A,
314, 594Kaastra, J. S. 1992, An X-Ray Spectral Code for Optically
Thin Plasmas (Internal SRON-Leiden Report, updatedversion 2.0)
Kokubun, M., et al. 2007, PASJ, 59, 53Koyama, K., et al. 2007, PASJ, 59, 23Leyder, J.-C., Walter, R., & Rauw, G. 2008, A&A, 477, L29Liedahl, D. A., Osterheld, A. L., & Goldstein, W. H. 1995,
ApJ, 438, L115Luo, D., McCray, R., & Mac Low, M.-M. 1990, ApJ, 362, 267Mewe, R., Gronenschild, E. H. B. M., & van den Oord, G. H.
J. 1985, A&AS, 62, 197Mewe, R., Lemen, J. R., & van den Oord, G. H. J. 1986, A&AS,
65, 511Mitsuda, K., et al. 2007, PASJ, 59, 1Morrison, R., & McCammon, D. 1983, ApJ, 270, 119Nielsen, K. E., Corcoran, M. F., Gull, T. R., Hillier, D. J.,
Hamaguchi, K., Ivarsson, S., & Lindler, D. J. 2007, ApJ,660, 669
Osten, R. A., Drake, S., Tueller, J., Cummings, J., Perri, M.,Moretti, A., & Covino, S. 2007, ApJ, 654, 1052
Pittard, J. M., & Corcoran, M. F. 2002, A&A, 383, 636Pittard, J. M., & Dougherty, S. M. 2006, MNRAS, 372, 801Serlemitsos, P. J., et al. 2007, PASJ, 59, 9Stevens, I. R., Blondin, J. M., & Pollock, A. M. T. 1992, ApJ,
386, 265
Stevens, I. R., Corcoran, M. F., Willis, A. J., Skinner, S. L.,Pollock, A. M. T., Nagase, F., & Koyama, K. 1996,MNRAS, 283, 589
Takahashi, T., et al. 2007, PASJ, 59, 35Takahashi, T., et al. 2008, Proc. SPIE, 7011, 18Tsuboi, Y., Koyama, K., Sakano, M., & Petre, R. 1997, PASJ,
49, 85Usov, V. V. 1992, ApJ, 389, 635Viotti, R. F., et al. 2002, A&A, 385, 874Viotti, R. F., Antonelli, L. A., Rossi, C., & Rebecchi, S. 2004,
A&A, 420, 527White, R. L., & Becker, R. H. 1995, ApJ, 451, 352Zhekov, S. A., & Skinner, S. L. 2000, ApJ, 538, 808