Studies of Cellulosic Ethanol Production from Lignocellulose · hydrolysis by using 1% sulfuric...
82
Studies of Cellulosic Ethanol Production from Lignocellulose Geoffrey W. Moxley Thesis submitted to the faculty of the Virginia Polytechnic Institute and State University in partial fulfillment of the requirements for the degree of Master of Science In Biological Systems Engineering Y.-H. Percival Zhang John S. Cundiff Maren Roman June 8, 2007 Blacksburg, Virginia Keywords: Lignocellulose, Cellulosic Ethanol, Quantitative Saccharification, Pretreatment, Lignocellulose Fractionation, Renewable Energy
Transcript of Studies of Cellulosic Ethanol Production from Lignocellulose · hydrolysis by using 1% sulfuric...
Studies of Cellulosic Ethanol Production from Lignocellulose
Geoffrey W. Moxley
Thesis submitted to the faculty of the Virginia Polytechnic Institute and State University in partial fulfillment of the requirements for the degree of
Master of Science
In Biological Systems Engineering
Y.-H. Percival Zhang John S. Cundiff Maren Roman
June 8, 2007 Blacksburg, Virginia
Keywords: Lignocellulose, Cellulosic Ethanol, Quantitative Saccharification, Pretreatment, Lignocellulose Fractionation, Renewable Energy
Studies of Cellulosic Ethanol Production from Lignocellulose
Geoffrey W. Moxley
ABSTRACT
At present, the world’s transportation sector is being principally supplied by fossil fuels.
However, energy consumption in this sector is drastically increasing and there are
concerns with supply, cost, and environmental issues with the continuing use of fossil
fuels. Utilizing non-petroleum ethanol in the transportation sector reduces the
dependence on oil, and allows for cleaner burning of gasoline.
Lignocellulose materials are structurally composed of five types of polymeric sugars,
glucan, galactan, mannan, arabinan, and xylan. NREL has developed a quantitative
saccharification (QS) method for determining carbohydrate composition. We proposed a
new protocol based on the NREL 2006 Laboratory Analytical Procedure “Determination
of Structural Carbohydrates and Lignin in Biomass” (Sluiter et al. 2006a) with a slight
modification, in which xylose concentration was determined after the secondary
hydrolysis by using 1% sulfuric acid rather than 4% sulfuric acid. We found that the
current NREL protocol led to a statistically significant overestimation of acid-labile xylan
content ranging from 4 to 8 percent.
Lignocellulosic biomass is naturally recalcitrant to enzymatic hydrolysis, and must be
pretreated before it can be effectively used for bioethanol production. One such
pretreatment is a fractionation process that separates lignin and hemicellulose from the
iii
cellulose and converts crystalline cellulose microfibrils to amorphous cellulose. Here we
evaluated the feasibility of lignocellulose fractionation applicable to the hurds of
industrial hemp. Hurds are the remaining material of the stalk after all leaves, seeds, and
fiber have been stripped from the plant. After optimizing acid concentration, reaction
time and temperature, the pretreated cellulosic samples were hydrolyzed to more than
96% after 24 hours of hydrolysis (enzyme loading conditions of 15 FPU/g glucan
Spezyme CP and 60 IU/g glucan Novozyme 188) at the optimal pretreatment condition
(> 84% H3PO4, > 50 °C and > 1 hour). The overall glucose and xylose yields were 89%
(94% pretreatment; 96% digestibility) and 61%, respectively. All data suggest the
technical feasibility of building a biorefinery based on the hurds of industrial hemp as a
feedstock and a new lignocellulose fractionation technology for producing cellulosic
ethanol. The choice of feedstock and processing technology gives high sugar yields, low
processing costs, low cost feedstock, and low capital investment.
iv
ACKNOWLEDGEMENTS
The author expresses his gratitude to his advisor, Dr. Y.-H. Percival Zhang, for his
encouragement and support in pursuing his graduate program, and his guidance in his
thesis research. He also thanks Dr. John S. Cundiff, and Dr. Maren Roman for serving on
his graduate committee.
He is very grateful to James McMillan at the National Renewable Energy Laboratory,
and Susan Alt from the Equator Group for providing lignocellulose samples for testing.
Additional thanks are extended to Amy Egan in Biological Systems Engineering
Department, and Bob Wright in the Department of Wood Science and Forestry Products
for their help in using laboratory equipment, and sample preparation. Dr. John
McDowell from the Department of Plant Pathology, Physiology, and Weed Science was
very helpful in imaging samples with the green fluorescent microscope, and Kathy Lowe,
from the Maryland-Virginia College of Veterinary Medicine at Virginia Tech, with the
Scanning Electron Microscope imaging.
Lastly, the author would like to express his deepest gratitude toward his parents, Richard
and Maxine Moxley for their unwavering personal support.
v
TABLE OF CONTENTS
Page
ABSTRACT………………………………………………………………………….ii
ACKNOWLEDGEMENTS…………………………………………………………iv
TABLE OF CONTENTS……………………………………………………………v
LIST OF FIGURES………………………………………………………………. ...vii
LIST OF TABLES……………………………………………………………….......ix
1. INTRODUCTION AND REVIEW OF LITERATURE……………….......1
1.1 Lignocellulosic Structure…………………………………………….3
1.2 Lignocellulose Pretreatment Technology…………………………...8
1.3 Research Goals……………………………………………………….14
2. MORE ACCURATE DETERMINATION OF ACID-LABILE
SUGARS IN LIGNOCELLULOSE BY QUANTITATIVE
SACCHARIFICATION……………………………………………………..15
Abstract……………………………………………………………………….15
2.1 Introduction…………………………………………………………..16
2.2 Methods and Materials………………………………………………21
2.3 Results………………………………………………………………...27
2.3.1 Monomeric sugar degradation at low acid concentration…...27
2.3.2. Monomeric sugar degradation at high acid concentration….28
2.3.3. Oligosaccharide hydrolysis at low acid concentration……….31
2.3.4. Overall degradation of monomeric sugars…………………....32
2.4 Conclusions……………………………………………………………38
3. EVALUATION OF LIGNOCELLULOSE FRACTIONATION
APPLICABLE TO INDUSTRIAL HEMP HURDS………………………..39
Abstract………………………………………………………………………..39
vi
3.1 Introduction……………………………………………………………39
3.2 Methods and Materials………………………………………………..41
3.3 Results………………………………………………………………….44
3.3.1. Composition Changes Before and After Fractionation………45
3.3.2. Enzymatic Cellulose Digestibility……………………………...45
3.3.3. Images of lignocellulosic structure after fractionation……….49
3.3.4. Mass Balance for the Optimal Conditions…………………….53
3.4 CONCLUSIONS………………………………………………………56
REFERENCES………………………………………………………………………...57
APPENDIX…………………………………………………………………………….69
vii
LIST OF FIGURES
Page
Figure 1-1 Schematic structure of plant cell walls; the lignocellulose
components and structure……………………………………………
4
Figure 1-2 Structural view of lignin biopolymer……………………………….. 7
Figure 2-1 Comparison of three quantitative saccharification methods for
determination of carbohydrates in lignocellulose and the proposed
modified methods good for more accurate determination of acid-
labile carbohydrate contents………………………………………… 20
Figure 2-2 Monomer sugar degradation constants in the presence of various
sulfuric acid concentrations at 121°C ………………………………. 28
Figure 2-3 Monomer sugar degradation rate at various reaction temperatures in
the presence of 72% sulfuric acid…………………………………... 29
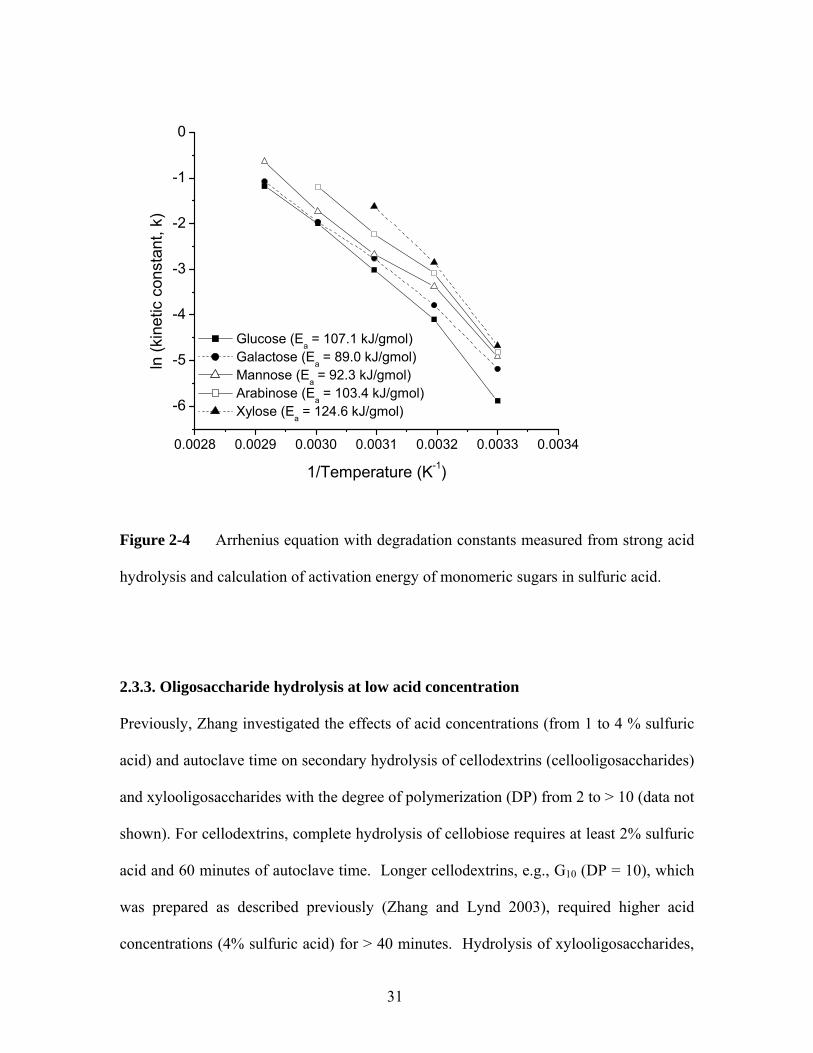
Figure 2-4 Linearization of Arrhenius equation with degradation constants
measured from strong acid hydrolysis and calculation of activation
energy of monomeric sugars in sulfuric acid……………………….. 31
Figure 2-5 Comparison of monomeric sugar degradation between hydrolysis
conditions in Condition 1, Condition 2, and Condition 3…………... 33
Figure 3-1 Effect of phosphoric acid concentration on cellulose digestibility of
the pretreated lignocellulose. Experimental condition: 50oC and 1
hour…………………………………………………………………. 47
Figure 3-2 Effect of the pretreatment reaction time on cellulose digestibility of
the pretreated lignocellulose. Experimental conditions: 85.9%
phosphoric acid and 50oC…………………………………………… 48
Figure 3-3 Effect of reaction temperature on cellulose digestibility for the
pretreated lignocellulose. Experimental conditions: 85.9%
phosphoric acid and reaction time = 1 hour………………………… 49
Figure 3-4 Scanning electron microscope images of lignocellulose samples
before and after lignocellulose fractionation pretreatment, with
modest and complete fractionation pretreatments………………….. 51
viii
Figure 3-5 SEM images comparing untreated, raw lignocellulose sample (left)
to completely fractionated lignocellulose material (right)………….. 52
Figure 3-6 Fluorescence microscopy imaging of untreated lignocellulose (left),
untreated lignocellulose mixed with 1 g/L GFP (center), and
lignocellulose treated at 84.0% H3PO4 at 50 °C for 1 hour and
mixed 20 g/L of BSA, then mixed with 1 g/L of GFP (right).
Magnification is 360x………………………………………………. 53
Figure 3-7 Mass balance of industrial hemp hurds after lignocellulose
fractionation pretreatment and enzymatic hydrolysis. Hydrolysis
conditions were 15 filter paper units (FPU) cellulase and 60
international units (IU) of β-glucosidase per gram of glucan at 50oC
in 50 mM citric acid buffer (pH 4.8)………………………………... 55
ix
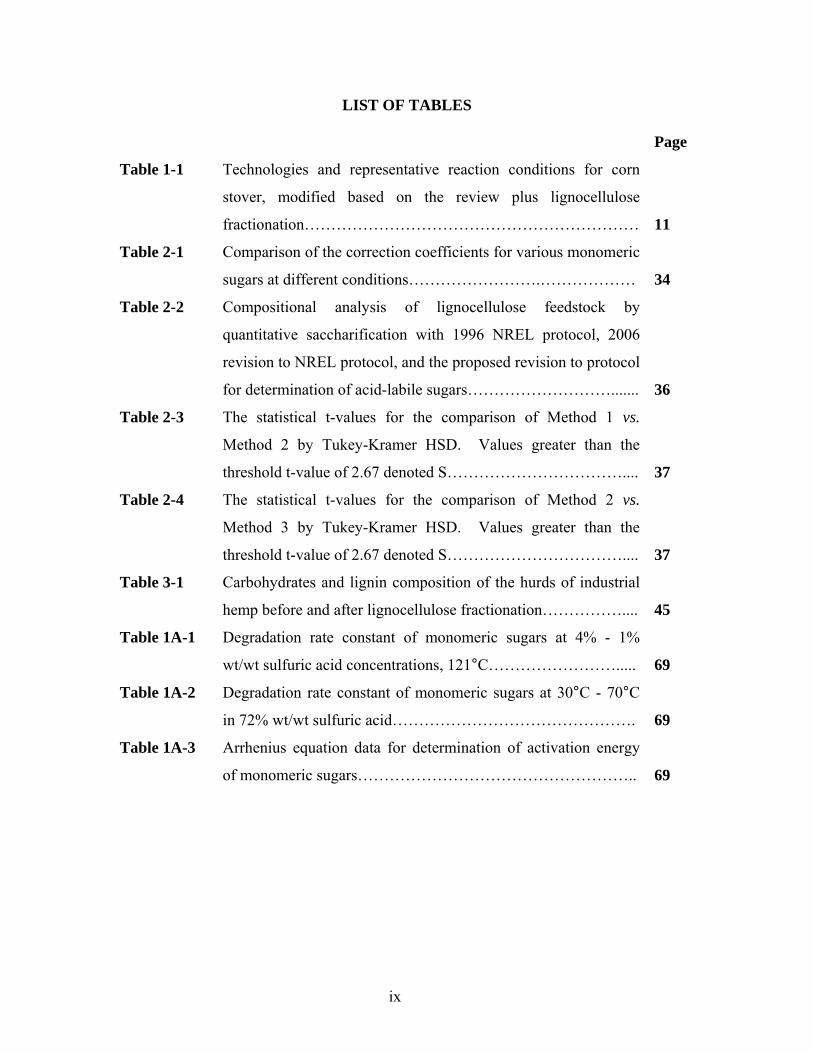
LIST OF TABLES
Page
Table 1-1 Technologies and representative reaction conditions for corn
stover, modified based on the review plus lignocellulose
fractionation………………………………………………………
11
Table 2-1 Comparison of the correction coefficients for various monomeric
sugars at different conditions…………………….………………
34
Table 2-2 Compositional analysis of lignocellulose feedstock by
quantitative saccharification with 1996 NREL protocol, 2006
revision to NREL protocol, and the proposed revision to protocol
for determination of acid-labile sugars……………………….......
36
Table 2-3 The statistical t-values for the comparison of Method 1 vs.
Method 2 by Tukey-Kramer HSD. Values greater than the
threshold t-value of 2.67 denoted S……………………………....
37
Table 2-4 The statistical t-values for the comparison of Method 2 vs.
Method 3 by Tukey-Kramer HSD. Values greater than the
threshold t-value of 2.67 denoted S……………………………....
37
Table 3-1 Carbohydrates and lignin composition of the hurds of industrial
hemp before and after lignocellulose fractionation……………....
45
Table 1A-1 Degradation rate constant of monomeric sugars at 4% - 1%
wt/wt sulfuric acid concentrations, 121°C…………………….....
69
Table 1A-2 Degradation rate constant of monomeric sugars at 30°C - 70°C
in 72% wt/wt sulfuric acid……………………………………….
69
Table 1A-3 Arrhenius equation data for determination of activation energy
of monomeric sugars……………………………………………..
69
x
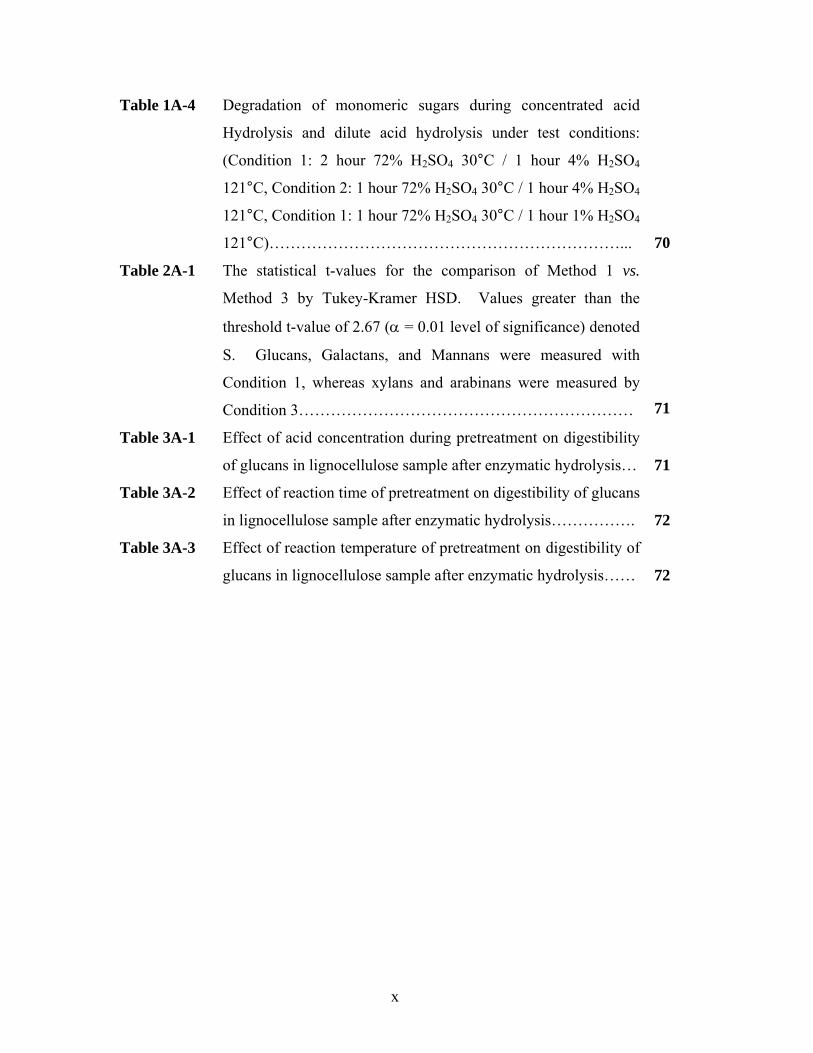
Table 1A-4 Degradation of monomeric sugars during concentrated acid
Hydrolysis and dilute acid hydrolysis under test conditions:
(Condition 1: 2 hour 72% H2SO4 30°C / 1 hour 4% H2SO4
121°C, Condition 2: 1 hour 72% H2SO4 30°C / 1 hour 4% H2SO4
121°C, Condition 1: 1 hour 72% H2SO4 30°C / 1 hour 1% H2SO4
121°C)…………………………………………………………...
70
Table 2A-1 The statistical t-values for the comparison of Method 1 vs.
Method 3 by Tukey-Kramer HSD. Values greater than the
threshold t-value of 2.67 (α = 0.01 level of significance) denoted
S. Glucans, Galactans, and Mannans were measured with
Condition 1, whereas xylans and arabinans were measured by
Condition 3………………………………………………………
71
Table 3A-1 Effect of acid concentration during pretreatment on digestibility
of glucans in lignocellulose sample after enzymatic hydrolysis…
71
Table 3A-2 Effect of reaction time of pretreatment on digestibility of glucans
in lignocellulose sample after enzymatic hydrolysis…………….
72
Table 3A-3 Effect of reaction temperature of pretreatment on digestibility of
glucans in lignocellulose sample after enzymatic hydrolysis……
72
1
1. INTRODUCTION AND REVIEW OF LITERATURE
Global energy consumption has been steadily increasing with the growing population and
rising living standards over the course of the twentieth century. As developed and
developing countries require more energy in the next few decades, the demand of energy
will increase. Already, there have been several energy crises in many parts of the world,
as is evident with increasing energy prices and the “energy crises” of the United States in
the late 1970s. The use of convenient fossil fuels results in several problems, such as
carbon dioxide emissions, which are believed to strongly influence climate change.
Alternative energy sources must be sought to fulfill the growing energy demands of the
global society, to reduce the dependence of countries like the United States on foreign
petroleum, and to ensure economic stability and decrease trade deficits.
In the U.S., the transportation sector accounts for ~28% of the total energy consumption,
and ~70% of crude oil is used for transportation. Currently the principle source for
transportation energy is the combustion of liquid fossil fuels through internal combustion
engines. One of the most promising alternative renewable liquid transportation fuels is
ethanol produced from biomass.
Ethanol, a liquid fuel carrier, has a number of advantages over petroleum-based gasoline,
and is already beginning to be integrated into the transportation sector. Ethanol has a
high heat of vaporization, low flame temperature, high gas volume change, and high
octane rating, all of which make it a favorable fuel. Although ethanol only has
2
approximately 70% the energy content of gasoline on a per volume basis, ethanol has a
12 to 14 octane number advantage over gasoline. In theory, ethanol’s higher octane
rating could allow for an increase in compression ratio in an internal combustion engine
from 9 in most modern automobiles, to 12 or 13, resulting in a 6% to 10% increase in
theoretical thermal efficiency in Otto-cycle gasoline engines (Hardenberg and Schaefer
1981; Lynd 1996). In 2006, nearly 5 billion gallons of bioethanol was produced annually
and blended into gasoline as a fuel additive to reduce nitric oxide emissions and replace
MTBE use (Renewable Fuels Association 2007). Bioethanol is an attractive alternative
to petroleum because the net release of carbon dioxide is nearly zero based on a life cycle
analysis, thus resulting in significantly lower greenhouse gas emissions. Additionally,
ethanol can be produced from domestic sources of readily available agricultural and
forestry biomass, thus reducing foreign dependence on petroleum.
Currently, almost all fuel ethanol blended into gasoline for sale in the United States is
derived from starch-based feedstock -- corn kernels. The price of corn grain has risen by
> 70% during the past 2 years, and these increases are squeezing the profit margin of corn
biorefineries. The profitability of biorefineries has to rely on federal subsides.
Additionally, since corn is valuable food and feed in the United States, the high prices of
corn kernels have raised a great deal of concerns about food supplies worldwide. For
example, the Chinese Central Government banned the construction of new corn-ethanol
plants and suspended corn ethanol production due to high corn prices in 2007.
3
The largest renewable sugar source for ethanol production is the carbohydrates locked in
lignocellulosic biomass. The DOE and USDA estimate that there is 1.3 billion tons of
available renewable cellulosic biomass per year without change to our food supply (DOE
and USDA 2005). Lignocellulosic feedstocks include forestry and agricultural residues,
municipal solid waste, and woody and grassy crops.
The sugars (cellulose and hemicellulose) in lignocellulose plant cell walls cannot easily
be fermented into ethanol because they are plant cell wall structural building blocks,
whereas starch is naturally used as an energy reserve, and therefore easily hydrolyzed.
Effective conversion of recalcitrant lignocellulose to cellulosic ethanol requires five
sequential steps: (1) lignocellulose size reduction, (2) pretreatment/fractionation, (3)
enzymatic hydrolysis, (4) ethanol fermentation, and (5) ethanol recovery. However, due
to high processing costs, great capital investment in the conversion plant and a narrow
margin between product value and feedstock cost (Zhang et al. 2006b), cellulosic ethanol
produced from lignocellulose biomass is not produced commercially,.
1.1 LIGNOCELLULOSE STRUCTURE
The composition of polymeric carbohydrates in a feedstock varies with the species of
plant materials. In general, 30-50% of the dry weight of the material is cellulose, 20-35%
hemicellulose, and 10-20% lignin. Additionally, there is also a small amount of
compounds such as, minerals, pectin, acetic acid, and proteins.
4
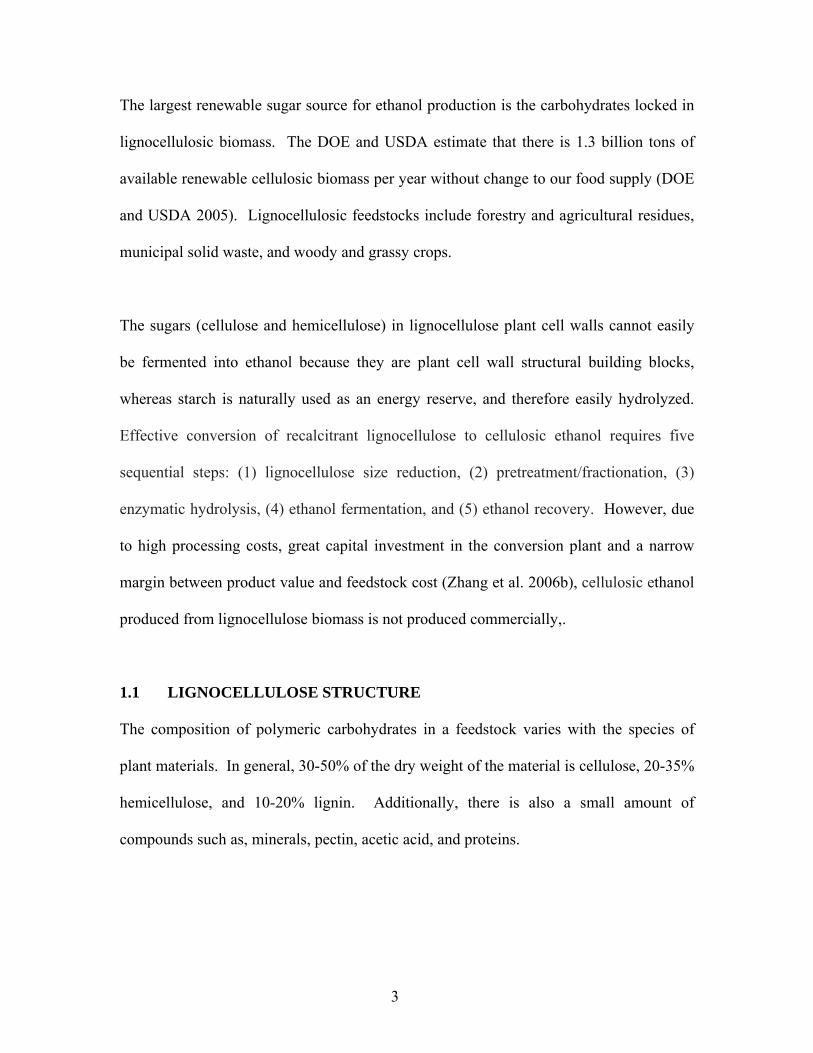
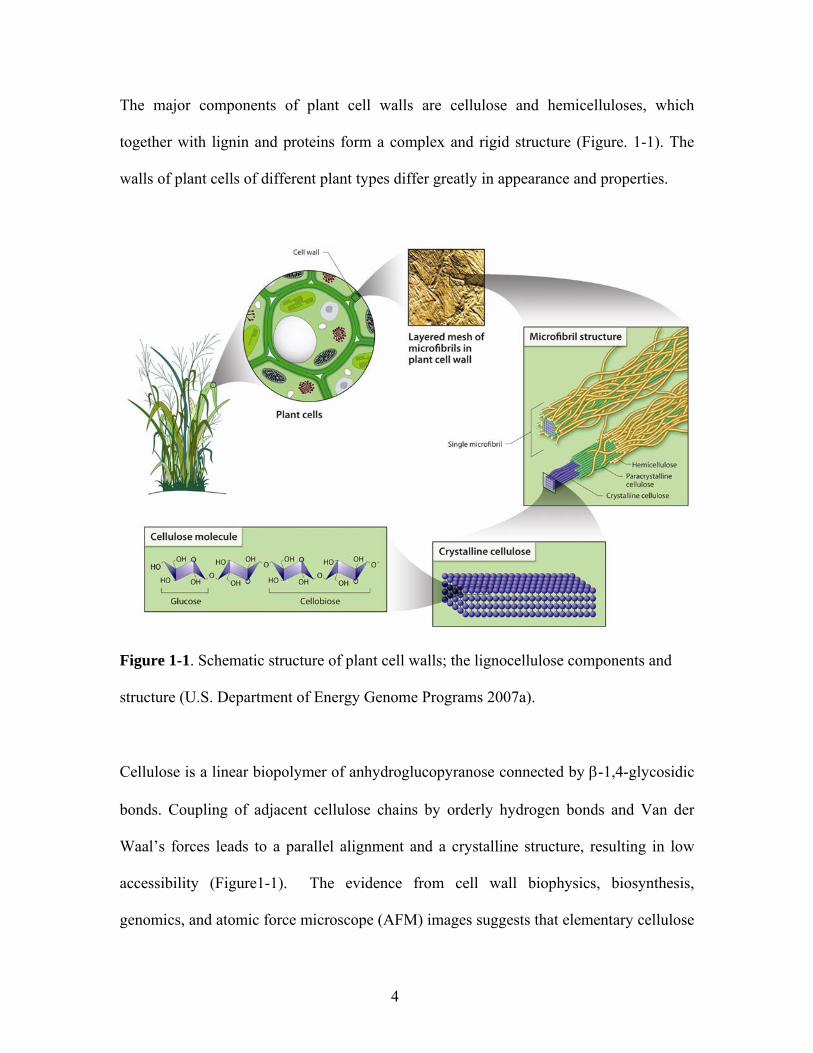
The major components of plant cell walls are cellulose and hemicelluloses, which
together with lignin and proteins form a complex and rigid structure (Figure. 1-1). The
walls of plant cells of different plant types differ greatly in appearance and properties.
Figure 1-1. Schematic structure of plant cell walls; the lignocellulose components and
structure (U.S. Department of Energy Genome Programs 2007a).
Cellulose is a linear biopolymer of anhydroglucopyranose connected by β-1,4-glycosidic
bonds. Coupling of adjacent cellulose chains by orderly hydrogen bonds and Van der
Waal’s forces leads to a parallel alignment and a crystalline structure, resulting in low
accessibility (Figure1-1). The evidence from cell wall biophysics, biosynthesis,
genomics, and atomic force microscope (AFM) images suggests that elementary cellulose
5
fibrils are synthesized by the cellulose synthase complex (CelS) locus that contains 36-
glucan chains and they have both crystalline and subcrystalline structures (Ding and
Himmel 2006). A number of elementary fibrils coalesce into much larger microfibrils;
these microbrils can then form macrofibrils. Hemicelluloses are situated between the
lignin and the collection of cellulose microfibrils underneath. Consistent with their
structural chemistry and side-group substitutions, the xylan seems not only to be
interweaved and ester-linked at various points with the overlaying “sheath” of lignin, but
also to produce a coat around underlying strands of cellulose via hydrogen bonds. The
xylan layer with its covalent linkage to lignin and its non-covalent interaction with
cellulose may be important in maintaining the integrity of the plant cell wall in situ and in
helping protect the fibers against degradation by enzymes (Beg et al. 2001). At least two
types of covalent cross-links have been identified between hemicellulose and lignin: i)
diferulic acid bridges, and ii) ester linkage between lignin and glucuronic acid attached to
xylans (de Vries and Visser 2001).
Hemicellulose was originally defined as the fraction isolated or extracted from plant
materials using dilute alkali. Main hemicellulose chains contain either xylose or
mannose, to which may be linked short side-chains composed of sugars such as arabinose
and glucuronic acid. Xylans are the most common hemicellulosic polysaccharide in cell
walls of land plants. They consist of a β-1,4-linked D-xylose backbone, and can be
substituted by different side groups such as L-arabinose, D-galactose, acetyl, ferulyl, p-
coumaroyl, and glucuronic acid residuals (Beg et al. 2001; de Vries and Visser 2001).
Hardwood xylan consists of at least 70 O-acetyl-4-O-methylglucuronoxylan unites linked
6
by β-1,4-glycosidic bonds with an average degree of polymerization (DP) between 150
and 200. Hardwood xylan is often referred to as glucuronoxylans due to the large amount
of D-glucuronic acid attached to the backbone. Hardwood xylan is highly acetylated (e.g.
birchwood xylan contains more than 1 mol of acetic acid per 2 mol of xylose), which is
preferentially at the C-3 position, as opposed to the C-2 position. The presence of these
acetyl groups is responsible for the partial solubility of xylan in water. These acetyl
groups are readily removed using alkali extraction (Beg et al. 2001). Softwood xylan
consists of arabino-4-O-methylglucuronoxylan with the DP between 70 and 130, shorter
than hardwood xylans and less branched (Beg et al. 2001; Singh et al. 2003). It is not
acetylated but the 4-O-methylglucoronic acid and the L-arabinofuranose residues are
attached to the C-2 and C-3 positions, respectively, of relevant xylopyranose backbone
units (Singh et al. 2003).
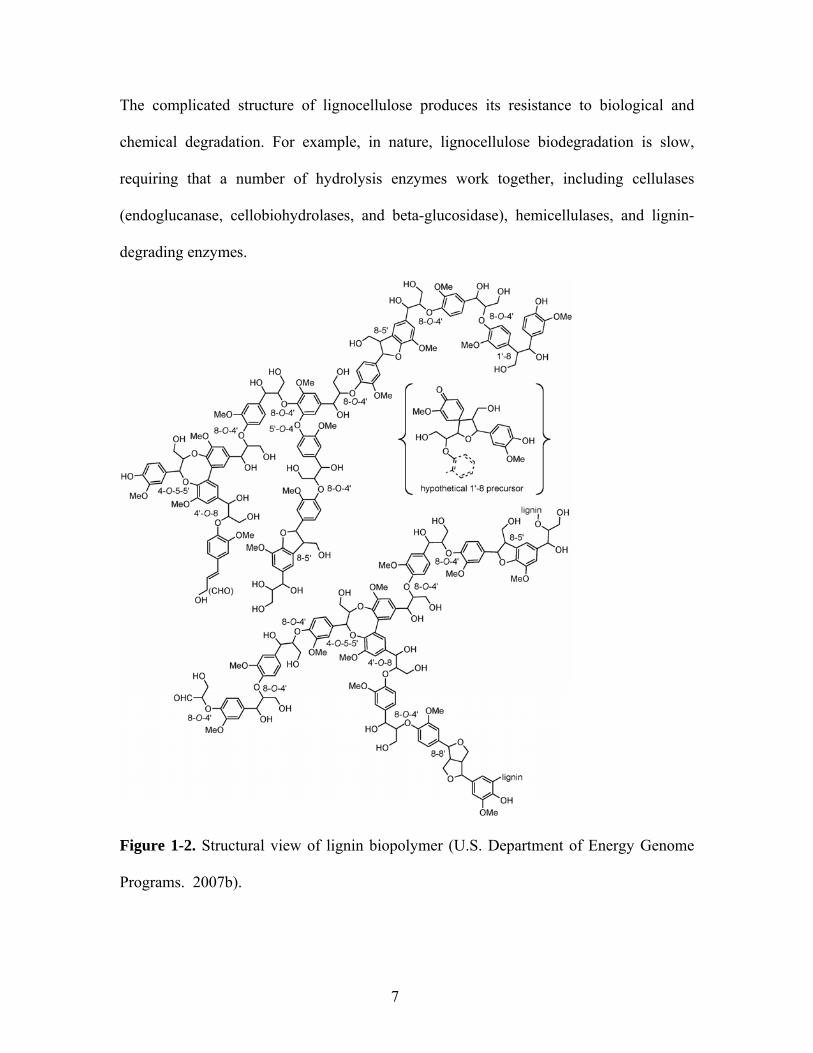
Lignin is a polyphenolic biopolymer formed by non-enzymatic polymerization of
delocalized phenoxy radicals derived from the monomers, i.e., substituted p-
hydroxycinnamyl alcohols (Figure 1-2). Lignin is a noncrystalline solid polymer with a
density of ~1.3-1.4 g/cm3. The bonds among monomeric units include ether and biphenyl
linkages, which are resistant to hydrolytic attack (Broda et al. 1996). The biological role
of lignin is to hold cellulose and hemicellulose in the plant cell walls together and to
prevent water loss from plant vascular systems because of its hydrophobic properties.
Lignin has a high energy density (24~26 MJ/kg), thus 1 kg is equivalent to 0.6 kg of
petroleum.
7
The complicated structure of lignocellulose produces its resistance to biological and
chemical degradation. For example, in nature, lignocellulose biodegradation is slow,
requiring that a number of hydrolysis enzymes work together, including cellulases
(endoglucanase, cellobiohydrolases, and beta-glucosidase), hemicellulases, and lignin-
degrading enzymes.
Figure 1-2. Structural view of lignin biopolymer (U.S. Department of Energy Genome
Programs. 2007b).
8
1.2 LIGNOCELLULOSE PRETREATMENT TECHNOLOGY
Effectively overcoming the recalcitrance structure of lignocellulose and releasing the
locked polysaccharides is one of the most important and urgent R&D priorities for the
emerging cellulosic ethanol and bio-based chemical industries (Biomass Research and
Development Technical Advisory Committee 2002; Office of Energy Efficiency and
Renewable Energy and Office of Science 2006). Lignocellulose pretreatment is among
the most costly steps and has a major influence on the costs of both prior operation (e.g.,
lignocellulose particle size reduction) and subsequent operations (e.g., enzymatic
hydrolysis and fermentation) (Wooley et al. 1999; Wyman et al. 2005b). Typically,
substrate factors that have been shown to affect digestibility of cellulose are the
crystallinity of cellulose, degree of polymerization of the cellulose, particle size/specific
surface area, lignin distribution, and accessible surface area. To increase efficiency of
hydrolysis of the polysaccharide sugars into fermentable sugars, a pretreatment process is
required for conversion of lignocellulosic biomass.
All lignocellulose treatments can be divided into four main categories:
1. Physical methods, including dry milling (chipping, ball milling and comminuting),
wet milling, irradiation, microwave, and swelling reagents (ZnCl2) (Awafo et al.
1995; Chang et al. 1981; Hsu 1996; Kumakura and Kaetsu 1983; Kumakura et al.
1982; Lam et al. 2000; McMillian 1994; Millett et al. 1976; Sun and Cheng 2002;
Tolbert et al. 1986);
9
2. Chemical methods, including dilute acids (dilute H2SO4, H3PO4, HCl, acetic acid,
formic acid/HCl) (Brennan and Wyman 2004; Chung et al. 2005; Fan et al. 1982;
Grethlein and Converse 1991; Jacobsen and Wyman 2000; Kim et al. 2002; Kim and
Lee 2002; Lee et al. 1997; Lloyd and Wyman 2003; Lloyd and Wyman 2004; Lloyd
and Wyman 2005; McMillian 1994; Nagle et al. 2002; Nguyen et al. 2000; Schell et
al. 2003; Song and Lee 1984; Teixeira et al. 2000 ; Tucker et al. 2004; Um et al.
2003; Vlasenko et al. 1997; Weil J 1994; Zhu et al. 2004; Zhu et al. 2005), alkalis
(NaOH, lime, ammonia, amine, etc.) (Chang et al. 2001; Coward-Kelly et al. 2005;
Ferrer et al. 2002a; Ferrer et al. 2002b; Foster et al. 2001; Galbe and Zacchi 2002;
Horvath et al. 2005; Kim et al. 2000; Kim and Holtzapple 2005a; Kim and Holtzapple
2005b; Kim and Holtzapple 2005c; Kurakake et al. 2001; Lynd et al. 2002; Mosier et
al. 2005b; Sulbaran-de-Ferrer et al. 2003; Wyman et al. 2005a; Wyman et al. 2005b),
organosolv (Chum et al. 1988; Holtzapple and Humphrey 1984; Mutje et al. 2005;
Pan et al. 2005a), oxidizing agents (O3, NO, H2O2, NaClO2) (Ahring et al. 1996;
Charles et al. 2003; Fan et al. 1982; Schmidt and Thomsen 1998; Vidal and Molinier
1988; Weil J 1994; Yang et al. 2002), cellulose solvents (Wood and Saddler 1988)
(e.g., cadoxen (Ladisch et al. 1978), DMAc/LiCl (Striegel 1997; Valjamae et al.
2003), concentrated H2SO4 (Fengel and Wegener 1984), etc.);
3. Physio-chemical methods, including steam explosion with or without catalysts
(Ballesteros et al. 2000a; Ballesteros et al. 2000b; Bura et al. 2003a; Bura et al.
2003b; Bura et al. 2002; Converse and Grethlein 1987; Emmel et al. 2003; Grethlein
and Converse 1991; Kobayashi et al. 2004; Laser et al. 2002; Martin et al. 2002;
10
Negro et al. 2003; Ohgren et al. 2005; Oliva et al. 2003; Palmarola-Adrados et al.
2004; Sassner P 2005 ; Soderstrom et al. 2002; Soderstrom et al. 2003; Tanaka et al.
1990; Tengborg et al. 2001; Vlasenko et al. 1997), CO2 explosion (van Walsum and
Shi 2004; Zheng et al. 1998), ammonia fiber explosion or expansion (AFEX)
(Alizadeh et al. 2005; Dale et al. 1996; Ferrer et al. 2000; Gollapalli et al. 2002;
Tengerdy and Nagy 1988; Teymouri et al. 2005; Vlasenko et al. 1997), hot water
(Ballesteros et al. 2000b; Laser et al. 2002; Li et al. 2003; Mosier et al. 2005a; Negro
et al. 2003; van Walsum and Shi 2004), hot water with flow-through (Liu and Wyman
2004; Liu and Wyman 2005), supercritical fluid extractions (CO2, CO2/H2O,
CO2/SO2, NH3, H2O) (Kim and Hong 2001; McMillian 1994; van Walsum and Shi
2004), and lignocellulose fractionation (Zhang et al. 2007b); and
4. Biological methods (white rod fungi) (Akin et al. 1995; Breen and Singleton 1999;
Crawford 1978; Fan et al. 1987; Hatakka 1983; Kerem and Hadar 1995; Leonowicz et
al. 1999; Rahmawati et al. 2005; Valaskova and Baldrian 2005).
Recently, a Biomass Refining Consortium for Applied Fundamentals and Innovation
(CAFI) has been founded, composed of Auburn University, Dartmouth College,
Michigan State University, the National Renewable Energy Laboratory (NREL), Purdue
University and Texas A&M University. It was supported by the U.S. Department of
Agriculture Initiative for Future Agriculture and Food Systems (IFAFS) Program and the
Office of the Biomass Program of the U.S. Department of Energy and undertook the first
coordinated project to develop comparative information on the performance of leading
11
pretreatment options on corn stover. The pretreatment choices were narrowed down to a
few methods: dilute acid (Grethlein and Converse 1991; Kim and Lee 2002; Lloyd and
Wyman 2003; Lloyd and Wyman 2005; Nguyen et al. 2000; Schell et al. 2003; Tucker et
al. 2004; Um et al. 2003), flow-through pretreatment (Liu and Wyman 2004; Liu and
Wyman 2005; Yang and Wyman 2004), ammonia fiber explosion (Alizadeh et al. 2005;
Dale et al. 1996; Gollapalli et al. 2002; Teymouri et al. 2005), ammonia recycle
percolation (ARP) (Kim et al. 2000; Kim et al. 2003; Kim and Lee 2005; Kim and Lee
2006), and lime pretreatment (Chang et al. 2001; Coward-Kelly et al. 2005; Kim and
Holtzapple 2005a; Kim and Holtzapple 2005b; Kim and Holtzapple 2005c) in Table 1-1.
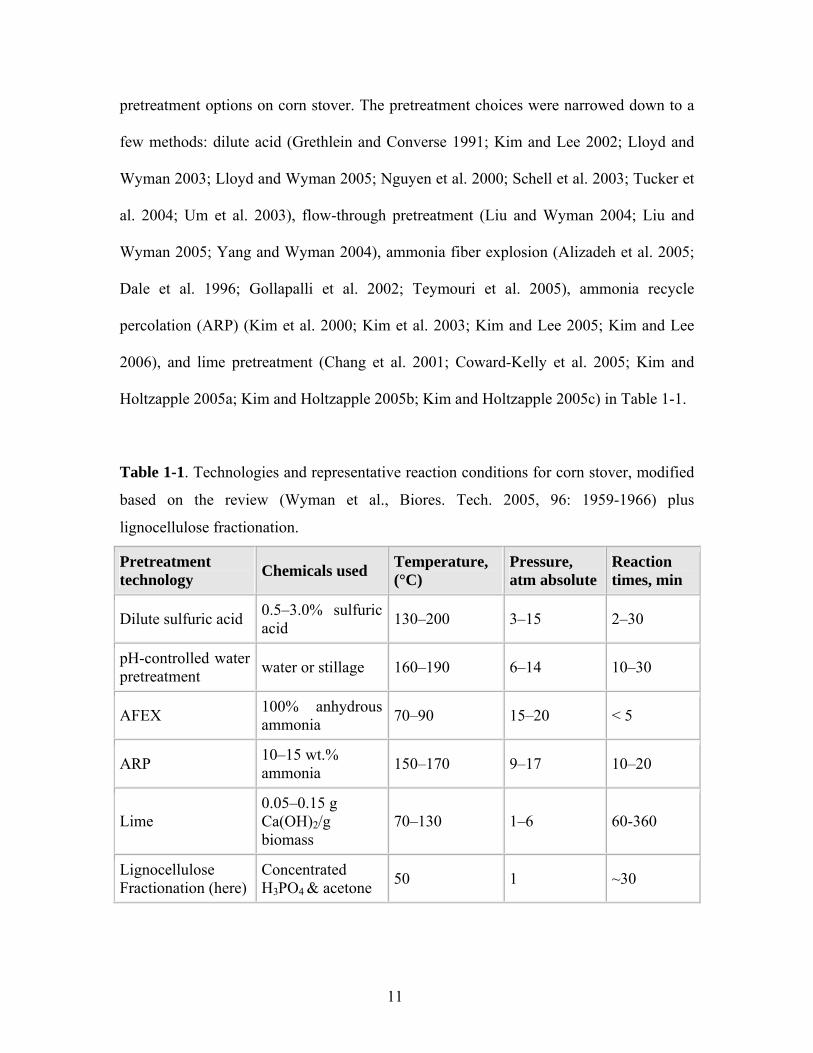
Table 1-1. Technologies and representative reaction conditions for corn stover, modified
based on the review (Wyman et al., Biores. Tech. 2005, 96: 1959-1966) plus
lignocellulose fractionation.
Pretreatment technology Chemicals used Temperature,
(°C) Pressure, atm absolute
Reaction times, min
Dilute sulfuric acid 0.5–3.0% sulfuric acid 130–200 3–15 2–30
pH-controlled water pretreatment water or stillage 160–190 6–14 10–30
AFEX 100% anhydrous ammonia 70–90 15–20 < 5
ARP 10–15 wt.% ammonia 150–170 9–17 10–20
Lime 0.05–0.15 g Ca(OH)2/g biomass
70–130 1–6 60-360
Lignocellulose Fractionation (here)
Concentrated H3PO4 & acetone 50 1 ~30
12
A project of CAFI-II is being conducted to deal with a hardwood feedstock -- hybrid
poplar. Additionally, two other methods have been intensively investigated in Europe
and Canada: steam explosion with or without SO2 impregnation (Ballesteros et al. 2000b;
Bura et al. 2003a; Bura et al. 2003b; Bura et al. 2002; Converse and Grethlein 1987;
Emmel et al. 2003; Grethlein and Converse 1991; Laser et al. 2002; Martin et al. 2002;
Palmarola-Adrados et al. 2004; Soderstrom et al. 2002; Soderstrom et al. 2003; Tengborg
et al. 2001) and organosolv (Chum et al. 1988; Holtzapple and Humphrey 1984; Mutje et
al. 2005; Pan et al. 2005a).
All leading pretreatments share one or several common shortcomings:
1. Severe pretreatment conditions (except AFEX and lime) (see Table 1-1), result in
sugar degradation and inhibitor formation;
2. Low or modest cellulose digestibility because of the presence of residual lignin
and hemicellulose and the remaining crystalline cellulose;
3. High cellulase loading;
4. Low hydrolysis rates;
5. Large utility consumption;
6. Huge capital investment for high pressure and temperature reactors; and
7. Less co-utilization of other lignocellulose components (except organosolv).
Therefore, there is an urgent need to find new pretreatment technologies for overcoming
the recalcitrance of lignocellulose to achieve attractive investor returns, and/or increase
13
revenues (Lynd et al. 1999; Wyman 1999). Development of a lignocellulose
pretreatment, featuring modest reaction conditions, is highly desired because it can not
only decrease utility consumption and initial capital investment but also reduce sugar
degradation and inhibitor formation (McMillan 1994).
Although biomass recalcitrance has been attributed to up to seven factors (Himmel et al.
2007), the two main root causes of the recalcitrance of lignocellulose to cellulase
enzymatic hydrolysis are hypothesized to be 1) the low accessibility of (micro-)
crystalline cellulose fibers, which prevents cellulases from working efficiently (Zhang et
al. 2006a; Zhang and Lynd 2006), and 2) the presence of lignin (mainly) and
hemicellulose on the surface of cellulose, which prevents cellulase from accessing the
substrate efficiently (Pan et al. 2005b; Zhang et al. 2007b).
A new lignocellulose pre-treatment featuring modest reaction conditions (50°C and
atmospheric pressure) has recently been invented to fractionate lignocellulose to
amorphous cellulose, hemicellulose, lignin, and acetic acid by using a non-volatile
cellulose solvent (concentrated phosphoric acid), a highly volatile organic solvent
(acetone), and water (Zhang et al. 2007b). The high sugar yields after enzymatic
hydrolysis were attributed to the lack of sugar degradation during the fractionation and
the high enzymatic cellulose digestibility ( 97% in 24 h) during the hydrolysis step at the
enzyme loading of 15 filter paper units of cellulase and 60 IU of beta-glucosidase per
gram of glucan. Isolation of high-value lignocellulose components (lignin, acetic acid,
14
and hemicellulose) would greatly increase potential revenues of a lignocellulose
biorefinery.
1.3 Research Goals
In this study, my research plan includes two tasks:
1. Developing a more accurate quantitative saccharification (QS) method for acid-
labile carbohydrate composition in lignocellulose;
2. Evaluating the feasibility of lignocellulose fractionation applicable to a special
lignocellulosic feedstock.
The goal of Task 1 is to decrease the inherent theoretical error of the quantitative
saccharification with slight modifications (Chapter 2); the goal of Task 2 is to
demonstrate the potential of lignocellulose fractionation for other lignocellulosic
materials that cannot be addressed by the most popular technology – steam explosion
(Chapter 3).
15
2. MORE ACCURATE DETERMINATION OF ACID-LABILE SUGARS IN
LIGNOCELLULOSE BY QUANTITATIVE SACCHARIFICATION
Abstract. Quantitative saccharification is a widely used method for determining
carbohydrate composition in lignocellulosic materials. The NREL methods (Ruiz and
Ehrman 1996; Sluiter et al. 2006) involve a primary hydrolysis (high sulfuric acid
concentration at low temperature) breaking down polysaccharides into oligosaccharides,
followed by a secondary hydrolysis (dilute acid stage at high temperature) converting all
the oligosaccharides to monosaccharides that can be easily quantified. The monomeric
sugars, after neutralization, are measured by HPLC. Since some saccharides are degraded
during the harsh hydrolysis processes, a sugar control set of monomeric sugars is run in
parallel and the mono-saccharide correction coefficients (representing sugar degradation)
are used to reflect those for polysaccharides. This could not be a valid assumption
because the polysaccharide and monosaccharide sugars have different degradation rates.
For acid-labile polysaccharides, such as xylans and arabinans, the lower value of
correction coefficients for xylose and arabinose could result in an overestimation of the
total sugars in the samples. We propose a new protocol based on the NREL 2006
protocol (Sluiter et al. 2006) with slight modifications, in which xylose concentration at
the secondary hydrolysis by using 1% sulfuric acid rather than 4% sulfuric acid is
determined. The less acidic reaction can significantly decrease xylose degradation ~3.8
fold. We found that the current protocol led to a statistically significant overestimation of
acid-labile xylan contents for Douglas fir by 9.1%, hybrid poplar by 8.1%, switchgrass by
4.2%, corn stover by 8.5%, and wheat straw by 8.3%.
16
2.1 INTRODUCTION
Lignocellulosic material, the main product of photosynthesis, is the most abundant
renewable biological resource. Lignocellulose is a natural composite, consisting of three
main polymeric components – cellulose, hemicellulose and lignin, as well as other minor
components, such as, minerals and protein (Zhang and Lynd 2004). Cellulose is a linear
polymer consisting of D-anhydroglucopyranose connected by β-1,4-glycosidic bonds.
Distinct from cellulose, hemicellulose is a polymeric carbohydrate with some branching,
composed of pentoses and hexoses. The complete separation of hemicellulose and
cellulose with full carbohydrate recoveries is still a nearly impossible task because of the
complicated linkage among cellulose, hemicellulose, and lignin.
It is still a technical challenge to quantitatively measure polymeric saccharides in
lignocellulosic materials directly, but it is easy to convert polymeric carbohydrates
(polysaccharides) in lignocellulose to monomeric sugars, which can be quantitatively
measured by a number of sugar assays, HPLC, or GC. In 1945, Saeman and his
coworkers (Saeman et al. 1945) at the U.S. Department of Agriculture Forest Products
Laboratories developed an analytical protocol, called “Quantitative Saccharification (QS)
of Wood and Cellulose”. The method involved a primary hydrolysis with 72% w/w
sulfuric acid at 30oC for 45 minutes, which converted polysaccharides to
oligosaccharides, followed by a secondary hydrolysis (4% w/w sulfuric acid) at 121oC for
1 hour, which converted oligosaccharides to monomeric sugars. The total reducing sugars
after neutralization by CaCO3 were measured by the Somogyi method (Shaffer and
Somogyi 1933; Zhang et al. 2006b).
17
Quantitative saccharification is a widely used method for determination of carbohydrate
contents in lignocellulosic materials. Accurate determination of carbohydrate
composition is important for a variety of fields, including emerging biofuels and biobased
products industries, paper and pulping industries, as well as agriculture and forest product
industries (Bjarnestad and Dahlman 2002; Schultz et al. 1985).
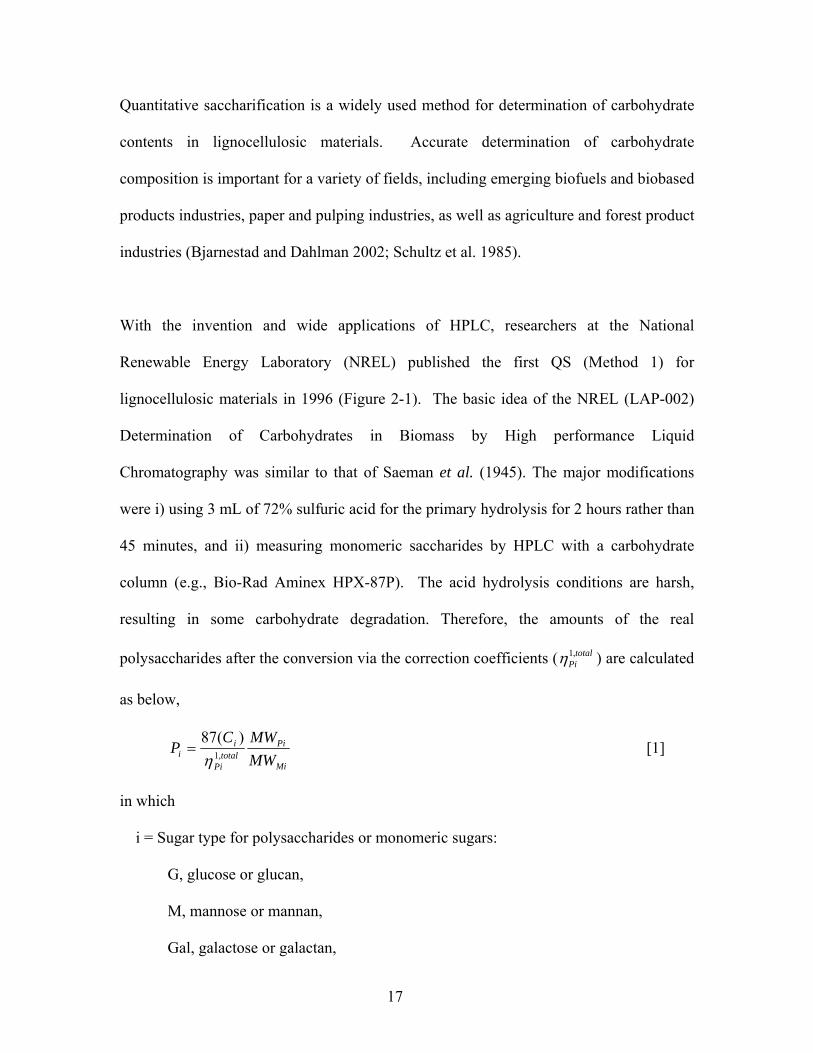
With the invention and wide applications of HPLC, researchers at the National
Renewable Energy Laboratory (NREL) published the first QS (Method 1) for
lignocellulosic materials in 1996 (Figure 2-1). The basic idea of the NREL (LAP-002)
Determination of Carbohydrates in Biomass by High performance Liquid
Chromatography was similar to that of Saeman et al. (1945). The major modifications
were i) using 3 mL of 72% sulfuric acid for the primary hydrolysis for 2 hours rather than
45 minutes, and ii) measuring monomeric saccharides by HPLC with a carbohydrate
column (e.g., Bio-Rad Aminex HPX-87P). The acid hydrolysis conditions are harsh,
resulting in some carbohydrate degradation. Therefore, the amounts of the real
polysaccharides after the conversion via the correction coefficients ( totalPi,1η ) are calculated
as below,
Mi
Pitotal
Pi
ii MW
MWCP ,1
)(87η
= [1]
in which
i = Sugar type for polysaccharides or monomeric sugars:
G, glucose or glucan,
M, mannose or mannan,
Gal, galactose or galactan,
18
X, xylose or xylan,
A, arabinose or arabinan
P = Polysaccharide:
O for oligosaccharides,
M for monomeric sugar,
D for degraded sugars
Ci = Monomeric sugar concentration measured by HPLC (mg/mL)
totalPi,1η = Overall correction coefficient for polysaccharides ( 2,11,1
PiPi ηη ∗ )
1,1Piη = Correction coefficient for polysaccharides to oligosaccharides during the
primary hydrolysis
2,1Piη = Correction coefficient for oligosaccharides to monosaccharides during the
secondary hydrolysis
MW = Molecular weights for hexose and pentose polysaccharides (162 g/mol or 132
g/mol), respectively; for monomeric hexose and pentose (180 g/mol or 150 g/mol),
respectively.
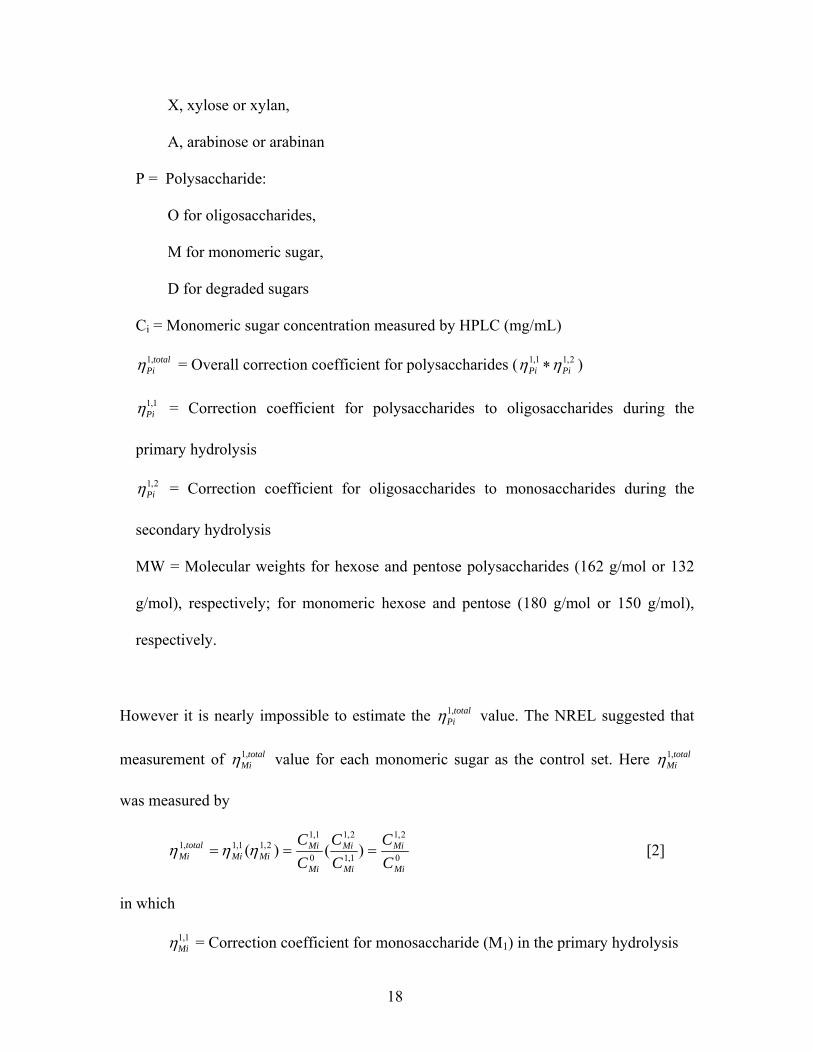
However it is nearly impossible to estimate the totalPi,1η value. The NREL suggested that
measurement of totalMi,1η value for each monomeric sugar as the control set. Here total
Mi,1η
was measured by
0
2,1
1,1
2,1
0
1,12,11,1,1 )()(
Mi
Mi
Mi
Mi
Mi
MiMiMi
totalMi C
CCC
CC
=== ηηη [2]
in which
1,1Miη = Correction coefficient for monosaccharide (M1) in the primary hydrolysis
19
2,1Miη = Correction coefficient for monosaccharide (M2) in the primary hydrolysis
0MiC = Initial monomeric sugar concentration (mg/g)
1,1MiC = Monomeric sugar concentration after the primary hydrolysis (mg/g),
2,1MiC = Monomeric sugar concentration after the primary and secondary hydrolysis
(mg/g).
The above correction method could suffer from theoretical error because totalPi,1η is much
less than, totalMi,1η . If the difference between total
Pi,1η and total
Mi,1η is significant it could result
in theoretical error.
20
Polysaccha-rides (Pi)
Oligosaccha-rides
Monomeric Sugars (Mi)
M1-1: 30oC, 2 hrs M1-2: 4% H2SO4
M3-2: 4% H2SO4
Degraded Sugars (Di)
M3-1: 30oC, 1 h
M3-2AL:1% H2SO4
Dilute acid 121oC, 1 h
High acid (72%), 30oC
M1
M2
M2-1: 30oC, 1 h M2-2: 4% H2SO4
M3
1,1Miη
2,2Miη
2,3Miη
2,3Miη
2,1Miη
1,1Piη 2,1
Piη
2,2Piη
2,3Piη
2,3Piη
2,11,1,1PiPi
totalPi ηηη ∗=
2,11,1,1MiMi
totalMi ηηη ∗=
2,2,2Pi
totalPi ηη ≅
2,2,2Mi
totalMi ηη =
2,3,3Pi
totalPi ηη ≅
2,3,3Mi
totalMi ηη =
2,3,3Pi
totalPi ηη ≅
2,3,3Mi
totalMi ηη =
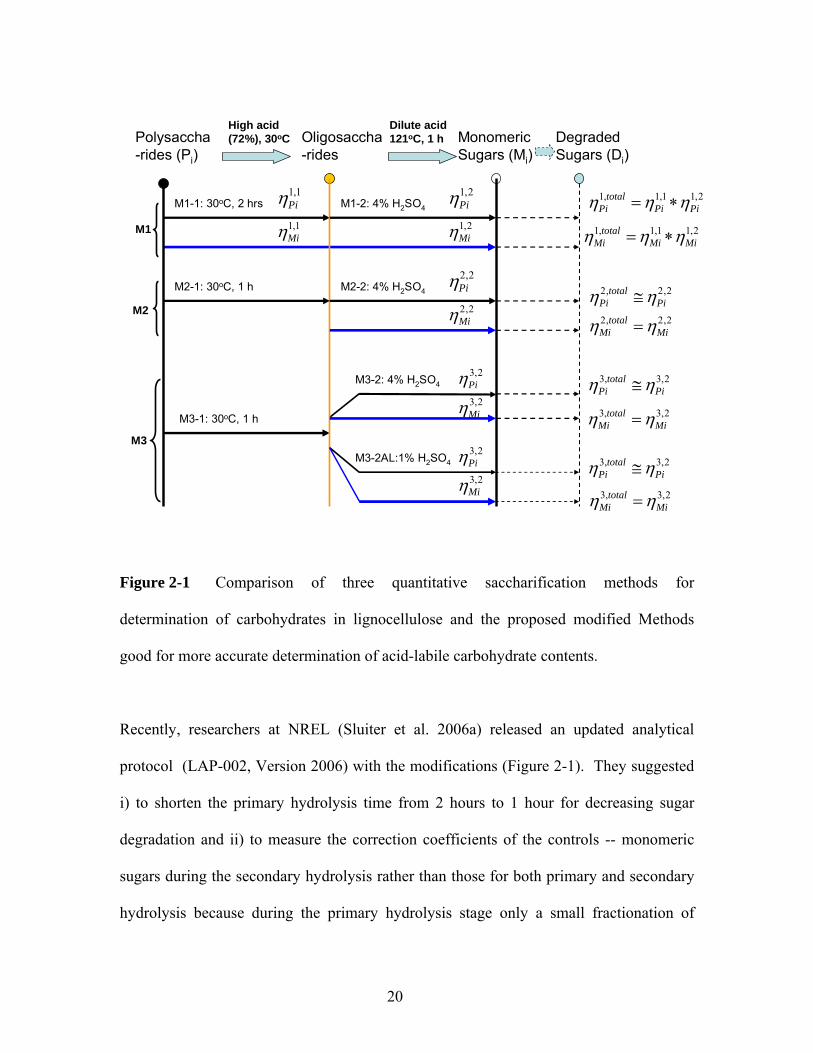
Figure 2-1 Comparison of three quantitative saccharification methods for
determination of carbohydrates in lignocellulose and the proposed modified Methods
good for more accurate determination of acid-labile carbohydrate contents.
Recently, researchers at NREL (Sluiter et al. 2006a) released an updated analytical
protocol (LAP-002, Version 2006) with the modifications (Figure 2-1). They suggested
i) to shorten the primary hydrolysis time from 2 hours to 1 hour for decreasing sugar
degradation and ii) to measure the correction coefficients of the controls -- monomeric
sugars during the secondary hydrolysis rather than those for both primary and secondary
hydrolysis because during the primary hydrolysis stage only a small fractionation of
21
polysaccharides were converted to monomeric sugars and even much smaller monomeric
sugars were degraded (i.e., 11,2 =Piη ) at the shorter primary hydrolysis. Therefore,
2,2,2Pi
totalPi ηη = .
Regardless of the method (Method 1 or Method 2), the sugar degradation rates of
monomeric sugars ( totalMi
,1η or 2,2Miη ) were greater than those of polysaccharides ( total
Pi,1η or
2,2Oiη ), especially for acid-labile sugars – xylan and arabinan (Lloyd and Wyman 2003;
Lloyd and Wyman 2005). Lower values of correction coefficients of acid labile
polysaccharides might lead to over-estimation of acid-labile carbohydrate contents. In
this study, we investigated the degradation rates of monomeric sugars at different acid
concentration at the primary and secondary hydrolysis. We propose to slightly modify
NREL procedure LAP-002 (Method 2) for more accurate determination of carbohydrate
concentration, especially for acid-labile carbohydrates. The analysis suggested that
NREL LAP-002 (2006 protocol) leads to a statistically significant over-estimation of
acid-labile xylan contents as compared to our method (Method 3), and the degree of over-
estimation depends on the plant species.
2.2 METHODS AND MATERIALS
Chemicals and Materials. All chemicals were reagent grade and purchased from
Sigma-Aldrich (St. Louis, MO) or Fisher Scientific (Atlanta, GA) unless otherwise noted.
Corn stover, switchgrass, wheat straw, hybrid poplar, and Douglas fir samples were
graciously provided by James McMillan at the National Renewable Energy Laboratory
22
(NREL, Golden, CO). All lignocellulosic materials were knife-milled and screened. The
lignocellulose particles smaller than 40 mesh screen and larger than 60 mesh screen were
used for quantitative saccharification determination of structural carbohydrates. The
lignocellulose samples were dried in a convection oven at 105 ± 3 °C for 4 hours or
longer until a constant weight was achieved. The samples were then removed from the
oven and allowed to cool to room temperature in a desiccator with silica gel dessicant.
Sugar Assays. Monomeric sugars were measured by Shimadzu HPLC (Kyoto, Japan)
equipped with Bio-Rad Aminex HPX-87P column and the corresponding guard column.
Ten μL injection volume was used; 18.2 MΩ deionized water was used a mobile phase at
a rate of 0.6 mL/min; the column temperature was 80 °C; a refractive index detector was
used as the detector; the run time was 35 minutes.
QS Protocols
Three different methods for determination of carbohydrates in lignocellulose were
preformed on five samples of lignocellulosic material, switchgrass, wheat straw, corn
stover, hybrid poplar, and Douglas fir. Three hundred ± 10.0 mg of lignocellulose
sample was weighted and put into a test tube. One set of the controls -- monomeric
sugars, including glucose, xylose, galactose, arabinose, and mannose -- was prepared to
estimate sugar losses during hydrolysis. To the sample, 3.00 ± 0.01 mL of 72% (w/w)
sulfuric acid was added and well-mixed with a glass stir rod.
23
Method 1. The pressure tubes were placed in a water bath set at 30 ± 1 °C for 120 ± 1
minutes, and agitated at 120 rpm. Proper mixing was essential to ensure even acid-to-
particle contact and uniform hydrolysis. After primary hydrolysis, the samples were
diluted to 4% sulfuric acid to the serum bottles by adding 84 mL of distilled water. All
pressure tubes were then capped and sealed. The sealed pressure tubes were autoclaved
for 1 h at 121°C. The monomeric sugar control group was run from through both
primary hydrolysis and secondary hydrolysis. The hydrolysis liquor to be analyzed was
neutralized to a pH of ~6 by adding calcium carbonate. Upon reaching a pH of 6, the
sample was allowed to settle and the supernatant decanted from the solids. The
supernatant was then filtered through a 0.45 μm filter, and frozen. The sample was then
thawed, and 1.0 mL of sample was transferred to an HPLC vial. The residual sugars
measured by HPLC were measured for by calculating 0
2,1,1
Mi
MitotalMi C
C=η . Here it was assumed
that totalMi,1η = total
Pi,1η . Therefore, polysaccharide contents in lignocellulose cannot be
calculated by Equation (1).
Method 2. The pressure tubes were placed in a water bath set at 30 ± 1 °C for 60 ± 1
minutes and agitated at 120 rpm. Upon completion of the first hydrolysis, the tubes were
placed into an ice-cold water bath. The samples were diluted to 4% sulfuric acid by
adding 84 mL of distilled water. All pressure tubes were then capped and sealed.
Another set of the controls using the same monomeric sugars were prepared as a control
for Method 2 as above, but prepared in concentrations similar to those expected in the
samples. The controls were acidified to 87 mL of 4% sulfuric acid. All samples and
24
controls were autoclaved for 1 hour at 121 °C. After completion of the autoclave cycle,
samples were allowed to slowly cool to room temperature. The hydrolysis liquor to be
analyzed was neutralized to a pH of ~6 by adding calcium carbonate. Upon reaching a
pH of 6, the sample was allowed to settle and the supernatant decanted from the solids.
The supernatant was then filtered through a 0.45 μm filter, and frozen. The sample was
then thawed, and 1.0 mL of sample was transferred to an HPLC vial. The residual control
sugars measured by HPLC were measured for by calculating 2,2,2Mi
totalMi ηη = . Here it was
assumed that totalMi
,2η = totalPi
,2η . Therefore, the polysaccharide contents in lignocellulose
cannot be calculated by Equation (1).
Method 3. Solutions of monomeric sugars glucose, galactose, mannose, xylose, and
arabinose were prepared in concentrations between 4.0 mg/ml and 0.1 mg/mL as sugar
recovery standards (SRS), along with a calibration verification standard (CVS), prepared
from sugars from a different lot than those used in the SRS. The samples after the
primary hydrolysis (72% w/w sulfuric acid at 30oC for 1 hour) were diluted to 4% by
adding 84 mL of distilled water. After well mixing, one mL of the supernatant
hydrolysate was withdrawn into a tube, and then diluted to 1% sulfuric acid by adding 3
mL of water. Concentrations of the controls (glucose, mannose, and galactose, 4%
sulfuric acid; xylose and arabinose at 1% sulfuric acid) were prepared at levels similar to
the expected sugars released in the samples during the secondary hydrolysis (121oC for 1
hour). The hydrolysis liquor that was analyzed was neutralized to a pH of ~6 by adding
calcium carbonate. Upon reaching a pH of 6, the sample was allowed to settle and the
supernatant decanted from the solids. The supernatant was then filtered through a 0.45
25
μm filter, and frozen to remove any particulate. The sample was then thawed, and 1.0
mL of sample was transferred to an HPLC vial.
Lignin Determination. Lignocellulose samples were analyzed for acid-insoluble lignin
by vacuum filtering the autoclaved hydrolysis solution (87 mL or 84 mL of hydrolysate)
though a filtering crucible of known weight, and the filtrate captured in a filtering flask.
An aliquot of 50 mL of sample was removed from the flask for determination of acid-
soluble lignin and carbohydrates. The remaining solids in the pressure tube were
quantitatively transferred into the filtering crucible with deionized water. The solids
were then rinsed with 50 mL of fresh deionized water. The wet solids were weighed to
the nearest 0.01 g for determination of acid-insoluble lignins and ash content. The
crucible and acid-insoluble resins were dried in a convection oven at 105 ± 3°C for 12
hours, such that a constant weight was achieved. The samples were then removed from
the oven and allowed to cool to room temperature in a desiccator. The samples were then
re-weighed for determination of ash content. The crucibles and residue were then ashed
in a muffle furnace at 575 ± 25°C for 24 hours. After this time, the crucibles were
removed from the furnace and allowed to cool to room temperature in a desiccator. The
acid-soluble lignin was measured by a UV-Visible spectrophotometer, with a background
of deionized water. The absorbance of the hydrolysis liquor was measured at a
wavelength of 240 nm.
Monomeric Sugar Degradation. Known amounts of the different sugars were dissolved
in 4%, 3%, 2%, and 1% sulfuric acid, and sealed in pressure vials at 121°C for 1 hour or
26
longer to measure the sugar degradation during weak acid hydrolysis. After the reaction
these samples were prepared and analyzed by HPLC.
Degradation of monomeric sugars during the strong acid hydrolysis phase was measured
in two steps. A monomer sugar solution of known concentration was prepared in 72%
ice-cold sulfuric acid. Three mL aliquots were transferred to the test tubes and placed in
water baths set to 30°C, 40°C, 50°C, 60°C, and 70°C for a period of 1 hour or longer, at
which point samples were immediately placed in another ice bath to stop degradation.
Sugars can form sugar sulfate at high acid concentration and this molecule cannot be
detected by HPLC. An extra step – acid dilution (1% dilute sulfuric acid, 121oC, 1 hour)
was needed to convert sugar sulfate to sugar and dilute sulfuric acid before HPLC assay.
Sugar degradation at high acid concentration at low temperatures was estimated by the
total sugar degradation minus the sugar degradation at the dilute acid conditions.
Preparation of Cellodextrins and Xylooligosaccharides. Cellodextrins were prepared
from Avicel by mixed acid hydrolysis; the cellodextrin components were separated by
size-exclusion chromatography as described before (Zhang and Lynd 2003).
Xylooligosaccharides was hydrolyzed from Sigma xylans by hot water treatment (Li et
al. 2003).
27
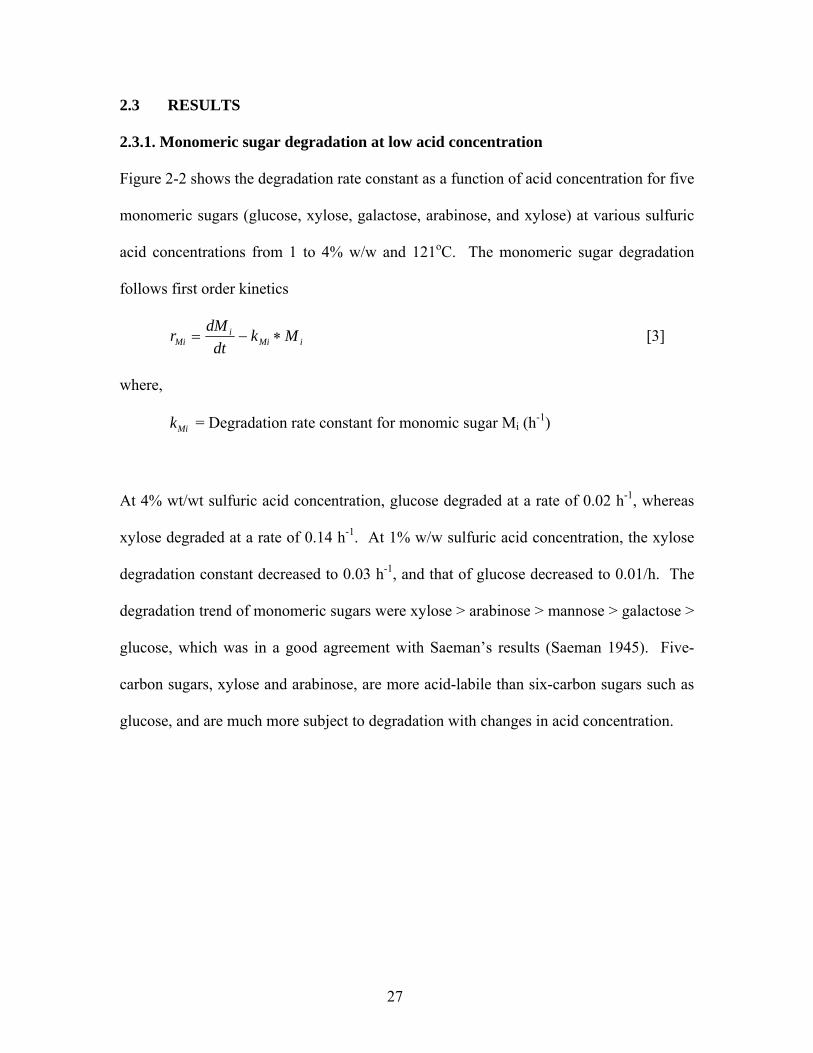
2.3 RESULTS
2.3.1. Monomeric sugar degradation at low acid concentration
Figure 2-2 shows the degradation rate constant as a function of acid concentration for five
monomeric sugars (glucose, xylose, galactose, arabinose, and xylose) at various sulfuric
acid concentrations from 1 to 4% w/w and 121oC. The monomeric sugar degradation
follows first order kinetics
iMii
Mi Mkdt
dMr ∗−= [3]
where,
Mik = Degradation rate constant for monomic sugar Mi (h-1)
At 4% wt/wt sulfuric acid concentration, glucose degraded at a rate of 0.02 h-1, whereas
xylose degraded at a rate of 0.14 h-1. At 1% w/w sulfuric acid concentration, the xylose
degradation constant decreased to 0.03 h-1, and that of glucose decreased to 0.01/h. The
degradation trend of monomeric sugars were xylose > arabinose > mannose > galactose >
glucose, which was in a good agreement with Saeman’s results (Saeman 1945). Five-
carbon sugars, xylose and arabinose, are more acid-labile than six-carbon sugars such as
glucose, and are much more subject to degradation with changes in acid concentration.
28
0 1 2 3 40.00
0.03
0.06
0.09
0.12
0.15
Deg
rada
tion
cons
tant
K (h
-1)
Sulfuric acid concentration (wt/wt)
Xylose Arabinose Mannose Galactose Glucose
Figure 2-2. Monomer sugar degradation rate constants for different sulfuric acid
concentrations at 121°C.
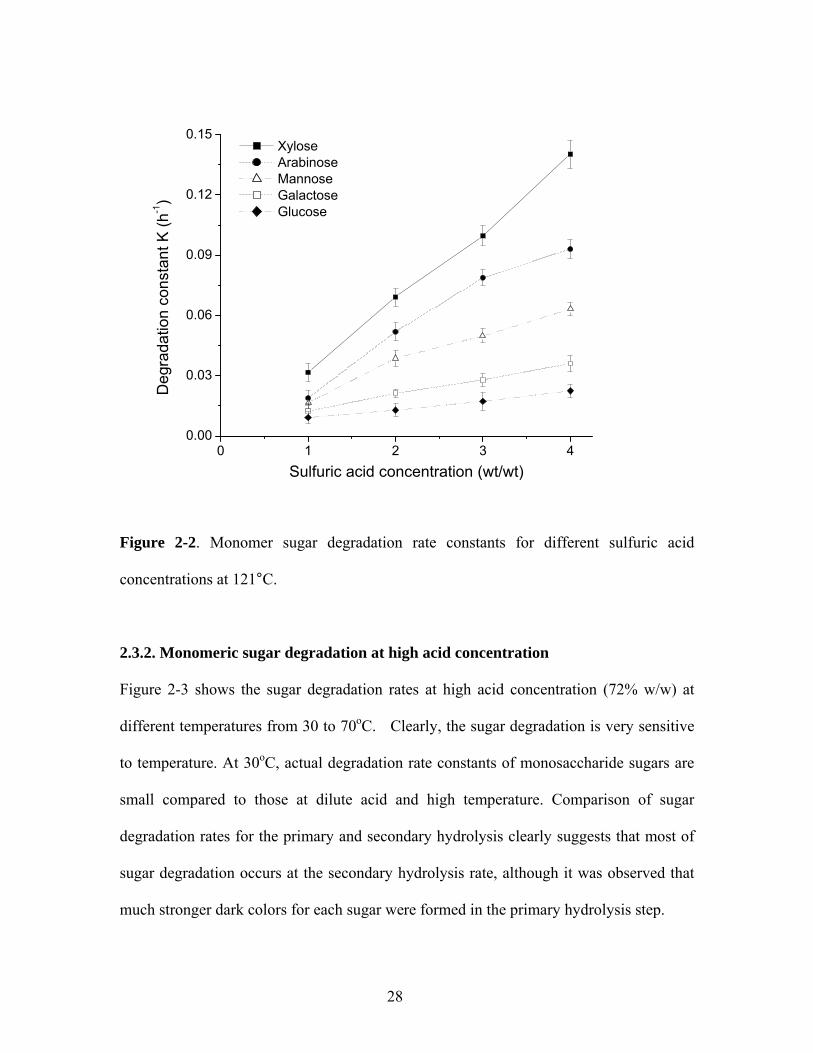
2.3.2. Monomeric sugar degradation at high acid concentration
Figure 2-3 shows the sugar degradation rates at high acid concentration (72% w/w) at
different temperatures from 30 to 70oC. Clearly, the sugar degradation is very sensitive
to temperature. At 30oC, actual degradation rate constants of monosaccharide sugars are
small compared to those at dilute acid and high temperature. Comparison of sugar
degradation rates for the primary and secondary hydrolysis clearly suggests that most of
sugar degradation occurs at the secondary hydrolysis rate, although it was observed that
much stronger dark colors for each sugar were formed in the primary hydrolysis step.
29
30 40 50 60 700.0
0.1
0.2
0.3
0.4
0.5
0.6
Deg
rada
tion
cons
tant
K (h
-1)
Hydrolysis temperature (OC)
Glucose Galactose Mannose Arabinose Xylose
Figure 2-3. Monomer sugar degradation rate at various reaction temperatures in the
presence of 72% sulfuric acid.
In Figure 2-3, data for xylose degradation constant above 50°C and arabinose degradation
constant above 60°C was not able to be collected. During the experiment the xylose and
arabinose degradation products polymerized, at which point it became impossible to
quantitatively transfer all the remaining sugars from the sample vial. This results in a
very high level of error using this data in conjunction with the Arrhenius equation to
calculate the activation energy of xylose and arabinose, since the best fit line is drawn to
only 3 or 4 data points, respectively.
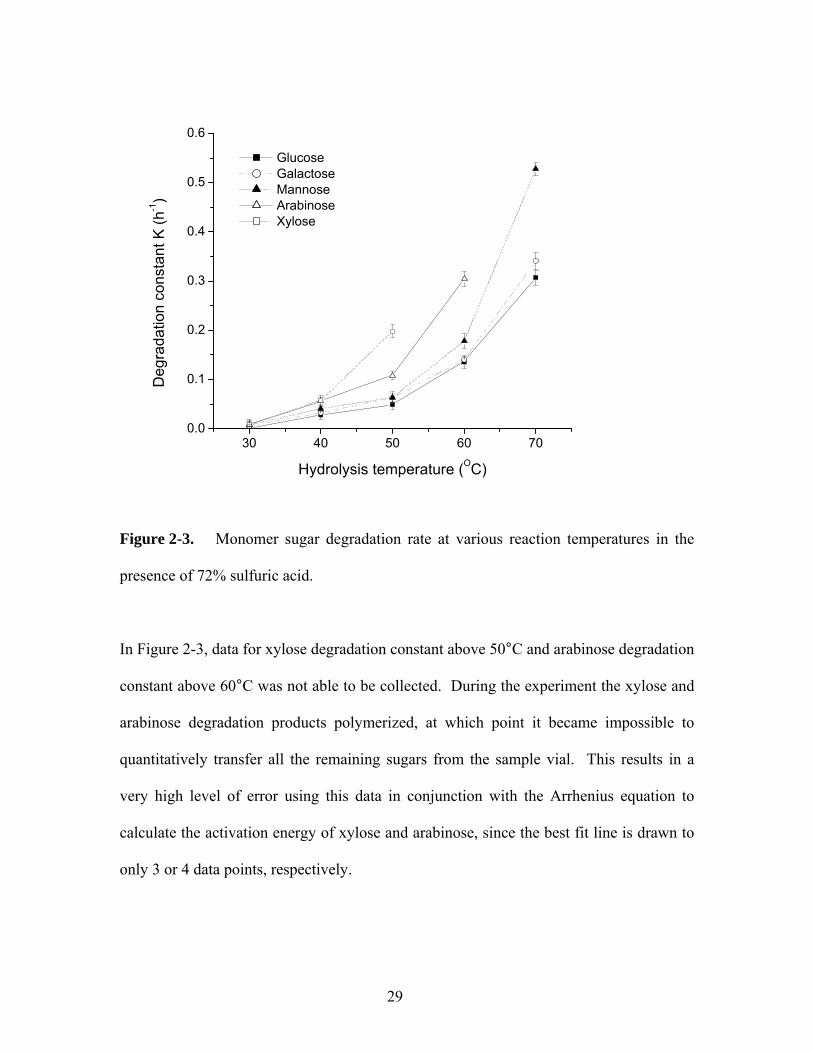
30
The Arrhenius equation is the standard method of quantifying the temperature
dependency of hydrolysis rates given by the form
RTEaekk /0 −= [4]
where,
k = kinetic constant (h-1),
k0 = pre-exponential factor (h-1),
Ea = activation energy (kJ/mol),
R = universal gas constant (kJ/mol/K), and
T = temperature (K).
The measured degradation rate constants were fit to this equation to find the
corresponding activation energy of the monomer sugars, shown in Figure 2-4. From the
linearization attained by plotting the natural log of the degradation rate vs the inverse of
the temperature, a best fit trendline was fitted to each of the curves. The slope of the
trend line was set to the pre-exponential factor, k0, and the activation energy, Ea was
calculated. The measured activation energy of the monomer sugars fit well to previous
literature of sugar degradation in sulfuric acid; measured activation energy of glucose
was 107.13 kJ/gmol where Mosier et al. (2002) measured the activation energy of
glucose to be 118 ± 37.5 kJ/gmol in sulfuric acid. Similarly, the activation energy of
xylose was measured to be 124.63 kJ/gmol, close to the result (134 kJ/mol) of Bhandari
et al. (1984).
31
0.0028 0.0029 0.0030 0.0031 0.0032 0.0033 0.0034
-6
-5
-4
-3
-2
-1
0
ln (k
inet
ic c
onst
ant,
k)
1/Temperature (K-1)
Glucose (Ea = 107.1 kJ/gmol) Galactose (Ea = 89.0 kJ/gmol) Mannose (Ea = 92.3 kJ/gmol) Arabinose (Ea = 103.4 kJ/gmol) Xylose (Ea = 124.6 kJ/gmol)
Figure 2-4 Arrhenius equation with degradation constants measured from strong acid
hydrolysis and calculation of activation energy of monomeric sugars in sulfuric acid.
2.3.3. Oligosaccharide hydrolysis at low acid concentration
Previously, Zhang investigated the effects of acid concentrations (from 1 to 4 % sulfuric
acid) and autoclave time on secondary hydrolysis of cellodextrins (cellooligosaccharides)
and xylooligosaccharides with the degree of polymerization (DP) from 2 to > 10 (data not
shown). For cellodextrins, complete hydrolysis of cellobiose requires at least 2% sulfuric
acid and 60 minutes of autoclave time. Longer cellodextrins, e.g., G10 (DP = 10), which
was prepared as described previously (Zhang and Lynd 2003), required higher acid
concentrations (4% sulfuric acid) for > 40 minutes. Hydrolysis of xylooligosaccharides,
32
whose xylose units are linked by β-1,4-glycosidic acid required modest reaction
conditions. It was found that even very long oligosaccharides were completely
hydrolyzed to monomeric xylose under that condition (1% sulfuric acid and 60 minutes at
121oC).
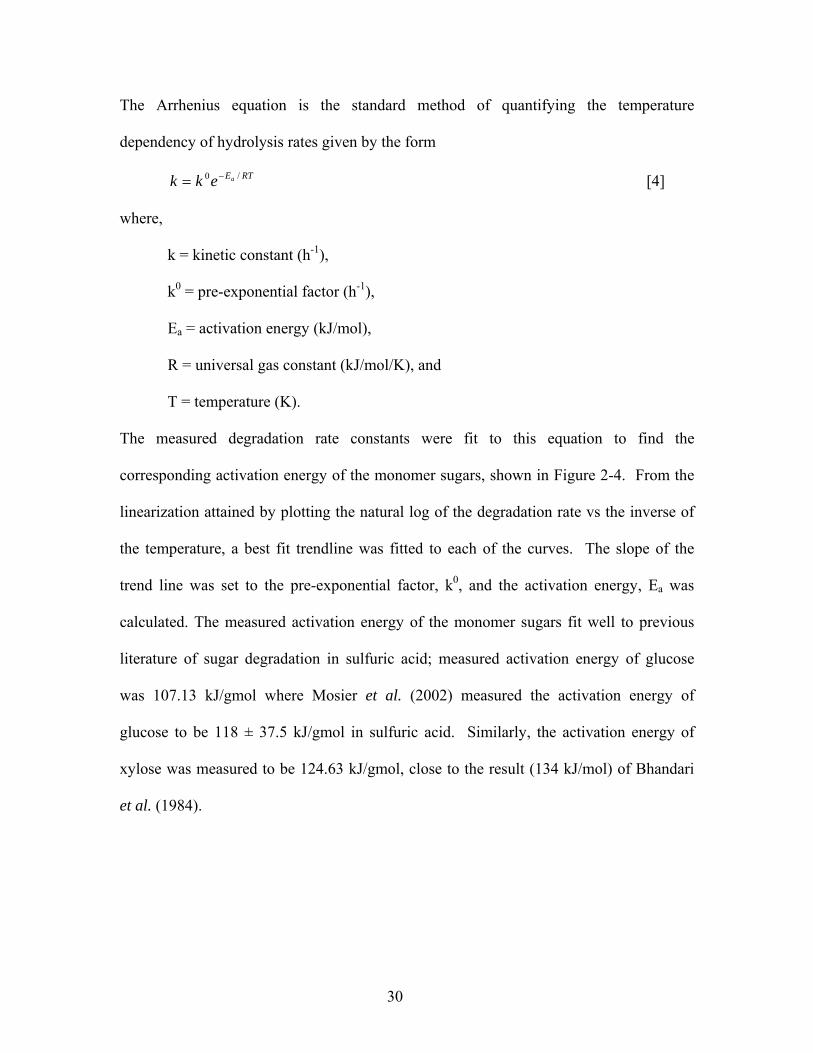
2.3.4. Overall degradation of monomeric sugars
We investigated the reaction condition effects on monomeric sugar degradation as below:
Condition 1 (primary hydrolysis by using 72% sulfuric acid and secondary hydrolysis by
using 4% sulfuric acid),
Condition 2 (only secondary hydrolysis by using 4% sulfuric acid), and
Condition 3 (only secondary hydrolysis by using 1% sulfuric acid).
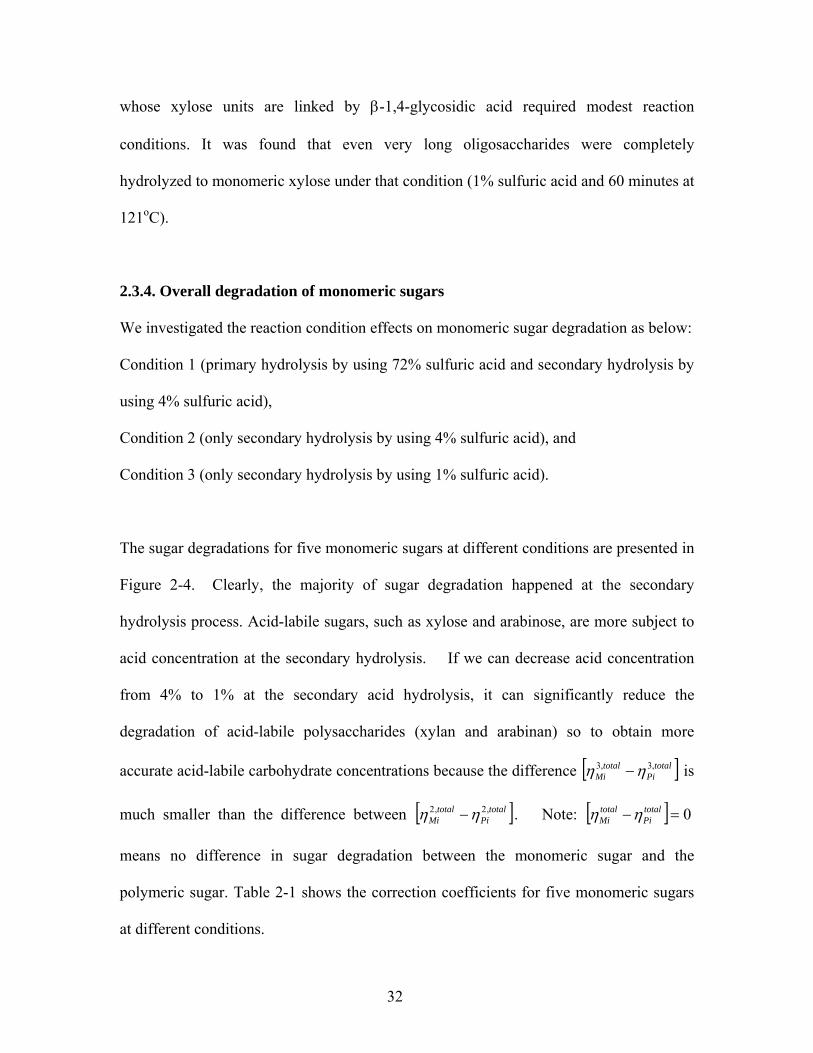
The sugar degradations for five monomeric sugars at different conditions are presented in
Figure 2-4. Clearly, the majority of sugar degradation happened at the secondary
hydrolysis process. Acid-labile sugars, such as xylose and arabinose, are more subject to
acid concentration at the secondary hydrolysis. If we can decrease acid concentration
from 4% to 1% at the secondary acid hydrolysis, it can significantly reduce the
degradation of acid-labile polysaccharides (xylan and arabinan) so to obtain more
accurate acid-labile carbohydrate concentrations because the difference [ ]totalPi
totalMi
,3,3 ηη − is
much smaller than the difference between [ ]totalPi
totalMi
,2,2 ηη − . Note: [ ] 0=− totalPi
totalMi ηη
means no difference in sugar degradation between the monomeric sugar and the
polymeric sugar. Table 2-1 shows the correction coefficients for five monomeric sugars
at different conditions.
33
Condit
ion 1
Condit
ion 2
Condit
ion 3 --
Condit
ion 1
Condit
ion 2
Condit
ion 3 --
Condit
ion 1
Condit
ion 2
Condit
ion 3 --
Condit
ion 1
Condit
ion 2
Condit
ion 3 --
Condit
ion 1
Condit
ion 2
Condit
ion 3 --
0
2
4
6
8
10
12
14
16
18
20
ArabinoseMannoseGalactoseXyloseGlucose
Suga
r deg
rada
tion
(%)
72% H2SO4 4%/1% H2SO4
Degradation (%) = (1 - CHPLC /Cinitinal) x 100%
Figure 2-5. Comparison of monomeric sugar degradation between hydrolysis conditions
in Condition 1, Condition 2, and Condition 3.
34
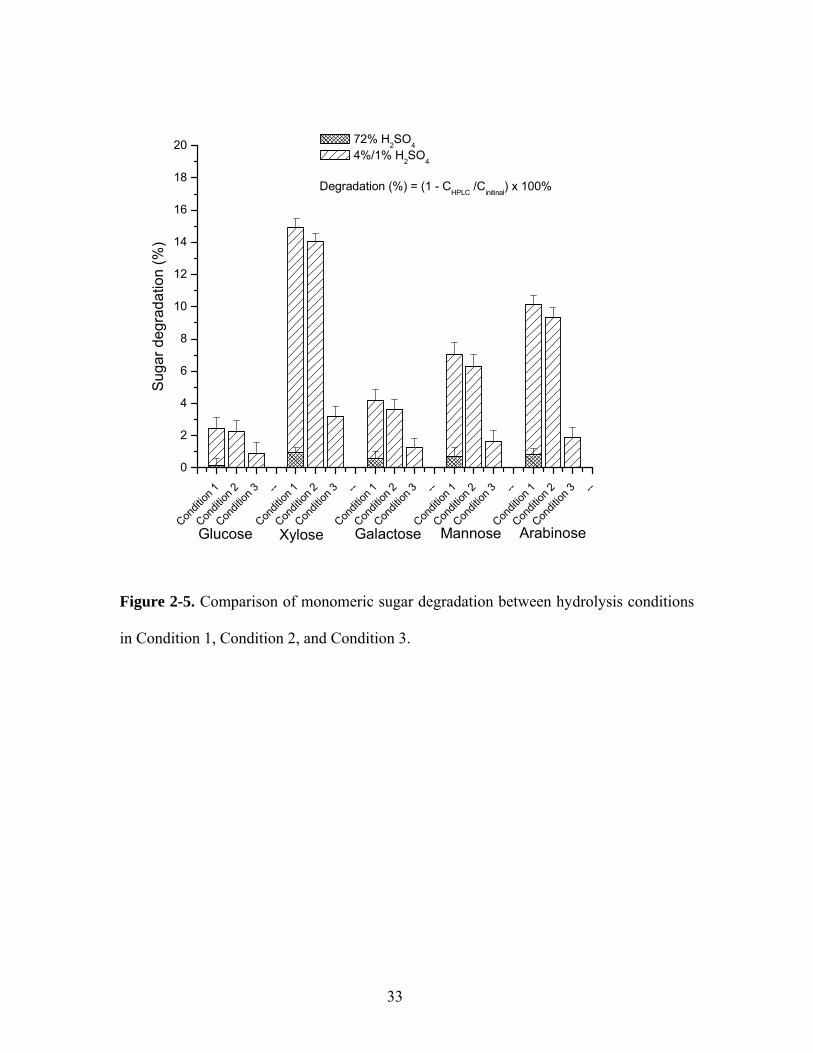
Table 2-1. Comparison of the correction coefficients ( totalMiη ) for various monomeric
sugars at different conditions.
Sugar Condition 1
(72% H2SO4, 2 hours, 30oC;
4% H2SO4, 1 hour, 121oC)
Condition 2
(4% H2SO4, 1
hour, 121oC)
Condition 3
(1% H2SO4, 1
hour, 121oC)
Glucose 0.974 0.978 0.991
Xylose 0.841 0.860 0.963
Galactose 0.953 0.964 0.988
Mannose 0.922 0.937 0.983
Arabinose 0.891 0.907 0.981
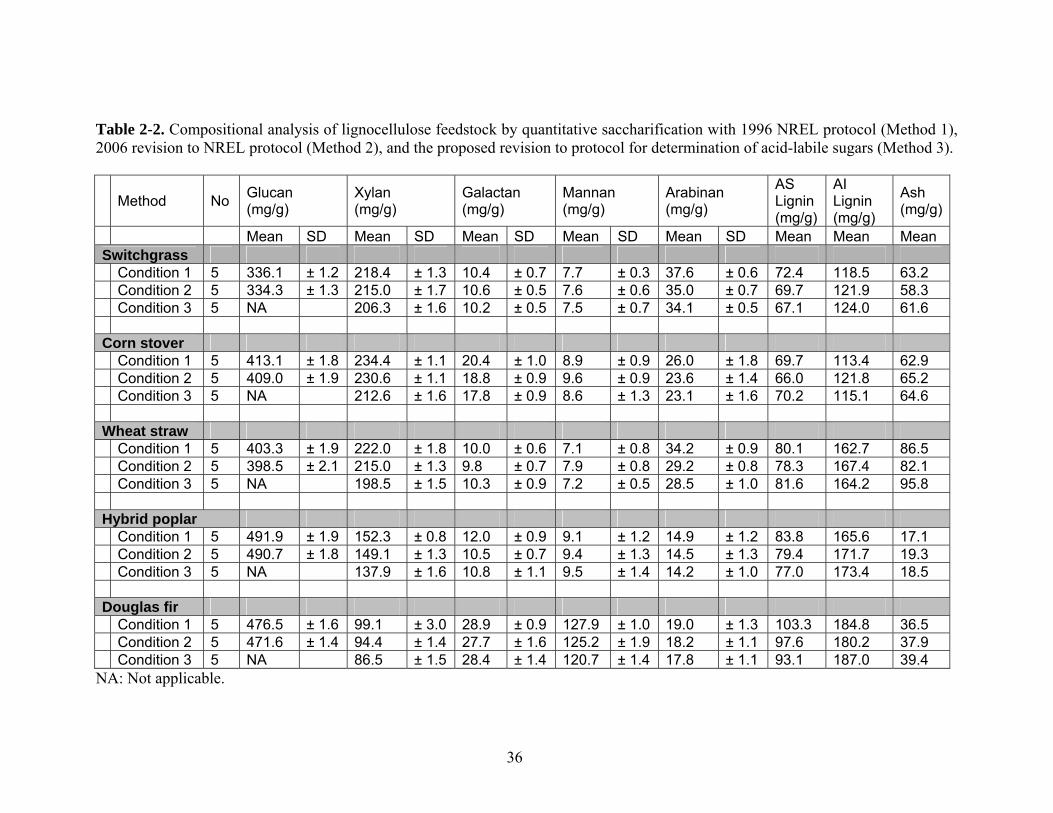
Table 2-2 presents the carbohydrate contents, total acid-soluble (AS) lignin, acid-
insoluble (AI) lignin, and ash for switchgrass, corn stover, poplar, wheat straw, and
Douglas fir. Glucan contents cannot be applicable at 1% H2SO4 hydrolysis because acid
hydrolysis cannot convert all cello-oligo-saccharides to glucose, whereas other
polysaccharides can be converted to monomeric units. Most values of sugar contents
based on Method 1 are a little larger than those based on Method 2, but they are not
significantly different as determined by Tukey-Kramer Honest Significant Difference
shown in Table 2-3. The slightly lower deviated values for all carbohydrates based on
Method 2 are expected because the value of totalMi
,2η is slightly higher than totalMi,1η .
We found more theoretical deviation for all hemicellulose contents based on Condition 3
as compared to those based on Condition 2. As shown in Table 2-3, statistical analysis
clearly indicated that there are significant differences with α = 0.01 level of significance
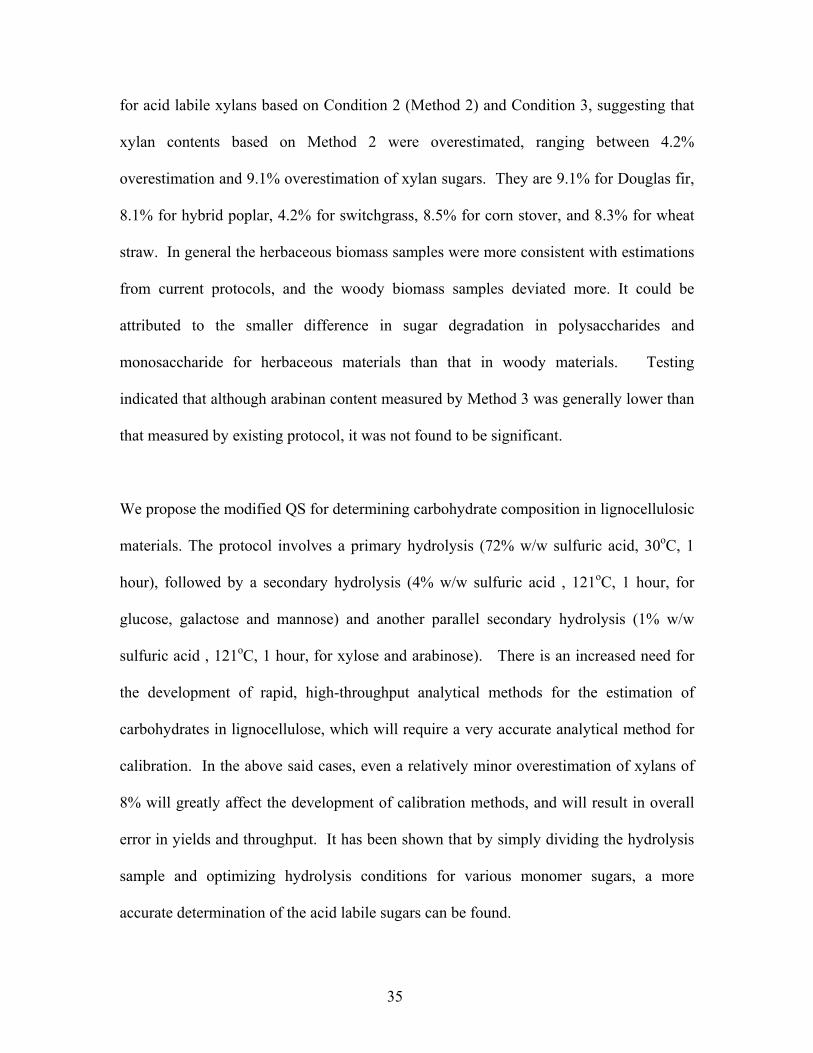
35
for acid labile xylans based on Condition 2 (Method 2) and Condition 3, suggesting that
xylan contents based on Method 2 were overestimated, ranging between 4.2%
overestimation and 9.1% overestimation of xylan sugars. They are 9.1% for Douglas fir,
8.1% for hybrid poplar, 4.2% for switchgrass, 8.5% for corn stover, and 8.3% for wheat
straw. In general the herbaceous biomass samples were more consistent with estimations
from current protocols, and the woody biomass samples deviated more. It could be
attributed to the smaller difference in sugar degradation in polysaccharides and
monosaccharide for herbaceous materials than that in woody materials. Testing
indicated that although arabinan content measured by Method 3 was generally lower than
that measured by existing protocol, it was not found to be significant.
We propose the modified QS for determining carbohydrate composition in lignocellulosic
materials. The protocol involves a primary hydrolysis (72% w/w sulfuric acid, 30oC, 1
hour), followed by a secondary hydrolysis (4% w/w sulfuric acid , 121oC, 1 hour, for
glucose, galactose and mannose) and another parallel secondary hydrolysis (1% w/w
sulfuric acid , 121oC, 1 hour, for xylose and arabinose). There is an increased need for
the development of rapid, high-throughput analytical methods for the estimation of
carbohydrates in lignocellulose, which will require a very accurate analytical method for
calibration. In the above said cases, even a relatively minor overestimation of xylans of
8% will greatly affect the development of calibration methods, and will result in overall
error in yields and throughput. It has been shown that by simply dividing the hydrolysis
sample and optimizing hydrolysis conditions for various monomer sugars, a more
accurate determination of the acid labile sugars can be found.
36
Table 2-2. Compositional analysis of lignocellulose feedstock by quantitative saccharification with 1996 NREL protocol (Method 1), 2006 revision to NREL protocol (Method 2), and the proposed revision to protocol for determination of acid-labile sugars (Method 3).
Method No Glucan (mg/g)
Xylan (mg/g)
Galactan (mg/g)
Mannan (mg/g)
Arabinan (mg/g)
AS Lignin (mg/g)
AI Lignin (mg/g)
Ash (mg/g)
Mean SD Mean SD Mean SD Mean SD Mean SD Mean Mean Mean Switchgrass Condition 1 5 336.1 ± 1.2 218.4 ± 1.3 10.4 ± 0.7 7.7 ± 0.3 37.6 ± 0.6 72.4 118.5 63.2 Condition 2 5 334.3 ± 1.3 215.0 ± 1.7 10.6 ± 0.5 7.6 ± 0.6 35.0 ± 0.7 69.7 121.9 58.3 Condition 3 5 NA 206.3 ± 1.6 10.2 ± 0.5 7.5 ± 0.7 34.1 ± 0.5 67.1 124.0 61.6 Corn stover Condition 1 5 413.1 ± 1.8 234.4 ± 1.1 20.4 ± 1.0 8.9 ± 0.9 26.0 ± 1.8 69.7 113.4 62.9 Condition 2 5 409.0 ± 1.9 230.6 ± 1.1 18.8 ± 0.9 9.6 ± 0.9 23.6 ± 1.4 66.0 121.8 65.2 Condition 3 5 NA 212.6 ± 1.6 17.8 ± 0.9 8.6 ± 1.3 23.1 ± 1.6 70.2 115.1 64.6 Wheat straw Condition 1 5 403.3 ± 1.9 222.0 ± 1.8 10.0 ± 0.6 7.1 ± 0.8 34.2 ± 0.9 80.1 162.7 86.5 Condition 2 5 398.5 ± 2.1 215.0 ± 1.3 9.8 ± 0.7 7.9 ± 0.8 29.2 ± 0.8 78.3 167.4 82.1 Condition 3 5 NA 198.5 ± 1.5 10.3 ± 0.9 7.2 ± 0.5 28.5 ± 1.0 81.6 164.2 95.8 Hybrid poplar Condition 1 5 491.9 ± 1.9 152.3 ± 0.8 12.0 ± 0.9 9.1 ± 1.2 14.9 ± 1.2 83.8 165.6 17.1 Condition 2 5 490.7 ± 1.8 149.1 ± 1.3 10.5 ± 0.7 9.4 ± 1.3 14.5 ± 1.3 79.4 171.7 19.3 Condition 3 5 NA 137.9 ± 1.6 10.8 ± 1.1 9.5 ± 1.4 14.2 ± 1.0 77.0 173.4 18.5 Douglas fir Condition 1 5 476.5 ± 1.6 99.1 ± 3.0 28.9 ± 0.9 127.9 ± 1.0 19.0 ± 1.3 103.3 184.8 36.5 Condition 2 5 471.6 ± 1.4 94.4 ± 1.4 27.7 ± 1.6 125.2 ± 1.9 18.2 ± 1.1 97.6 180.2 37.9 Condition 3 5 NA 86.5 ± 1.5 28.4 ± 1.4 120.7 ± 1.4 17.8 ± 1.1 93.1 187.0 39.4
NA: Not applicable.
37
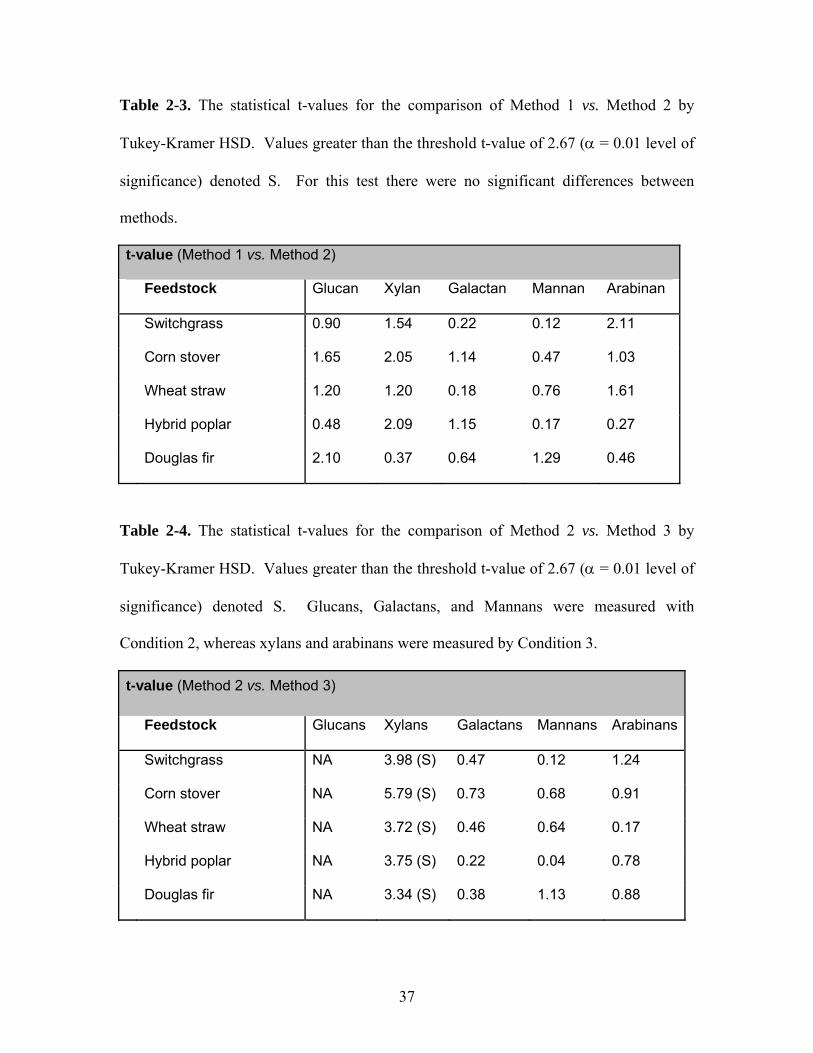
Table 2-3. The statistical t-values for the comparison of Method 1 vs. Method 2 by
Tukey-Kramer HSD. Values greater than the threshold t-value of 2.67 (α = 0.01 level of
significance) denoted S. For this test there were no significant differences between
methods.
t-value (Method 1 vs. Method 2)
Feedstock Glucan Xylan Galactan Mannan Arabinan
Switchgrass 0.90 1.54 0.22 0.12 2.11
Corn stover 1.65 2.05 1.14 0.47 1.03
Wheat straw 1.20 1.20 0.18 0.76 1.61
Hybrid poplar 0.48 2.09 1.15 0.17 0.27
Douglas fir 2.10 0.37 0.64 1.29 0.46
Table 2-4. The statistical t-values for the comparison of Method 2 vs. Method 3 by
Tukey-Kramer HSD. Values greater than the threshold t-value of 2.67 (α = 0.01 level of
significance) denoted S. Glucans, Galactans, and Mannans were measured with
Condition 2, whereas xylans and arabinans were measured by Condition 3.
t-value (Method 2 vs. Method 3)
Feedstock Glucans Xylans Galactans Mannans Arabinans
Switchgrass NA 3.98 (S) 0.47 0.12 1.24
Corn stover NA 5.79 (S) 0.73 0.68 0.91
Wheat straw NA 3.72 (S) 0.46 0.64 0.17
Hybrid poplar NA 3.75 (S) 0.22 0.04 0.78
Douglas fir NA 3.34 (S) 0.38 1.13 0.88
38
2.4 CONCLUSIONS
Current NREL 2006 laboratory procedure for determination of structural carbohydrates in
lignocellulose leads to an over-estimate acid-labile sugar (xylan) concentration due to
differences in sugar degradation rates between polysaccharides and monosaccharides. A
more accurate determination of degradation of both the polysaccharide and
monosaccharide can be realized using milder reaction conditions for the acid-labile
sugars, i.e., xylans, while still completely hydrolyzing xylan oligosaccharides to xylose
and decreasing the formation of sugar degradation products, such as furfural. The
proposed changes to the weak acid hydrolysis procedure add only a small amount of
complication to testing, but these changes can significantly improve accuracy of xylose
content determination.
39
3. EVALUATION OF LIGNOCELLULOSE FRACTIONATION
APPLICABLE TO INDUSTRIAL HEMP HURDS
Abstract
Industrial hemp is a valuable plant for its fiber and oil. The hurds are a cellulose-
containing residue that is not fully utilized. Here we evaluate the feasibility of
lignocellulose fractionation applicable to the hurds of industrial hemp. After optimizing
acid concentration, reaction time, and temperature, the pretreated cellulosic samples were
hydrolyzed more than 96% after 24 hours of hydrolysis (enzyme loading conditions of 15
FPU/g glucan Spezyme CP, 60 IU/g glucan Novozyme 188) at an optimal pretreatment
condition (> 84% H3PO4, > 50 °C, and > 1 hour). The overall glucose and xylose yields
were 89% (94% pretreatment; 96% digestibility) and 61%, respectively. All data suggest
the technical feasibility of building a biorefinery based on the feedstock, the hurds of
industrial hemp, and lignocellulose fractionation for producing cellulosic ethanol because
of high sugar yields, low processing costs, nearly free feedstock, and low capital
investment. In addition, we must emphasize the opportunities to produce other higher-
value products, such as lactic acid and acetic acid, via fermentation starting with glucose.
3.1 INTRODUCTION
Effective release of the carbohydrates in lignocellulose is one of the major hurdles in
profitable cellulosic ethanol production. As discussed in Chapter 1, there are several
methods overcoming the recalcitrance of cellulose to utilize the carbohydrates for
hydrolysis and fermentation into ethanol. All lignocellulose conversion technologies
40
utilize a pretreatment process in preparation for enzymatic digestion. The aim of this
research is to evaluate the feasibility of applying lignocellulose fractionation technology,
developed at Virginia Tech (Zhang et al. 2007b), to the hurds of industrial hemp and
characterize the effects of pretreatment reaction conditions on the hydrolysis of cellulose
(i.e., sugar yields for ethanol fermentation).
The hemp plant is grown for its fibers, seed, seed meal, and seed oil. Hemp is a distinct
variety of the plant species Cannabis sativa. Hemp is different from the narcotic drug
marijuana, as hemp contains virtually no delta-9 tetrahydrocannabinol, which is the
active ingredient in marijuana. The primary value product of industrial hemp is fibers
that are present around the hollow, woody core of the hemp stalk. These long, strong
fibers, which grow the length of the hemp stalk, are considered bast fibers. Hemp fiber
possesses properties similar to other bast fibers (flax, kenaf, jute, and ramie) and excels in
fiber length, strength, durability, absorbency, anti-mildew, and anti-microbial properties.
Hemp oil from the seed is the richest known source of polyunsaturated essential fatty
acids (81% vol/vol), including gamma linoleic acid (GLA). Core fibers (hurds) are
derived from the sturdy, wood-like hollow stalk of the hemp plant. It is usually regarded
as a waste although it has some applications, such as animal bedding, garden mulch, or a
component for light-weight concrete or plaster.
Bioethanol is anticipated to replace a significant fraction of gasoline. This replacement
will increase national energy security, improve the rural economy, and decrease
environmental pollution (Zhang and Lynd 2004). Lignocellulosic biomass is the most
abundant feedstock source for fermentable sugars that will be used to produce most
41
ethanol. Current cellulosic ethanol production costs cannot compete with that from corn
grain because of great capital investment, high processing costs, and low revenues from
the sole cellulosic ethanol (Zhang et al. 2006b). Production of cellulosic ethanol from the
hurds of industrial hemp will be very promising because of the removal of cellulosic
wastes, the generation of more revenues, and the reduction of greenhouse gas emissions.
Integration of a cellulosic bioethanol biorefinery with current industrial hemp factories
will provide the following benefits: securing a low-cost feedstock for cellulosic ethanol
production and a significant savings in feedstock collection and transportation (e.g., $50-
$60/Mg of biomass). The hurds of industrial hemp contain a moderately high glucan and
xylan content (~38 % glucan, ~23% xylan), and low lignin content (~10.4% lignin)
(Table 3.1), but a routine pretreatment such as steam explosion cannot efficiently break
up its recalcitrant structure.
3.2 METHODS AND MATERIALS
Chemicals and Materials. All chemicals were reagent grade and purchased from
Sigma-Aldrich (St. Louis, MO) or Fisher Scientific (Atlanta, GA), unless otherwise
noted. Industrial hemp stalks were provided by The Equator Group (Johor, Malaysia),
and these stalks were then stripped of fiber to retain only the hurds. The hurds were
knife-milled and screened and are hereafter referred to as “lignocellulosic material”. The
lignocellulose particles smaller than 40 mesh screen and larger than 60 mesh screen were
used for fractionation. The lignocellulose was dried in a convection oven at 105 ± 3 °C
for 4 hours or longer until a constant weight was achieved. The samples were then
removed from the oven and allowed to cool to room temperature in a desiccator.
42
The structural composition of industrial hemp stalks (C. sativa) was determined based on
the NREL protocol “LAP-002 Determination of Structural Carbohydrates and Lignin in
Biomass” (Sluiter et al. 2006). The procedure for determination of structural
carbohydrates involves a two-step acid hydrolysis to convert polymeric sugars to
monomeric sugars, which can be detected by HPLC. Lignin can be divided into an acid-
soluble and an acid-insoluble form. The acid-soluble lignin is measured by UV-Vis
spectroscopy, and the acid-insoluble material by gravimetric analysis.
A nominal amount of 1.0 g of dry industrial hemp hurds sample was weighted into a 50
mL sample vial. This sample would then undergo fractionation by various acid
concentrations, reaction time, and temperature. After samples were treated with a
fractionation pretreatment, 30 mL of acetone was added to each sample to precipitate
amorphous cellulose in the sample. Each sample was vortexed or inversely shaken to
ensure adequate mixing. After mixing, samples were centrifuged at 3600 RPM for 5
minutes. The supernatant was decanted from the samples and 2 additional acetone
washes preformed on the samples in a manner identical to the previous. After the acetone
wash, 30 mL of room temperature deionized water was added to each sample as a
secondary wash procedure. Samples were once again centrifuged at 3600 RPM for 5
minutes, and the supernatant decanted from the sample. Hemicellulose is soluble in
water, and the temperature of the deionized water may affect solubility of those sugars.
Care was taken to use water at the same temperature for each wash procedure, but the
effect of the water temperature was not examined at this point. After 3 deionized water
43
washes, the pH of the samples was tested with litmus paper to ensure that the pH of the
samples was near 6.
Of the pretreated samples, one replicate was freeze dried overnight and put through
quantitative saccharification to determine sugar content of the pretreated sample. Some
sugar will be lost from the sample during the wash procedure and we wanted to quantify
this loss. The remaining samples were prepared for enzymatic hydrolysis. Samples were
prepared to a glucan concentration of 10 g/L. Glucan concentration of the samples was
determined by quantitative saccharification. 1 M citrate buffer (pH = 4.5) was added to
the sample so that the buffer would be diluted to 0.05 M. 0.5 mL of enzyme solution was
added to the sample at a loading of 15 FPU for Spezyme CP and 60 IU for Novozyme
188. The samples were hydrolyzed at 50 °C for a total of 72 hours. Samples were taken
from the hydrolysis liquor at 1, 2, 4, 8, 12, 24, 48, and 72 hours by pipetting out 800 μL
of sample and immediately centrifuging the sample at 10,000 RPM for 5 minutes. After
centrifuging, 500 mL of supernatant was decanted and allowed to sit at room temperature
for 10 minutes to allow all remaining cellobiose to convert to glucose. The sample was
then mixed with 30 μL of 10% sulfuric acid, and filtered though a 0.20 μm filter to
prepare the sample for HPLC analysis. After 72 h of hydrolysis, the remaining
hydrolysate was transferred to a 50 mL sample vial and 10 mL of deionized water added
to the sample. The sample was centrifuged at 3600 RPM for 5 minutes, and the
supernatant decanted. The sample was then washed with an additional 20 mL of
deionized water, and centrifuged. The remaining solid particle matter was freeze dried,
and then analyzed by quantitative saccharification.
44
The glucose samples from hydrolysis were analyzed by HPLC for sugars on an Aminex-
87H chromatography column with de-ashing guard column. Samples were analyzed
using 0.01 M sulfuric acid as a mobile phase at a flow rate of 0.6 mL per minute and a
column temperature of 65°C (Zhang et al. 2007b; Zhang et al. 2007c).
Glucan digestibility was calculated by the ratio of the soluble glucose equivalent in the
supernatant after hydrolysis to the sum of the soluble glucose and the residual insoluble
glucose equivalent ( QSQSgr VSG *,= ) in the solid phase after hydrolysis,
%100**
*
,,
, ×+
=QSQSgHHg
HHg
VSVSVS
X [5]
Where,
Gr, amount of glucose equivalent in the residual solid phase (g GE),
Sg,QS, glucose concentration in the quantitative saccharification solution for the
residual solid samples after hydrolysis (g/L), and
VQS, the volume of the quantitative saccharification solution (L, e.g., 0.087 L)
(Sluiter et al. 2006).
3.3 RESULTS
The experiments were conducted in two separate steps – 1) lignocellulose fractionation
by sequentially using cellulose solvent, organic solvent, and water, and 2) enzymatic
cellulose hydrolysis, which release glucose from the pretreated biomass, so that the
efficiency of the pretreatment can be evaluated.
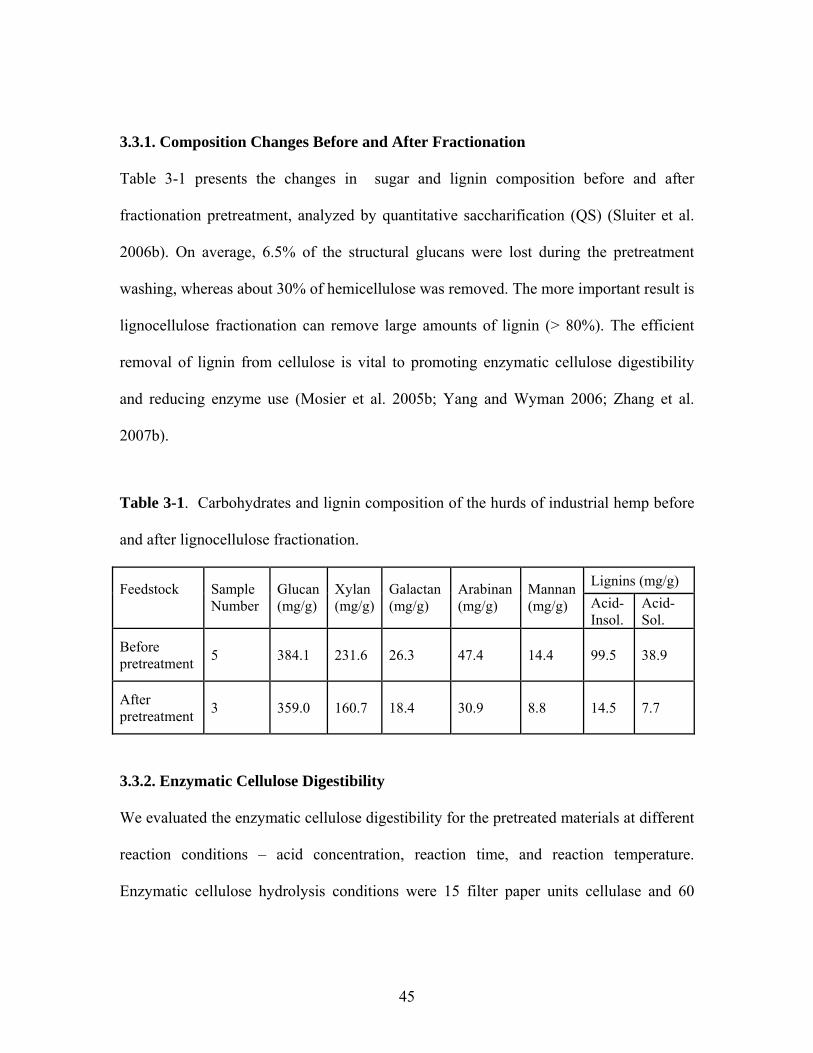
45
3.3.1. Composition Changes Before and After Fractionation
Table 3-1 presents the changes in sugar and lignin composition before and after
fractionation pretreatment, analyzed by quantitative saccharification (QS) (Sluiter et al.
2006b). On average, 6.5% of the structural glucans were lost during the pretreatment
washing, whereas about 30% of hemicellulose was removed. The more important result is
lignocellulose fractionation can remove large amounts of lignin (> 80%). The efficient
removal of lignin from cellulose is vital to promoting enzymatic cellulose digestibility
and reducing enzyme use (Mosier et al. 2005b; Yang and Wyman 2006; Zhang et al.
2007b).
Table 3-1. Carbohydrates and lignin composition of the hurds of industrial hemp before
and after lignocellulose fractionation.
Lignins (mg/g) Feedstock
Sample Number
Glucan (mg/g)
Xylan (mg/g)
Galactan (mg/g)
Arabinan (mg/g)
Mannan (mg/g) Acid-
Insol. Acid-Sol.
Before pretreatment 5 384.1 231.6 26.3 47.4 14.4 99.5 38.9
After pretreatment 3 359.0 160.7 18.4 30.9 8.8 14.5 7.7
3.3.2. Enzymatic Cellulose Digestibility
We evaluated the enzymatic cellulose digestibility for the pretreated materials at different
reaction conditions – acid concentration, reaction time, and reaction temperature.
Enzymatic cellulose hydrolysis conditions were 15 filter paper units cellulase and 60
46
international units of beta-glucosidase per gram of glucan at 50oC in 50 mM citric acid
buffer (pH 4.8). The released glucose in the supernatant was measured by HPLC.
Acid Concentration Effects
Figure 3-1 presents the effect of phosphoric acid concentrations (81%, 84%, and 85.9%)
on cellulose digestibility for the pretreated lignocellulose. Our previous results suggested
that high phosphoric acid concentration was important to disrupt the linkage among
cellulose, hemicellulose, and lignin as well as dissolve cellulose completely (Zhang et al.
2006a; Zhang et al. 2007b). Both samples pretreated by 84.0% and 85.9% phosphoric
acid were hydrolyzed to achieve a maximum 94 % digestibility whereas the samples
treated by lower acid concentration had a lower digestibility of 91.2%. The crucial acid
concentration was approximately 84.0%.
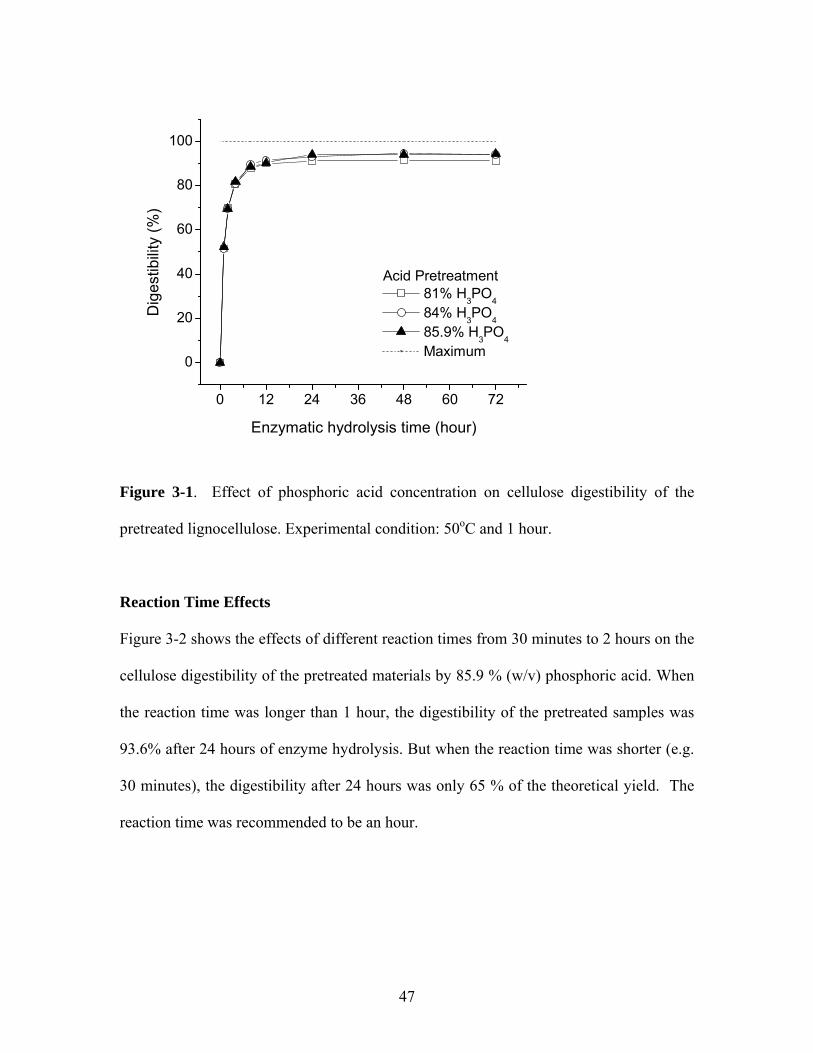
47
0 12 24 36 48 60 72
0
20
40
60
80
100D
iges
tibili
ty (%
)
Enzymatic hydrolysis time (hour)
Acid Pretreatment 81% H3PO4 84% H3PO4 85.9% H3PO4 Maximum
Figure 3-1. Effect of phosphoric acid concentration on cellulose digestibility of the
pretreated lignocellulose. Experimental condition: 50oC and 1 hour.
Reaction Time Effects
Figure 3-2 shows the effects of different reaction times from 30 minutes to 2 hours on the
cellulose digestibility of the pretreated materials by 85.9 % (w/v) phosphoric acid. When
the reaction time was longer than 1 hour, the digestibility of the pretreated samples was
93.6% after 24 hours of enzyme hydrolysis. But when the reaction time was shorter (e.g.
30 minutes), the digestibility after 24 hours was only 65 % of the theoretical yield. The
reaction time was recommended to be an hour.
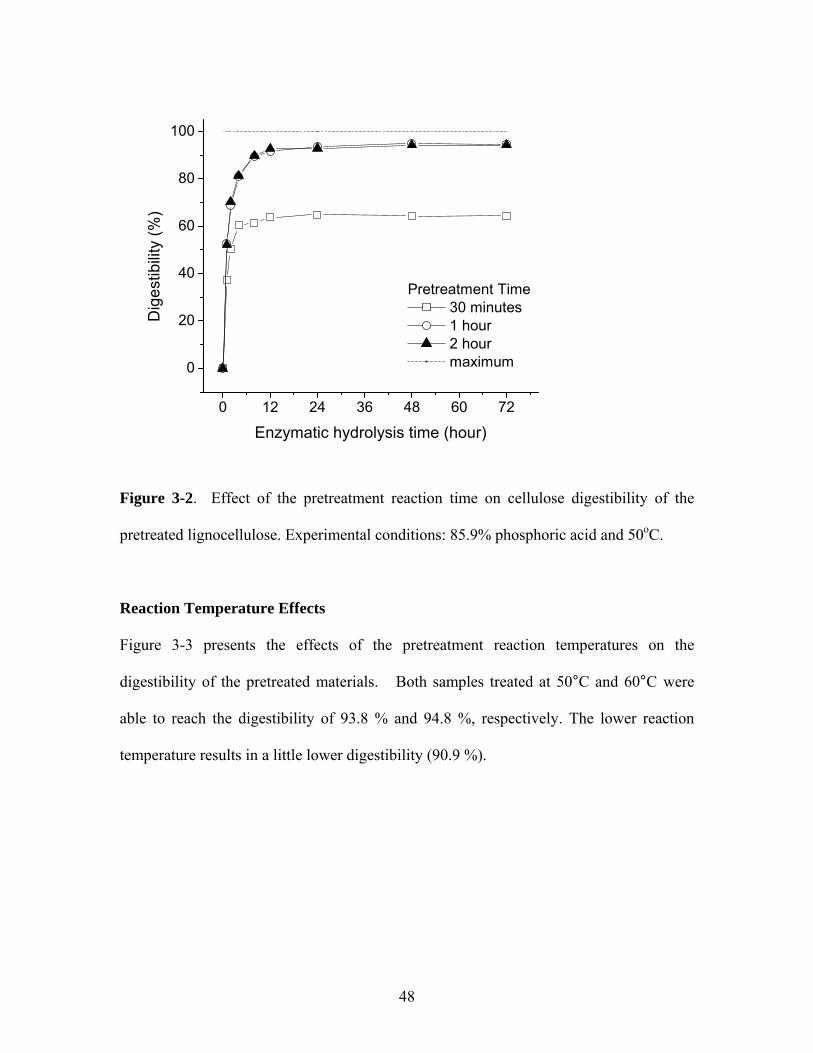
48
0 12 24 36 48 60 72
0
20
40
60
80
100D
iges
tibili
ty (%
)
Enzymatic hydrolysis time (hour)
Pretreatment Time 30 minutes 1 hour 2 hour maximum
Figure 3-2. Effect of the pretreatment reaction time on cellulose digestibility of the
pretreated lignocellulose. Experimental conditions: 85.9% phosphoric acid and 50oC.
Reaction Temperature Effects
Figure 3-3 presents the effects of the pretreatment reaction temperatures on the
digestibility of the pretreated materials. Both samples treated at 50°C and 60°C were
able to reach the digestibility of 93.8 % and 94.8 %, respectively. The lower reaction
temperature results in a little lower digestibility (90.9 %).
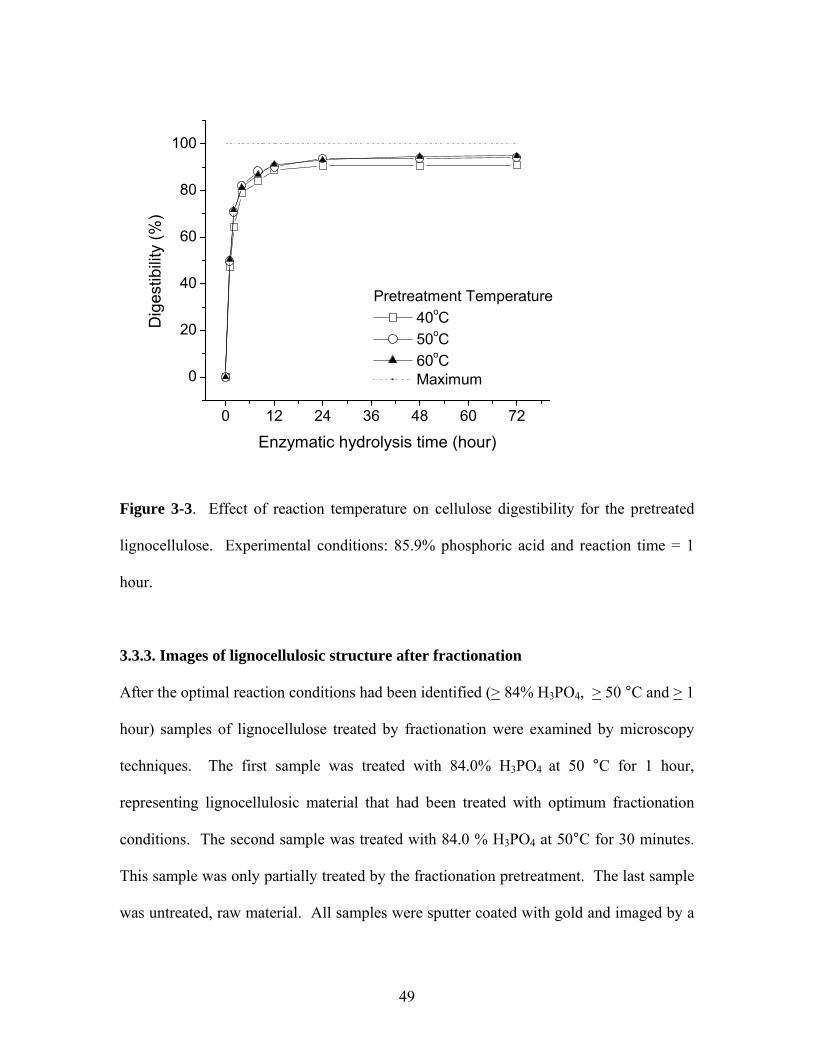
49
0 12 24 36 48 60 72
0
20
40
60
80
100D
iges
tibili
ty (%
)
Enzymatic hydrolysis time (hour)
Pretreatment Temperature 40oC 50oC 60oC Maximum
Figure 3-3. Effect of reaction temperature on cellulose digestibility for the pretreated
lignocellulose. Experimental conditions: 85.9% phosphoric acid and reaction time = 1
hour.
3.3.3. Images of lignocellulosic structure after fractionation
After the optimal reaction conditions had been identified (> 84% H3PO4, > 50 °C and > 1
hour) samples of lignocellulose treated by fractionation were examined by microscopy
techniques. The first sample was treated with 84.0% H3PO4 at 50 °C for 1 hour,
representing lignocellulosic material that had been treated with optimum fractionation
conditions. The second sample was treated with 84.0 % H3PO4 at 50°C for 30 minutes.
This sample was only partially treated by the fractionation pretreatment. The last sample
was untreated, raw material. All samples were sputter coated with gold and imaged by a
50
Scanning Electron Microscope (SEM) at the Virginia-Maryland Regional College of
Veterinary Medicine at the Virginia Tech main campus (Blacksburg, VA). The first
column of Figure 3-4 are images of the untreated raw lignocellulosic material. SEM
images clearly show the fibrous structure of the material. The second column of Figure
3-4, representing modestly-treated materials, illustrates that the overall structure of the
lignocellulose cellulose is broken and large holes appear -- signs of partial disruption.
The last column, representing well-treated lignocellulose samples, shows that the fibrous
structure of the lignocellulose is completely disrupted. A comparison of the
lignocellulose surface shows that the structures of the lignocellulose samples are
drastically changed during the fractionation processes, depending on pretreatment
severity. Crystalline cellulose microfibrils are disrupted, and a significant amount of
hemicellulose is removed from the surface of the cellulose strands.
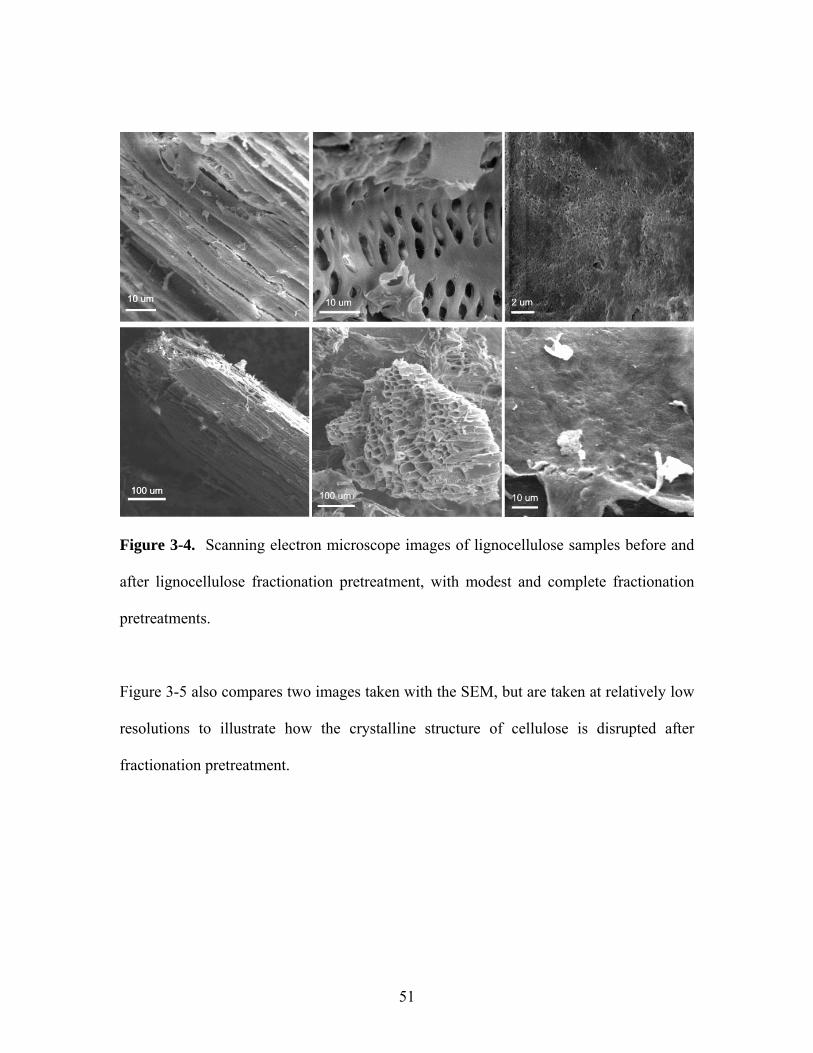
51
Figure 3-4. Scanning electron microscope images of lignocellulose samples before and
after lignocellulose fractionation pretreatment, with modest and complete fractionation
pretreatments.
Figure 3-5 also compares two images taken with the SEM, but are taken at relatively low
resolutions to illustrate how the crystalline structure of cellulose is disrupted after
fractionation pretreatment.
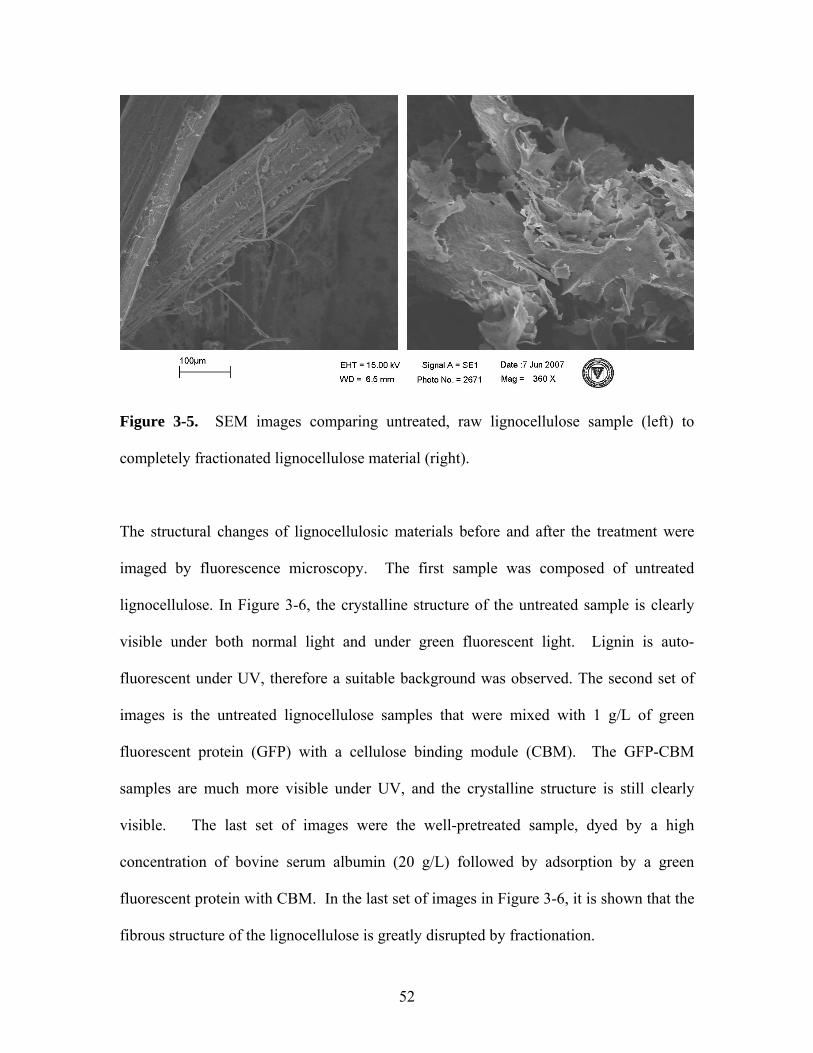
52
Figure 3-5. SEM images comparing untreated, raw lignocellulose sample (left) to
completely fractionated lignocellulose material (right).
The structural changes of lignocellulosic materials before and after the treatment were
imaged by fluorescence microscopy. The first sample was composed of untreated
lignocellulose. In Figure 3-6, the crystalline structure of the untreated sample is clearly
visible under both normal light and under green fluorescent light. Lignin is auto-
fluorescent under UV, therefore a suitable background was observed. The second set of
images is the untreated lignocellulose samples that were mixed with 1 g/L of green
fluorescent protein (GFP) with a cellulose binding module (CBM). The GFP-CBM
samples are much more visible under UV, and the crystalline structure is still clearly
visible. The last set of images were the well-pretreated sample, dyed by a high
concentration of bovine serum albumin (20 g/L) followed by adsorption by a green
fluorescent protein with CBM. In the last set of images in Figure 3-6, it is shown that the
fibrous structure of the lignocellulose is greatly disrupted by fractionation.
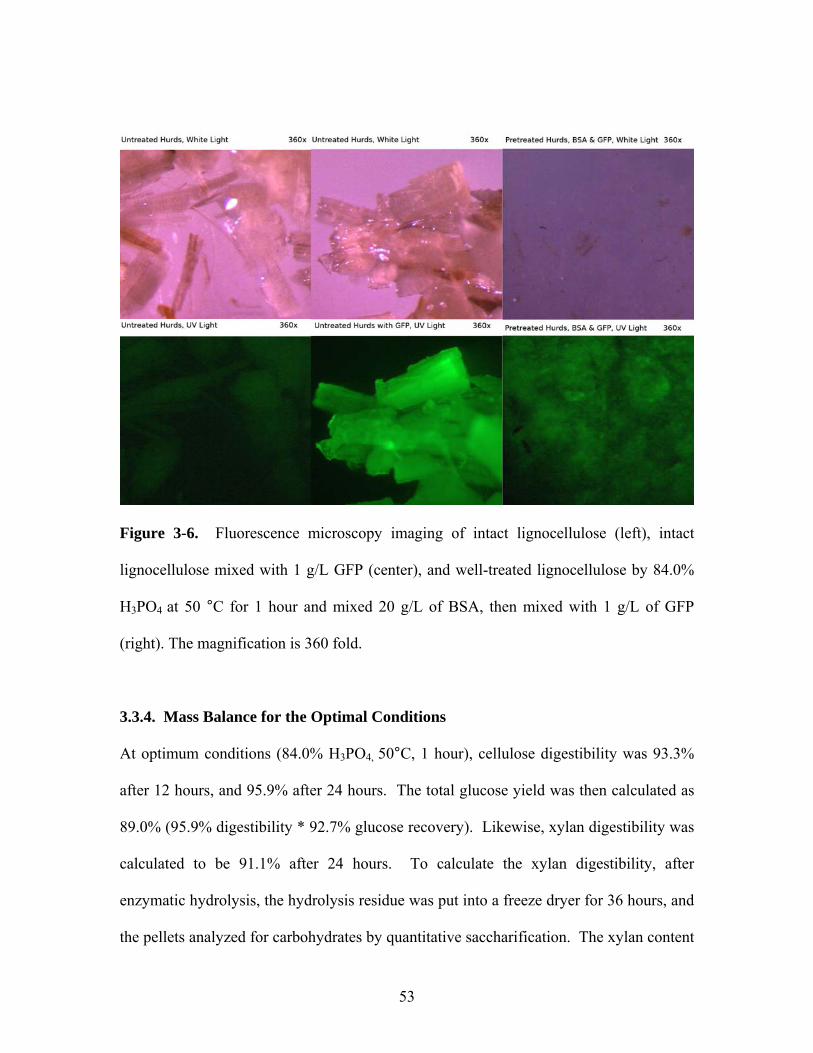
53
Figure 3-6. Fluorescence microscopy imaging of intact lignocellulose (left), intact
lignocellulose mixed with 1 g/L GFP (center), and well-treated lignocellulose by 84.0%
H3PO4 at 50 °C for 1 hour and mixed 20 g/L of BSA, then mixed with 1 g/L of GFP
(right). The magnification is 360 fold.
3.3.4. Mass Balance for the Optimal Conditions
At optimum conditions (84.0% H3PO4, 50°C, 1 hour), cellulose digestibility was 93.3%
after 12 hours, and 95.9% after 24 hours. The total glucose yield was then calculated as
89.0% (95.9% digestibility * 92.7% glucose recovery). Likewise, xylan digestibility was
calculated to be 91.1% after 24 hours. To calculate the xylan digestibility, after
enzymatic hydrolysis, the hydrolysis residue was put into a freeze dryer for 36 hours, and
the pellets analyzed for carbohydrates by quantitative saccharification. The xylan content

54
found in the pellets was subtracted from the initial xylan content in the pretreated sample
to estimate the digestibility of the xylan. The mass balance of carbohydrate and lignin at
the optimal conditions is presented in Figure 3-7.
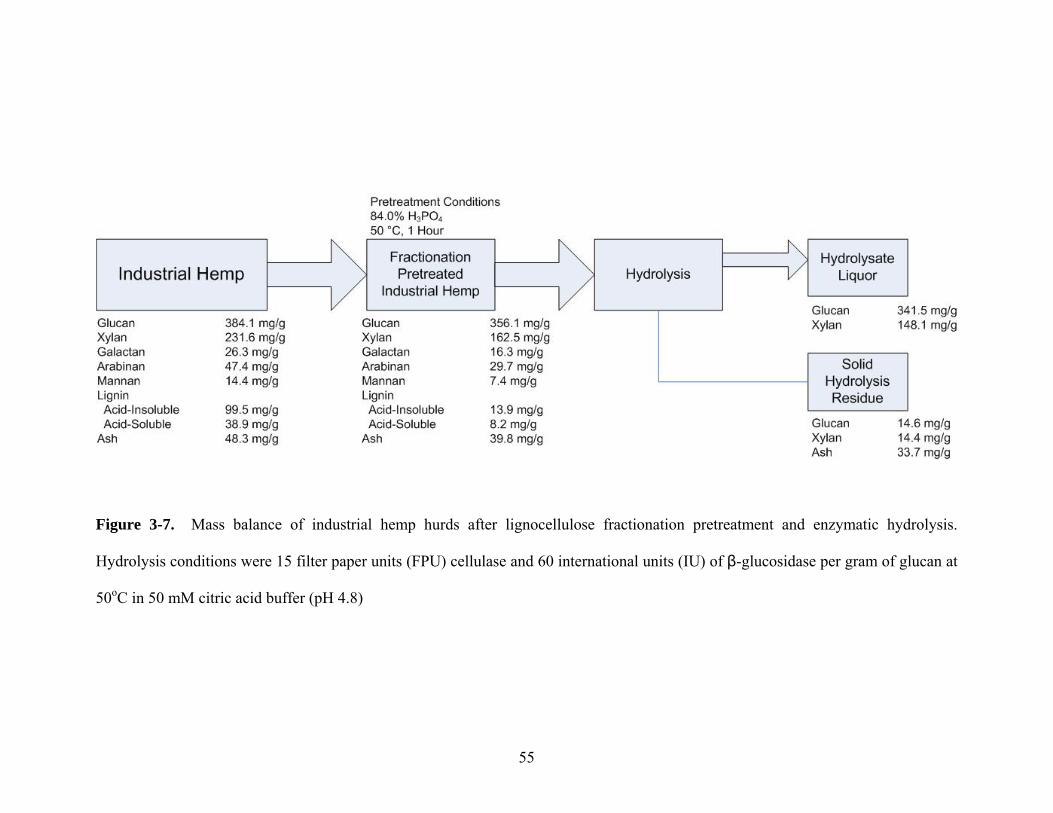
55
Figure 3-7. Mass balance of industrial hemp hurds after lignocellulose fractionation pretreatment and enzymatic hydrolysis.
Hydrolysis conditions were 15 filter paper units (FPU) cellulase and 60 international units (IU) of β-glucosidase per gram of glucan at
50oC in 50 mM citric acid buffer (pH 4.8)
56
3.4 CONCLUSIONS
Lignocellulose fractionation can effectively treat the recalcitrant hurds of industrial hemp.
The glucose and xylose yields were 89% (94% pretreatment; 94.7, digestibility) and 61%,
respectively, at an optimal pretreatment conditions are > 84% H3PO4, > 50 °C and > 1 hour.
In addition to cellulosic ethanol production, to the developed procedure will produce other
products with higher selling prices such as lactic acid, acetic acid. Building a small size
biorefinery based on lignocellulose fractionation technology and using the hurds of industrial
hemp as a feedstock is promising because of high sugar yields, low processing costs, low-
cost feedstock, and low capital investment.
57
REFERENCES
Ahring BK, Jensen K, Nielsen P, Bjerre AB, Schmidt AS. 1996. Pretreatment of wheat straw
and conversion of xylose and xylan to ethanol by thermophilic anaerobic bacteria.
Biores. Technol. 58:107-113.
Akin DE, Rigsby LL, Sethuraman A, Morrison WHr, Gamble GR, Eriksson KE. 1995.
Alterations in structure, chemistry, and biodegradability of grass lignocellulose
treated with the white rot fungi Ceriporiopsis subvermispora and Cyathus stercoreus.
Appl. Environ. Microbiol. 61:1591-1598.
Alizadeh H, Teymouri F, Gilbert TI, Dale BE. 2005. Pretreatment of switchgrass by
ammonia fiber explosion (AFEX). Appl. Biochem. Biotechnol. 121/124:1133-1141.
Awafo VA, Chahal DS, Charbonneau R. 1995. Effect of irradiation, as a pretreatment, on
bioconversion of corn stover into protein-rich mycelial biomass of Pleurotus sajor-
caju. Radiation Phys. Chem. 46:1299-1302.
Ballesteros I, Oliva JM, Navarro AA, Gonzalez A, Carrasco J, Ballesteros M. 2000a. Effect
of chip size on steam explosion pretreatment of softwood. Appl. Biochem.
Biotechnol. 84/86:97-110.
Ballesteros I, Oliva JM, Navarro AA, Gonzalez A, Carrasco J, Ballesteros M. 2000b. Effect
of chip size on steam explosion pretreatment of softwood. Appl. Biochem.
Biotechnol. 84/86:97-110.
Beg QK, Kapoor M, Mahajan L, Hoondal GS. 2001. Microbial xylanases and their industrial
applications: a review. Appl. Microbiol. Biotechnol. 56:326-338.
Biomass Research and Development Technical Advisory Committee. 2002. Roadmap for
biomass technologies in the United States.
http://www.brdisolutions.com/pdfs/FinalBiomassRoadmap.pdf.
Bjarnestad S, Dahlman O. 2002. Chemical compositions of hardwood and softwood pulps
employing photoacoustic Fourier transform infrared spectroscopy in combination
with partial least-squares analysis. Anal. Chem. 74(22):5851-5858.
Breen A, Singleton FL. 1999. Fungi in lignocellulose breakdown and biopulping. Curr. Opin.
Biotechnol. 10:252-258.
58
Brennan MA, Wyman CE. 2004. Initial evaluation of simple mass transfer models to
describe hemicellulose hydrolysis in corn stover. Appl. Biochem. Biotechnol.
113/116:965-976.
Broda P, Birch PRJ, Brooks PR, Sims PFG. 1996. Lignocellulose degradation by
Phanerochaete chrysosporium: gene families and gene expression for a complex
process. Mol. Microbiol. 19:923-932.
Bura R, Bothast RJ, Mansfield SD, Saddler JN. 2003. Optimization of SO2-catalyzed steam
pretreatment of corn fiber for ethanol production. Appl. Biochem. Biotechnol.
105/108:319-335.
Bura R, Mansfield SD, Saddler JN, Bothast RJ. 2002. SO2-catalyzed steam explosion of corn
fiber for ethanol production. Appl. Biochem. Biotechnol. 98/100:59-72.
Chang MM, Chou TYC, Tsao GT. 1981. Structure, pretreatment and hydrolysis of cellulose.
Adv. Biochem. Eng. 20:15-42.
Chang VS, Nagwani M, Kim CH, Holtzapple MT. 2001. Oxidative lime pretreatment of
high-lignin biomass: poplar wood and newspaper. Appl. Biochem. Biotechnol. 94:1-
28.
Charles N, Mansfield SD, Mirochnik O, Duff SJB. 2003. Effect of oxygen delignification
operating parameters on downstream enzymatic fydrolysis of softwood substrates.
Biotechnol. Prog. 19:1606-1611.
Chum H, L., Johnson DA, Black S, Baker J, Grohmann K, Sarkanen KV, Wallace K,
Schroeder HA. 1988. Organosolv pretreatment for enzymatic hydrolysis of poplars: I.
Enzyme hydrolysis of cellulosic residues. Biotechnol. Bioeng. 31:643-649.
Chung YC, Bakalinsky A, Penner MH. 2005. Enzymatic saccharification and fermentation of
xylose-optimized dilute acid-treated lignocellulosics. Appl. Biochem. Biotechnol.
121/124:947-961.
Converse AO, Grethlein HE. 1987. On the use of an adsorption model to represent the effect
of steam explosion pretreatment on the enzymatic hydrolysis of lignocellulosic
substances. Enzyme Microb. Technol. 9:79-82.
Coward-Kelly G, Agbogbo FK, Holtzapple MT. 2005. Lime treatment of shrimp head waste
for the generation of highly digestible animal feed. Biores. Technol. In Press,
Corrected Proof.
59
Crawford DL. 1978. Lignocellulose decomposition by selected streptomyces strains. Appl.
Environ. Microbiol. 35:1041-1045.
Dale BE, Leong CK, Pham TK, Esquivel VM, Rios I, Latimer VM. 1996. Hydrolysis of
lignocellulosics at low enzyme levels: Application of the AFEX process. Biores.
Technol. 56:111-116.
de Vries RP, Visser J. 2001. Aspergillus enzymes involved in degradation of plant cell wall
polysaccharides. Microbiol. Mol. Biol. Rev. 65:497-522.
Ding SY, Himmel ME. 2006. The maize primary cell wall microfibril: A new model derived
from direct visualization. J. Agric. Food Chem. 54(3):597-606.
DOE, USDA. 2005. A billion-ton feedstocks supply for a bioenergy and bioproducts
industry. Oak Ridge National Laboratory.
http://wwww.feedstockreview.ornl.gov/pdf/billion_ton_vision.pdf p.
Emmel A, Mathias AL, Wypych F, Ramos LP. 2003. Fractionation of Eucalyptus grandis
chips by dilute acid-catalysed steam explosion. Biores. Technol 86:105-115.
Fan LT, Gharpuaray MM, Lee Y-H. 1987. Cellulose Hydrolysis Biotechnology Monography.
Berlin: Springer.
Fan LT, Lee Y-H, Gharpuray MM. 1982. The nature of lignocellulosics and their
pretreatments for enzymatic hydrolysis. Adv. Biochem. Eng. 23:157-187.
Fengel D, Wegener G. 1984. Wood: Chemistry, Ultrastructure, Reactions. Berlin: Walter de
Gruyter & Co.
Ferrer A, Byers FM, Sulbaran-de-Ferrer B, Dale BE, Aiello C. 2000. Optimizing ammonia
pressurization/depressurization processing conditions to enhance enzymatic
susceptibility of dwarf elephant grass. Appl. Biochem. Biotechnol. 84/86:163-179.
Ferrer A, Byers FM, Sulbaran-de-Ferrer B, Dale BE, Aiello C. 2002a. Optimizing ammonia
processing conditions to enhance susceptibility of legumes to fiber hydrolysis: alfalfa.
Appl. Biochem. Biotechnol. 98/100:123-134.
Ferrer A, Byers FM, Sulbaran-de-Ferrer B, Dale BE, Aiello C. 2002b. Optimizing ammonia
processing conditions to enhance susceptibility of legumes to fiber hydrolysis:
Florigraze rhizoma peanut. Appl. Biochem. Biotechnol. 98/100:135-146.
Foster BL, Dale BE, Doran-Peterson JB. 2001. Enzymatic hydrolysis of ammonia-treated
sugar beet pulp. Appl. Biochem. Biotechnol. 91/93:269-282.
60
Galbe M, Zacchi G. 2002. A review of the production of ethanol from softwood. Appl.
Microbiol. Biotechnol. 59:618-628.
Gollapalli LE, Dale BE, Rivers DM. 2002. Predicting digestibility of ammonia fiber
explosion (AFEX)-treated rice straw. Appl. Biochem. Biotechnol. 98/100:23-35.
Grethlein HE, Converse AO. 1991. Common aspects of acid prehydrolysis and steam
explosion for pretreating wood. Biores. Technol. 36:77-82.
Hardenberg HO, Schaefer AJ. 1981. The Use of Ethanol as a fuel for Compression Ignition
Engines. Warrendale, PA.
Hatakka AI. 1983. Pretreatment of wheat straw by white-rot fungi for enzymatic
saccharification of cellulose. Appl. Microbiol. Biotechnol. 18:350-357.
Himmel ME, Ding S-Y, Johnson DK, Adney WS, Nimlos MR, Brady JW, Foust TD. 2007.
Biomass recalcitrance: Engineering plants and enzymes for biofuels production.
Science 315(5813):804-807.
Holtzapple MT, Humphrey AE. 1984. The effect of organosolv pretreatment on the
enzymatic hydrolysis of poplar. Biotechnol. Bioeng. 26:670-676.
Horvath IS, Sjode A, Alriksson B, Jonsson LJ, Nilvebrant NO. 2005. Critical conditions for
improved fermentability during overliming of acid hydrolysates from spruce. Appl.
Biochem. Biotechnol. 121/124:1031-1044.
Hsu T-A. 1996. Pretreatment of biomass. In: Wyman CE, editor. Handbook on Bioethanol:
Taylor & Francis.
Jacobsen SE, Wyman CE. 2000. Cellulose and hemicellulose hydrolysis models for
application to current and novel pretreatment processes. Appl. Biochem. Biotechnol.
84/86:81-96.
Kerem Z, Hadar Y. 1995. Effect of manganese on preferential degradation of lignin by
Pleurotus ostreatus during solid-state fermentation. Appl. Environ. Microbiol.
61:3057-3062.
Kim JS, Lee YY, Park SC. 2000. Pretreatment of wastepaper and pulp mill sludge by
aqueous ammonia and hydrogen peroxide. Appl. Biochem. Biotechnol. 84/86:129-
139.
Kim KH, Hong J. 2001. Supercritical CO2 pretreatment of lignocellulose enhances enzymatic
cellulose hydrolysis. Biores. Technol. 77:139-144.
61
Kim KH, Tucker MP, Nguyen QA. 2002. Effects of pressing lignocellulosic biomass on
sugar yield in two-stage dilute-acid hydrolysis process. Biotechnol. Prog. 18:489-494.
Kim S, Holtzapple MT. 2005a. Delignification kinetics of corn stover in lime pretreatment.
Biores. Technol.:Jun 13; [Epub ahead of print]
Kim S, Holtzapple MT. 2005b. Effect of structural features on enzyme digestibility of corn
stover. Biores. Technol.:Jun 13; [Epub ahead of print]
Kim S, Holtzapple MT. 2005c. Lime pretreatment and enzymatic hydrolysis of corn stover.
Biores. Technol. 96:1994-2006.
Kim SB, Lee YY. 2002. Diffusion of sulfuric acid within lignocellulosic biomass particles
and its impact on dilute-acid pretreatment. Biores. Technol 83:165-171.
Kim TH, Kim JS, Sunwoo C, Lee YY. 2003. Pretreatment of corn stover by aqueous
ammonia. Biores Technol 90:39-47.
Kim TH, Lee YY. 2005. Pretreatment and fractionation of corn stover by ammonia recycle
percolation process. Biores. Technol. 96:2007-2013.
Kim TH, Lee YY. 2006. Fractionation of corn stover by hot-water and aqueous ammonia
treatment. Biores. Technol. 97:224-232.
Kobayashi F, Take H, Asada C, Nakamura Y. 2004. Methane production from steam-
exploded bamboo. J. Biosci. Bioeng. 97:426-428.
Kumakura M, Kaetsu I. 1983. Effect of radiation pretreatment of bagasse on enzymatic and
acid hydrolysis. Biomass 3:199-208.
Kumakura M, Kojima T, Kaetsu I. 1982. Pretreatment of lignocellulosic wastes by
combination of irradiation and mechanical crushing. Biomass 2:299-308.
Kurakake M, Kisaka W, Ouchi K, Komaki T. 2001. Pretreatment with ammonia water for
enzymatic hydrolysis of corn husk, bagasse, and switchgrass. Appl. Biochem.
Biotechnol. 90:251-259.
Ladisch MR, Ladisch CM, Tsao GT. 1978. Cellulose to sugars: new path gives quantitative
yield. Science 201:743-745.
Lam ND, Nagasawa N, Kume T. 2000. Effect of radiation and fungal treatment on
lignocelluloses and their biological activity. Radiation Phys. Chem. 59:393-398.
62
Laser M, Schulman D, Allen SG, Lichwa J, Antal MJJ, Lynd LR. 2002. A comparison of
liquid hot water and steam pretreatments of sugar cane bagasse for bioconversion to
ethanol. Biores. Technol. 81:33-44.
Lee KC, Bulls M, Holmes J, Barrier JW. 1997. Hybrid process for the conversion of
lignocellulosic materials. Appl. Biochem. Biotechnol. 66:1-23.
Leonowicz A, Matuszewska A, Luterek J, Ziegenhagen D, Wojtas-Wasilewska M, Cho N-S,
Hofrichter M, Rogalski J. 1999. Biodegradation of lignin by white rot fungi. Fungal
Gen. Biol. 27:175-185.
Li X, Converse AO, Wyman CE. 2003. Characterization of molecular weight distribution of
oligomers from autocatalyzed batch hydrolysis of xylan. Appl. Biochem. Biotechnol.
105/108:515-522.
Liu C, Wyman CE. 2004. Impact of fluid velocity on hot water only pretreatment of corn
stover in a flowthrough reactor. Appl. Biochem. Biotechnol. 113/116:977-987.
Liu C, Wyman CE. 2005. Partial flow of compressed-hot water through corn stover to
enhance hemicellulose sugar recovery and enzymatic digestibility of cellulose.
Biores. Technol. 96:1978-1985.
Lloyd T, Wyman CE. 2003. Application of a depolymerization model for predicting
thermochemical hydrolysis of hemicellulose. Appl. Biochem. Biotechnol. 105 -
108:53-67.
Lloyd TA, Wyman CE. 2004. Predicted effects of mineral neutralization and bisulfate
formation on hydrogen ion concentration for dilute sulfuric acid pretreatment. Appl.
Biochem. Biotechnol. 113/116:1013-1022.
Lloyd TA, Wyman CE. 2005. Combined sugar yields for dilute sulfuric acid pretreatment of
corn stover followed by enzymatic hydrolysis of the remaining solids. Biores.
Technol. 96:1967-1977.
Lynd LR. 1996. Overview and Evaluation of Fuel Ethanol From Cellulosic Biomass:
Technology, Economics, the Environment, and Policy. Annu. Rev. Energy Environ.
21:403-465.
Lynd LR, Weimer PJ, van Zyl WH, Pretorius IS. 2002. Microbial cellulose utilization:
fundamentals and biotechnology. Microbiol. Mol. Biol. Rev. 66:506-577.
63
Lynd LR, Wyman CE, Gerngross TU. 1999. Biocommodity engineering. Biotechnol. Prog.
15:777-793.
Martin C, Galbe M, Nilvebrant NO, Jonsson LJ. 2002. Comparison of the fermentability of
enzymatic hydrolyzates of sugarcane bagasse pretreated by steam explosion using
different impregnating agents. Appl. Biochem. Biotechnol. 98/100:699-716.
McMillian JD. 1994. Pretreatment of lignocellulosic biomass. ACS Ser. 566:292-234.
Millett MA, Baker AJ, Satter LD. 1976. Physical and chemical pretreatments for enhancing
cellulose saccharification. Biotechnol. Bioeng. Symp. 6:125-153.
Mosier N, Hendrickson R, Ho N, Sedlak M, Ladisch MR. 2005a. Optimization of pH
controlled liquid hot water pretreatment of corn stover. Biores. Technol. 96:1986-
1993.
Mosier N, Wyman CE, Dale BE, Elander RT, Lee YY, Holtzapple M, Ladisch M. 2005b.
Features of promising technologies for pretreatment of lignocellulosic biomass.
Biores. Technol. 96:673-686.
Mutje P, Pelach MA, Vilaseca F, Garcia JC, Jimenez L. 2005. A comparative study of the
effect of refining on organosolv pulp from olive trimmings and kraft pulp from
eucalyptus wood. Biores. Technol. 96:1125-1129.
Nagle NJ, Elander RT, Newman MM, Rohrback BT, Ruiz RO, Torget RW. 2002. Efficacy of
a hot washing process for pretreated yellow poplar to enhance bioethanol production.
Biotechnol. Prog. 18:734-738.
Negro MJ, Manzanares P, Ballesteros I, Oliva JM, Cabanas A, Ballesteros M. 2003.
Hydrothermal pretreatment conditions to enhance ethanol production from poplar
biomass. Appl. Biochem. Biotechnol. 105/108:87-100.
Nguyen QA, Tucker MP, Keller FA, Eddy FP. 2000. Two-stage dilute-acid pretreatment of
softwoods. Appl. Biochem. Biotechnol. 84/86:561-576.
Office of Energy Efficiency and Renewable Energy, Office of Science. 2006. Breaking the
Biological Barriers to Cellulosic Ethanol: A joint Research Agenda. A Research
Roadmap Resulting from the Biomass to Biofuels Workshop. .
http://www.doegenomestolife.org/biofuels/.
64
Ohgren K, Galbe M, Zacchi G. 2005. Optimization of steam pretreatment of SO2-
impregnated corn stover for fuel ethanol production. Appl. Biochem. Biotechnol.
121/124:1055-1067.
Oliva JM, Saez F, Ballesteros I, Gonzalez A, Negro MJ, Manzanares P, Ballesteros M. 2003.
Effect of lignocellulosic degradation compounds from steam explosion pretreatment
on ethanol fermentation by thermotolerant yeast Kluyveromyces marxianus. Appl.
Biochem. Biotechnol. 105/108:141-153.
Palmarola-Adrados B, Galbe M, Zacchi G. 2004. Combined steam pretreatment and
enzymatic hydrolysis of starch-free wheat fibers. Appl. Biochem. Biotechnol.
113/116:989-1002.
Pan X, Arato C, Gilkes NR, Gregg D, Mabee W, Pye K, Xiao Z, Zhang X, Saddler JN.
2005a. Biorefining of softwood using ethanol organosolv pulping: preliminary
evaluation of process streams for manufacture of fuel-grade ethanol and co-products.
Biotechnol. Bioeng. 90:473-481.
Pan X, Xie D, Gilkes N, Gregg DJ, Saddler JN. 2005b. Strategies to enhance the enzymatic
hydrolysis of pretreated softwood with high residual lignin content. Appl. Biochem.
Biotechnol. 124:1069-1080.
Rahmawati N, Ohashi Y, Watanabe T, Honda Y, Watanabe T. 2005. Ceriporic acid B, an
extracellular metabolite of Ceriporiopsis ubvermispora, suppresses the
depolymerization of cellulose by the fenton reaction. Biomacromolecules 6:2851-
2856.
Ruiz R, Ehrman T. 1996. Determination of Carbohydrates in Biomass by High Preformance
Liquid Chromatography. LAP-002: NREL.
Saeman JF. 1945. Kinetics of wood saccharification: hydrolysis of cellulose and
decomposition of sugars in dilute acid at high temperature. Ind Eng Chem Anal Ed
37:44-52.
Saeman JF, Bubl JL, Harris EE. 1945. Quantitative saccharification of wood and cellulose.
Ind. Eng. Chem. Anal. Ed. 17:35-37.
Sassner P GM, Zacchi G. 2005 Steam pretreatment of Salix with and without SO2
impregnation for production of bioethanol. Appl. Biochem. Biotechnol.
121/124:1101-1117.
65
Schell DJ, Farmer J, Newman M, McMillan JD. 2003. Dilute-sulfuric acid pretreatment of
corn stover in pilot-scale reactor: investigation of yields, kinetics, and enzymatic
digestibilities of solids. Appl. Biochem. Biotechnol. 105/108:69-85.
Schmidt AS, Thomsen AB. 1998. Optimization of wet oxidation pretreatment of wheat straw.
Biores. Technol. 64:139-151.
Schultz TP, Templeton MC, McGinnis GD. 1985. Rapid determination of lignocellulose by
diffuse reflectance Fourier Transform Infrared spectrometry. Anal Chem 57:2867-
2869.
Shaffer PA, Somogyi M. 1933. Copper-iodometric reagents for sugar determination. J Biol
Chem 100:695-713.
Singh S, Madlala AM, Prior BA. 2003. Thermomyces lanuginosus: properties of strains and
their hemicellulases. FEMS Microbiol. Lett. 27:3-16.
Sluiter A, Hames B, Ruiz R, Scarlata C, Sluiter J, Templeton D, Crocker D. 2006.
Determination of Structural Carbohydrates and Lignin in Biomass. NREL.
Soderstrom J, Pilcher L, Galbe M, Zacchi G. 2002. Two-step steam pretreatment of softwood
with SO2 impregnation for ethanol production. Appl. Biochem. Biotechnol. 98/100:5-
21.
Soderstrom J, Pilcher L, Galbe M, Zacchi G. 2003. Combined use of H2SO4 and SO2
impregnation for steam pretreatment of spruce in ethanol production. Appl. Biochem.
Biotechnol. 105/108:127-140.
Song SK, Lee YY. 1984. Acid hydrolysis of wood cellulose under low water condition.
Biomass 6:93-100.
Striegel AM. 1997. Theory and applications of DMAc/LiCl in the analysis of
polysacharrides. Carbohydr. Poly. 34:267-274.
Sulbaran-de-Ferrer B, Aristiguieta M, Dale BE, Ferrer A, Ojeda-de-Rodriguez G. 2003.
Enzymatic hydrolysis of ammonia-treated rice straw. Appl. Biochem. Biotechnol.
105/108:155-164.
Sun Y, Cheng J. 2002. Hydrolysis of lignocellulosic materials for ethanol production: a
review. Biores. Technol. 83:1-11.
66
Tanaka M, Matsuno R, Converse AO. 1990. n-butylamine and acid-steam explosion
pretreatments of rice straw and hardwood: Effects on substrate structure and
enzymatic hydrolysis. Enzyme Microb. Technol. 12:190-195.
Teixeira LC, Linden JC, Schroeder HA. 2000 Simultaneous saccharification and
cofermentation of peracetic acid-pretreated biomass. Appl. Biochem. Biotechnol.
84/86:111-127.
Tengborg C, Galbe M, Zacchi G. 2001. Influence of enzyme loading and physical parameters
on the enzymatic hydrolysis of steam-pretreated softwood. Biotechnol. Prog. 17:110-
117.
Tengerdy RP, Nagy JG. 1988. Increasing the feed value of forestry waste by ammonia freeze
explosion treatment. Biol. Wastes 25:149-153.
Teymouri F, Laureano-Perez L, Alizadeh H, Dale BE. 2005. Optimization of the ammonia
fiber explosion (AFEX) treatment parameters for enzymatic hydrolysis of corn stover.
Biores. Technol. 96:2014-2018.
Tolbert MEM, Bhattacharya S, Biswas PK. 1986. Enzymic saccharification of cellulose and
cellulosic biomass of sweet potato (Ipomoea batatas L.) -- two-step hydrolysis.
Biomass 11:205-213.
Tucker MP, Nagle NJ, Jennings EW, Ibsen KN, Aden A, Nguyen QA, Kim KH, Noll SL.
2004. Conversion of distiller's grain into fuel alcohol and a higher-value animal feed
by dilute-acid pretreatment. Appl. Biochem. Biotechnol. 113/116:1139-1159.
Um BH, Karim M, Henk L. 2003. Effect of sulfuric and phosphoric acid pretreatments on
enzymatic hydrolysis of corn stover. Appl. Biochem. Biotechnol. 105/108:115-125.
U.S. Department of Energy Genome Programs. 2007a. Cellulose Structure and Hydrolysis
Challenges. http://genomics.energy.gov/gallery/gtl/view.np/view-36.html
U.S. Department of Energy Genome Programs. 2007b. Contemporary View of Lignin
Substructures. http://genomics.energy.gov/gallery/b2b/view.np/view-23.html
Valaskova V, Baldrian P. 2005. Estimation of bound and free fractions of lignocellulose-
degrading enzymes of wood-rotting fungi Pleurotus ostreatus, Trametes versicolor
and Piptoporus betulinus. Res. Microbiol. In Press, Corrected Proof.
Valjamae P, Kipper K, Pettersson G, Johansson G. 2003. Synergistic cellulose hydrolysis can
be described in terms of fractal-like kinetics. Biotechnol. Bioeng. 84:254-257.
67
van Walsum GP, Shi H. 2004. Carbonic acid enhancement of hydrolysis in aqueous
pretreatment of corn stover. Bioresour. Technol. 93:217-226.
Vidal PF, Molinier J. 1988. Ozonolysis of lignin -- Improvement of in vitro digestibility of
poplar sawdust. Biomass 16:1-17.
Vlasenko EY, Ding H, Labavitch JM, Shoemaker SP. 1997. Enzymatic hydrolysis of
pretreated rice straw. Biores. Technol. 59:109-119.
Weil J WP, Kohlmann K, Ladisch MR. 1994. Cellulose pretreatments of lignocellulosic
substrates.. Enzyme Microb Technol. 16:1002-1014.
Wood TM, Saddler JN. 1988. Increasing the availability of cellulose in biomass materials.
Methods Enzymol. 162:3-11.
Wooley R, Ruth M, Glassner D, Sheehan J. 1999. Process design and costing of bioethanol
technology: A tool for determining the status and direction of research and
development. Biotechnol. Prog. 15:794-803.
Wyman CE. 1999. Biomass ethanol: technical progress, opportunities, and commercial
challenges. Annu. Rev. Energy Environ. 24:189-226.
Wyman CE, Dale BE, Elander RT, Holtzapple M, Ladisch MR, Lee YY. 2005a.
Comparative sugar recovery data from laboratory scale application of leading
pretreatment technologies to corn stover. Biores. Technol. 96:2026-2032.
Wyman CE, Dale BE, Elander RT, Holtzapple M, Ladisch MR, Lee YY. 2005b. Coordinated
development of leading biomass pretreatment technologies. Biores. Technol.
96:1959-1966.
Yang B, Boussaid A, Mansfield SD, Gregg DJ, Saddler JN. 2002. Fast and efficient alkaline
peroxide treatment to enhance the enzymatic digestibility of steam-exploded
softwood substrates. Biotechnol. Bioeng. 77:678-684.
Yang B, Wyman CE. 2004. Effect of xylan and lignin removal by batch and flowthrough
pretreatment on the enzymatic digestibility of corn stover cellulose. Biotechnol.
Bioeng. 86:88-95.
Yang B, Wyman CE. 2006. BSA treatment to enhance enzymatic hydrolysis of cellulose in
lignin containing substrates. Biotechnol. Bioeng. 94:611 - 617.
Zhang Y-H, Schell DJ, MCmillan JD. 2007a. Methodological analysis for determination of
enzymatic digestibility of cellulosic materials. Biotech. Bioeng. 96(1):188-194.
68
Zhang Y-HP, Cui J-B, Lynd LR, Kuang LR. 2006a. A transition from cellulose swelling to
cellulose dissolution by o-phosphoric acid: Evidences from enzymatic hydrolysis and
supramolecular structure. Biomacromolecules 7(2):644-648.
Zhang Y-HP, Ding S-Y, Mielenz JR, Elander R, Laser M, Himmel M, McMillan JD, Lynd
LR. 2007b. Fractionating recalcitrant lignocellulose at modest reaction conditions.
Biotechnol. Bioeng. 97(2):214-223.
Zhang Y-HP, Himmel M, Mielenz JR. 2006b. Outlook for cellulase improvement: Screening
and selection strategies. Biotechnol. Adv. 24(5):452-481.
Zhang Y-HP, Lynd LR. 2003. Cellodextrin preparation by mixed-acid hydrolysis and
chromatographic separation. Anal. Biochem. 322:225-232.
Zhang Y-HP, Lynd LR. 2004. Toward an aggregated understanding of enzymatic hydrolysis
of cellulose: Noncomplexed cellulase systems. Biotechnol. Bioeng. 88:797-824.
Zhang Y-HP, Lynd LR. 2006. A functionally based model for hydrolysis of cellulose by
fungal cellulase. Biotechnol. Bioeng. 94(5):888-898.
Zhang Y-HP, Schell DJ, McMillan JD. 2007c. Methodological analysis for determination of
enzymatic digestibility of cellulosic materials. Biotechnol. Bioeng. 96(1):188-194.
Zheng Y, Lin H, Tsao GT. 1998. Pretreatment for cellulose hydrolysis by carbon dioxide
explosion. Biotechnol. Prog. 14:890-896.
Zhu Y, Lee YY, Elander RT. 2004. Dilute-acid pretreatment of corn stover using a high-
solids percolation reactor. Appl. Biochem. Biotechnol. 117:103-114.
Zhu Y, Lee YY, Elander RT. 2005. Optimization of dilute-acid pretreatment of corn stover
using a high-solids percolation reactor. Appl. Biochem. Biotechnol. 121/124:1045-
1054.
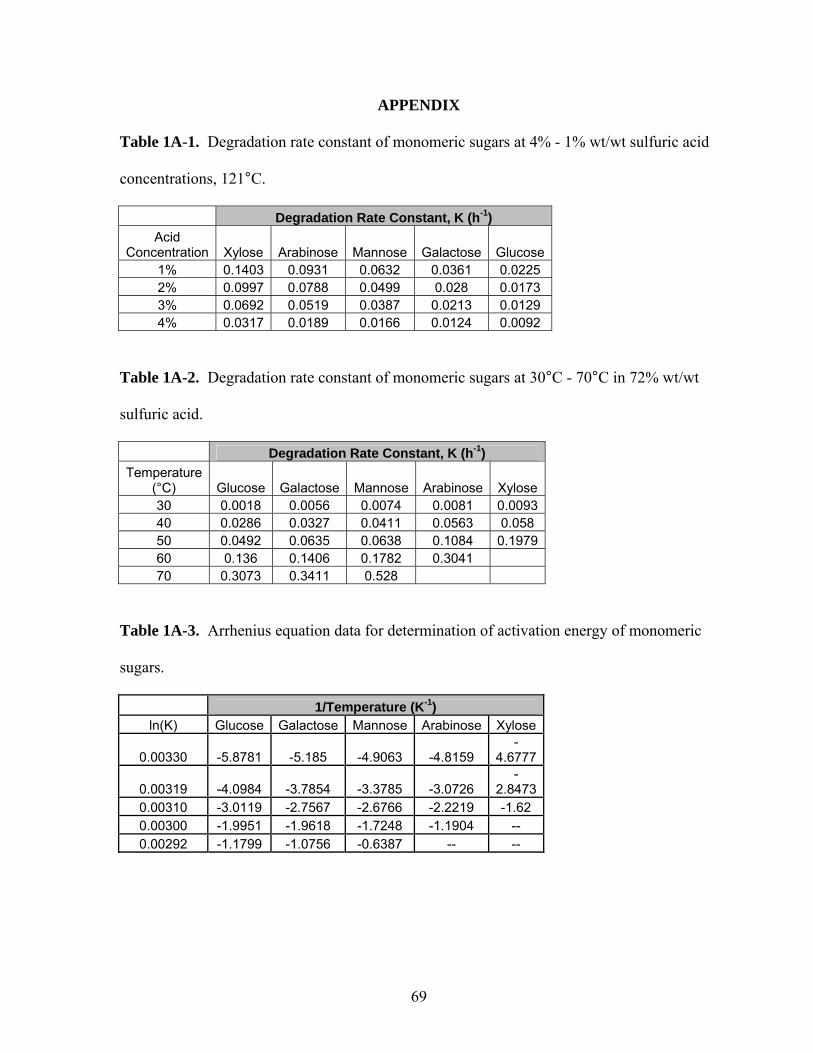
69
APPENDIX
Table 1A-1. Degradation rate constant of monomeric sugars at 4% - 1% wt/wt sulfuric acid
concentrations, 121°C.
Degradation Rate Constant, K (h-1) Acid
Concentration Xylose Arabinose Mannose Galactose Glucose1% 0.1403 0.0931 0.0632 0.0361 0.0225 2% 0.0997 0.0788 0.0499 0.028 0.0173 3% 0.0692 0.0519 0.0387 0.0213 0.0129 4% 0.0317 0.0189 0.0166 0.0124 0.0092
Table 1A-2. Degradation rate constant of monomeric sugars at 30°C - 70°C in 72% wt/wt
sulfuric acid.
Degradation Rate Constant, K (h-1) Temperature
(°C) Glucose Galactose Mannose Arabinose Xylose30 0.0018 0.0056 0.0074 0.0081 0.009340 0.0286 0.0327 0.0411 0.0563 0.058 50 0.0492 0.0635 0.0638 0.1084 0.197960 0.136 0.1406 0.1782 0.3041 70 0.3073 0.3411 0.528
Table 1A-3. Arrhenius equation data for determination of activation energy of monomeric
sugars.
1/Temperature (K-1) ln(K) Glucose Galactose Mannose Arabinose Xylose
0.00330 -5.8781 -5.185 -4.9063 -4.8159 -
4.6777
0.00319 -4.0984 -3.7854 -3.3785 -3.0726 -
2.84730.00310 -3.0119 -2.7567 -2.6766 -2.2219 -1.62 0.00300 -1.9951 -1.9618 -1.7248 -1.1904 -- 0.00292 -1.1799 -1.0756 -0.6387 -- --
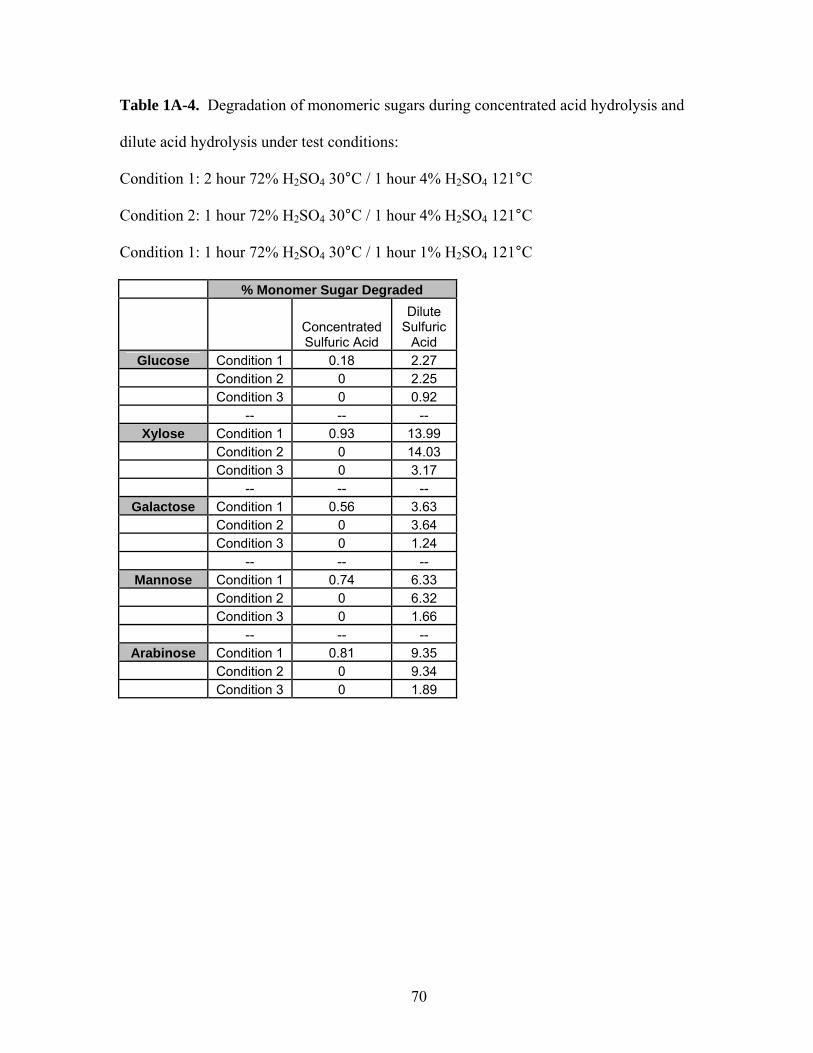
70
Table 1A-4. Degradation of monomeric sugars during concentrated acid hydrolysis and
dilute acid hydrolysis under test conditions:
Condition 1: 2 hour 72% H2SO4 30°C / 1 hour 4% H2SO4 121°C
Condition 2: 1 hour 72% H2SO4 30°C / 1 hour 4% H2SO4 121°C
Condition 1: 1 hour 72% H2SO4 30°C / 1 hour 1% H2SO4 121°C
% Monomer Sugar Degraded
Concentrated Sulfuric Acid
Dilute Sulfuric
Acid Glucose Condition 1 0.18 2.27
Condition 2 0 2.25 Condition 3 0 0.92 -- -- --
Xylose Condition 1 0.93 13.99 Condition 2 0 14.03 Condition 3 0 3.17 -- -- --
Galactose Condition 1 0.56 3.63 Condition 2 0 3.64 Condition 3 0 1.24 -- -- --
Mannose Condition 1 0.74 6.33 Condition 2 0 6.32 Condition 3 0 1.66 -- -- --
Arabinose Condition 1 0.81 9.35 Condition 2 0 9.34 Condition 3 0 1.89
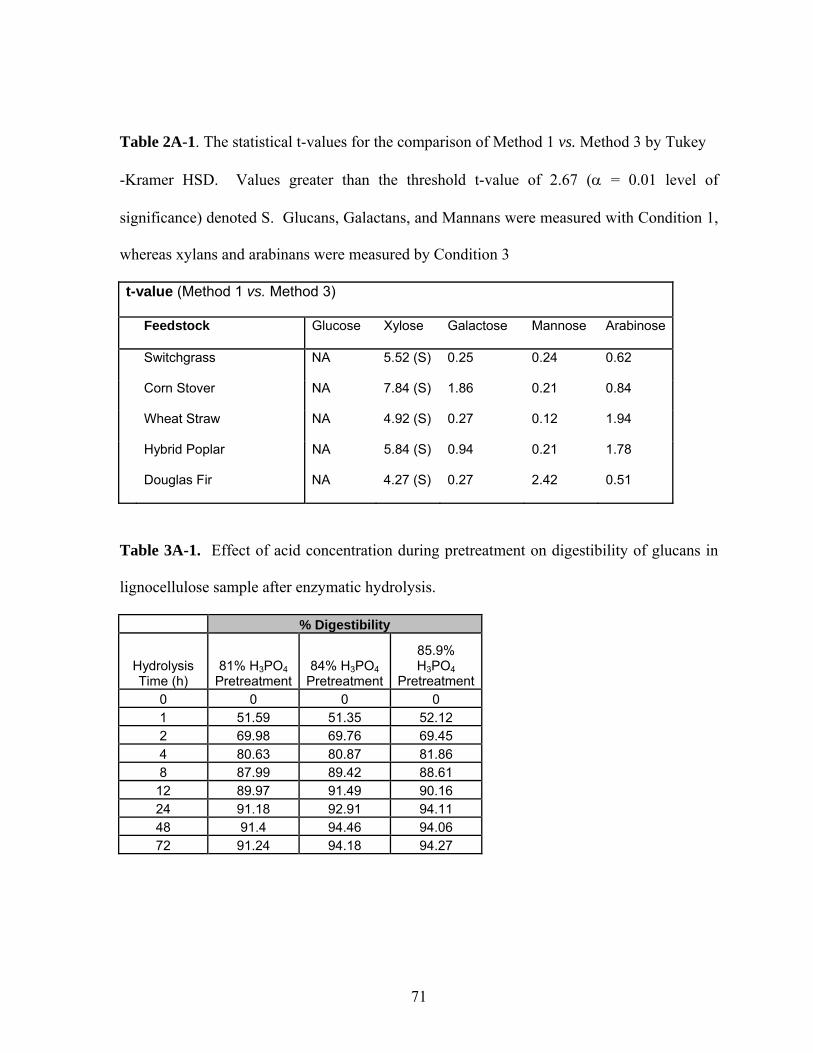
71
Table 2A-1. The statistical t-values for the comparison of Method 1 vs. Method 3 by Tukey
-Kramer HSD. Values greater than the threshold t-value of 2.67 (α = 0.01 level of
significance) denoted S. Glucans, Galactans, and Mannans were measured with Condition 1,
whereas xylans and arabinans were measured by Condition 3
Table 3A-1. Effect of acid concentration during pretreatment on digestibility of glucans in
lignocellulose sample after enzymatic hydrolysis.
% Digestibility
Hydrolysis Time (h)
81% H3PO4 Pretreatment
84% H3PO4 Pretreatment
85.9% H3PO4
Pretreatment0 0 0 0 1 51.59 51.35 52.12 2 69.98 69.76 69.45 4 80.63 80.87 81.86 8 87.99 89.42 88.61
12 89.97 91.49 90.16 24 91.18 92.91 94.11 48 91.4 94.46 94.06 72 91.24 94.18 94.27
t-value (Method 1 vs. Method 3)
Feedstock Glucose Xylose Galactose Mannose Arabinose
Switchgrass NA 5.52 (S) 0.25 0.24 0.62
Corn Stover NA 7.84 (S) 1.86 0.21 0.84
Wheat Straw NA 4.92 (S) 0.27 0.12 1.94
Hybrid Poplar NA 5.84 (S) 0.94 0.21 1.78
Douglas Fir NA 4.27 (S) 0.27 2.42 0.51
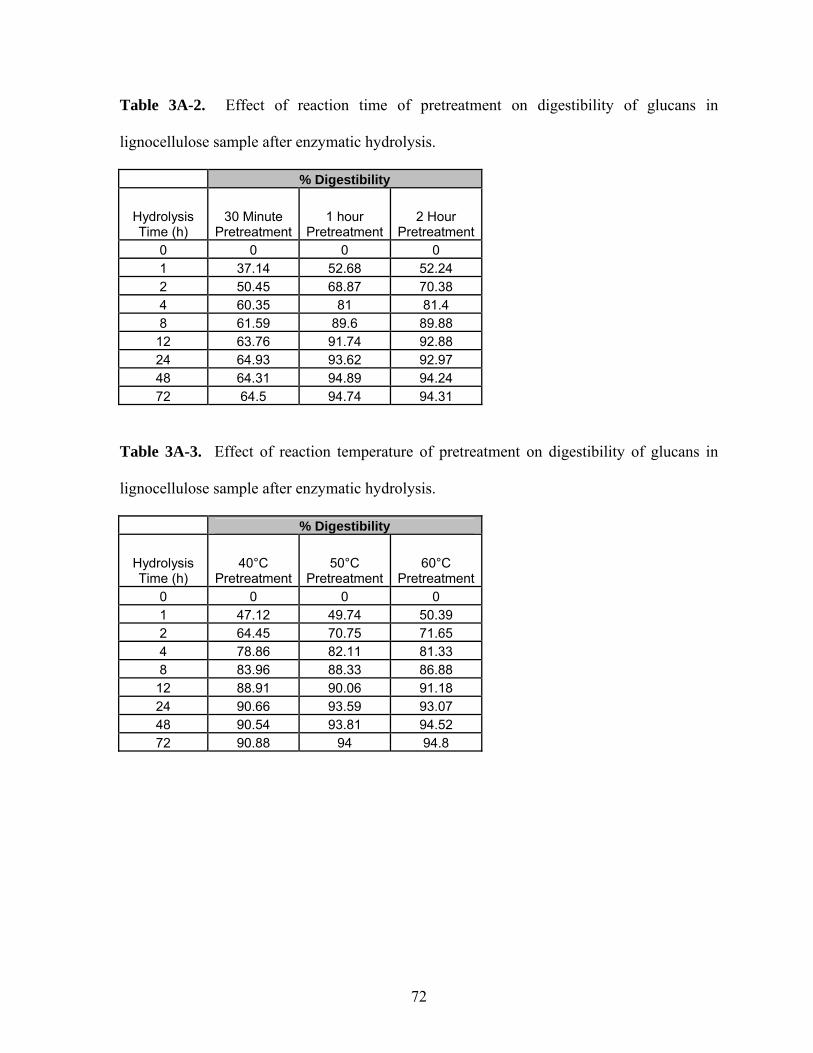
72
Table 3A-2. Effect of reaction time of pretreatment on digestibility of glucans in
lignocellulose sample after enzymatic hydrolysis.
% Digestibility
Hydrolysis Time (h)
30 Minute Pretreatment
1 hour Pretreatment
2 Hour Pretreatment
0 0 0 0 1 37.14 52.68 52.24 2 50.45 68.87 70.38 4 60.35 81 81.4 8 61.59 89.6 89.88
12 63.76 91.74 92.88 24 64.93 93.62 92.97 48 64.31 94.89 94.24 72 64.5 94.74 94.31
Table 3A-3. Effect of reaction temperature of pretreatment on digestibility of glucans in
lignocellulose sample after enzymatic hydrolysis.
% Digestibility
Hydrolysis Time (h)
40°C Pretreatment
50°C Pretreatment
60°C Pretreatment
0 0 0 0 1 47.12 49.74 50.39 2 64.45 70.75 71.65 4 78.86 82.11 81.33 8 83.96 88.33 86.88
12 88.91 90.06 91.18 24 90.66 93.59 93.07 48 90.54 93.81 94.52 72 90.88 94 94.8