Structure near K p threshold in the in-flight He K Λ reaction · In this paper, we present a...
12
arXiv:1601.06876v2 [nucl-ex] 17 Mar 2016 Prog. Theor. Exp. Phys. 2015, 00000 (12 pages) DOI: 10.1093/ptep/0000000000 , Structure near K - +p+p threshold in the in-flight 3 He(K - , Λp)n reaction J-PARC E15 Collaboration Y. Sada 1 , S. Ajimura 1 , M. Bazzi 2 , G. Beer 3 , H. Bhang 4 , M. Bragadireanu 5 , P. Buehler 6 , L. Busso 7,9 , M. Cargnelli 6 , S. Choi 4 , C. Curceanu 2 , S. Enomoto 8 , D. Faso 7,9 , H. Fujioka 10 , Y. Fujiwara 11 , T. Fukuda 12 , C. Guaraldo 2 , T. Hashimoto 13 , R. S. Hayano 11 , T. Hiraiwa 1 , M. Iio 8 , M. Iliescu 2 , K. Inoue 1 , Y. Ishiguro 10 , T. Ishikawa 11 , S. Ishimoto 8 , T. Ishiwatari 6 , K. Itahashi 13 , M. Iwai 8 , M. Iwasaki 14,13 , Y. Kato 13 , S. Kawasaki 15 , P. Kienle † 16 , H. Kou 14 , Y. Ma 13 , J. Marton 6 , Y. Matsuda 17 , Y. Mizoi 12 , O. Morra 7 , T. Nagae 10 , H. Noumi 1 , H. Ohnishi 13,1 , S. Okada 13 , H. Outa 13 , K. Piscicchia 2 , A. Romero Vidal 2 , A. Sakaguchi 15 , F. Sakuma 13 , M. Sato 13 , A. Scordo 2 , M. Sekimoto 8 , H. Shi 2 , D. Sirghi 2,5 , F. Sirghi 2,5 , K. Suzuki 6 , S. Suzuki 8 , T. Suzuki 11 , K. Tanida 18 , H. Tatsuno 19 , M. Tokuda 14 , D. Tomono 1 , A. Toyoda 8 , K. Tsukada 20 , O. Vazquez Doce 2,21 , E. Widmann 6 , B. K. Wuenschek 6 , T. Yamaga 15 , T. Yamazaki 11,13 , H. Yim 22 , Q. Zhang 13 , and J. Zmeskal 6 1 Research Center for Nuclear Physics (RCNP), Osaka University, Osaka, 567-0047, Japan 2 Laboratori Nazionali di Frascati dell’ INFN, I-00044 Frascati, Italy 3 Department of Physics and Astronomy, University of Victoria, Victoria BC V8W 3P6, Canada 4 Department of Physics, Seoul National University, Seoul, 151-742, South Korea 5 National Institute of Physics and Nuclear Engineering - IFIN HH, Romania 6 Stefan-Meyer-Institut f¨ ur subatomare Physik, A-1090 Vienna, Austria 7 INFN Sezione di Torino, Torino, Italy 8 High Energy Accelerator Research Organization (KEK), Tsukuba, 305-0801, Japan 9 Dipartimento di Fisica Generale, Universita’ di Torino, Torino, Italy 10 Department of Physics, Kyoto University, Kyoto, 606-8502, Japan 11 Department of Physics, The University of Tokyo, Tokyo, 113-0033, Japan 12 Laboratory of Physics, Osaka Electro-Communication University, Osaka, 572-8530, Japan 13 RIKEN Nishina Center, RIKEN, Wako, 351-0198, Japan 14 Department of Physics, Tokyo Institute of Technology, Tokyo, 152-8551, Japan 15 Department of Physics, Osaka University, Osaka, 560-0043, Japan 16 Technische Universit¨ at M¨ unchen, D-85748, Garching, Germany 17 Graduate School of Arts and Sciences, The University of Tokyo, Tokyo, 153-8902, Japan 18 ASRC, Japan Atomic Energy Agency, Ibaraki 319-1195, Japan 19 Department of Chemical Physics, Lund University, Lund, 221 00, Sweden 20 Department of Physics, Tohoku University, Sendai, 980-8578, Japan 21 Excellence Cluster Universe, Technische Universit¨ at M¨ unchen, D-85748, Garching, Germany 22 Korea Institute of Radiological and Medical Sciences (KIRAMS), Seoul, 139-706, South Korea@ ∗ E-mail: [email protected] ............................................................................... To search for an S= -1 di-baryonic state which decays to Λp, the 3 He(K − , Λp)n missing reaction was studied at 1.0 GeV/c. Unobserved neutrons were kinematically identified from the missing mass M X of the 3 He(K − , Λp)X reaction in order to have a large acceptance for the Λpn final state. The observed Λpn events, distributed widely over the kinematically allowed region of the Dalitz plot, establish that the major component comes from a three nucleon absorption process. A concentration of events at a specific neutron kinetic energy was observed in a region of low momentum transfer to the Λp. To c The Author(s) 2012. Published by Oxford University Press on behalf of the Physical Society of Japan. This is an Open Access article distributed under the terms of the Creative Commons Attribution License (http://creativecommons.org/licenses/by-nc/3.0), which permits unrestricted use, distribution, and reproduction in any medium, provided the original work is properly cited.
Transcript of Structure near K p threshold in the in-flight He K Λ reaction · In this paper, we present a...
arX
iv:1
601.
0687
6v2
[nu
cl-e
x] 1
7 M
ar 2
016
Prog. Theor. Exp. Phys. 2015, 00000 (12 pages)DOI: 10.1093/ptep/0000000000
,
Structure near K−+p+p threshold in thein-flight 3He(K−,Λp)n reaction
J-PARC E15 CollaborationY. Sada1, S. Ajimura1, M. Bazzi2, G. Beer3, H. Bhang4, M. Bragadireanu5,
P. Buehler6, L. Busso7,9, M. Cargnelli6, S. Choi4, C. Curceanu2, S. Enomoto8,
D. Faso7,9, H. Fujioka10, Y. Fujiwara11, T. Fukuda12, C. Guaraldo2, T. Hashimoto13,
R. S. Hayano11, T. Hiraiwa1, M. Iio8, M. Iliescu2, K. Inoue1, Y. Ishiguro10,
T. Ishikawa11, S. Ishimoto8, T. Ishiwatari6, K. Itahashi13, M. Iwai8, M. Iwasaki14,13,
Y. Kato13, S. Kawasaki15, P. Kienle†16, H. Kou14, Y. Ma13, J. Marton6,
Y. Matsuda17, Y. Mizoi12, O. Morra7, T. Nagae10, H. Noumi1, H. Ohnishi13,1,
S. Okada13, H. Outa13, K. Piscicchia2, A. Romero Vidal2, A. Sakaguchi15,
F. Sakuma13, M. Sato13, A. Scordo2, M. Sekimoto8, H. Shi2, D. Sirghi2,5,
F. Sirghi2,5, K. Suzuki6, S. Suzuki8, T. Suzuki11, K. Tanida18, H. Tatsuno19,
M. Tokuda14, D. Tomono1, A. Toyoda8, K. Tsukada20, O. Vazquez Doce2,21,
E. Widmann6, B. K. Wuenschek6, T. Yamaga15, T. Yamazaki11,13, H. Yim22,
Q. Zhang13, and J. Zmeskal6
1Research Center for Nuclear Physics (RCNP), Osaka University, Osaka, 567-0047, Japan2 Laboratori Nazionali di Frascati dell’ INFN, I-00044 Frascati, Italy3 Department of Physics and Astronomy, University of Victoria, Victoria BC V8W 3P6, Canada4 Department of Physics, Seoul National University, Seoul, 151-742, South Korea5 National Institute of Physics and Nuclear Engineering - IFIN HH, Romania6 Stefan-Meyer-Institut fur subatomare Physik, A-1090 Vienna, Austria7 INFN Sezione di Torino, Torino, Italy8 High Energy Accelerator Research Organization (KEK), Tsukuba, 305-0801, Japan9 Dipartimento di Fisica Generale, Universita’ di Torino, Torino, Italy10 Department of Physics, Kyoto University, Kyoto, 606-8502, Japan11 Department of Physics, The University of Tokyo, Tokyo, 113-0033, Japan12 Laboratory of Physics, Osaka Electro-Communication University, Osaka, 572-8530, Japan13 RIKEN Nishina Center, RIKEN, Wako, 351-0198, Japan14 Department of Physics, Tokyo Institute of Technology, Tokyo, 152-8551, Japan15 Department of Physics, Osaka University, Osaka, 560-0043, Japan16 Technische Universitat Munchen, D-85748, Garching, Germany17 Graduate School of Arts and Sciences, The University of Tokyo, Tokyo, 153-8902, Japan18 ASRC, Japan Atomic Energy Agency, Ibaraki 319-1195, Japan19Department of Chemical Physics, Lund University, Lund, 221 00, Sweden20 Department of Physics, Tohoku University, Sendai, 980-8578, Japan21 Excellence Cluster Universe, Technische Universitat Munchen, D-85748, Garching, Germany22 Korea Institute of Radiological and Medical Sciences (KIRAMS), Seoul, 139-706, South Korea@∗E-mail: [email protected]
. . . . . . . . . . . . . . . . . . . . . . . . . . . . . . . . . . . . . . . . . . . . . . . . . . . . . . . . . . . . . . . . . . . . . . . . . . . . . . .
To search for an S= -1 di-baryonic state which decays to Λp, the 3He(K−,Λp)nmissing
reaction was studied at 1.0 GeV/c. Unobserved neutrons were kinematically identifiedfrom the missing mass MX of the 3He(K−,Λp)X reaction in order to have a largeacceptance for the Λpn final state. The observed Λpn events, distributed widely overthe kinematically allowed region of the Dalitz plot, establish that the major componentcomes from a three nucleon absorption process. A concentration of events at a specificneutron kinetic energy was observed in a region of low momentum transfer to the Λp. To
c© The Author(s) 2012. Published by Oxford University Press on behalf of the Physical Society of Japan.
This is an Open Access article distributed under the terms of the Creative Commons Attribution License
(http://creativecommons.org/licenses/by-nc/3.0), which permits unrestricted use,
distribution, and reproduction in any medium, provided the original work is properly cited.
account for the observed peak structure, the simplest S-wave pole was assumed to existin the reaction channel, having a Breit-Wigner form in energy and with a Gaussianform-factor. A minimum χ2 method was applied to deduce its mass MX = 2355 +6
−8
(stat.) ±12 (syst.) MeV/c2, and decay-width ΓX = 110 +19−17 (stat.) ±27 (syst.) MeV/c2,
respectively. The form factor parameter QX ∼ 400 MeV/c implies that the range of theinteraction is about 0.5 fm.. . . . . . . . . . . . . . . . . . . . . . . . . . . . . . . . . . . . . . . . . . . . . . . . . . . . . . . . . . . . . . . . . . . . . . . . . . . . . . . . . . . . . . . . . . . . . .
Subject Index D01, D33
1. Introduction The KN interaction is known to be strongly attractive from low-energy
scattering data [1] and X-ray spectroscopy of kaonic atoms [2]. By assuming that the Λ(1405)
is a K−p bound state, the existence of a kaonic nuclear bound state has been predicted [3, 4].
Observation of a kaonic nuclear bound state would provide definitive information on the KN
interaction in the sub-threshold region, as well as the nature of Λ(1405).
Both theoretical and experimental advances have been made in the last decade. Especially,
careful attention has been paid to the simplest kaonic nuclear KNN state. Theoretically,
all calculations predict the existence of a bound state. However, the predicted KNN pole
positions, depending on KN interaction models, are scattered. For the energy independent
model (static calculation), the binding energy is 47 – 95 MeV [4]-[11]. On the other hand,
it becomes 9 – 32 MeV [11]-[13] for the energy dependent case. The widths are also widely
scattered between 34 – 110 MeV/c2.
Experimentally, there are many reports on observed peak structure ∼100 MeV below the
KNN production threshold. The FINUDA group reported a peak structure in the back-to-
back Λp invariant mass spectra via the stopped kaon reaction on 6Li, 7Li and 12C targets [14]
with binding energy (B.E.) 115 +6−5 MeV, and a width (Γ) 67 +14
−11 (stat.) +2−3 (syst.) MeV/c2.
The DISTO group observed KNN decaying to Λp in pp collisions at 2.85 GeV, with a B.E. of
103 ±3 (stat.) ±5 (syst. ) MeV, and Γ of 118 ±8 (stat.) ±10 (syst.) MeV/c2 [15]. In the pion
induced reaction, d(π+,K+) at 1.69 GeV/c, the E27 group observed “K−pp”-like structure
in the Σ0p decay mode at B.E. = 95 +18−17 (stat.) +30
−21 (syst.) MeV, Γ = 162 +87−45 (stat.) +66
−78
(syst.) MeV/c2 [16]. Conversely, no significant structure was observed in a SPring-8/LEPS
γ induced inclusive experiment [17] or in a proton-proton interaction at HADES/GSI [18].
Also, for the kaon stopped reaction, the other interpretations (i.e. two nucleon absorption of
kaons which have the final state Λp or Σ0p) are widely discussed [19, 20]. Thus, the evidence
for kaonic nuclei remains controversial.
In an attempt to clarify this situation, the E15 experiment on the K− +3 He reaction
at pK− = 1 GeV/c is under way at J-PARC. The first physics data were accumulated in
May 2013. By using an in-flight reaction and a light nuclear target, backgrounds from
multi-nucleon absorption processes and hyperon decays are expected to be kinematically
discriminated from the KNN signal. The semi-inclusive forward neutron spectrum in the
E15 experiment has a long sub-threshold tail reaching ∼ 100 MeV below the KNN threshold,
but no significant structure was seen in the deeply-bound region [21].
†deceased
2/12
In this paper, we present a study of the K− +3 He reaction at pK− = 1 GeV/c focusing
on the Λp invariant mass spectrum, in particular on the Λpn final state for the May 2013
data.
2. The Experimental apparatus Here, the experimental apparatus relevant to the Λpn
study is briefly described. The ongoing experiment is being conducted at the J-PARC 30
GeV syncrotron (MR). In May 2013, typical beam intensity of the primary proton beam in
MR was 30 × 1012 per spill, where spill length was 2 seconds with a 6 second repetition cycle.
A high intensity proton beam from MR impinges on a gold target, and 1 GeV/c K−s are
selected by the K1.8BR beamline spectrometer and purified with an electrostatic separator.
The typical K−/π ratio was 0.45. At the online trigger level, K−s are selected with an
Aerogel Cherenkov counter. The purity of the K− at this level, determined by time-of-flight
(ToF) analysis, was 99 %, with an intensity of 1.5 × 10⁵ per spill. The momentum resolution
of the beamline spectrometer is (2.0 ± 0.5) × 10−3 with an absolute precision of 2 MeV/c
at 1 GeV/c. A more detailed description can be found in [22].
3He target cell
Kaon beam direction
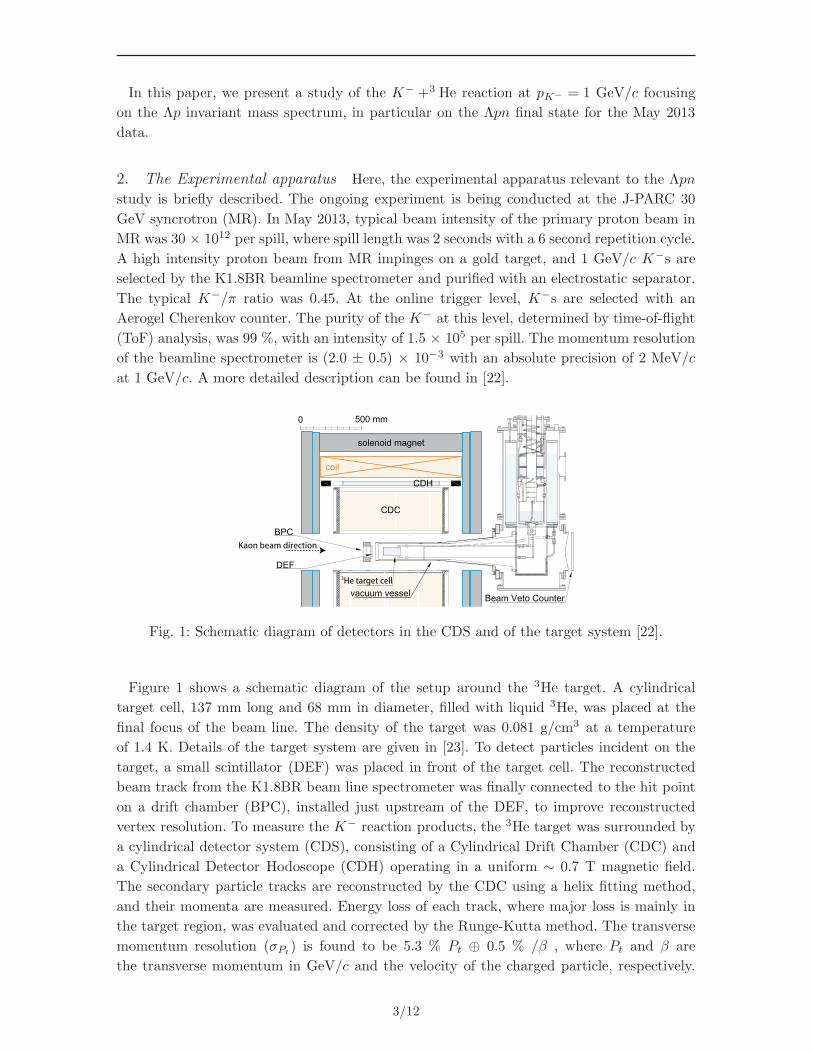
Fig. 1: Schematic diagram of detectors in the CDS and of the target system [22].
Figure 1 shows a schematic diagram of the setup around the 3He target. A cylindrical
target cell, 137 mm long and 68 mm in diameter, filled with liquid 3He, was placed at the
final focus of the beam line. The density of the target was 0.081 g/cm3 at a temperature
of 1.4 K. Details of the target system are given in [23]. To detect particles incident on the
target, a small scintillator (DEF) was placed in front of the target cell. The reconstructed
beam track from the K1.8BR beam line spectrometer was finally connected to the hit point
on a drift chamber (BPC), installed just upstream of the DEF, to improve reconstructed
vertex resolution. To measure the K− reaction products, the 3He target was surrounded by
a cylindrical detector system (CDS), consisting of a Cylindrical Drift Chamber (CDC) and
a Cylindrical Detector Hodoscope (CDH) operating in a uniform ∼ 0.7 T magnetic field.
The secondary particle tracks are reconstructed by the CDC using a helix fitting method,
and their momenta are measured. Energy loss of each track, where major loss is mainly in
the target region, was evaluated and corrected by the Runge-Kutta method. The transverse
momentum resolution (σPt) is found to be 5.3 % Pt ⊕ 0.5 % /β , where Pt and β are
the transverse momentum in GeV/c and the velocity of the charged particle, respectively.
3/12
Particle identification (PID) was performed based on the ToF between incoming kaon timing
and the CDH. Details of the CDS detectors are also described in [22].
The data acquisition (DAQ) trigger signal was generated by a kaon in the beamline spec-
trometer, a hit on the DEF counter, and two or more charged-particle hits in the CDH. The
trigger rate was typically ∼ 103 per spill with a DAQ live time of ∼80 %. During the May
2013 run period of ∼ 90 hours, data corresponding to 3.4 × 10⁹ effective kaons on the 3He
target were accumulated and used in the following analysis.
3. Analysis The Λpn final state was identified by establishing that the π−p pair came
from the Λ decay following detection of two protons and one negative pion in the CDS.
The missing neutron was identified kinematically. To reconstruct the Λp tracks in the CDS,
precise PID was performed based on a mass calculation using the momentum of the recon-
structed track along with the CDH-based ToF information. Energy loss corrections based on
properties of the inner CDC materials yielded improved PID functions and permitted more
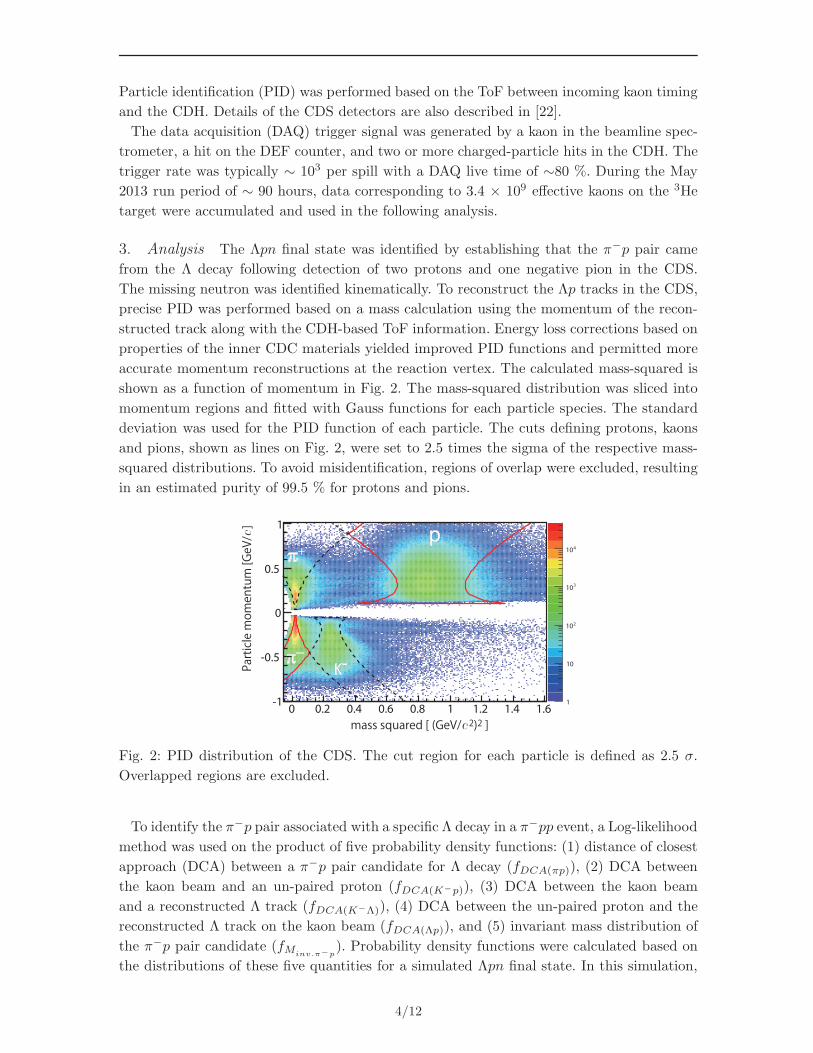
accurate momentum reconstructions at the reaction vertex. The calculated mass-squared is
shown as a function of momentum in Fig. 2. The mass-squared distribution was sliced into
momentum regions and fitted with Gauss functions for each particle species. The standard
deviation was used for the PID function of each particle. The cuts defining protons, kaons
and pions, shown as lines on Fig. 2, were set to 2.5 times the sigma of the respective mass-
squared distributions. To avoid misidentification, regions of overlap were excluded, resulting
in an estimated purity of 99.5 % for protons and pions.
0 0.2 0.4 0.6 0.8 1 1.2 1.4 1.6-1
-0.5
0
0.5
1
1
10
210
310
410
Part
icle
mom
entu
m [G
eV/c
]
mass squared [ (GeV/c2)2 ]
pp
π−π−
K-K-
π+π+
Fig. 2: PID distribution of the CDS. The cut region for each particle is defined as 2.5 σ.
Overlapped regions are excluded.
To identify the π−p pair associated with a specific Λ decay in a π−pp event, a Log-likelihood
method was used on the product of five probability density functions: (1) distance of closest
approach (DCA) between a π−p pair candidate for Λ decay (fDCA(πp)), (2) DCA between
the kaon beam and an un-paired proton (fDCA(K−p)), (3) DCA between the kaon beam
and a reconstructed Λ track (fDCA(K−Λ)), (4) DCA between the un-paired proton and the
reconstructed Λ track on the kaon beam (fDCA(Λp)), and (5) invariant mass distribution of
the π−p pair candidate (fMinv.π−p
). Probability density functions were calculated based on
the distributions of these five quantities for a simulated Λpn final state. In this simulation,
4/12
we assume a flat distribution (S-wave) over the three-body phase space based on the phase
volume, namely:
d2σ3NA(Λpn)
dT CMn d cos θCM
n
∝ ρ3 (Λpn) , (1)
where σ3NA(Λpn) is the simulated event distribution for the Λpn final state, T CMn is the
kinetic energy of the neutron in the CM frame, and cos θCMn is the neutron emission angle
in the CM frame. GEANT4 [24] is utilized to take into account geometrical information for
all detectors and their resolution for all simulations.
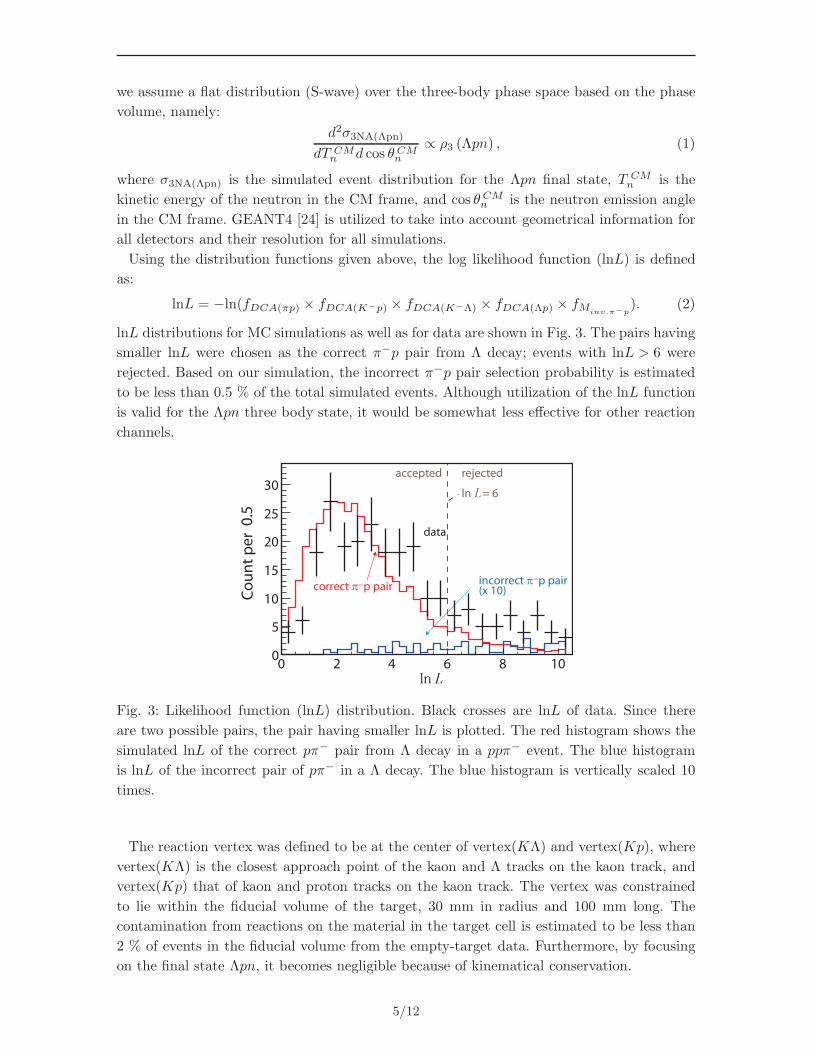
Using the distribution functions given above, the log likelihood function (lnL) is defined
as:
lnL = −ln(fDCA(πp) × fDCA(K−p) × fDCA(K−Λ) × fDCA(Λp) × fMinv.π−p
). (2)
lnL distributions for MC simulations as well as for data are shown in Fig. 3. The pairs having
smaller lnL were chosen as the correct π−p pair from Λ decay; events with lnL > 6 were
rejected. Based on our simulation, the incorrect π−p pair selection probability is estimated
to be less than 0.5 % of the total simulated events. Although utilization of the lnL function
is valid for the Λpn three body state, it would be somewhat less effective for other reaction
channels.
0 2 4 6 8 100
5
10
15
20
25
30
ln L
correct π−p pairincorrect π−p pair (x 10)
data
accepted rejected
Co
un
t p
er
0.5
ln L= 6
Fig. 3: Likelihood function (lnL) distribution. Black crosses are lnL of data. Since there
are two possible pairs, the pair having smaller lnL is plotted. The red histogram shows the
simulated lnL of the correct pπ− pair from Λ decay in a ppπ− event. The blue histogram
is lnL of the incorrect pair of pπ− in a Λ decay. The blue histogram is vertically scaled 10
times.
The reaction vertex was defined to be at the center of vertex(KΛ) and vertex(Kp), where
vertex(KΛ) is the closest approach point of the kaon and Λ tracks on the kaon track, and
vertex(Kp) that of kaon and proton tracks on the kaon track. The vertex was constrained
to lie within the fiducial volume of the target, 30 mm in radius and 100 mm long. The
contamination from reactions on the material in the target cell is estimated to be less than
2 % of events in the fiducial volume from the empty-target data. Furthermore, by focusing
on the final state Λpn, it becomes negligible because of kinematical conservation.
5/12
4. Results Previous reports of an S=-1 di-baryonic state (so-called “KNN” state ) were
based on Λp invariant mass spectra [14, 15]. The present Λp invariant mass spectrum, based
on the above analysis, is shown in Fig. 4(a). There are many channels having the Λp in
the final state. To focus on the Λpn final state, the missing mass of the 3He(K−,Λp)Xmiss.
reaction was calculated kinematically. A neutron peak is clearly seen as shown in Fig. 4(b).
The resolution of the Λp invariant mass Minv.Λp, and of the missing mass M(Xmiss.) were
10 MeV at Minv.Λp ∼ 2.37 GeV/c2 and 40 MeV at M(Xmiss.) ∼ 0.94 GeV/c2, respec-
tively. To estimate the purity of our Λpn event selection, we applied a “multi-channel global
fit” simultaneously to the Λp invariant mass and the missing mass spectra, with simulated
physics processes which might contribute to these two spectra, namely multi-nucleon kaon
absorption with multi-pion emission. We denoted each process as 2NA(Y NNs +#nπ) and
3NA(Y NN +#nπ), where Y is a Λ or Σ0, N is a nucleon, Ns is a spectator nucleon, and
#n is the number of pions. For simplicity, we haven’t taken into account for the final state
interaction. In this simulation, we assumed that particles in the final state are distributed
proportionally to the phase space volume in the same way as given in Eq. 1.
d2σ(Y NN+#nπ)
dT CMn d cos θCM
n
∝ ρ3+#n (Y NN +#nπ) . (3)
If there is a spectator nucleon, the Fermi momentum distribution is considered to reproduce
the 3He(e, e′p) result [25]. The generated events were converted to the event data format, and
examined with the same analysis routine applied for the real data. A list of physics processes,
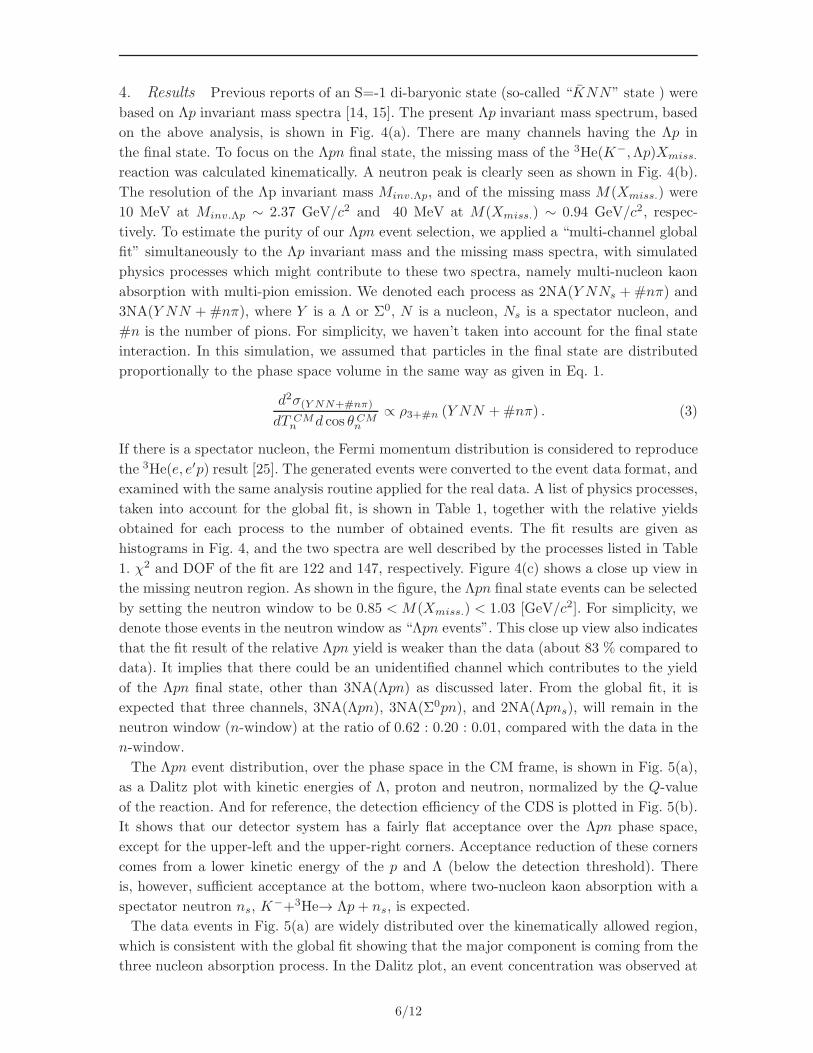
taken into account for the global fit, is shown in Table 1, together with the relative yields
obtained for each process to the number of obtained events. The fit results are given as
histograms in Fig. 4, and the two spectra are well described by the processes listed in Table
1. χ2 and DOF of the fit are 122 and 147, respectively. Figure 4(c) shows a close up view in
the missing neutron region. As shown in the figure, the Λpn final state events can be selected
by setting the neutron window to be 0.85 < M(Xmiss.) < 1.03 [GeV/c2]. For simplicity, we
denote those events in the neutron window as “Λpn events”. This close up view also indicates
that the fit result of the relative Λpn yield is weaker than the data (about 83 % compared to
data). It implies that there could be an unidentified channel which contributes to the yield
of the Λpn final state, other than 3NA(Λpn) as discussed later. From the global fit, it is
expected that three channels, 3NA(Λpn), 3NA(Σ0pn), and 2NA(Λpns), will remain in the
neutron window (n-window) at the ratio of 0.62 : 0.20 : 0.01, compared with the data in the
n-window.
The Λpn event distribution, over the phase space in the CM frame, is shown in Fig. 5(a),
as a Dalitz plot with kinetic energies of Λ, proton and neutron, normalized by the Q-value
of the reaction. And for reference, the detection efficiency of the CDS is plotted in Fig. 5(b).
It shows that our detector system has a fairly flat acceptance over the Λpn phase space,
except for the upper-left and the upper-right corners. Acceptance reduction of these corners
comes from a lower kinetic energy of the p and Λ (below the detection threshold). There
is, however, sufficient acceptance at the bottom, where two-nucleon kaon absorption with a
spectator neutron ns, K−+3He→ Λp+ ns, is expected.
The data events in Fig. 5(a) are widely distributed over the kinematically allowed region,
which is consistent with the global fit showing that the major component is coming from the
three nucleon absorption process. In the Dalitz plot, an event concentration was observed at
6/12
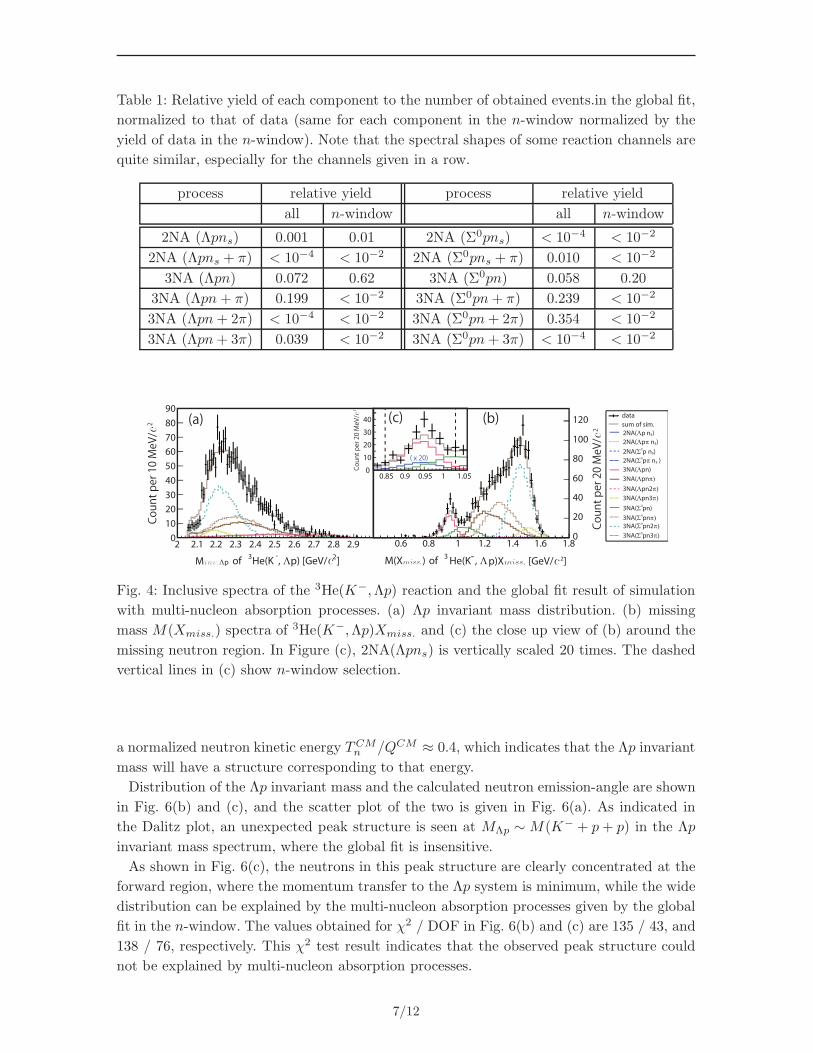
Table 1: Relative yield of each component to the number of obtained events.in the global fit,
normalized to that of data (same for each component in the n-window normalized by the
yield of data in the n-window). Note that the spectral shapes of some reaction channels are
quite similar, especially for the channels given in a row.
process relative yield process relative yield
all n-window all n-window
2NA (Λpns) 0.001 0.01 2NA (Σ0pns) < 10−4 < 10−2
2NA (Λpns + π) < 10−4 < 10−2 2NA (Σ0pns + π) 0.010 < 10−2
3NA (Λpn) 0.072 0.62 3NA (Σ0pn) 0.058 0.20
3NA (Λpn + π) 0.199 < 10−2 3NA (Σ0pn+ π) 0.239 < 10−2
3NA (Λpn+ 2π) < 10−4 < 10−2 3NA (Σ0pn+ 2π) 0.354 < 10−2
3NA (Λpn+ 3π) 0.039 < 10−2 3NA (Σ0pn+ 3π) < 10−4 < 10−2
]2p) [GeV/cΛ, -
He(K3
of Minv.Λp
2 2.1 2.2 2.3 2.4 2.5 2.6 2.7 2.8 2.90
10
20
30
40
50
60
70
80
90
p)Xmiss. [GeV/c2]Λ, He(K-3of M(Xmiss.)
0.6 0.8 1 1.2 1.4 1.6 1.80
20
40
60
80
100
120
Coun
t per 10 MeV
/c2
Coun
t per 20 MeV
/c2
0.85 0.9 0.95 1 1.050
10
20
30
40
Coun
t per 20 MeV
/c2
2NA(Λpπ ns)
2NA(Σ0p ns)
2NA(Σ0pπ ns )
3NA(Λpn)
3NA(Λpnπ)
3NA(Λpn2π)
3NA(Λpn3π)
3NA(Σ0pn)
3NA(Σ0pnπ)
3NA(Σ0pn2π)
3NA(Σ0pn3π)
data
sum of sim.
2NA(Λp ns)
(a) (b)(c)
( x 20)
Fig. 4: Inclusive spectra of the 3He(K−,Λp) reaction and the global fit result of simulation
with multi-nucleon absorption processes. (a) Λp invariant mass distribution. (b) missing
mass M(Xmiss.) spectra of 3He(K−,Λp)Xmiss. and (c) the close up view of (b) around the
missing neutron region. In Figure (c), 2NA(Λpns) is vertically scaled 20 times. The dashed
vertical lines in (c) show n-window selection.
a normalized neutron kinetic energy TCMn /QCM ≈ 0.4, which indicates that the Λp invariant
mass will have a structure corresponding to that energy.
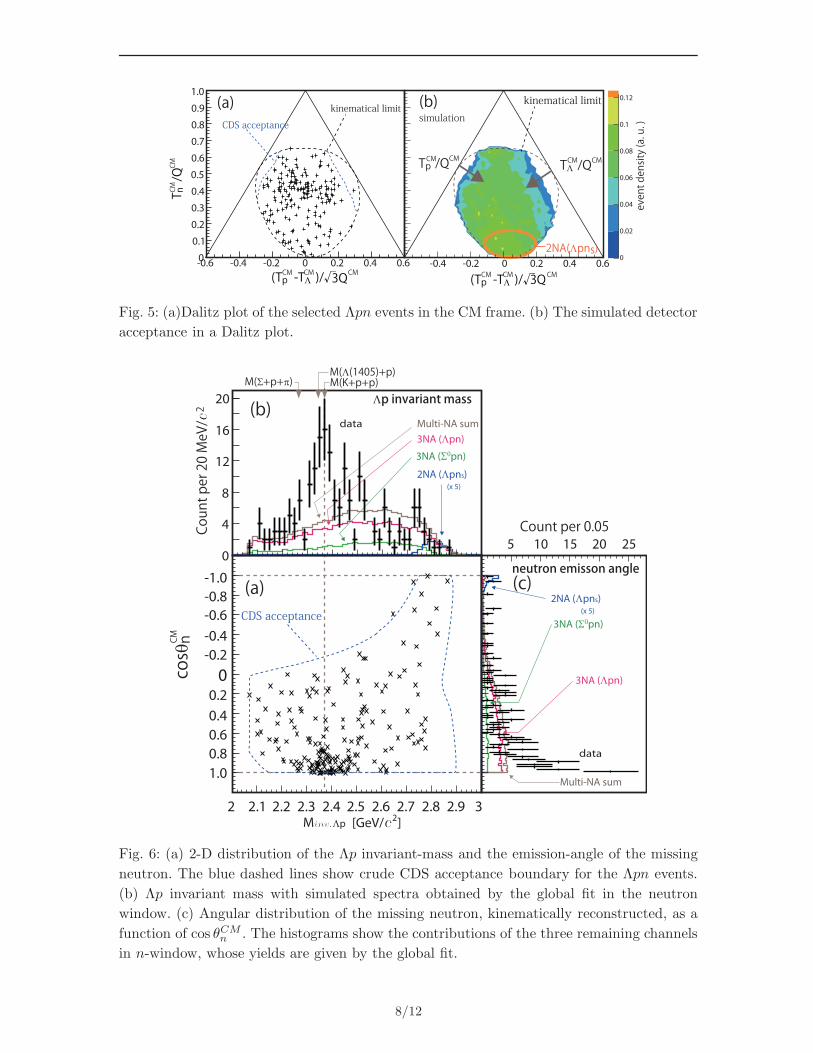
Distribution of the Λp invariant mass and the calculated neutron emission-angle are shown
in Fig. 6(b) and (c), and the scatter plot of the two is given in Fig. 6(a). As indicated in
the Dalitz plot, an unexpected peak structure is seen at MΛp ∼ M(K− + p+ p) in the Λp
invariant mass spectrum, where the global fit is insensitive.
As shown in Fig. 6(c), the neutrons in this peak structure are clearly concentrated at the
forward region, where the momentum transfer to the Λp system is minimum, while the wide
distribution can be explained by the multi-nucleon absorption processes given by the global
fit in the n-window. The values obtained for χ2 / DOF in Fig. 6(b) and (c) are 135 / 43, and
138 / 76, respectively. This χ2 test result indicates that the observed peak structure could
not be explained by multi-nucleon absorption processes.
7/12
-0.6 -0.4 -0.2 0 0.2 0.4 0.60
0.1
0.2
0.3
0.4
0.5
0.6
0.7
0.8
0.9 kinematical limit
1.0
0
0.02
0.04
0.06
0.08
0.1
0.12
-0.4 -0.2 0 0.2 0.4 0.6
kinematical limit
(Tp -TΛ )/√
2NA(Λpns)
3Q
Tp /Q TΛ /Q
even
t den
sity
(a. u
. )
simulation(b)
CM CM
CMCM (Tp -TΛ )/√ 3QCMCM
T n /
QCM
(a)CDS acceptance
CM
CM CM
CM CM
Fig. 5: (a)Dalitz plot of the selected Λpn events in the CM frame. (b) The simulated detector
acceptance in a Dalitz plot.
cosθ
n
0
4
8
12
16
20
M(K+p+p)M(Λ(1405)+p)
M(Σ+p+π)
3NA (Λpn)
3NA (Σ0pn)
2NA (Λpns)
data Multi-NA sum
Cou
nt per 20 MeV
/c2 (b)
(x 5)
Λp invariant mass
CM
-0.8
-0.6
-0.4
-0.2
00.2
0.4
0.6
0.8
(c)
2 2.1 2.2 2.3 2.4 2.5 2.6 2.7 2.8 2.9]2 [GeV/c Minv.Λp
Count per 0.05
neutron emisson angle
3NA (Λpn)
3NA (Σ0pn)
2NA (Λpns)
Multi-NA sum
(x 5)
data
(a)
5 10 15 20 25
3
1.0
-1.0
CDS acceptance
Fig. 6: (a) 2-D distribution of the Λp invariant-mass and the emission-angle of the missing
neutron. The blue dashed lines show crude CDS acceptance boundary for the Λpn events.
(b) Λp invariant mass with simulated spectra obtained by the global fit in the neutron
window. (c) Angular distribution of the missing neutron, kinematically reconstructed, as a
function of cos θCMn . The histograms show the contributions of the three remaining channels
in n-window, whose yields are given by the global fit.
8/12
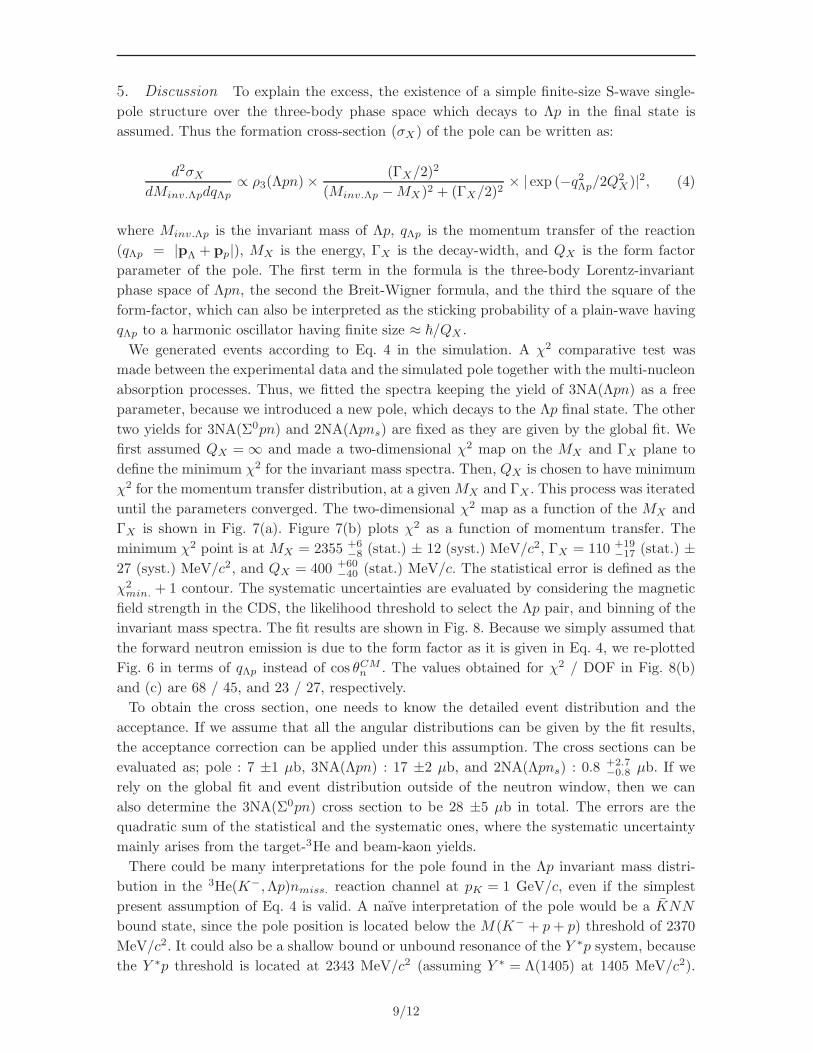
5. Discussion To explain the excess, the existence of a simple finite-size S-wave single-
pole structure over the three-body phase space which decays to Λp in the final state is
assumed. Thus the formation cross-section (σX) of the pole can be written as:
d2σX
dMinv.ΛpdqΛp
∝ ρ3(Λpn)×(ΓX/2)2
(Minv.Λp −MX)2 + (ΓX/2)2× | exp (−q2Λp/2Q
2X)|2, (4)
where Minv.Λp is the invariant mass of Λp, qΛp is the momentum transfer of the reaction
(qΛp = |pΛ + pp|), MX is the energy, ΓX is the decay-width, and QX is the form factor
parameter of the pole. The first term in the formula is the three-body Lorentz-invariant
phase space of Λpn, the second the Breit-Wigner formula, and the third the square of the
form-factor, which can also be interpreted as the sticking probability of a plain-wave having
qΛp to a harmonic oscillator having finite size ≈ ~/QX .
We generated events according to Eq. 4 in the simulation. A χ2 comparative test was
made between the experimental data and the simulated pole together with the multi-nucleon
absorption processes. Thus, we fitted the spectra keeping the yield of 3NA(Λpn) as a free
parameter, because we introduced a new pole, which decays to the Λp final state. The other
two yields for 3NA(Σ0pn) and 2NA(Λpns) are fixed as they are given by the global fit. We
first assumed QX = ∞ and made a two-dimensional χ2 map on the MX and ΓX plane to
define the minimum χ2 for the invariant mass spectra. Then, QX is chosen to have minimum
χ2 for the momentum transfer distribution, at a given MX and ΓX . This process was iterated
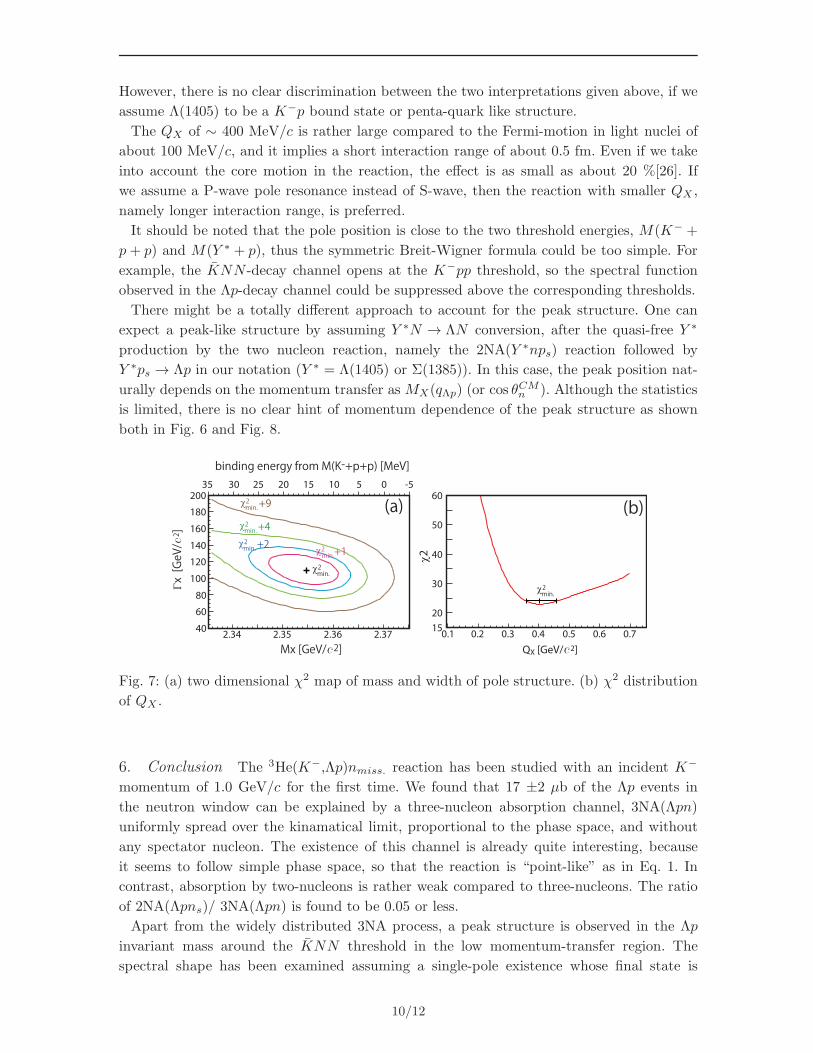
until the parameters converged. The two-dimensional χ2 map as a function of the MX and
ΓX is shown in Fig. 7(a). Figure 7(b) plots χ2 as a function of momentum transfer. The
minimum χ2 point is at MX = 2355 +6−8 (stat.) ± 12 (syst.) MeV/c2, ΓX = 110 +19
−17 (stat.) ±
27 (syst.) MeV/c2, and QX = 400 +60−40 (stat.) MeV/c. The statistical error is defined as the
χ2min. + 1 contour. The systematic uncertainties are evaluated by considering the magnetic
field strength in the CDS, the likelihood threshold to select the Λp pair, and binning of the
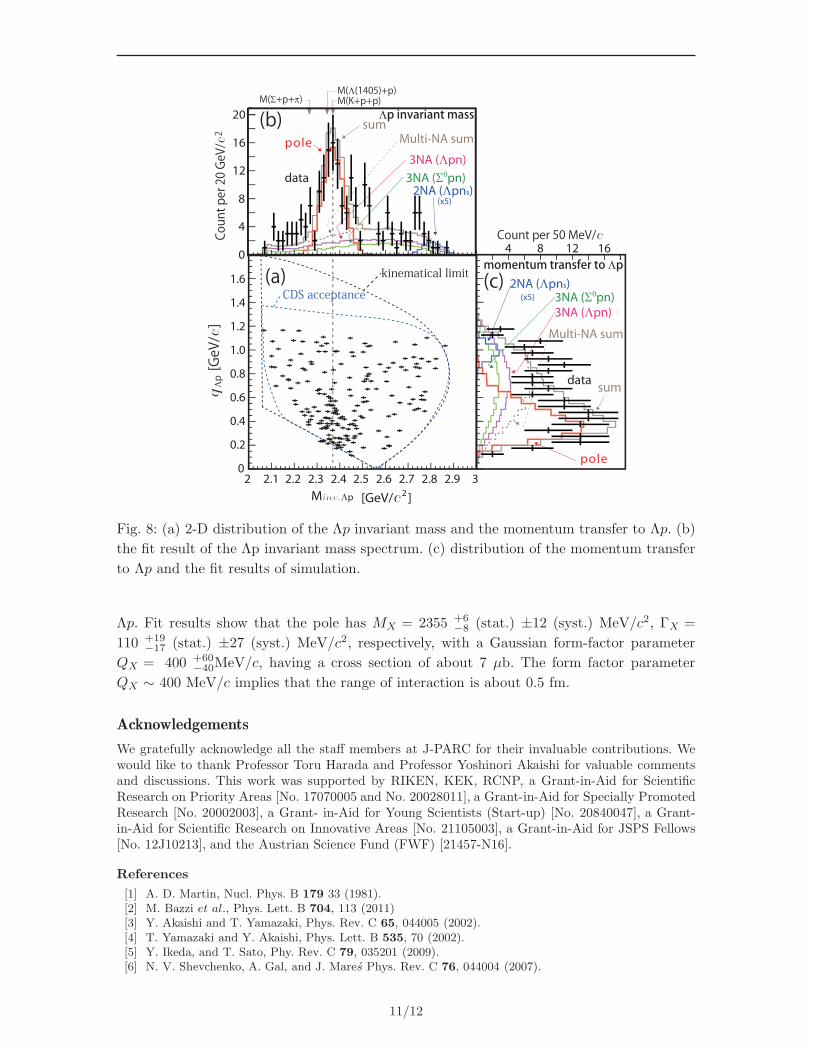
invariant mass spectra. The fit results are shown in Fig. 8. Because we simply assumed that
the forward neutron emission is due to the form factor as it is given in Eq. 4, we re-plotted
Fig. 6 in terms of qΛp instead of cos θCMn . The values obtained for χ2 / DOF in Fig. 8(b)
and (c) are 68 / 45, and 23 / 27, respectively.
To obtain the cross section, one needs to know the detailed event distribution and the
acceptance. If we assume that all the angular distributions can be given by the fit results,
the acceptance correction can be applied under this assumption. The cross sections can be
evaluated as; pole : 7 ±1 µb, 3NA(Λpn) : 17 ±2 µb, and 2NA(Λpns) : 0.8 +2.7−0.8 µb. If we
rely on the global fit and event distribution outside of the neutron window, then we can
also determine the 3NA(Σ0pn) cross section to be 28 ±5 µb in total. The errors are the
quadratic sum of the statistical and the systematic ones, where the systematic uncertainty
mainly arises from the target-3He and beam-kaon yields.
There could be many interpretations for the pole found in the Λp invariant mass distri-
bution in the 3He(K−,Λp)nmiss. reaction channel at pK = 1 GeV/c, even if the simplest
present assumption of Eq. 4 is valid. A naıve interpretation of the pole would be a KNN
bound state, since the pole position is located below the M(K− + p+ p) threshold of 2370
MeV/c2. It could also be a shallow bound or unbound resonance of the Y ∗p system, because
the Y ∗p threshold is located at 2343 MeV/c2 (assuming Y ∗ = Λ(1405) at 1405 MeV/c2).
9/12
However, there is no clear discrimination between the two interpretations given above, if we
assume Λ(1405) to be a K−p bound state or penta-quark like structure.
The QX of ∼ 400 MeV/c is rather large compared to the Fermi-motion in light nuclei of
about 100 MeV/c, and it implies a short interaction range of about 0.5 fm. Even if we take
into account the core motion in the reaction, the effect is as small as about 20 %[26]. If
we assume a P-wave pole resonance instead of S-wave, then the reaction with smaller QX ,
namely longer interaction range, is preferred.
It should be noted that the pole position is close to the two threshold energies, M(K− +
p+ p) and M(Y ∗ + p), thus the symmetric Breit-Wigner formula could be too simple. For
example, the KNN -decay channel opens at the K−pp threshold, so the spectral function
observed in the Λp-decay channel could be suppressed above the corresponding thresholds.
There might be a totally different approach to account for the peak structure. One can
expect a peak-like structure by assuming Y ∗N → ΛN conversion, after the quasi-free Y ∗
production by the two nucleon reaction, namely the 2NA(Y ∗nps) reaction followed by
Y ∗ps → Λp in our notation (Y ∗ = Λ(1405) or Σ(1385)). In this case, the peak position nat-
urally depends on the momentum transfer as MX(qΛp) (or cos θCMn ). Although the statistics
is limited, there is no clear hint of momentum dependence of the peak structure as shown
both in Fig. 6 and Fig. 8.
35 30 25 20 15 10 5 0
40
60
80
100
120
140
160
180
200
Mx [GeV/c2]
Γx
[GeV
/c2 ]
binding energy from M(K-+p+p) [MeV]
2.34 2.35 2.36 2.37
(a)-5
χ2 min.
χ2 +1min.
χ2 +2min.
χ2 +4min.
χ2 +9min.
0.1 0.2 0.3 0.4 0.5 0.6 0.715
20
30
40
50
60
QX [GeV/c2]
χ2
(b)
χ2 min.
Fig. 7: (a) two dimensional χ2 map of mass and width of pole structure. (b) χ2 distribution
of QX .
6. Conclusion The 3He(K−,Λp)nmiss. reaction has been studied with an incident K−
momentum of 1.0 GeV/c for the first time. We found that 17 ±2 µb of the Λp events in
the neutron window can be explained by a three-nucleon absorption channel, 3NA(Λpn)
uniformly spread over the kinamatical limit, proportional to the phase space, and without
any spectator nucleon. The existence of this channel is already quite interesting, because
it seems to follow simple phase space, so that the reaction is “point-like” as in Eq. 1. In
contrast, absorption by two-nucleons is rather weak compared to three-nucleons. The ratio
of 2NA(Λpns)/ 3NA(Λpn) is found to be 0.05 or less.
Apart from the widely distributed 3NA process, a peak structure is observed in the Λp
invariant mass around the KNN threshold in the low momentum-transfer region. The
spectral shape has been examined assuming a single-pole existence whose final state is
10/12
4 8 12 160
4
8
12
16
20
Coun
t per 20 Ge
V/c2
qΛp [G
eV/c]
Count per 50 MeV/c
(b)
3NA (Λpn)
3NA (Σ0pn)2NA (Λpns)
data
sum Multi-NA sumpole
Λp invariant mass
momentum transfer to Λp
M(K+p+p)M(Λ(1405)+p)
M(Σ+p+π)
3NA (Λpn) 3NA (Σ0pn)
2NA (Λpns)
datasum
Multi-NA sum
pole
(x5)
(x5)
0.8
0.2
0
0.4
0.6
1.0
1.2
1.6
1.4
]2 [GeV/cMinv.Λp
2 2.1 2.2 2.3 2.4 2.5 2.6 2.7 2.8 2.9 3
kinematical limit (c)(a)CDS acceptance
Fig. 8: (a) 2-D distribution of the Λp invariant mass and the momentum transfer to Λp. (b)
the fit result of the Λp invariant mass spectrum. (c) distribution of the momentum transfer
to Λp and the fit results of simulation.
Λp. Fit results show that the pole has MX = 2355 +6−8 (stat.) ±12 (syst.) MeV/c2, ΓX =
110 +19−17 (stat.) ±27 (syst.) MeV/c2, respectively, with a Gaussian form-factor parameter
QX = 400 +60−40MeV/c, having a cross section of about 7 µb. The form factor parameter
QX ∼ 400 MeV/c implies that the range of interaction is about 0.5 fm.
Acknowledgements
We gratefully acknowledge all the staff members at J-PARC for their invaluable contributions. Wewould like to thank Professor Toru Harada and Professor Yoshinori Akaishi for valuable commentsand discussions. This work was supported by RIKEN, KEK, RCNP, a Grant-in-Aid for ScientificResearch on Priority Areas [No. 17070005 and No. 20028011], a Grant-in-Aid for Specially PromotedResearch [No. 20002003], a Grant- in-Aid for Young Scientists (Start-up) [No. 20840047], a Grant-in-Aid for Scientific Research on Innovative Areas [No. 21105003], a Grant-in-Aid for JSPS Fellows[No. 12J10213], and the Austrian Science Fund (FWF) [21457-N16].
References
[1] A. D. Martin, Nucl. Phys. B 179 33 (1981).[2] M. Bazzi et al., Phys. Lett. B 704, 113 (2011)[3] Y. Akaishi and T. Yamazaki, Phys. Rev. C 65, 044005 (2002).[4] T. Yamazaki and Y. Akaishi, Phys. Lett. B 535, 70 (2002).[5] Y. Ikeda, and T. Sato, Phy. Rev. C 79, 035201 (2009).[6] N. V. Shevchenko, A. Gal, and J. Mares Phys. Rev. C 76, 044004 (2007).
11/12
[7] S. Wycech, and A. M. Green , Phys. Rev. C 79, 014001 (2009).[8] A. Dote, T. Hyodo, and W. Weise, Phys. Rev. C 79, 014003 (2009).[9] Y. Ikeda, and T. Sato, Phys. Rev. C 79, 035201 (2009).
[10] S. Maeda, Y. Akaishi, and T.Yamazaki, Proc. Jpn. Acard., Ser. B 89, 418 (2013).[11] J. Revai, and N. V. Shevchenko, Phys. Rev. C 90, 034004 (2014).[12] Y. Ikeda, H. Kamano, and T. Sato, prog. Theor. Phsy. 124 533 (2010).[13] N. Barnea, A. Gal, and E. Z. Liverts, Phys. Lett. B 712 132 (2012).[14] M. Agnello et al., Phys. Rev. Lett. 94, 212303 (2005).[15] T. Yamazaki et al., Phys. Rev. Lett. 104, 132502 (2010).[16] Y. Ichikawa et al., Prog. Theor. Exp. Phys. 021D01 (2015).[17] A. O. Tokiyasu et al., Phys.Lett. B 728, 616 (2014).[18] L. Fabbietti et al., Nucl. Phys. A 914, 60 (2013).[19] O. Vazquez et al., arXiv:nucl-ex/1511.04496.[20] A. Filippi and S. Piano Hyperfine Interact 233, 151 (2015).[21] T. Hashimoto(E15 collaboration)., Prog. Theor. Exp. Phys. 061D01 (2015).[22] K. Agari et al., Prog. Theor. Exp. Phys. 02B011 (2012).[23] M.Iio etal., Nucl. Inst. and Meth. A 687 1 (2012).[24] S. Agostinelli et al., (GEANT4 Collaboration), Nucl. Instrum. Meth. A 506, 250 (2003).[25] P. Barreau et al., Phys. Rev. Lett. 49, 974 (1982).[26] T. Harada, Private communication (2016).
12/12


![Introductiongeatti/type4.pdfIn order to prove the above theorems, we embed X as a K-invariant domain in its Stein universal KC-globalization X (see Heinzner [He], Thm.6.6). If K has](https://static.fdocument.org/doc/165x107/5f085dfd7e708231d421a8bb/introduction-geattitype4pdf-in-order-to-prove-the-above-theorems-we-embed-x-as.jpg)