STRUCTURE & CALCULATION OF A GAS FLAME · STRUCTURE & CALCULATION OF A GAS FLAME ... Calculation of...
69
Y.V. Kryzhanovsky V.N. Kryzhanovsky STRUCTURE & CALCULATION OF A GAS FLAME 539.91.01 Translated by author from Russian Kyiv 2012
Transcript of STRUCTURE & CALCULATION OF A GAS FLAME · STRUCTURE & CALCULATION OF A GAS FLAME ... Calculation of...
Y.V. Kryzhanovsky V.N. Kryzhanovsky
STRUCTURE & CALCULATION OF
A GAS FLAME
539.91.01
Translated by author from Russian
Kyiv
2012
2
539.91.01
24.54
K 85
Kryzhanovsky Y.V.
Structure and calculation of a gas flame: monography/ Y.V. Kryzhanovsky, V. N. Kryzhanovsky. –
Kyiv, Ukraine, 2012.
ISBN 978-966-188-200-2
The basic concepts and constants of gas burning have been defined. The mathematical
apparatus for calculation of the characteristics of a gas flame to organize combustion process have
been presented. The structure of a gas flame and the structure of a flame front were considered.
Independence of structure of a flame front from turbulence was proved. The experimental results
which were laid down in the base of phenomenological combustion theory of gases were presented.
The book is intended for the researchers and the engineers working on combustion, and can be
used as the education guidance.
Yuri Kryzhanovsky
01135, Kyiv, Peremogy ave., 16-34
+380 44 243 04 50
+380 67 465 27 92
3
TABLE OF CONTENTS
Preface …………………………………………………………………….. 3
Legend …………………………………………………………………….. 4
1. Definition of a subject of inquiry and its phenomenological properties ….. 5
2. Laminar flame …………………………………………………………… 7
3. Turbulent flame ………………………………………………………….. 8
4. Demonstration of the independence of chemical kinetics and combustion
constants on turbulent characteristics at homogenous mixture burning…...
9
5. Calculation of the thickness of a laminar flame front …………………… 18
6. Calculation of λn and Un for different initial parameters ………………….. 21
6.1. Comparison of the calculated thickness of a flame front with the space
characteristics of a flame ………………………………………………….
23
6.2. Physical interpretation of a Peclet number for a flame …………………… 28
7. Calculation of the peak heat density of combustion ……………………… 28
8. Calculation of length of a turbulent flame and combustion chamber ……. 30
9. Structure of the laminar flame front ……………………………………… 32
9.1. Temperature measurements on the flame front thickness ………………. 33
9.2. Measurements of LPR concentrations on the flame front thickness ……… 39
9.3. Chemical interpretation of the structure of a laminar front ……………… 43
9.4. The general combustion mechanism of hydrocarbons ……………………. 47
10. Formation of nitrogen oxides in a flame front …………………………… 49
10.1. Formation of nitrogen oxides at a stage burning of gas ………………….. 51
10.2. Definition of the minimum theoretical NОх concentration ……………….. 57
11. Stabilization of a flame and the flame-out characteristic ………………… 59
12. The microdiffusion mechanism of burning ……………………………….. 60
12.1. Structure of a microdiffusion flame ………………………………………. 60
12.2. Calculation of a microdiffusion flame ……………………………………. 65
References ………………………………………………………………… 67
4
PREFACE
The example of the combustion theory development described in this work is significant from
the point of view of the methodological optimization of cognitive processes and the precise carrying
over of these methods for the solutions of various applied problems.
In this work on the instance of combustion theory the basic technology and algorithm of
scientific researches is shown.
The interconnection of all fundamental characteristics of combustion process presented by
this theory and its practical efficiency is not only above than in existing directions, but also it gives
physically adequate picture of the nature of phenomenon and establishes laws, constants and
universal interconnections unknown earlier.
The mathematical apparatus of the new combustion theory presented here can serve as the
manual for making a database for advanced developments with the subsequent comparative
analysis.
Inconsistency of traditional directions of the theory of physical process and phenomenon is
the sufficient reason for carrying out phenomenological controversial theory. Necessity of the
development of such theory can be considered as the element of new scientific culture and ethics.
In 1964 Kryzhanovsky Vladimir Nikolayevich has initiated the investigations related to the
maximization of burning rate in the combustion chambers of gas-turbine engines. Misfit of design
techniques and computational methods to test data pointed to the necessity of carrying out
additional experiments and revising of basic positions of combustion theory of that time.
I express huge gratitude to my father, Kryzhanovsky Vladimir Nikolayevich, for the
possibility presented to me to work freely and to think freely about everything that interests me,
being assured that my interests have social and spiritual worth.
Yuri Kryzhanovsky
5
LEGEND
1. Measured and non-dimensional quantities: Pe - the Peclet number; Re - the Reynolds criterion; П - the geometrical parameter of mouth of a burner; ε - turbulization level; n - polytrope constant; nCO2 - СО2 concentration; L – the Lewis number; L0 - stoichiometrical coefficient, m
3/m
3;
S - - relative step;
α - excess-air coefficient.
2. Process Parameters: U – flame front propagation rate, m/s;
λ – a flame front thickness, m;
ω - volume intensity of combustion (specific), s-1
;
V0 - a gas mixture volume flow, m3/with;
v0 - Velocity of a gas mixture, km/s;
v, - velocity of turbulent pulsations, m3/with;
δ - gauge of crushing of moles, m;
lт - turbulence gauge.
Physical properties of substances:
Т - temperature (of gas mixture), 0C;
Тг - combustion temperature (adiabatic), 0C;
ρ – density, kg /m3;
сp - heat capacity isobaric, kJ/kg K;
a - thermal diffusivity, m2/s;
D - diffusion coefficient, m2/s;
Λ – average free length of molecules, m;
v – average velocity of molecules, m/s;
Qн - inferior heating value of gas, kJ/m3;
Qv - volume heat density of burning kW/m3;
J - diffusion current, kg/m2 s;
W - volume flow, m3/s.
Geometrical sizes:
d0 - diameter of a burner, m;
β - flame (or jet) expansion angle;
DCC - diameter of combustion chamber;
V – volume, m3;
L – length, m;
Subscripts:
n - normal;
0 - standard conditions;
L - the laminar torch;
t - a turbulent torch;
f – concerns to a torch;
cc - «a cold cone» (flame zone);
fr - flame front;
cz - combustion zone;
LP - limiting combustion product;
oz - a outlet zone of combustion chamber;
rz - a recirculation zone;
c - at combustion;
in - internal;
ex – external;
p - polytropic process.
6
1. Definition of the subject of inquiry and its phenomenological
properties
The object of combustion theory of gases is a gas flame. The flame front is a
flame part only. It follows from this that the stabile flame front takes place only in a
case when the following conditions are met: the presence of certain concentration
pattern of fuel and oxidizer, the presence of stabilization zone of a flame and the
exhaust of combustion products.
In the beginning we will consider a kinetic flame which diffusion processes of
oxidizer and fuel do not influence. It will allow to eliminate the factors not significant
from a point of view of chemical and physical kinetics of combustion. In the final
chapter a comparison of the optimal diffusion flame from technological point of view
termed a microdiffusion flame, with a kinetic flame will be made.
So, a kinetic flame (further a flame) has physical fields of different structure
located only in certain sequence and existing in unison.
A flame consists of three characteristic zones:
- flame front;
- «a cold cone»;
- a stabilization zone or a zone of reverse currents.
The stabilization zone or the zone of reverse currents is a flame part in which
formation of flame front in the concentration pattern of a gas mixture begins due to
combustion products diffusion in this zone.
The volume of a stabilization zone is a part of the first two ones simultaneously,
therefore for simplification of the further reasoning we will consider flame volume
equal to the sum of volumes of "a cold cone» and flame front.
To the phenomenological characteristics of stabilization zone we will return after
the examination of flame front structure.
The flame can be laminar or turbulent. The models of a laminar and a turbulent
flame are shown in Fig. 1.1.
7
a) b)
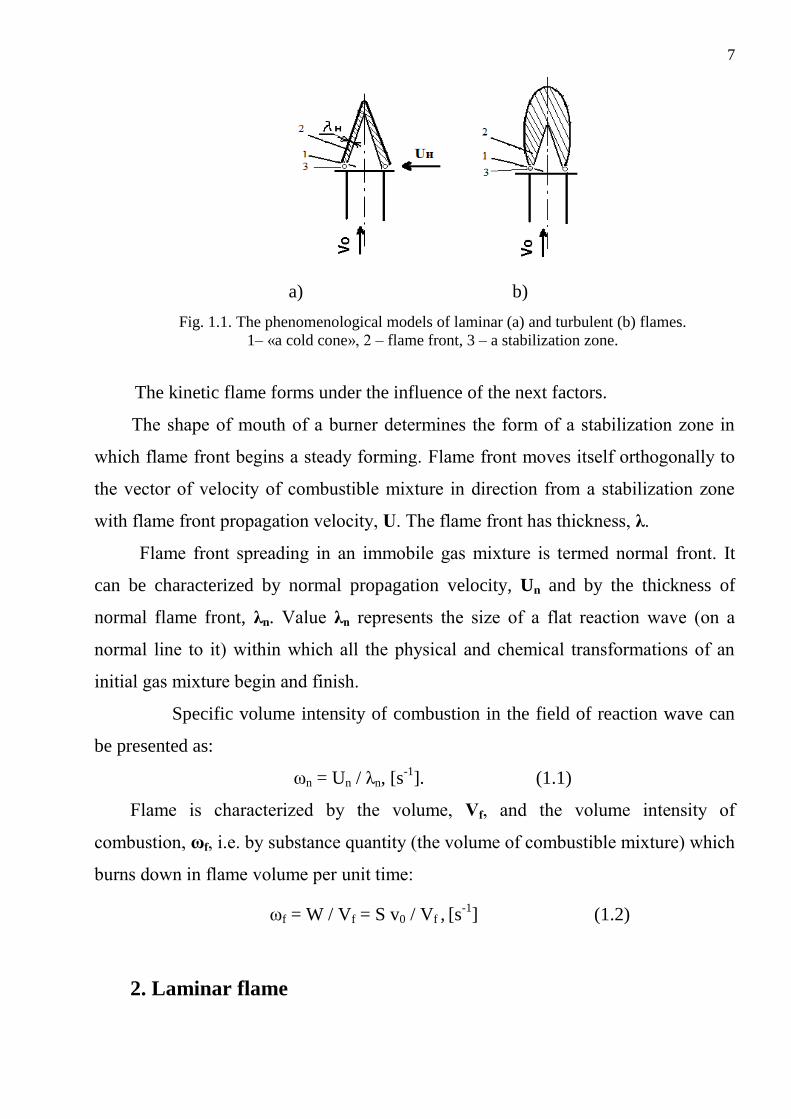
Fig. 1.1. The phenomenological models of laminar (a) and turbulent (b) flames.
1– «a cold cone», 2 – flame front, 3 – a stabilization zone.
The kinetic flame forms under the influence of the next factors.
The shape of mouth of a burner determines the form of a stabilization zone in
which flame front begins a steady forming. Flame front moves itself orthogonally to
the vector of velocity of combustible mixture in direction from a stabilization zone
with flame front propagation velocity, U. The flame front has thickness, λ.
Flame front spreading in an immobile gas mixture is termed normal front. It
can be characterized by normal propagation velocity, Un and by the thickness of
normal flame front, λn. Value λn represents the size of a flat reaction wave (on a
normal line to it) within which all the physical and chemical transformations of an
initial gas mixture begin and finish.
Specific volume intensity of combustion in the field of reaction wave can
be presented as:
ωn = Un / λn, [s-1
]. (1.1)
Flame is characterized by the volume, Vf, and the volume intensity of
combustion, ωf, i.e. by substance quantity (the volume of combustible mixture) which
burns down in flame volume per unit time:
ωf = W / Vf = S v0 / Vf , [s-1
] (1.2)
2. Laminar flame
8
At laminar current the flow speed, vо, and the geometrical form of a burner does
not influence flame front propagation rate, what explains the shape of laminar front
quantitatively. The special researches show that flame front thickness in the basic part
of length of laminar flame is constant. In the limits of accuracies of measuring,
thickness of front does not depend on laminar flow velocity, sizes and the shape of
elements of a burner. Thus the following takes place:
Un = UL = const , λn = λL = const. (2.1)
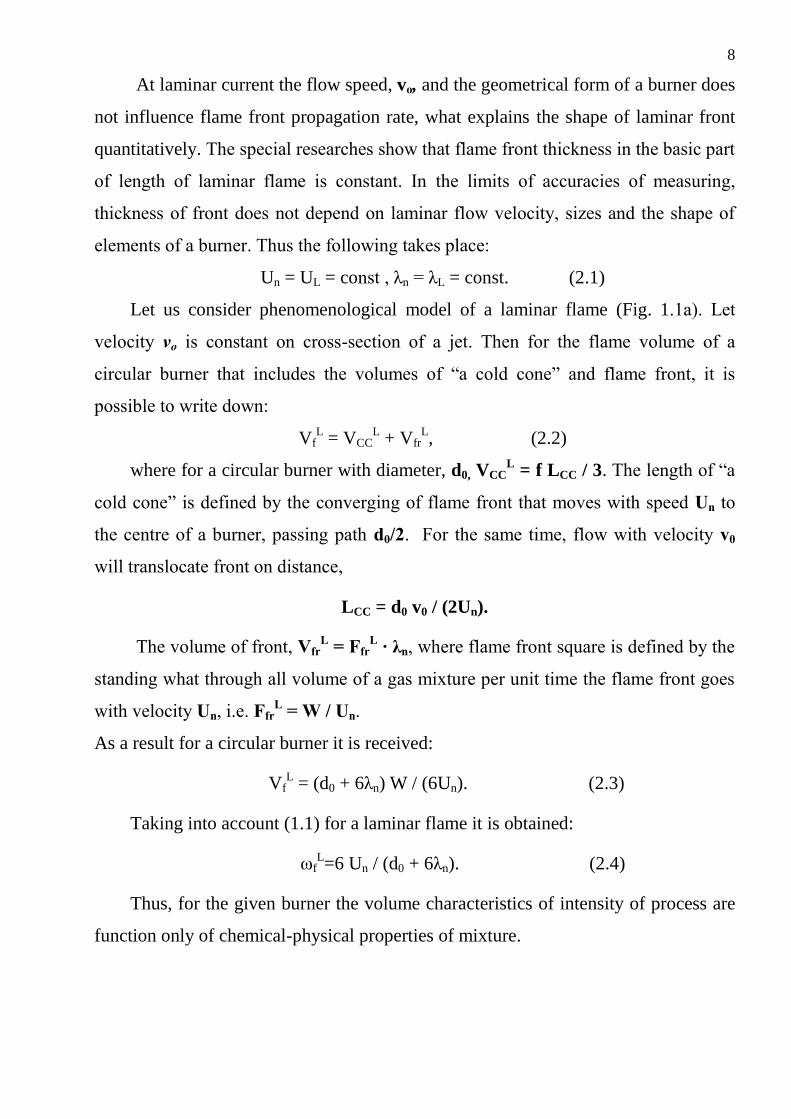
Let us consider phenomenological model of a laminar flame (Fig. 1.1а). Let
velocity vо is constant on cross-section of a jet. Then for the flame volume of a
circular burner that includes the volumes of “a cold cone” and flame front, it is
possible to write down:
VfL = VCC
L + Vfr
L, (2.2)
where for a circular burner with diameter, d0, VCCL = f LCC / 3. The length of “a
cold cone” is defined by the converging of flame front that moves with speed Un to
the centre of a burner, passing path d0/2. For the same time, flow with velocity v0
will translocate front on distance,
LCC = d0 v0 / (2Un).
The volume of front, VfrL = Ffr
L ∙ λn, where flame front square is defined by the
standing what through all volume of a gas mixture per unit time the flame front goes
with velocity Un, i.e. FfrL = W / Un.
As a result for a circular burner it is received:
VfL = (d0 + 6λn) W / (6Un). (2.3)
Taking into account (1.1) for a laminar flame it is obtained:
ωfL=6 Un / (d0 + 6λn). (2.4)
Thus, for the given burner the volume characteristics of intensity of process are
function only of chemical-physical properties of mixture.
9
Analogously, assuming for a fantail (rectangular) burner VCCL = f LCC/2, it can
be obtained: ωfL=4 Un / (d0 + 4λn).
For the burner of any shape the relation (2.2) will be written as:
ωfL=Π Un / (l + Πλn). (2.5)
In this formula l and П are geometrical parameters of a burner (l – typical
dimension of mouth of a burner; parameter П depends on the shape of a burner; so
for a circular burner П = 6, and for a fantail burner П = 4). The view of the
denominator demonstrates flame intensity never can exceed combustion rate in flame
front what follows from a process phenomenology.
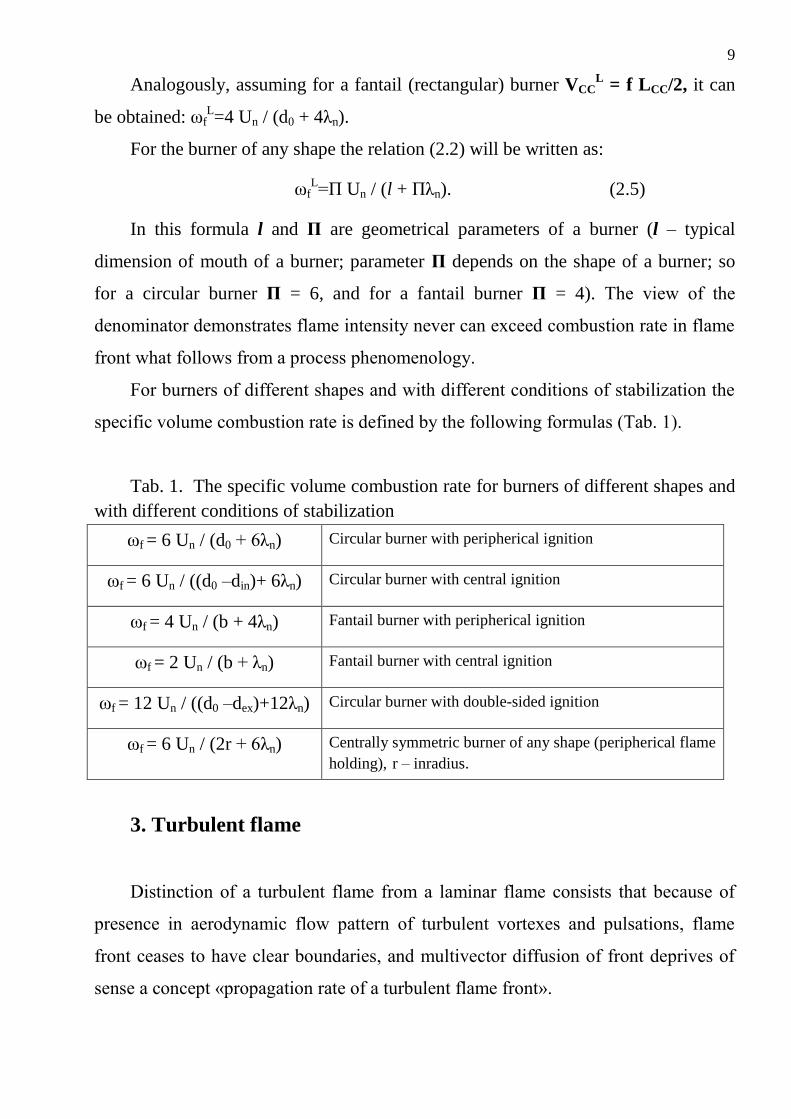
For burners of different shapes and with different conditions of stabilization the
specific volume combustion rate is defined by the following formulas (Tab. 1).
Tab. 1. The specific volume combustion rate for burners of different shapes and
with different conditions of stabilization
ωf = 6 Un / (d0 + 6λn) Circular burner with peripherical ignition
ωf = 6 Un / ((d0 –din)+ 6λn) Circular burner with central ignition
ωf = 4 Un / (b + 4λn) Fantail burner with peripherical ignition
ωf = 2 Un / (b + λn) Fantail burner with central ignition
ωf = 12 Un / ((d0 –dex)+12λn) Circular burner with double-sided ignition
ωf = 6 Un / (2r + 6λn) Centrally symmetric burner of any shape (peripherical flame
holding), r – inradius.
3. Turbulent flame
Distinction of a turbulent flame from a laminar flame consists that because of
presence in aerodynamic flow pattern of turbulent vortexes and pulsations, flame
front ceases to have clear boundaries, and multivector diffusion of front deprives of
sense a concept «propagation rate of a turbulent flame front».
10
For a turbulent flame it is univocal possible to define its specific volume
intensity, using Eq. (1.2).
Direct investigations of volume characteristics of a turbulent flame have shown
that its volume intensity, ωtf does not depend on flow velocity and turbulence
characteristics:
ωft = ωf
L = ωf = const. (3.1)
Property (3.1) expels necessity for any speculative models of turbulent
combustion at phenomenological level.
On the basis of the above-stated it is possible to rewrite Eq. (2.4) for calculation
of intensity of a turbulent flame in a view:
ωft=Π Un / (l + Πλn). (3.2)
4. Demonstration of the independence of chemical kinetics and
combustion constants on turbulent characteristics at homogenous
mixture burning
The volumetrical combustion rate in laminar and turbulent flames ωf, being most
a general characteristic of the kinetic combustion, does not depend on the flow rate, a
flow regime and the turbulence characteristics.
The quantity ωf for the given burner is defined by fundamental velocity Un and by
characteristic of normal front with the dimensionality of length, λn, the same for
burners of any shape and sizes. It will be shown this characteristic is the thickness of a
normal flame front is the fundamental characteristic of flame front and the chemical-
physical constant of a combustible mixture, as well as velocity Un.
Quantities Un and λn are related among themselves univalently through the
phenomenological characteristics of combustion process: 1) the diffusion coefficient of
a limiting product of reaction; 2) an adiabatic combustion temperature; 3) the initial
parameters of a mixture. That fact that quantity ωft is completely spotted by chemical-
physical constants Un and λn and by the geometrical parameters of a burner l and Π
11
and depends on them absolutely in the same way as ωfL, and has allowed to define
chemical-physical constants on characteristics of a turbulent flame.
From the equations (2.5) that have been written down for flames of two burners of
various diameters, we receive relations directly linking Un and λn with ωf:
Un = ωf1 ωf2 (d02 - d01)/ 6 (ωf1 – ωf2), (4.1)
λn = (ωf2 d02 – ωf1 d01)/ 6 (ωf1 – ωf2). (4.2)
Analogous relations can be received and by comparison of burners of the different
shape. But the main sense of the equations (4.1) and (4.2) consists that independence
ωf from flow regime means the same for - Un and λn.
By definition, Un and λn are the integral expression of chemical-physical
properties of a mixture displayed in chemical kinetics of combustion process, in certain
sequence and transmutation intensity of substance in normal flame front; it is
completely corresponds to their chemical-physical sense.
In view of rather great number of interdependent chemical-physical processes in
flame front and nonlinearity of their characteristics, it is absolutely impossible to admit
that effect of turbulence on detailed chemical kinetics in all cases of a variation of
parameters of turbulence is carried out in such a way that as a result we always have
integral constants.
The single conclusion here can be made: turbulent characteristics do not influence
not only chemical-physical constants, but also details of chemical kinetics.
It is naturally, that other integrated characteristics of the kinetic combustion
should not depend on turbulence characteristics.
In the light of this, that fact that flame radiation as the integral characteristic of
combustion zone, does not depend on turbulence is absolutely natural.
A flame radiates electromagnetic waves of various length and intensity, including
visible ones, depending on composition and parameters of molecules and corpuscles in
a reaction zone.
12
In [1, p. 419] the data on comparison of the light intensity radiated by the
laminar and turbulent propane-air flame at equal flow velocities and ratio of mixture
is cited. For receiving various flow regimes the diameter of a burner has been
changing. By means of a photoelectric cell the light intensity, transiting through a
yellow light filter (mainly radiation of С atoms) and blue filter (mainly radiation of
СН) was measured.
It is revealed that at equal fuel flow rates the radiant intensities of the laminar and
turbulent flame coincide.
The relation of the light intensity, transiting through a blue or yellow light filter is
identical for the laminar and turbulent flame.
Thus, in the laminar and turbulent kinetic flames a equal concentrations of
molecules and radicals are formed and have the same thermal and radiation
characteristics. This fact rather convincingly says that both of flame types at a different
macrostructure have equal microcomposition and that the chemical kinetics in both
cases is identical.
Independence of a Reynolds criterion from an ionic conductivity or strength of
current transiting through the flame which has been put in an electric field [2 - 4] is
so natural. Here the strength of current, irrespective of a flow regime, is proportional
to the flow rate of a mixture of the given composition. In [3] stoichiometrical
methane-oxygen mixtures with the different content of nitrogen, for example, were
used. As a anode the burner was used, and the cathode represented a water-cooled
spiral which had been put round a flame.
The experimental results have strictly confirmed proportionality of the strength
of current to the mixture flow rate. It means that in unit volume of a flame, irrespective
of a flow regime, the same quantity of charged particles occur.
Importance of this fact as the demonstration that a flow regime does not
influence process kinetics increases because communication between velocities of
chemical ionization and combustion is complex and does not represent linear relation
from initial conditions, including from α [5].
13
Therefore changing of kinetics under the influence of turbulence if it would
occur, including the local changes α as it is supposed in [6], would detect at once
change of a current of ionization.
So, we again confirm that the demonstration of correctness of phenomenological
equation (2.5) is at the same time and the most general demonstration of
independence of chemical kinetics of combustion of homogeneous mixture from
aerodynamic and turbulent characteristics of a flow. The effects viewed above are only
special cases of the many possible acknowledgments of this standing.
The some examples confirming relation ωft = ωf
L = ωf = const.
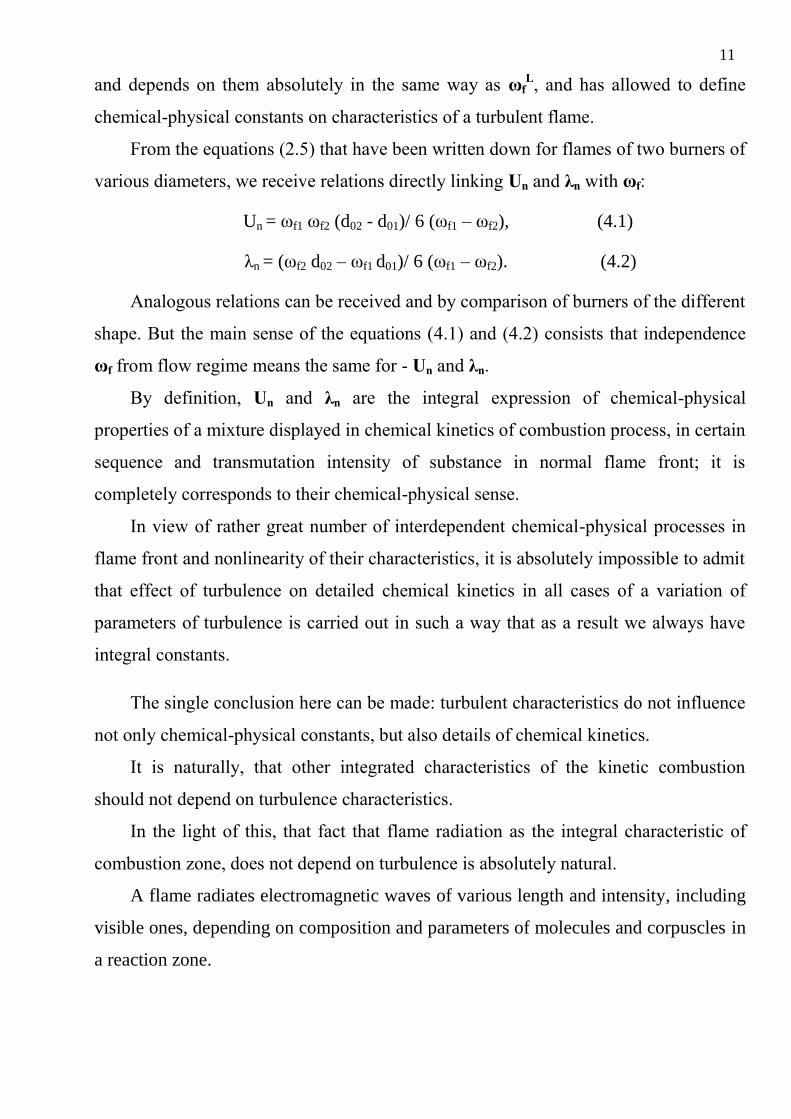
In [7] the photos of flames received on the burner with diameter dо = of 2,54 cm (Fig. 4.1) are
given. An average flow rate is same - v0 = 2,14 m/s. A gas mixture: the Cambridge urban gas - air
with Un = 41,8 cm/s. The calculated value of thickness of the laminar front λn = 1,9 mm (a
substantiation of λn on an independent base will be given in the next chapter). Difference in the
form of flames is caused by artificial turbulization of the flow the intensity of which has been
changing by means of turbulators (the perforated plates) in limits, ε = 2,2-7,12 %.
According to equation (2.5) volume intensity of the represented flames: ωf
t=68,15 s
-1, whence
it is possible to receive calculated volume of a flame: Vft = 15, 9 cm
3 that is close to the average one
measured on a photo Vtf (meas.) = 16,2 sm
3; the discrepancy makes 1,85 %.
Fig.4.1. Photos of circular turbulent flames by [7]: dо =2,54 cm; Vо=2,14 m/s; turbulent scale
l =1,631,87 mm; turbulence level: 1 – ε = 2,2%; 2 – 3,02; 3 – 3,8; 4 – 5,15; 5 – 6,05; 6 – 6,35; 7
– 7,12.
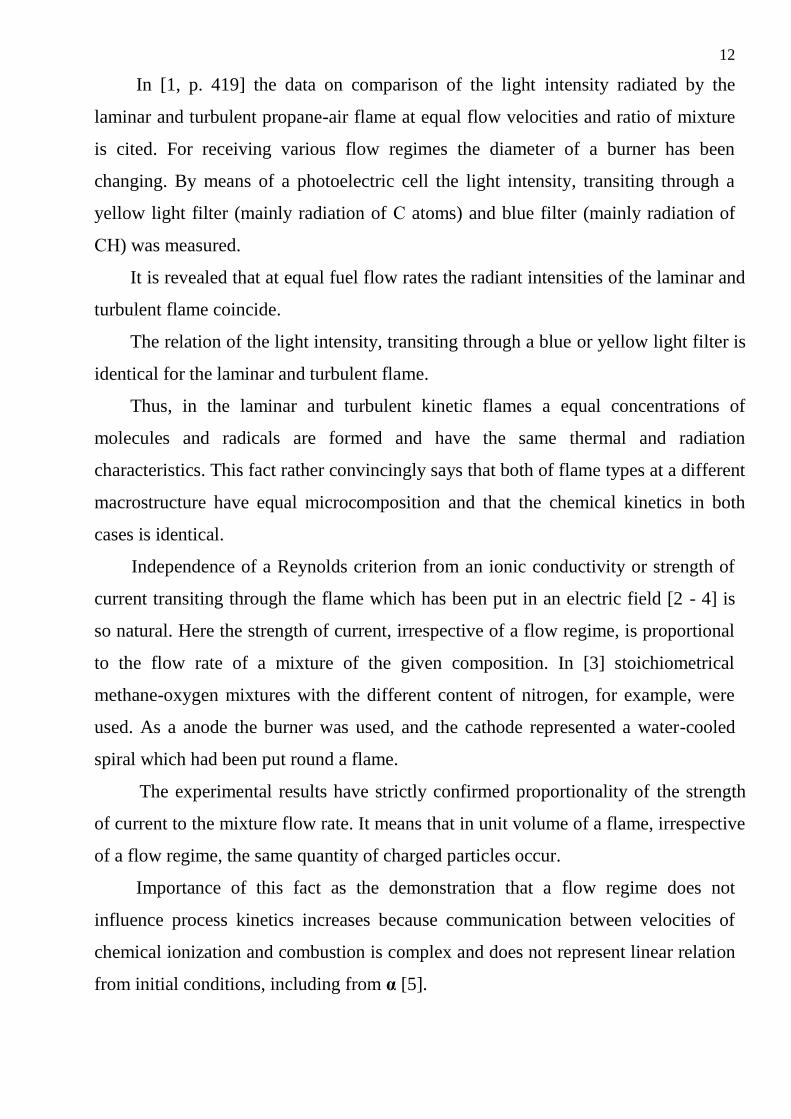
On fig. 4.2 the photos of the laminar and turbulent flames are presented at equal flow rates,
ratios of mixture and the same diameters of the burners [1]. The measurings show that flame
volumes are close one to another and equal in arbitrary units approximately 180.
14
Fig. 4.2. A photo of the laminar (a) and turbulent (b) flames¸ taking place at equal flow rates,
ratios of mixture and the same diameters of the burners.
Let's consider now the data available in the literature about a so-called flat flame.
Photos of a flat flame give the square of its cross-section which keeps a constant value on a
normal line to a photo. Thus the flame volume is spotted by equation: Vft = Ff (meas) S, where Ff (meas)
- the square of a longitudinal section of the flame, being measured on a photo.
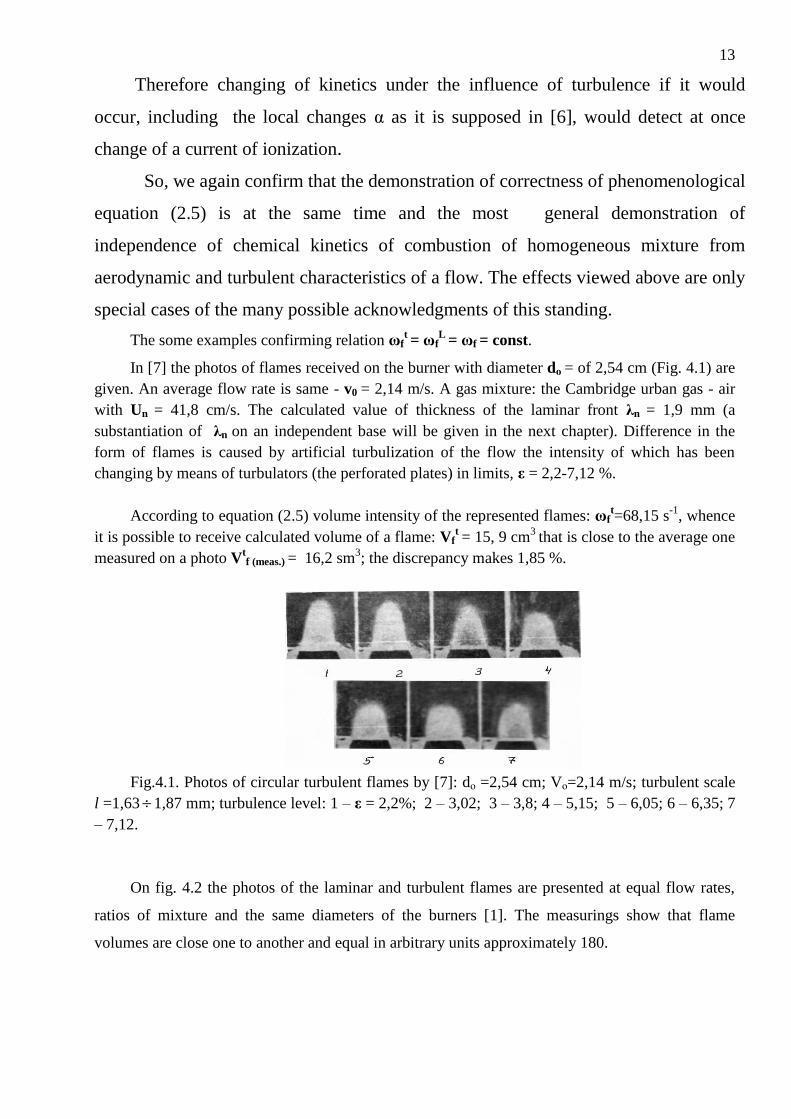
In Fig. 4.3 the photos of flat flames [8] are presented. Here the square of cross-section of a
burner 40 х 40 mm was used. The two lateral walls of the burner had the continuation optical quartz
bars with 150 mm altitude; on upper and low wall the auxiliary stabilizing burners have been
placed. Apart 55 mm before a burner section were positioned turbulators of a different construction.
Experiment was carried out on a gasoil-air mixture at velocity v0 = 33 m/s, Tmix = 440 - 470 K
at changing only one parameter - turbulence level in limits ε = 1,7 - 15,0 %.
Quantity Un for hydrocarbon-air mixtures with excess-air coefficient near 1,0 can be spotted
by relation:
Un = Un (0) (Tmix/T0) 1,95
. (4.3)
This relation extrapolate the data well. For Un(0) = 30 cm/s and Tmix = 455К is received Un = 71
cm/s. It corresponds, by the way, to average value of the data on Un in [8 and 9].
Fig. 4.3. Photos of turbulent flames in burner 40х40 mm for the same flow rates and various
turbulence levels [8].
Calculated value λn =1,9 mm. Then, according to (2.5), assuming Π = 6; l = 4 cm, we receive
ωf = 82 s-1
, and flame volume: Vtf (meas) = F0V0 / ωf = 42 3300/82 = 643 cm
3.
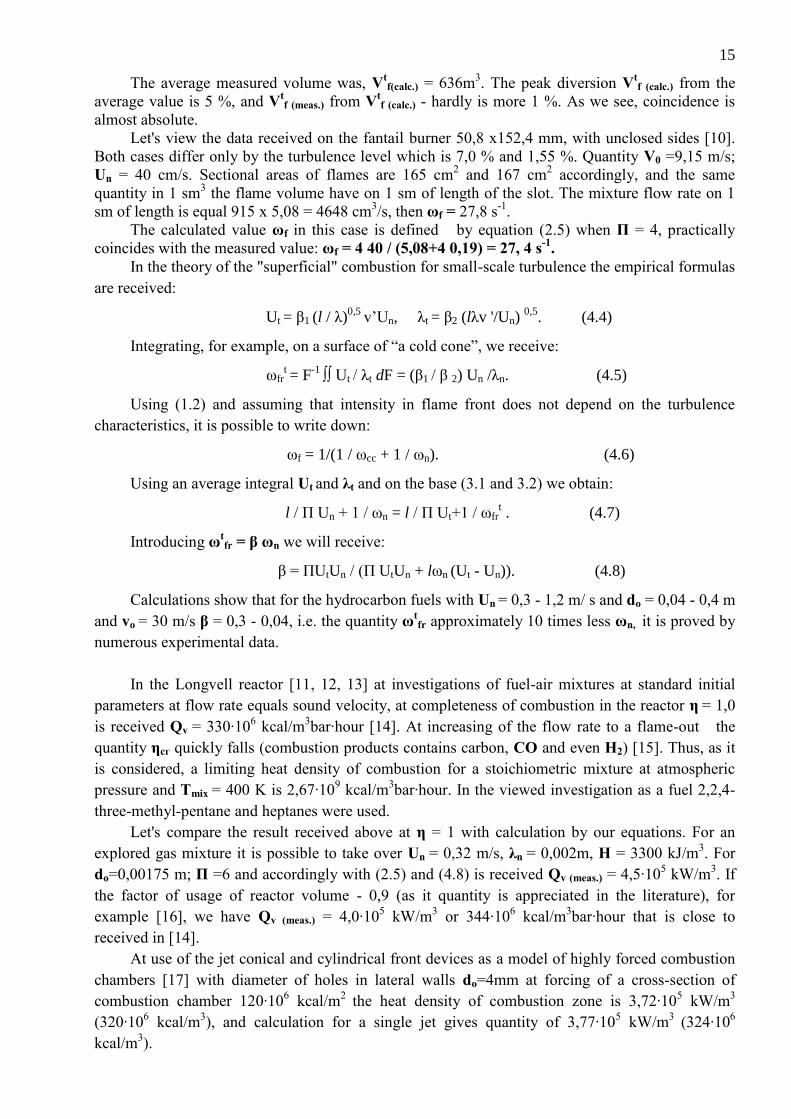
15
The average measured volume was, Vtf(calc.) = 636m
3. The peak diversion V
tf (calc.) from the
average value is 5 %, and Vtf (meas.) from V
tf (calc.) - hardly is more 1 %. As we see, coincidence is
almost absolute.
Let's view the data received on the fantail burner 50,8 х152,4 mm, with unclosed sides [10].
Both cases differ only by the turbulence level which is 7,0 % and 1,55 %. Quantity V0 =9,15 m/s;
Un = 40 cm/s. Sectional areas of flames are 165 cm2 and 167 cm
2 accordingly, and the same
quantity in 1 sm3 the flame volume have on 1 sm of length of the slot. The mixture flow rate on 1
sm of length is equal 915 х 5,08 = 4648 cm3/s, then ωf = 27,8 s
-1.
The calculated value ωf in this case is defined by equation (2.5) when П = 4, practically
coincides with the measured value: ωf = 4 40 / (5,08+4 0,19) = 27, 4 s-1
.
In the theory of the "superficial" combustion for small-scale turbulence the empirical formulas
are received:
Ut = β1 (l / λ)0,5
v’Un, λt = β2 (lλv '/Un) 0,5
. (4.4)
Integrating, for example, on a surface of “a cold cone”, we receive:
ωfrt = F
-1 ∫∫ Ut / λt dF = (β1 / β 2) Un /λn. (4.5)
Using (1.2) and assuming that intensity in flame front does not depend on the turbulence
characteristics, it is possible to write down:
ωf = 1/(1 / ωcc + 1 / ωn). (4.6)
Using an average integral Ut and λt and on the base (3.1 and 3.2) we obtain:
l / Π Un + 1 / ωn = l / Π Ut+1 / ωfrt . (4.7)
Introducing ωtfr = β ωn we will receive:
β = ΠUtUn / (Π UtUn + lωn (Ut - Un)). (4.8)
Calculations show that for the hydrocarbon fuels with Un = 0,3 - 1,2 m/ s and dо = 0,04 - 0,4 m
and vо = 30 m/s β = 0,3 - 0,04, i.e. the quantity ωtfr approximately 10 times less ωn, it is proved by
numerous experimental data.
In the Longvell reactor [11, 12, 13] at investigations of fuel-air mixtures at standard initial
parameters at flow rate equals sound velocity, at completeness of combustion in the reactor η = 1,0
is received Qv = 330∙106 kcal/m
3bar∙hour [14]. At increasing of the flow rate to a flame-out the
quantity ηсг quickly falls (combustion products contains carbon, CO and even Н2) [15]. Thus, as it
is considered, a limiting heat density of combustion for a stoichiometric mixture at atmospheric
pressure and Tmix = 400 K is 2,67∙109 kcal/m
3bar∙hour. In the viewed investigation as a fuel 2,2,4-
three-methyl-pentane and heptanes were used.
Let's compare the result received above at η = 1 with calculation by our equations. For an
explored gas mixture it is possible to take over Un = 0,32 m/s, λn = 0,002m, Н = 3300 kJ/m3. For
do=0,00175 m; Π =6 and accordingly with (2.5) and (4.8) is received Qv (meas.) = 4,5∙105 kW/m
3. If
the factor of usage of reactor volume - 0,9 (as it quantity is appreciated in the literature), for
example [16], we have Qv (meas.) = 4,0∙105 kW/m
3 or 344∙10
6 kcal/m
3bar∙hour that is close to
received in [14].
At use of the jet conical and cylindrical front devices as a model of highly forced combustion
chambers [17] with diameter of holes in lateral walls do=4mm at forcing of a cross-section of
combustion chamber 120∙106 kcal/m
2 the heat density of combustion zone is 3,72∙10
5 kW/m
3
(320∙106 kcal/m
3), and calculation for a single jet gives quantity of 3,77∙10
5 kW/m
3 (324∙10
6
kcal/m3).
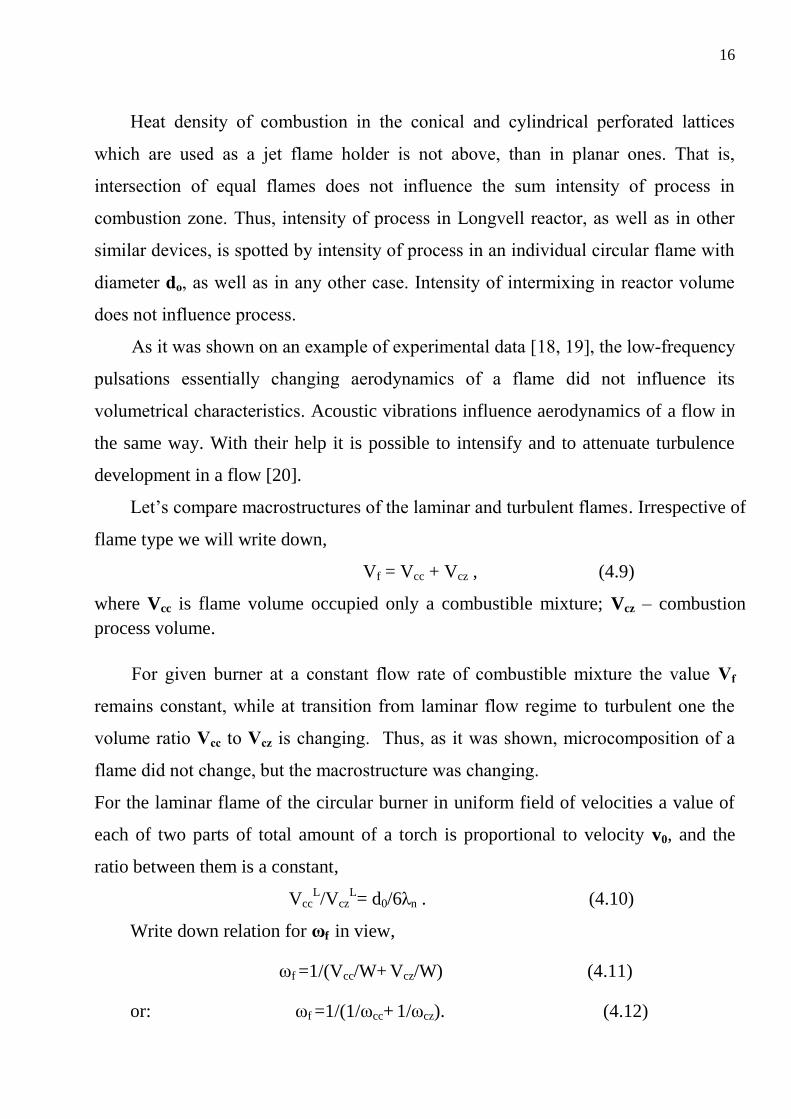
16
Heat density of combustion in the conical and cylindrical perforated lattices
which are used as a jet flame holder is not above, than in planar ones. That is,
intersection of equal flames does not influence the sum intensity of process in
combustion zone. Thus, intensity of process in Longvell reactor, as well as in other
similar devices, is spotted by intensity of process in an individual circular flame with
diameter do, as well as in any other case. Intensity of intermixing in reactor volume
does not influence process.
As it was shown on an example of experimental data [18, 19], the low-frequency
pulsations essentially changing aerodynamics of a flame did not influence its
volumetrical characteristics. Acoustic vibrations influence aerodynamics of a flow in
the same way. With their help it is possible to intensify and to attenuate turbulence
development in a flow [20].
Let’s compare macrostructures of the laminar and turbulent flames. Irrespective of
flame type we will write down,
Vf = Vcc + Vcz , (4.9)
where Vcc is flame volume occupied only a combustible mixture; Vcz – combustion
process volume.
For given burner at a constant flow rate of combustible mixture the value Vf
remains constant, while at transition from laminar flow regime to turbulent one the
volume ratio Vcc to Vcz is changing. Thus, as it was shown, microcomposition of a
flame did not change, but the macrostructure was changing.
For the laminar flame of the circular burner in uniform field of velocities a value of
each of two parts of total amount of a torch is proportional to velocity v0, and the
ratio between them is a constant,
VccL/Vcz
L= d0/6λn . (4.10)
Write down relation for ωf in view,
ωf =1/(Vcc/W+ Vcz/W) (4.11)
or: ωf =1/(1/ωcc+ 1/ωcz). (4.12)
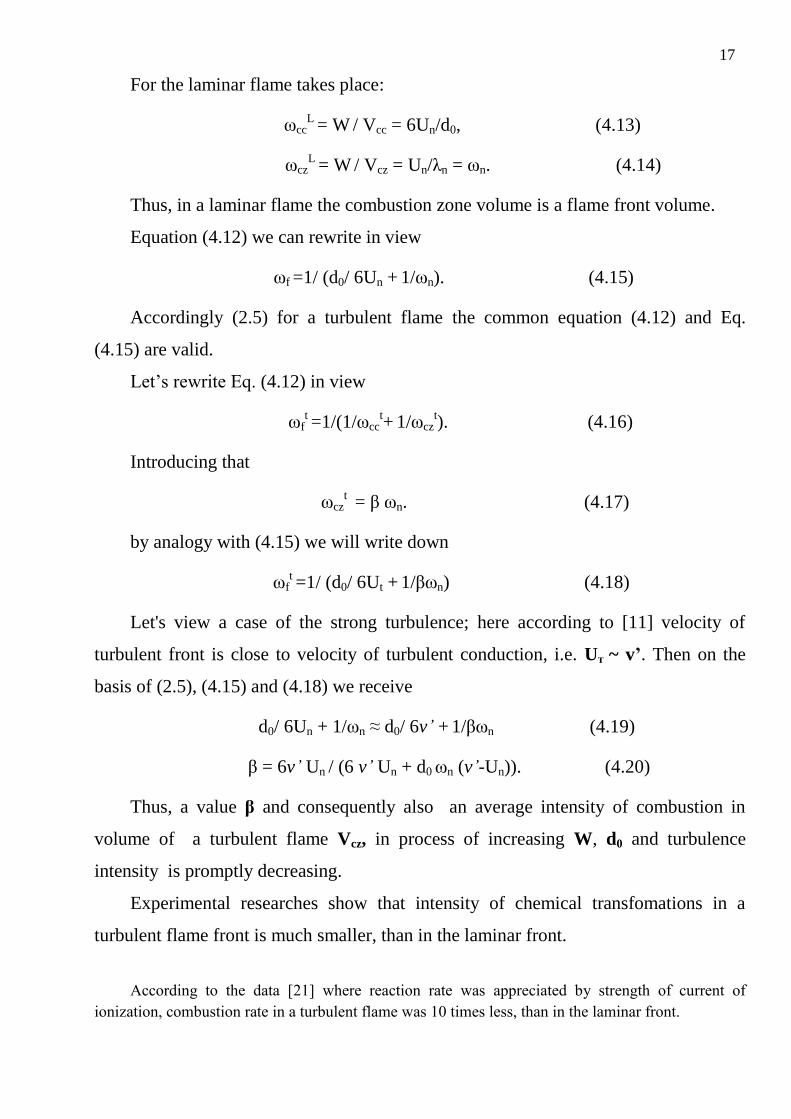
17
For the laminar flame takes place:
ωccL
= W / Vcc = 6Un/d0, (4.13)
ωczL
= W / Vcz = Un/λn = ωn. (4.14)
Thus, in a laminar flame the combustion zone volume is a flame front volume.
Equation (4.12) we can rewrite in view
ωf =1/ (d0/ 6Un + 1/ωn). (4.15)
Accordingly (2.5) for a turbulent flame the common equation (4.12) and Eq.
(4.15) are valid.
Let’s rewrite Eq. (4.12) in view
ωft =1/(1/ωcc
t+
1/ωcz
t). (4.16)
Introducing that
ωczt = β ωn. (4.17)
by analogy with (4.15) we will write down
ωft =1/ (d0/ 6Ut +
1/βωn) (4.18)
Let's view a case of the strong turbulence; here according to [11] velocity of
turbulent front is close to velocity of turbulent conduction, i.e. Uт ~ v’. Then on the
basis of (2.5), (4.15) and (4.18) we receive
d0/ 6Un + 1/ωn ≈ d0/ 6v’ + 1/βωn (4.19)
β = 6v’ Un / (6 v’ Un + d0 ωn (v’-Un)). (4.20)
Thus, a value β and consequently also an average intensity of combustion in
volume of a turbulent flame Vcz, in process of increasing W, d0 and turbulence
intensity is promptly decreasing.
Experimental researches show that intensity of chemical transfomations in a
turbulent flame front is much smaller, than in the laminar front.
According to the data [21] where reaction rate was appreciated by strength of current of
ionization, combustion rate in a turbulent flame was 10 times less, than in the laminar front.
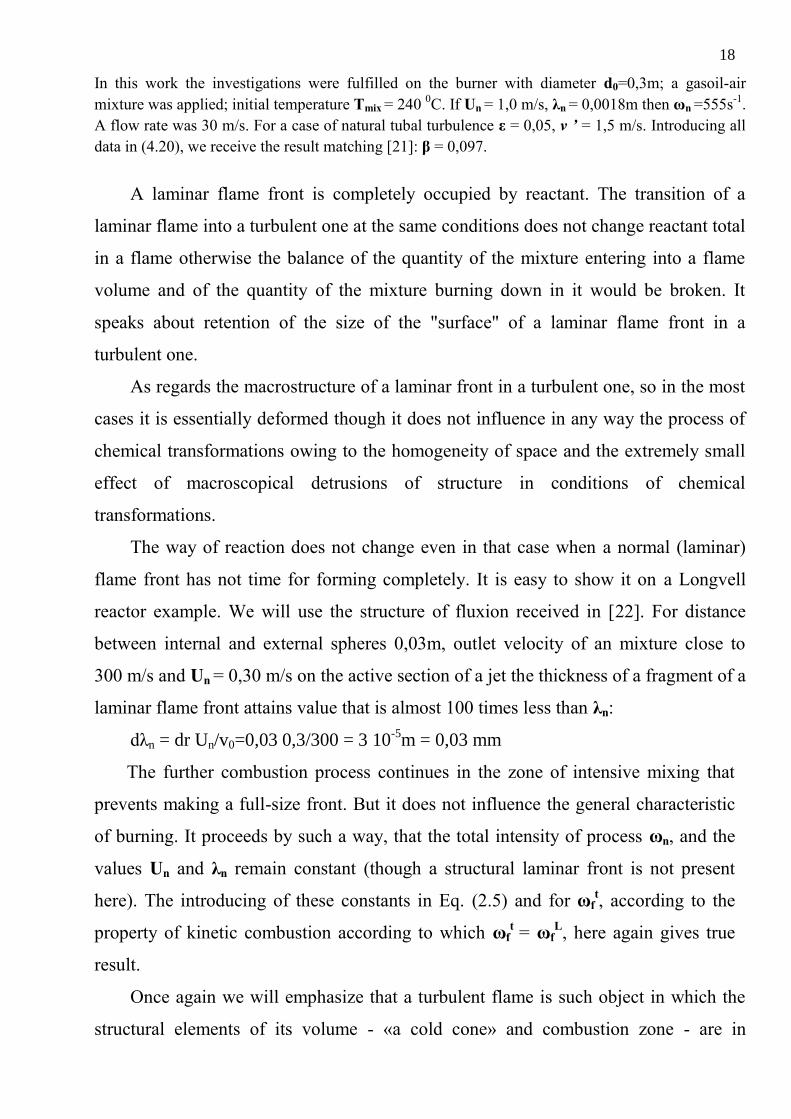
18
In this work the investigations were fulfilled on the burner with diameter d0=0,3m; a gasoil-air
mixture was applied; initial temperature Tmix = 240 0С. If Un = 1,0 m/s, λn = 0,0018m then ωn =555s
-1.
A flow rate was 30 m/s. For a case of natural tubal turbulence ε = 0,05, v ’ = 1,5 m/s. Introducing all
data in (4.20), we receive the result matching [21]: β = 0,097.
A laminar flame front is completely occupied by reactant. The transition of a
laminar flame into a turbulent one at the same conditions does not change reactant total
in a flame otherwise the balance of the quantity of the mixture entering into a flame
volume and of the quantity of the mixture burning down in it would be broken. It
speaks about retention of the size of the "surface" of a laminar flame front in a
turbulent one.
As regards the macrostructure of a laminar front in a turbulent one, so in the most
cases it is essentially deformed though it does not influence in any way the process of
chemical transformations owing to the homogeneity of space and the extremely small
effect of macroscopical detrusions of structure in conditions of chemical
transformations.
The way of reaction does not change even in that case when a normal (laminar)
flame front has not time for forming completely. It is easy to show it on a Longvell
reactor example. We will use the structure of fluxion received in [22]. For distance
between internal and external spheres 0,03m, outlet velocity of an mixture close to
300 m/s and Un = 0,30 m/s on the active section of a jet the thickness of a fragment of a
laminar flame front attains value that is almost 100 times less than λn:
dλn = dr Un/v0=0,03 0,3/300 = 3 10-5
m = 0,03 mm
The further combustion process continues in the zone of intensive mixing that
prevents making a full-size front. But it does not influence the general characteristic
of burning. It proceeds by such a way, that the total intensity of process ωn, and the
values Un and λn remain constant (though a structural laminar front is not present
here). The introducing of these constants in Eq. (2.5) and for ωft, according to the
property of kinetic combustion according to which ωft = ωf
L, here again gives true
result.
Once again we will emphasize that a turbulent flame is such object in which the
structural elements of its volume - «a cold cone» and combustion zone - are in
19
indissoluble interconnection and the description of a turbulent flame front cannot be
fulfilled beyond connection of these characteristics.
From a physical point of view, turbulence in such degree can influence the
process of kinetic combustion in which the energy of turbulent pulsations is
comparable to the enthalpy of a combustible mixture; it practically cannot be revealed.
5. Calculation of the thickness of a laminar flame front
So, we will consider flame front as the area that exists between two surfaces on
which the chemical reactions and increasing of temperature from initial value Т0 to the
peak adiabatic combustion temperature ТC begin (the forward boundary) and finish
(the back boundary of front) accordingly.
The thickness of normal flame front is more than free length of molecules and
radicals, Λ, in combustion zone in some orders; the collision number of one corpuscle
for residence time in a front can attain 106 - 10
7. Whatever a way of the chemical
reactions (number of its links is only tens at burning of organic fuel) it is necessary to
expect that distributing of reaction products in space, and, hence, the thickness and
velocity of a flame front will be essentially spotted by the molecular diffusion laws.
Such a method allows to avoid necessity of considering of chemical kinetics of
a given mixture connected with intermediate reaction products, length and branching
of chains.
As Λ << λn, then without an appreciable lapse for an estimate λn, it is possible to
take over that the beginning of formation of finished combustion products coincides
with forward boundary of flame front, i.e. with the beginning of reaction and with
increasing of temperature in an mixture. It follows also from a statement that the
kinetic mechanism outruns the thermal conductivity mechanism in a gas mixture; it
had been stated still in [23, 24] . At the basis of it the following reasoning lies.
A sense of the Arrhenius equation for reaction rate and temperature consists that
reaction rate is spotted by the quantity of the active molecules fallen into the "tail"
maksvell-boltsman allocation, i.e. ones having the greatest forward speed and energy.
20
All molecules of finished combustion products formed again belong to these active
ones (in view of high formation heat). There are no reasons to consider that at first
these molecules will lose the energy in the course of collisions, and only after this the
molecules arisen as a result of Maksvell-Boltsman allocations with high energy will
take a part in chemical reaction extending. With the greatest probability a
participation in reaction extending will be taken over by non-equilibrium products of
combustion. Such picture matches also to the phenomenon of an energy branching of
chains in chemical reactions [25].
When in the course of reaction the single finished combustion product is formed
the value λn can be spotted on two points: the beginning of its formation and
achievement of the peak concentration. At formation of several substances the
representative product, limiting process should be chosen. At burning of hydrocarbons
in an mixture with air (oxygen) the finished combustion products are Н2О and СО2.
The peak concentration Н2О is attained already in the front area (as the examinations
show). Thus, here СО2 acts in the role of the limiting product.
According to offered model of the process, СО2 molecules, forming and diffusing
from back to the forward boundary of front with high energy , as well as other active
particles, will cause origin of reactions. The new СО2 molecules formed in a front will
pitch "relay race" in a new mixture with the greatest probability as a result of the first
collisions after the moment of the formation when their temperature (energy) is close
to peak or the adiabatic combustion temperature Тc. It is necessary to notice that the
idea of "relay race" process with the maximum diffusion rate is considered in [14,
with. 93], but here it concerns to narrow zone near to outlet temperature. In the present
reasonings this standing is concerning all thickness of a flame front and all corpuscles
which initiate reaction.
But at the phenomenological description the question is restricted by a
considering of behavior of molecules СО2.
As pressure in flame front is almost equal initial pressure Р0, for СО2 on all
thickness of flame front it is possible to consider a self-diffusion coefficient as a
constant value,
21
DCO2c = ΛСО2
c vCO2
c /3, (5.1)
where ΛСО2c
and vCO2c are free length and an average velocity of СО2 molecules at
parameters Р0 and Тc.
In the conditions of flame front CO2 is in a multicomponent gaseous fluid in
rather small concentrations. It is known that the diffusion coefficient of small
admixture in multicomponent gas can be substituted on a self-diffusion coefficient
[26]. We will show that in the conditions of flame front for a finished reaction
product taken at the adiabatic combustion temperature, legitimacy of such
substitution increases.
Let’s substitute mixture of all components besides СО2 by any gas N with
average characteristics. Then for an interdiffusion coefficient is possible to write down
DCO2,Nc = 0,(3) ((ρN/ρ)ΛСО2
c vCO2
c + (ρCO2/ρ)ΛN
c vN
c). (5.2)
Here is not only ρCO2 is relatively small at ρN/ρ ≈ 1, but ΛNc
vNc <<ΛСО2
c vCO2
c.
Therefore it can be obtained:
DCO2,Nc ≈ 0,(3) ΛСО2
c vCO2
c = DCO2
c (5.3)
This assuming makes the task considerably simpler. Hence the diffusive model of
flame front propagation has been reduced to one-dimension scheme, in which diffusion
coefficient does not depend on X.
Accordingly to the Fick’s second low, we write down:
δnCO2/δx = DCO2c (δ
2 nCO2/ δx
2), (5.4)
where nCO2 denotes СО2 concentration.
For initial (I) and final (II) cross-sections of a flame front we have nCO2(I) = 0 and
nCO2(II) = nCO2max
accordingly. For the steady-state diffusion processes the left part of
Eq. (5.4) equal zero, then
δnCO2/δx = const. (5.5)
After integration, taking into account boundary conditions it is received
nCO2= nCO2max
(x/λn). (5.6)
Quantity of a diffusion flow is spotted by relation
22
JCO2 = DCO2c (nCO2
max/λn). (5.7)
This quantity must be the same on any area of flame front because the process is
steady-state. The quantity of flow we can define also by average flow velocity of
substance,
JCO2 = WCO2 nCO2max
. (5.8)
In this case substance velocity is identical to propagation rate of normal flame front:
WCO2 ≡ Un. Taking into account it on the basis of (5.7) and (5.8) it is obtained
λn = DCO2c / Un . (5.9)
6. Calculation of λn and Un for different initial parameters
Let’s consider influence of initial mixture temperature on value λn (besides
influence through value Un).
As a process of chemical transformations in flame front is defined by the
particles of high energy and by active radicals, the chemical kinetics apparently does
not depend on initial temperature in certain diapason. Thus, a quantity of collisions of
molecules in reaction wave volume sufficient for all circles of chemical
transformations remains constant.
Then value λn should be inversely proportional to total number of collisions Z in
unit volume [26]:
Z ~ v n2. (6.1)
Here v and n denote average velocity and a number of particles in unit volume.
At constant pressure for ideal gas v ~ T0,5
; n ~ T-1
then
Z ~ T-1,5
. (6.2)
Thus, for the laminar flame front thickness of hydrocarbon-air mixture at standard
pressure it is obtains:
λn = (DCO2c / Un)(T/T0)
1,5 (6.3)
The value Un should be taken here at mixture temperature T; T0= 293 К.
23
Accordingly to the kinetic theory of gases is D ~ P-1
. In general case the self-
diffusion coefficient of the limiting reaction product at adiabatic combustion
temperature is defined by formula,
Dc = D0 (T
c/T0)
n (P/P0)
-1. (6.4)
Depending on substances n=1,72,0 [27]; Т0, Р0 denote standard initial
parameters 293 К and 1 bar.
For СО2 at standard conditions DCO2(0) = 0,11 cm2/s, and value n =1,90-1,95 [2, 3,
27]. Calculation data is given in Tab. 4.1 (see also [4]).
The empirical relation for Un dependence of pressure in general view
Un = Un(0) (P/P0)-m
. (6.5)
For hydrocarbon-air mixtures with burning velocity (flame front velocity) Un = 30
– 40 cm/s, m ≈ 0,3; for hydrogen-air mixtures exponent m is close to 0,1 [28].
Value Un(0) for given mixture at normal pressure can be obtained empirically.
For mixtures with stoichiometric composition at various initial temperatures, Un(0) ~
(Т/Т0)1,9
. In general case, dependence Un(0) on mixture temperature is very complex
and the defining of Un(0) empirically, using (4.1 and 4.2) is expedient.
Using (6.3, 6.4 and 6.5) the equation for calculation λn of hydrocarbon-air
mixtures at various initial parameters Т and Р can be obtained,
λn = (DLP(0)/Un(0))(Tc/T0)
1,9(T/T0)
1,5(Р/Р0)
-0,7 . (6.6)
For any polytrope at n = 1,41 occurs
(T1/T2) = (Р1/Р2)0,29
. (6.7)
Then for an intermixture compressed in polytropic process from (6.6) we will
receive
λn = (DLP(0)/Un)(Tc/T0)
1,9(Р0/Р)
-0,27. (6.8)
By analogy it is possible to write down expression for intermixtures of any
composition.
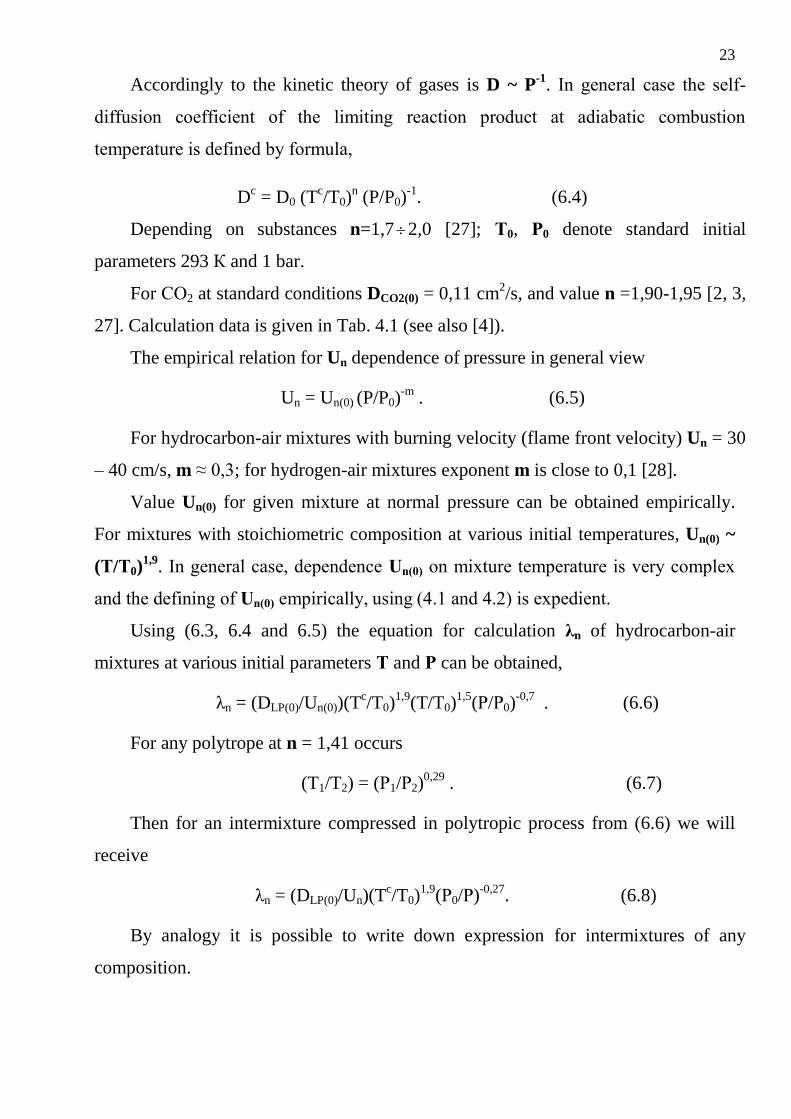
24
Tab. 6.1. Initial data and design values λn, received by Eq. (6.3), for a methane-air
mixture, Р0=1bar.
Т α Un Тc
DCO2c λn
К - cm / s К cm2 / s mm
293 1.0
1.1
1.2
1.3
1.4
1.5
1.6
1.7
1.8
1.9
31.0
26.5
23.0
20.0
16.0
13.0
10.0
7.5
5.5
3.5
2285
2148
2033
1934
1846
1765
1690
1619
1551
1485
6.23
5.54
4.99
4.53
4.15
3.81
3.51
3.24
2.98
2.74
2.00
2.09
2.17
2.26
2.59
2.93
3.50
4.30
5.43
7.85
423 1.0
1.2
1.4
1.6
1.8
2.0
57.0
45.0
32.0
23.0
16.0
10.0
2355
2117
1938
1775
1654
1551
6.46
5.20
4.55
3.70
2.23
2.98
1.87
1.91
2.35
2.65
3.34
4.93
548 1.0
1.2
1.4
1.6
1.8
2.0
2.2
100.0
75.0
60.0
46.0
35.0
27.0
18.0
2458
2210
2028
1879
1752
1650
1580
7.16
5.85
4.97
4.30
3.72
3.20
3.12
1.80
2.00
2.21
2.49
2.77
3.35
4.10
693 1.0
1.2
1.4
1.6
1.8
2.0
2.2
2.4
170.0
140.0
120.0
97.0
77.0
62.0
48.0
37.0
2555
2293
2128
1983
1868
1775
1715
1658
7.50
6.08
5.25
4.58
4.08
3.70
3.55
3.24
1.60
1.58
1.59
1.71
1.92
2.17
2.65
3.20
6.1. Comparison of calculated thickness of a flame front with the space
characteristics of a flame
A number of the space characteristics of the laminar flame front (widely explored
experimentally) is closely tied to the thickness of a laminar flame front and practically
coincides with it on quantity. So, at ignition of a mixture by means of an electrical
spark the characteristic quantities are – the quenching electrode spacing having flanges
on the ends, lqs, and almost equal to it the minimal electrode spacing at the minimal
25
ignition energy, lmin
МIE. The comparisons have shown that values lqs and lmin
МIE are
almost equal to the value λn received by us for the given mixture. The critical
(quenching) spacing, lcr(s), defined by flame passage through a slot, is close to the
flame front thickness also.
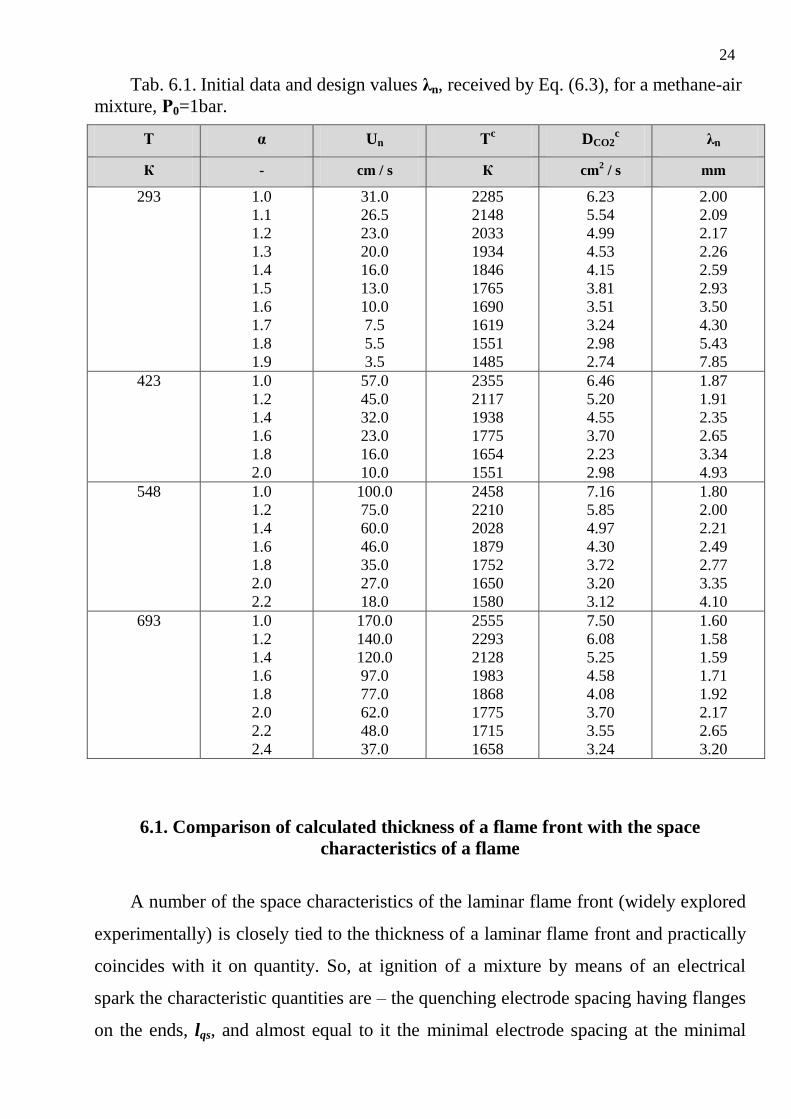
In Fig. 6.1 the photos illustrating a measurement procedure of critical diameter
of flame flash-back in tube, dcr, are given. Internal tube is changeable. For every
diameter of this tube, dt, the certain value α exists at which ceasing or deceleration of
mixture flow rate causes flame quenching, but not extending it in a tube.
For this α a given value dt was accepted as dcr. Conformity λn to the empirical
values (2/π)dcr is quite satisfactory.
Fig. 6.1. Illustration to definition dcr by means of flame-out on a tube inlet of small diameter. In the
instance in a photo dt > dcr for a gas mixture with given α.
For definition lcr (s) other procedure was applied. In a tube of big diameter (d = 36
mm) the shutter with the adjusting slot was installed. Interior volume was filling by a
mixture of the same composition and was igniting on the one side of tube. After each
ignition the slot was incremented by 0,1 mm.
If the flame flash-back occurred at a given slot thickness then previous value lcr(s)
(i.e. 0,1 mm less) is accepted as the critical one. Data lcr(s) depends on experimental
conditions a little, however, being received in the same conditions, they are correlated
with data λn well.
In Tab. 6.2 values λn, calculated by Eq. (6.3) and experimental data lcr(s) [29, Tab.
58] for a stoichiometric mixtures of various hydrocarbons with air are given at
standard initial parameters. Conformity is in limits of measurement accuracy.
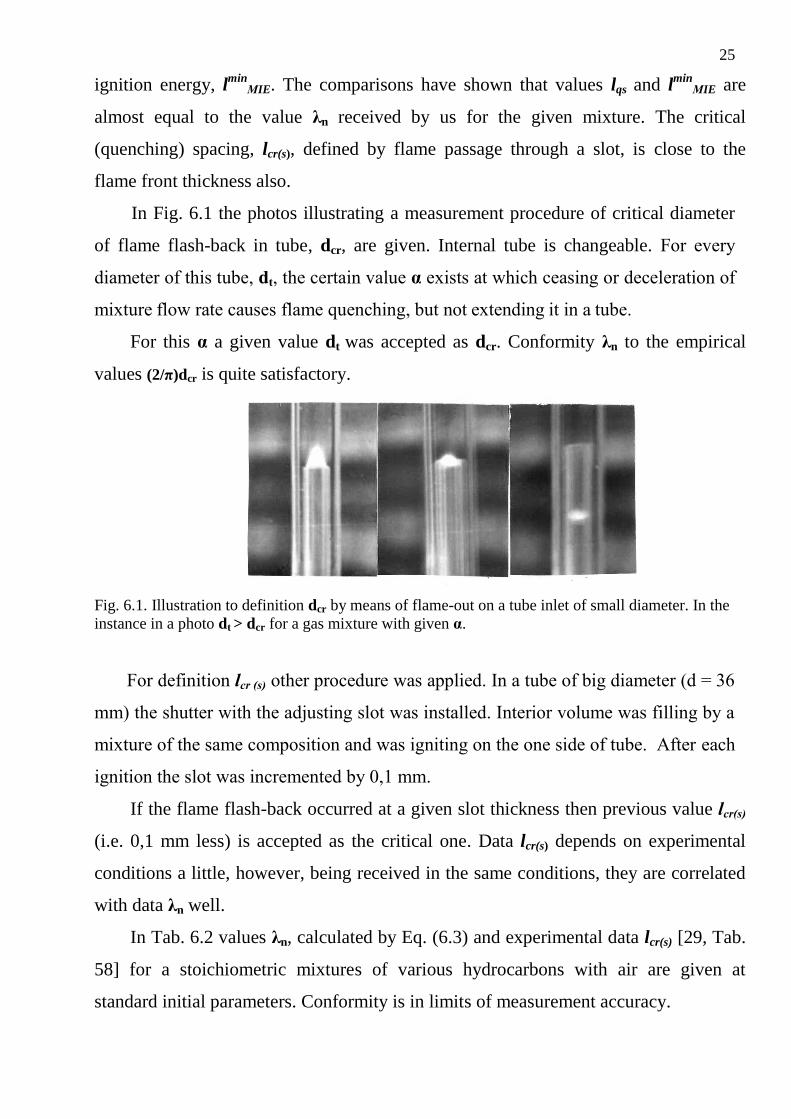
26
Tab. 6.2. – Comparison of lcr(s) ([29], tab. 58) with calculated values λn, received
by Eq. (6.6), for hydrocarbon-air mixtures; initial parameters – normal; DСО20 = 0,11
sm2/s; n = 1,95; α = 1,0.
Hydrocarbon Chemical
formula Un Тc λn lcr(s)
cm/s К mm mm
Methane series
Methane СН4 31.0 2236 2.00 2.03
Ethane С2Н6 35.5 2245 1.84 1.78
Propane С3Н8 34.5 2250 1.70 1.78
Butane С4Н10 33.5 2255 1.78 1.78
Pentane С5Н12 34.0 2250 1.74 1.78
Hexane С6Н14 34.0 2239 1.73 1.78
Heptane С7Н16 34.0 2214 1.67 1.78
Ethylene series
Ethylene С2Н4 62.0 2375 1.19 1.27
Propene С3Н6 38.6 2339 1.64 2.03
Acetylene series
Acetylene С2Н2 125.0 2600 0.71 0.76
Propine С3Н4 62.5 2470 1.29 1.27
Cyclopropane С3Н6 42.0 2328 1.49 1.78
Cyclohexane С6Н12 34.0 2250 1.74 1.78
Benzol С6Н6 35.8 2305 1.72 1.78
The data of lqs and lmin
MIE at various pressures Р0 are available in literature and
allow to check legitimacy of Eq. (6.3).
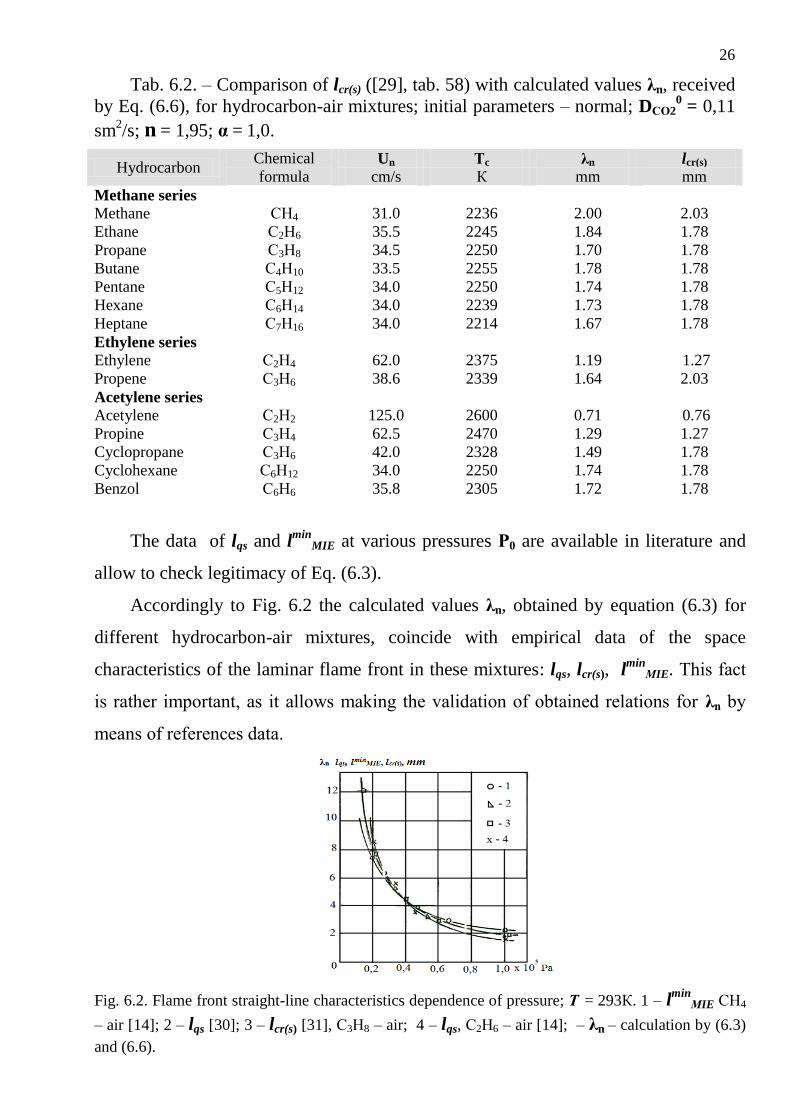
Accordingly to Fig. 6.2 the calculated values λn, obtained by equation (6.3) for
different hydrocarbon-air mixtures, coincide with empirical data of the space
characteristics of the laminar flame front in these mixtures: lqs, lcr(s), lmin
МIE. This fact
is rather important, as it allows making the validation of obtained relations for λn by
means of references data.
Fig. 6.2. Flame front straight-line characteristics dependence of pressure; Т = 293К. 1 – lmin
МIE СН4
– air [14]; 2 – lqs [30]; 3 – lcr(s) [31], С3Н8 – air; 4 – lqs, С2Н6 – air [14]; – λn – calculation by (6.3)
and (6.6).
27
Computational model, as we have seen, does not demand considering of the
complex chemical kinetics. This statement is principal. Its validation is comparison of
calculated values with empirical results for mixtures with different physical and
chemical properties. Certainly, using equations (6.3) and (6.6) for every mixture it is
necessary to choose a matching reactant product limiting the process. Furthermore, it
is necessary to consider that combustion temperature Тc can be significantly less than
a calculated temperature especially at low pressures [5]. For calculations λn the real
adiabatic temperature of process, which is taking into account dissociation, should be
used.
The results of calculation λn by Eq. (5.9) and empirical data of values lcr(s) for
ammonia gas mixtures [32] at choosing nitrogen N2, as a limiting reaction product,
which forms as a result of recombination of atoms N at a finish stage of process,
provides almost full conformity of calculation and experiment.
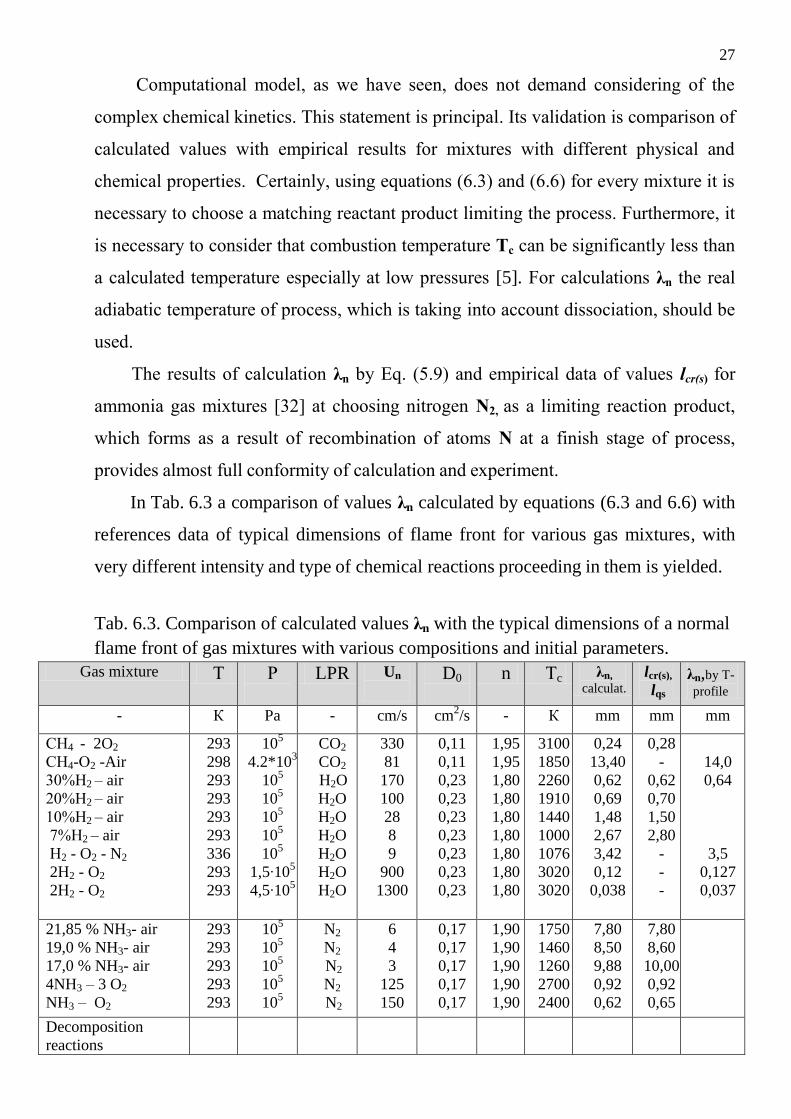
In Tab. 6.3 a comparison of values λn calculated by equations (6.3 and 6.6) with
references data of typical dimensions of flame front for various gas mixtures, with
very different intensity and type of chemical reactions proceeding in them is yielded.
Tab. 6.3. Comparison of calculated values λn with the typical dimensions of a normal
flame front of gas mixtures with various compositions and initial parameters.
Gas mixture Т Р
LPR Un
D0
n Тc λn,
calculat.
lcr(s),
lqs λn,by Т-
profile
- К Pa - cm/s cm2/s - К mm mm mm
СН4 - 2O2
СН4-О2 -Air
30%Н2 – air
20%Н2 – air
10%Н2 – air
7%Н2 – air
Н2 - O2 - N2
2Н2 - O2
2Н2 - O2
293
298
293
293
293
293
336
293
293
105
4.2*103
105
105
105
105
105
1,5∙105
4,5∙105
CO2
CO2
H2O
H2O
H2O
H2O
H2O
H2O
H2O
330
81
170
100
28
8
9
900
1300
0,11
0,11
0,23
0,23
0,23
0,23
0,23
0,23
0,23
1,95
1,95
1,80
1,80
1,80
1,80
1,80
1,80
1,80
3100
1850
2260
1910
1440
1000
1076
3020
3020
0,24
13,40
0,62
0,69
1,48
2,67
3,42
0,12
0,038
0,28
-
0,62
0,70
1,50
2,80
-
-
-
14,0
0,64
3,5
0,127
0,037
21,85 % NH3- air
19,0 % NH3- air
17,0 % NH3- air
4NH3 – 3 O2
NH3 – O2
293
293
293
293
293
105
105
105
105
105
N2
N2
N2
N2
N2
6
4
3
125
150
0,17
0,17
0,17
0,17
0,17
1,90
1,90
1,90
1,90
1,90
1750
1460
1260
2700
2400
7,80
8,50
9,88
0,92
0,62
7,80
8,60
10,00
0,92
0,65
Decomposition
reactions
28
O3 O2
N2H4 NH3 ; H2 ; N2
293
293
105
105
O2
N2
54
155
0,18
0,17
1,80
1,90
1260
1850
0,55
0,35
-
-
0,55
0,25
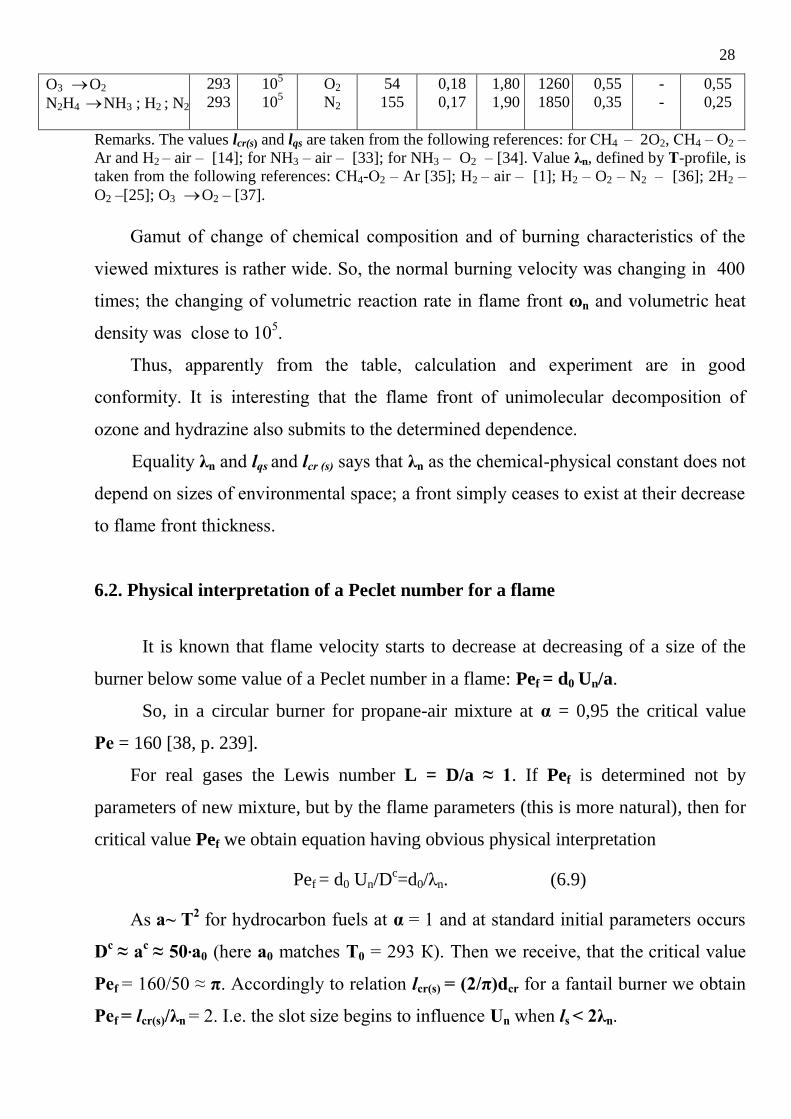
Remarks. The values lcr(s) and lqs are taken from the following references: for СН4 – 2O2, СН4 – О2 –
Ar and Н2 – air – [14]; for NH3 – air – [33]; for NH3 – O2 – [34]. Value λn, defined by Т-profile, is
taken from the following references: СН4-О2 – Ar [35]; Н2 – air – [1]; Н2 – O2 – N2 – [36]; 2Н2 –
O2 –[25]; O3 O2 – [37].
Gamut of change of chemical composition and of burning characteristics of the
viewed mixtures is rather wide. So, the normal burning velocity was changing in 400
times; the changing of volumetric reaction rate in flame front ωn and volumetric heat
density was close to 105.
Thus, apparently from the table, calculation and experiment are in good
conformity. It is interesting that the flame front of unimolecular decomposition of
ozone and hydrazine also submits to the determined dependence.
Equality λn and lqs and lcr (s) says that λn as the chemical-physical constant does not
depend on sizes of environmental space; a front simply ceases to exist at their decrease
to flame front thickness.
6.2. Physical interpretation of a Peclet number for a flame
It is known that flame velocity starts to decrease at decreasing of a size of the
burner below some value of a Peclet number in a flame: Pef = d0 Un/a.
So, in a circular burner for propane-air mixture at α = 0,95 the critical value
Ре = 160 [38, p. 239].
For real gases the Lewis number L = D/a ≈ 1. If Pef is determined not by
parameters of new mixture, but by the flame parameters (this is more natural), then for
critical value Pef we obtain equation having obvious physical interpretation
Pef = d0 Un/Dc=d0/λn. (6.9)
As a~ T2 for hydrocarbon fuels at α = 1 and at standard initial parameters occurs
Dc
≈ аc
≈ 50∙а0 (here а0 matches Т0 = 293 К). Then we receive, that the critical value
Pef = 160/50 ≈ π. Accordingly to relation lcr(s) = (2/π)dcr for a fantail burner we obtain
Pef = lcr(s)/λn = 2. I.e. the slot size begins to influence Un when ls < 2λn.
29
7. Calculation of the peak heat density of combustion
Calculation of basic flame characteristics has a great practical interest for the
creation of highly forced devices, for instance, of aircraft engines as it allows to find
the maximum volumetric intensity of combustion for various "fuel-oxidizer" mixtures
at various initial parameters.
Let’s write down a formula for ωn using a general relation ωn = Un / λn and Eq.
(6.6),
ωn = (Un(0)2/ DLP(0)) (T
c/T0)
-1,9(T/T0)
-1,5(Р/Р0)
0,7. (7.1)
The volumetric combustion rate of a mixture compressed in polytropic process,
ωn(p)
= (Un(0)2/ DLP(0)) )(T
c/T0)
-1,9(Р0/Р)
0,27. (7.2)
The value of volumetric intensity of combustion in a normal front allows
receiving the maximum volumetric heat density in flame depending on composition
and initial parameters of a gas mixture, [kW/m3]:
Qvmax
= H ∙ ωn, (7.3)
wherе H = cv∙Qlw denotes the lower working combustion heat of a mixture, kJ/m
3; cv denotes the
dimensionless volume fraction of a combustible gas in a mixture; Qlw denotes the lower working
combustion heat of gas, kJ/m3
Example. For a stoichiometrical methane-air mixture at normal initial parameters, using values
Un and λn from Tab. 6.3 and other data from [39], we receive Qv
max =0,0947 ∙ 35875 (0,31/0,002) = 5,27 10
5 kW/m
3.
Let's notice here that almost same value QVmax
for a natural gas mixture (СН4 98 %) with air
has been received in [24] on the basis of investigations of turbulent combustion. For a stoichiometric
propane-air mixture in normal conditions it is received
Qvmax
=0,0402 ∙ 91350 (0,345/0,0017) = 7,44 105 kW/m
3.
For the mixture СО(29%) – air Тc = 2370 К; Un = 26,5 cm/s [14]. Then accordingly to (6.3)
we obtain:
λn = (0,11/26,5) ∙ (2370/293)1,95
= 0,245 cm,
Qvmax
= 0,29 ∙ 12645 (0,265/0,00245) = 3,97 105 kW/m
3.
The greatest values of a volumetric heat density of combustion are attained in mixtures С2Н2
and Н2. For a stoichiometrical acetylene-air mixture at normal initial parameters it is received
Qvmax
= 0,077 ∙ 56092 (1,25/0,00071) = 7,6 106 kW/m
3.
For the mixture hydrogen (30 %) – air
Qvmax
= 0,03 ∙ 10806 (1,7/0,00062) = 8,9 106 kW/m
3.

30
The volumetric heat density of burning is increasing sharply at replacement of air by oxygen.
So, for a mixture 2Н2 - О2 at normal initial parameters and values Un = 900 cm/s and λn = 0,018 cm it
is received: Qvmax
= 3,6 108 kW/m
3.
The increasing of initial mixture temperature yields considerable possibilities of combustion
intensification. So, for example, for a stoichiometric methane-air mixture at standard pressure and Т0
= 693 K the value Qvmax
= 1,5 106 kW/m
3 that 2,85 times more than at Т0 = 293 K.
Introducing of a characteristic λn in engineering calculations allows receiving the
important information necessary to select a mixture composition and its rational initial
parameters.
Apparently from the received results the values of heat density of combustion,
close to maximum, are attained in combustion chambers of a rather simple design
because of minimization of jets sizes of a combustible mixture.
8. Calculation of the length of a turbulent flame and
combustion chamber
As we could be convinced, the length of a turbulent flame is not the self-
maintained characteristic. It is spotted, first of all, by a flame volume and then (on
purely geometrical basis) by a flame form which is set by the aerodynamics of a jet
and by combustion chamber walls.
The compact combustion chambers in which a flame occupies (after disclosing)
all their cross-section represent practical interest. The shape of a free surface of a
flame does not change after its disclosing, and its length is spotted by linear relation
of a view,
Lf = p (l+a)(v0+ b). (8.1)
At approximating of experimental data for geometrically similar combustion
chambers and on the basis of dimensional theory it is received,
Un = m/(Π∙p), λn = a / Π. (8.2)
In such conditions the flame length, Ltf ≈ Vf / FCC. On the basis (1.2) it is
possible to write down,
Vf = m∙FCC∙v0/ωf . (8.3)
31
Then for the circular burner on the basis (2.4) we have
Ltf ≈ m∙v0((d0 +6λn)/6Un) . (8.4)
The formula (8.4) can be used and for burners of other type at m ≈ 0,5. Over the
range of velocities (υо = 20 50 m/s) the result is underrated on 5 10 % accordingly.
At the further increasing υо and m the lapse is decreasing.
For more exact calculation of sizes of combustion chamber it is necessary to
consider a flame filling factor as its volume (besides combustion zone) includes two
more zones. One of them is a recirculation zone with volume VRZ, second one is exit
zone of chamber - VEZ which spots concentration and temperature outlet patterns.
Volume VZR (at a flame tangency of combustion chamber walls) is spotted by its
sizes and an disclosing angle of a burning jet, β. The angle β for a flat burning jet is
equal 14 180, and for round jet - 21 23
0. For the circular burner and combustion
chamber it is received,
VRZ(cir)
= (πd02/4)(1/6m tg(β/2))((2+m)/m
0,5), [m
3]. (8.5)
For a flat fantail burner we have accordingly,
VRZ(s)
= (l2/4tg(β/2))((1-m)
2/m
2), [m
3]. (8.6)
The value VEZ as well as VRZ is spotted by cross-section of a jet, by a free area
coefficient, m and for a developed turbulent flow does not depend from υо
practically. Therefore the total volume of specified zones of combustion chamber can
be written down as,
ΔVCC=VRZ + VEZ = k VRZ, (8.7)
where k denotes an empirical coefficient of proportionality.
For example, for a slot-hole combustion chamber, taking into account empirical
equation for k, (8.6) and (8.7) it can be received,
LCC(s)
= (v0 m (bs + 4λn)/4Un)+(1,25/ bs 0,33
)(2+3m/tg(β/2)) (bs/ 4tg(β/2)) ((1-m)/m) 2
. (8.8)
32
In chambers with a central circular flameholder the value ΔVCC is generally
spotted by the volume VEZ which here at m ≈ 0,4 and big υо does not depend on m
and υо practically. For calculations LCC in this case it is possible to use formula:
LCC(min)
= W / (ωf FCC ) + 2,6∙DCC, (8.9)
where ωf is defined by (2.5).
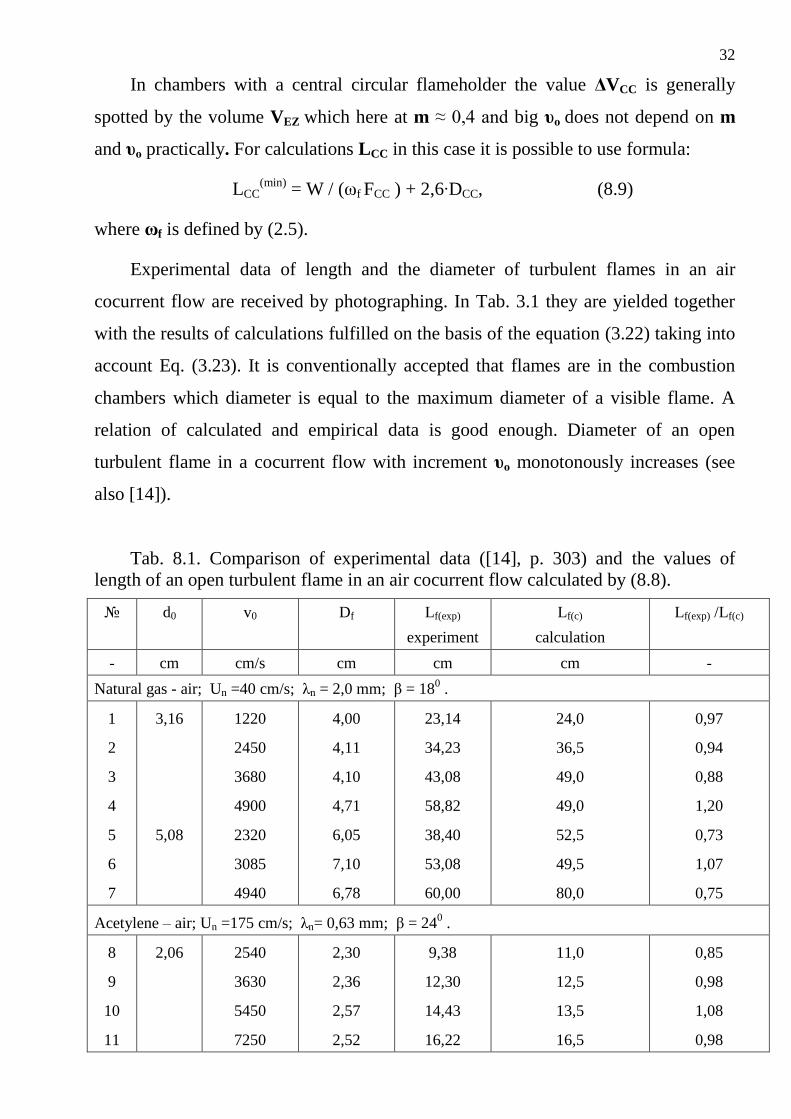
Experimental data of length and the diameter of turbulent flames in an air
cocurrent flow are received by photographing. In Tab. 3.1 they are yielded together
with the results of calculations fulfilled on the basis of the equation (3.22) taking into
account Eq. (3.23). It is conventionally accepted that flames are in the combustion
chambers which diameter is equal to the maximum diameter of a visible flame. A
relation of calculated and empirical data is good enough. Diameter of an open
turbulent flame in a cocurrent flow with increment υо monotonously increases (see
also [14]).
Tab. 8.1. Comparison of experimental data ([14], p. 303) and the values of
length of an open turbulent flame in an air cocurrent flow calculated by (8.8).
№
d0 v0 Df Lf(exp)
experiment
Lf(c)
calculation
Lf(exp) /Lf(c)
- cm cm/s cm cm cm -
Natural gas - air; Un =40 cm/s; λn = 2,0 mm; β = 180 .
1
2
3
4
5
6
7
3,16
5,08
1220
2450
3680
4900
2320
3085
4940
4,00
4,11
4,10
4,71
6,05
7,10
6,78
23,14
34,23
43,08
58,82
38,40
53,08
60,00
24,0
36,5
49,0
49,0
52,5
49,5
80,0
0,97
0,94
0,88
1,20
0,73
1,07
0,75
Acetylene – air; Un =175 cm/s; λn= 0,63 mm; β = 240 .
8
9
10
11
2,06 2540
3630
5450
7250
2,30
2,36
2,57
2,52
9,38
12,30
14,43
16,22
11,0
12,5
13,5
16,5
0,85
0,98
1,08
0,98
33
9. Structure of a laminar flame front
In the previous chapters we have spotted the turbulisation or intensive mixing
disturbs structure of a normal flame front which we can observe in the basic segment
of a laminar front. However it does not influence integrated characteristics of a process
and if after the beginning of a flame front formation this area has moved in the same
concentration pattern (for example, because of a turbulent conduction) the process of
formation of the front will proceed in precisely the same way.
Further we will consider the structure of a laminar flame front which is spotted by
concentration profiles and temperatures, related to distance on a normal line to a flame
front.
The knowledge about the profiles of particles of all kinds is demanded to
penetrate into the essence of chemical-kinetic processes and to calculate all possible
reactions with an adequate accuracy. A profile change due to the diffusion of each of
compounds should be thus considered.
On the phenomenological stage of investigations the task becomes simpler at
once. In this case, the knowledge about profiles of the most typical inconvertible
compounds, first of all about a limiting combustion product, is required besides a
temperature profile.
For definition λn the temperature profiles (Т - profile) and concentrations СО2
(СО2 - profile) is investigated. As additional information about general character of
process in the laminar flame front the nitrogen oxides (NOx) profiles explore.
9.1. Temperature measurements on the flame front thickness
The T-profile general view in a flame front can be received on the basis of
following reasoning. Admitting that a thermal conductivity Λ on a flame front
thickness is constant at the given value of density ρ0 and heat capacity сp we will
write down: ΔT ~ ρ0 cp / Λ. Each of the specified quantities is temperature function
(and, hence, is co-ordinate X function), and the complex which they form, is an
34
inverse quantity to a thermal diffusivity a. As it is known, for real gases a is function
of temperature of a view a = а0 Тn
(here the exponent n is close to 2,0). Taking into
account the told above, equation for dT/dx becomes,
dT/dx = Un (ρ0 cp/Λ) (T/T0)-n
(T-T0). (9.1)
If integrate this equation with n = 1,9 - 1,95 the result will reflect the real
character of dependence. The basic part of a real T-profile on the considerable length
from forward boundary of flame front represents almost straight line.
At measuring of T-profile in flame front by means of a thermoelectric couple it
is necessary to consider some specific moments. At measuring of temperature
difference with accuracy 0,5 degrees in the T-profile beginning, the area with rather
slow increase of temperature occurs 2-5 K/mm. It is less on 2-3 orders than it is
received at calculation by means of a thermal conductivity or the diffusion of high-
temperature reaction products.
The carried out investigations allow to explain the T-profile shape on an initial
sector of the front by influence of a radiant flux from a flame on thermoelectric
couple indications. This effect practically does not affect the basic part of a profile
when the thermoelectric couple is in flame front, but is rather essential at approach to
front when a thermocouple junction which is still in the field of an intermixture with
initial temperature and receives heat only at the expense of radiation. It is the reason
of appearance of an additional ("transitive") area of a T-profile in its beginning.
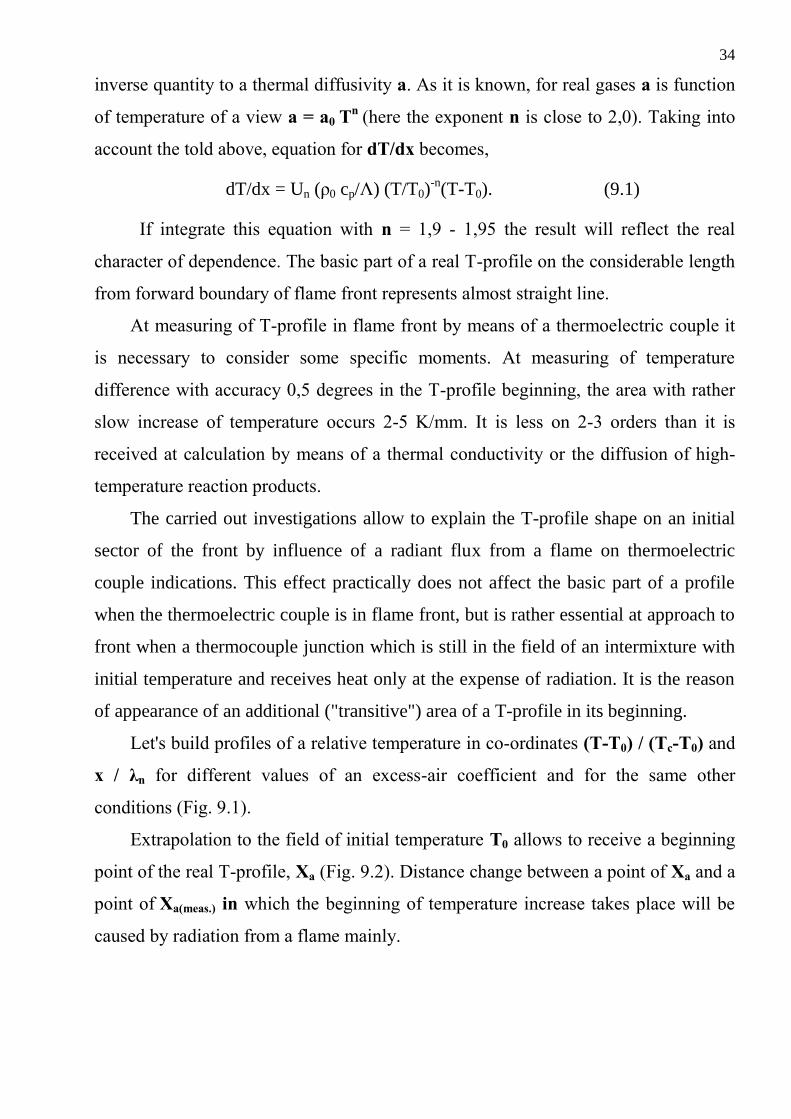
Let's build profiles of a relative temperature in co-ordinates (T-T0) / (Tc-T0) and
x / λn for different values of an excess-air coefficient and for the same other
conditions (Fig. 9.1).
Extrapolation to the field of initial temperature Т0 allows to receive a beginning
point of the real T-profile, Xa (Fig. 9.2). Distance change between a point of Xa and a
point of Xa(meas.) in which the beginning of temperature increase takes place will be
caused by radiation from a flame mainly.
35
Fig. 9.1. Influence of a flame radiation on initial area of a Т-profile at different values α.1 -
extrapolation of the basic area of the T-profile to initial temperature; the measured segment of the
T-profile; 2 - α = 1,13; 3 - α =1,29; 4 - α = 1,56.
The smaller temperature of a flame the smaller influence of radiation on the
thermocouple indications in an area before a front. So for α =1,13 (Tc ≈ 2100) the
value ΔХа = Xa(meas.) - Xa makes about 1,0 mm; for α =1,56 (Tc ≈ 1710) - 0,5 mm; and
for α =1,8 ΔХа ≈ 0,2 mm that is close to the estimate of effect of other factors we will
make below.
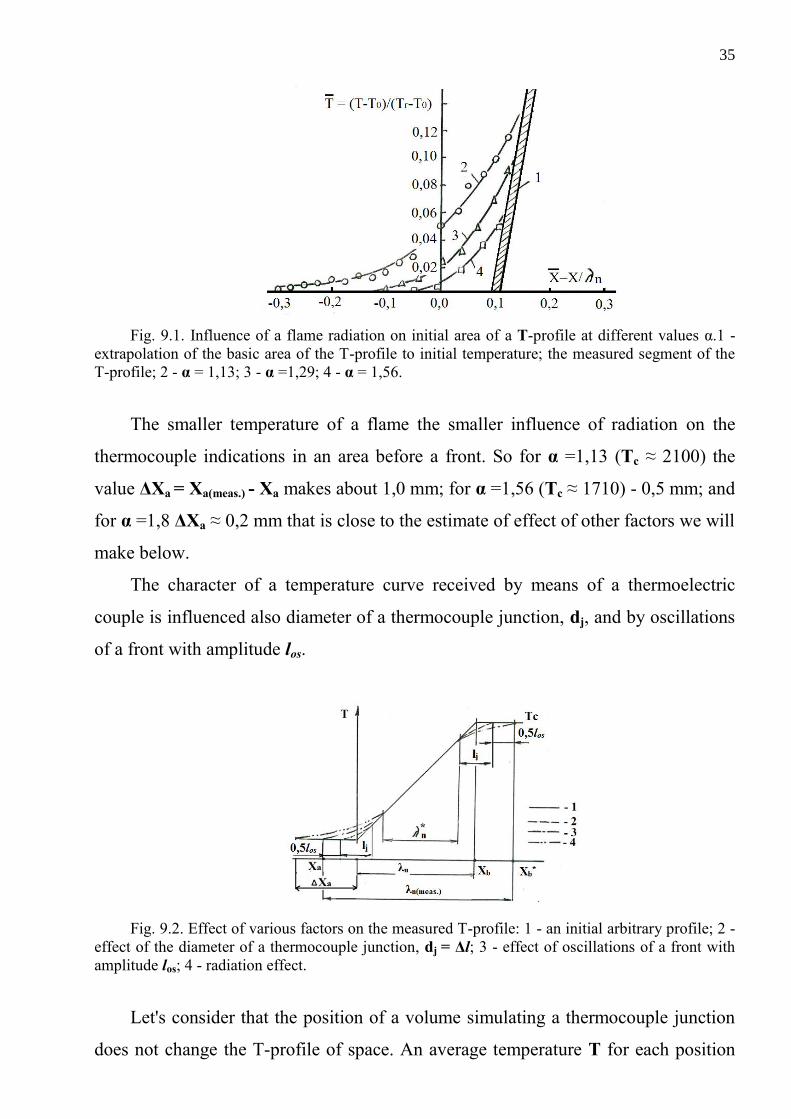
The character of a temperature curve received by means of a thermoelectric
couple is influenced also diameter of a thermocouple junction, dj, and by oscillations
of a front with amplitude los.
Fig. 9.2. Effect of various factors on the measured T-profile: 1 - an initial arbitrary profile; 2 -
effect of the diameter of a thermocouple junction, dj = Δl; 3 - effect of oscillations of a front with
amplitude los; 4 - radiation effect.
Let's consider that the position of a volume simulating a thermocouple junction
does not change the T-profile of space. An average temperature Т for each position
36
will be related with a co-ordinate х of a centre of a considered volume element. The
received graph Т - х has a shape, presented in (Fig. 9.2). The profile of the measured
temperature in transition points from Т = const to Т(x) "is rounded off" from each
side on thickness lj. On the basic segment (Хa - 0,5 lj) - (Xb - 0,5 lj) both profiles,
measured and real, coincide.
Thus, it is possible to consider that the measured thickness of a profile increases
in comparison with the real on value, dj due to a size of junction of thermoelectric
couple; and flame vibrations with amplitude los analogously increment it on value, los,
λn(meas.) = λn + dj + los . (9.2)
The segment length on which Т-х profile distorts from each side is equal: 0,5 (dj
+ los). Value los during our measuring makes about 0,1 mm. The same estimate is
made for flame front of a propane-air mixture in [40].
At finding of a point of Xa by extrapolation of the basic segment of the T-profile
in area of initial temperature its contortion on an initial segment on account of a
thermocouple junction finite value are automatically cut.
Thus, the breadth of normal front at a probe motion on a normal line to it is
spotted by equation
λn = Хb* - ΔХа – 0,5los - 0,5dj . (9.3)
Value Хb* is spotted as co-ordinate of the first point where the peak value of a
flame front temperature is attained.
The catalytic effect cannot exert appreciable agency on the T-profile and,
anyway, on a position of points of Xa and Xb*
where process only begins or has been
already finished.
The arrangement in one horizontal plane and attachment on a co-ordinate
support of a thermoelectric couple and a probe simultaneously (Fig. 9.3) allows at
certain spacing between them to receive satisfactory combination of profiles of
temperature and concentration for front of a V-shaped flame.
37
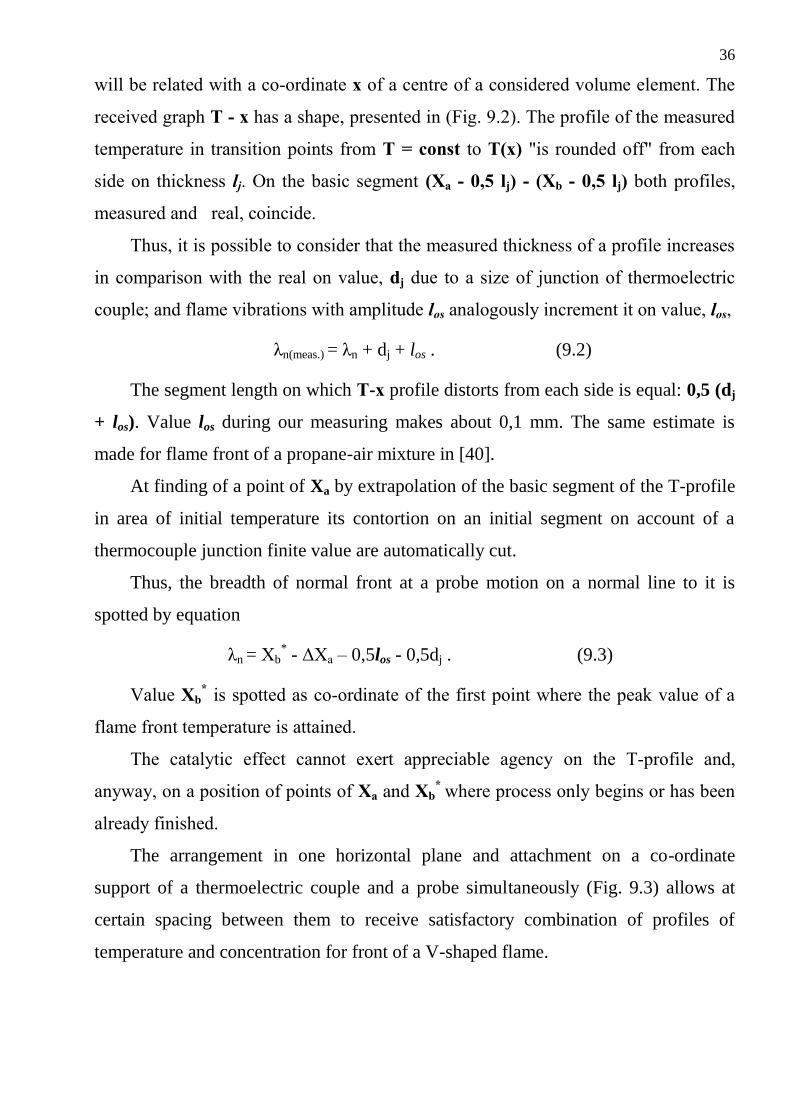
Fig. 9.3. Simultaneous measuring of temperature profiles and concentrations on a V-shaped flame: the microthermocouple with the microprobe on the micrometer co-ordinate
support (on the left); the probe for control of mixture ratio (on the right).
All cited data is received at horizontal motion of the thermoelectric couple.
Therefore for determination of the real value of flame front thickness it is necessary
to take into account the expansion angle of a flame β and a resolution of a
thermoelectric couple. For example, for our examinations: λn = [(Xb* - Xa) - 0,125]
cos (β/2) with accuracy of a resolution 0,05mm.
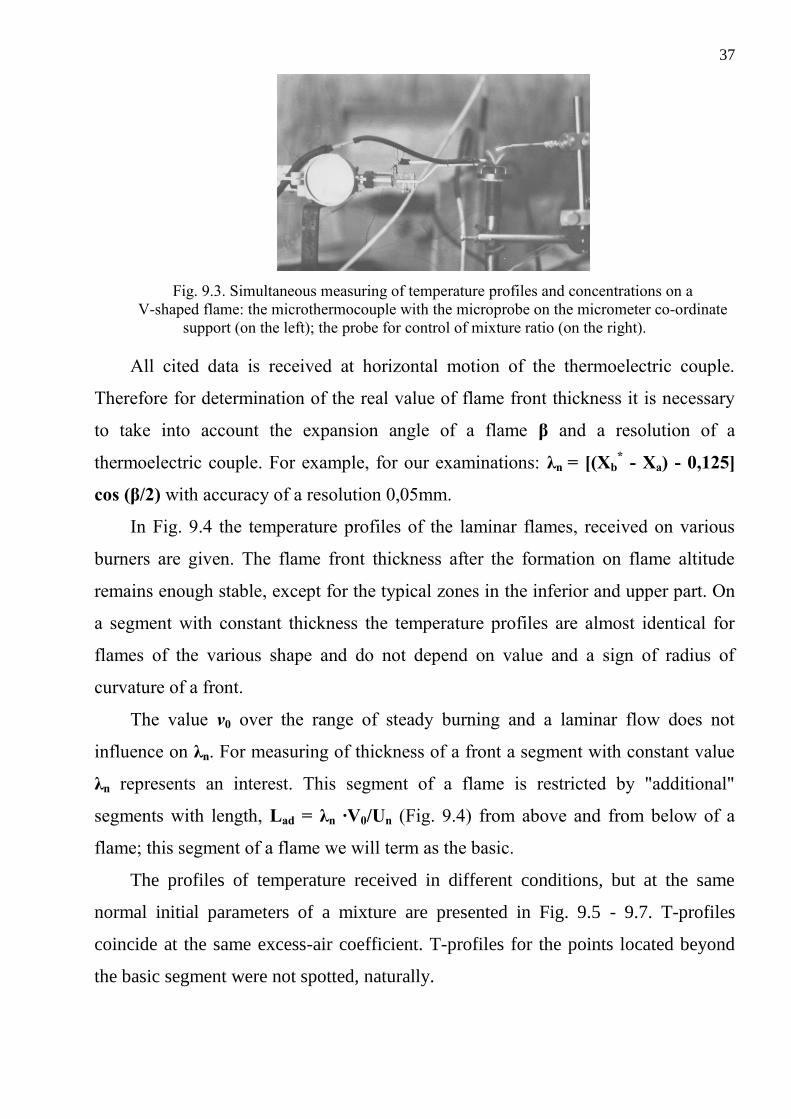
In Fig. 9.4 the temperature profiles of the laminar flames, received on various
burners are given. The flame front thickness after the formation on flame altitude
remains enough stable, except for the typical zones in the inferior and upper part. On
a segment with constant thickness the temperature profiles are almost identical for
flames of the various shape and do not depend on value and a sign of radius of
curvature of a front.
The value v0 over the range of steady burning and a laminar flow does not
influence on λn. For measuring of thickness of a front a segment with constant value
λn represents an interest. This segment of a flame is restricted by "additional"
segments with length, Lad = λn ∙V0/Un (Fig. 9.4) from above and from below of a
flame; this segment of a flame we will term as the basic.
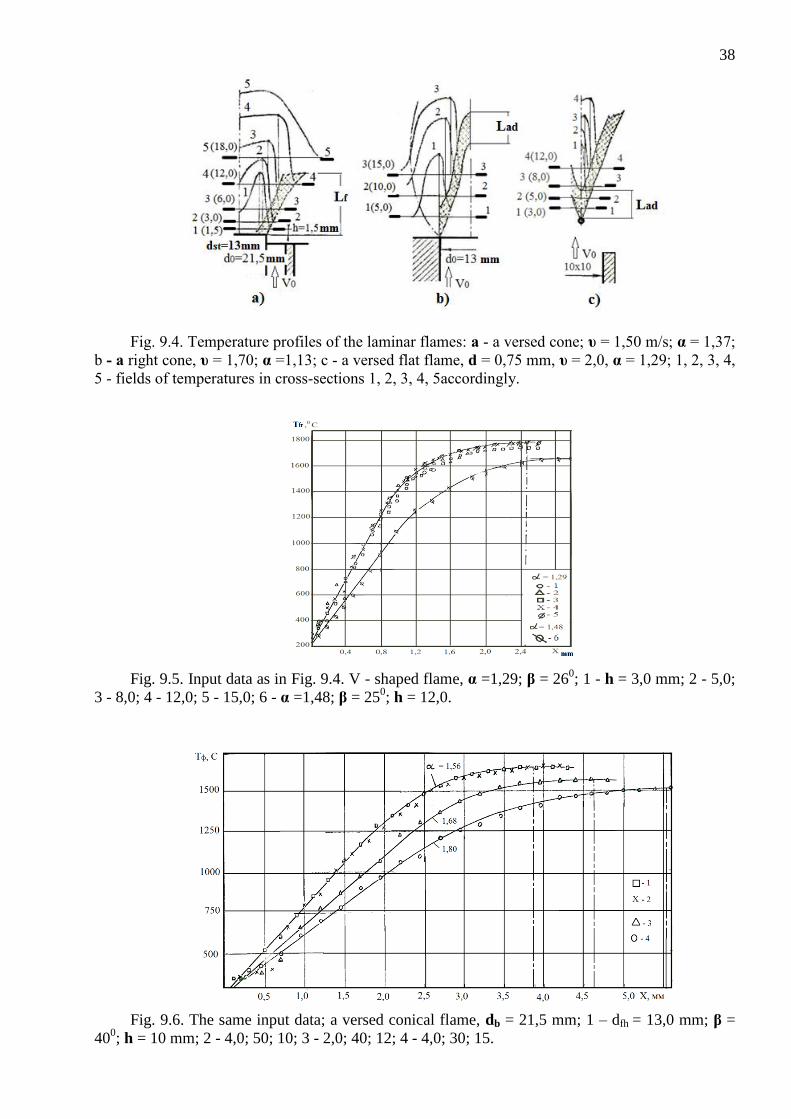
The profiles of temperature received in different conditions, but at the same
normal initial parameters of a mixture are presented in Fig. 9.5 - 9.7. T-profiles
coincide at the same excess-air coefficient. T-profiles for the points located beyond
the basic segment were not spotted, naturally.
38
Fig. 9.4. Temperature profiles of the laminar flames: a - a versed cone; υ = 1,50 m/s; α = 1,37;
b - a right cone, υ = 1,70; α =1,13; c - a versed flat flame, d = 0,75 mm, υ = 2,0, α = 1,29; 1, 2, 3, 4,
5 - fields of temperatures in cross-sections 1, 2, 3, 4, 5accordingly.
Fig. 9.5. Input data as in Fig. 9.4. V - shaped flame, α =1,29; β = 260; 1 - h = 3,0 mm; 2 - 5,0;
3 - 8,0; 4 - 12,0; 5 - 15,0; 6 - α =1,48; β = 250; h = 12,0.
Fig. 9.6. The same input data; a versed conical flame, db = 21,5 mm; 1 – dfh = 13,0 mm; β =
400; h = 10 mm; 2 - 4,0; 50; 10; 3 - 2,0; 40; 12; 4 - 4,0; 30; 15.
39
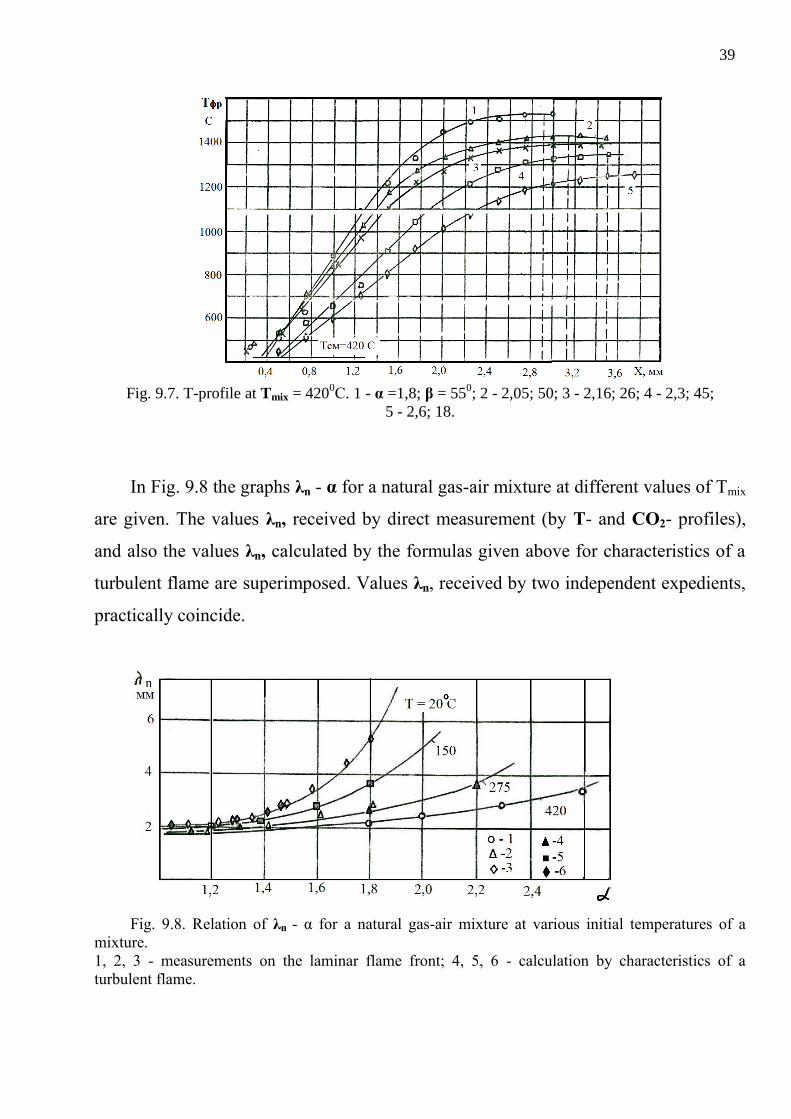
Fig. 9.7. T-profile at Tmix = 420
0С. 1 - α =1,8; β = 55
0; 2 - 2,05; 50; 3 - 2,16; 26; 4 - 2,3; 45;
5 - 2,6; 18.
In Fig. 9.8 the graphs λn - α for a natural gas-air mixture at different values of Tmix
are given. The values λn, received by direct measurement (by T- and СО2- profiles),
and also the values λn, calculated by the formulas given above for characteristics of a
turbulent flame are superimposed. Values λn, received by two independent expedients,
practically coincide.
Fig. 9.8. Relation of λn - α for a natural gas-air mixture at various initial temperatures of a
mixture.
1, 2, 3 - measurements on the laminar flame front; 4, 5, 6 - calculation by characteristics of a
turbulent flame.
40
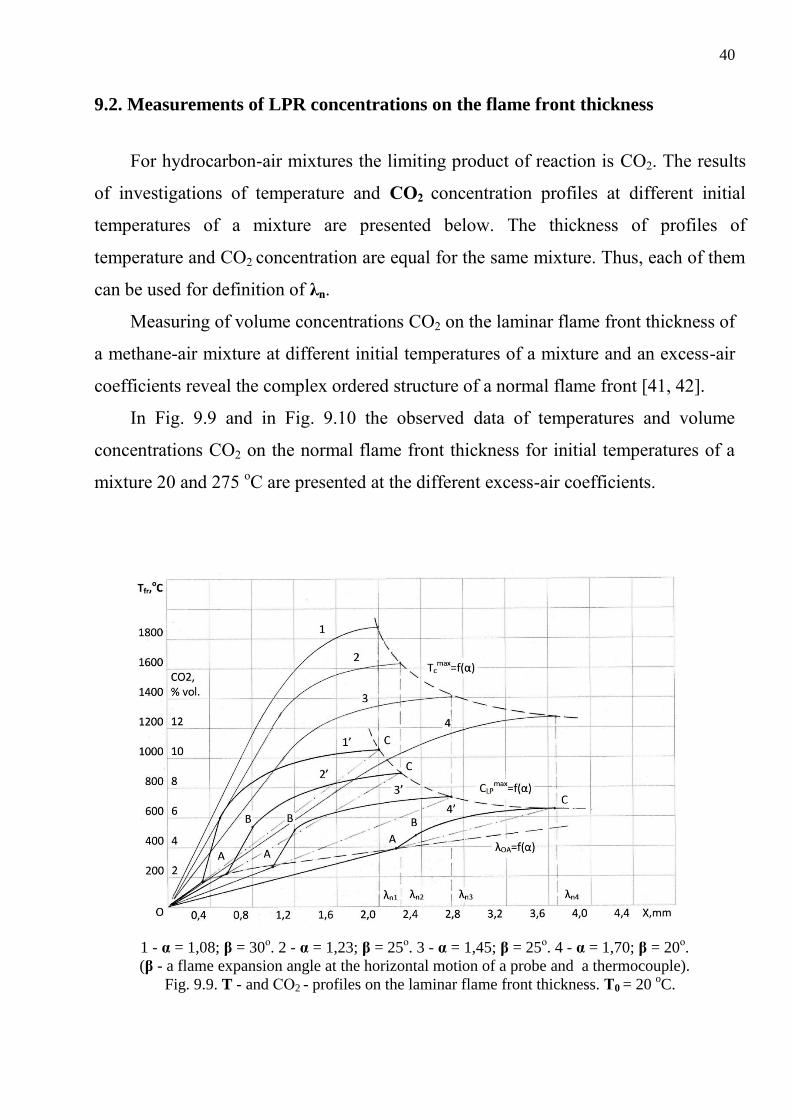
9.2. Measurements of LPR concentrations on the flame front thickness
For hydrocarbon-air mixtures the limiting product of reaction is СО2. The results
of investigations of temperature and CO2 concentration profiles at different initial
temperatures of a mixture are presented below. The thickness of profiles of
temperature and CO2 concentration are equal for the same mixture. Thus, each of them
can be used for definition of λn.
Measuring of volume concentrations СО2 on the laminar flame front thickness of
a methane-air mixture at different initial temperatures of a mixture and an excess-air
coefficients reveal the complex ordered structure of a normal flame front [41, 42].
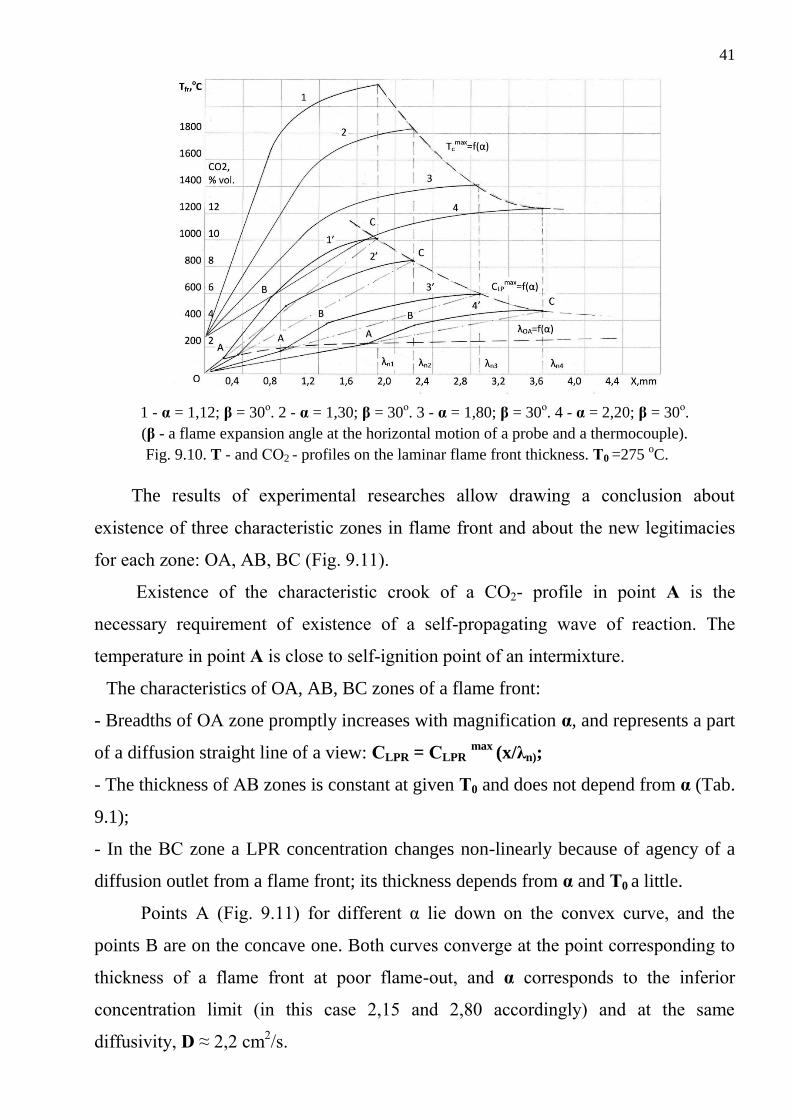
In Fig. 9.9 and in Fig. 9.10 the observed data of temperatures and volume
concentrations СО2 on the normal flame front thickness for initial temperatures of a
mixture 20 and 275 oС are presented at the different excess-air coefficients.
1 - α = 1,08; β = 30о. 2 - α = 1,23; β = 25
о. 3 - α = 1,45; β = 25
о. 4 - α = 1,70; β = 20
о.
(β - a flame expansion angle at the horizontal motion of a probe and a thermocouple). Fig. 9.9. T - and СО2 - profiles on the laminar flame front thickness. Т0 = 20
oC.
41
1 - α = 1,12; β = 30о. 2 - α = 1,30; β = 30
о. 3 - α = 1,80; β = 30
о. 4 - α = 2,20; β = 30
о.
(β - a flame expansion angle at the horizontal motion of a probe and a thermocouple).
Fig. 9.10. T - and СО2 - profiles on the laminar flame front thickness. Т0 =275 oC.
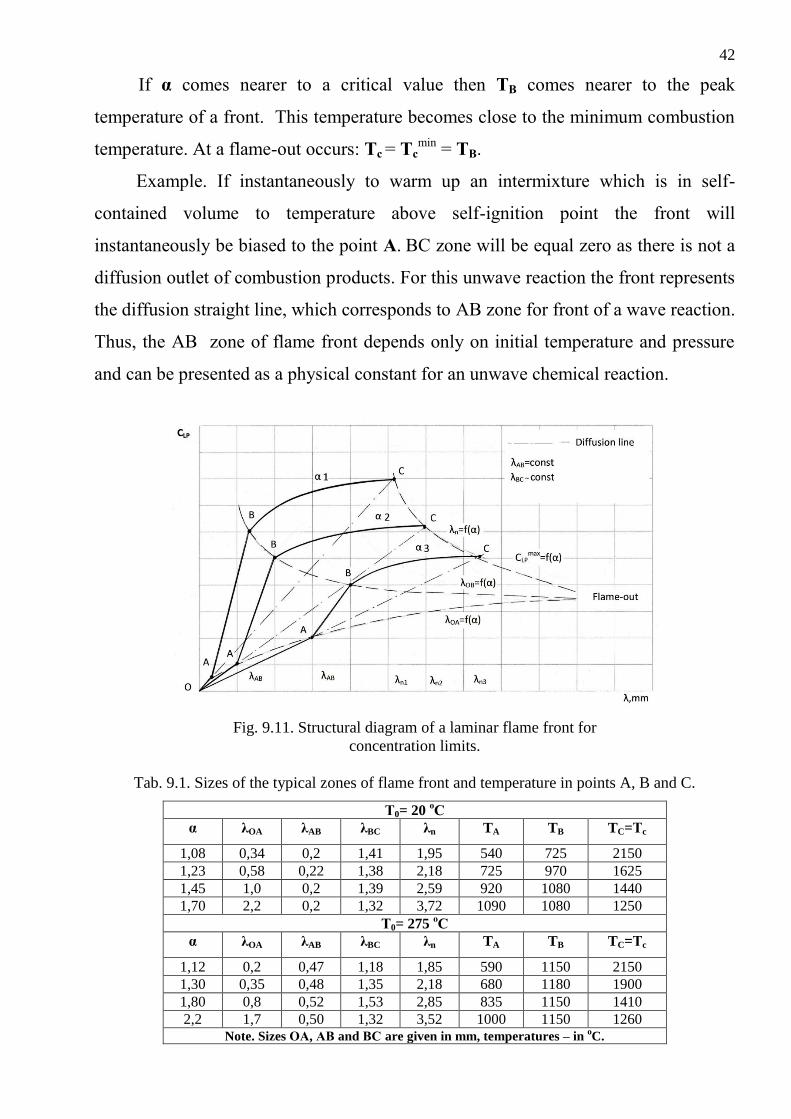
The results of experimental researches allow drawing a conclusion about
existence of three characteristic zones in flame front and about the new legitimacies
for each zone: OA, AB, BC (Fig. 9.11).
Existence of the characteristic crook of a СО2- profile in point A is the
necessary requirement of existence of a self-propagating wave of reaction. The
temperature in point A is close to self-ignition point of an intermixture.
The characteristics of OA, AB, BC zones of a flame front:
- Breadths of ОА zone promptly increases with magnification α, and represents a part
of a diffusion straight line of a view: СLPR = СLPR max
(x/λn);
- The thickness of АВ zones is constant at given Т0 and does not depend from α (Tab.
9.1);
- In the ВС zone a LPR concentration changes non-linearly because of agency of a
diffusion outlet from a flame front; its thickness depends from α and Т0 a little.
Points A (Fig. 9.11) for different α lie down on the convex curve, and the
points B are on the concave one. Both curves converge at the point corresponding to
thickness of a flame front at poor flame-out, and α corresponds to the inferior
concentration limit (in this case 2,15 and 2,80 accordingly) and at the same
diffusivity, D ≈ 2,2 cm2/s.
42
If α comes nearer to a critical value then TB comes nearer to the peak
temperature of a front. This temperature becomes close to the minimum combustion
temperature. At a flame-out occurs: Тc = Тcmin
= TB.
Example. If instantaneously to warm up an intermixture which is in self-
contained volume to temperature above self-ignition point the front will
instantaneously be biased to the point A. ВС zone will be equal zero as there is not a
diffusion outlet of combustion products. For this unwave reaction the front represents
the diffusion straight line, which corresponds to АВ zone for front of a wave reaction.
Thus, the AB zone of flame front depends only on initial temperature and pressure
and can be presented as a physical constant for an unwave chemical reaction.
Fig. 9.11. Structural diagram of a laminar flame front for
concentration limits.
Tab. 9.1. Sizes of the typical zones of flame front and temperature in points A, B and C.
Т0= 20 оС
α λOA λAB λBC λn TA TB TC=Тc
1,08 0,34 0,2 1,41 1,95 540 725 2150
1,23 0,58 0,22 1,38 2,18 725 970 1625
1,45 1,0 0,2 1,39 2,59 920 1080 1440
1,70 2,2 0,2 1,32 3,72 1090 1080 1250
Т0= 275 оС
α λOA λAB λBC λn TA TB TC=Тc
1,12 0,2 0,47 1,18 1,85 590 1150 2150
1,30 0,35 0,48 1,35 2,18 680 1180 1900
1,80 0,8 0,52 1,53 2,85 835 1150 1410
2,2 1,7 0,50 1,32 3,52 1000 1150 1260 Note. Sizes ОА, АВ and ВС are given in mm, temperatures – in
oC.
43
If an average reaction rate in a flame front, K, we can define using equation
ωn = Un/λn= 1/τr = K / CLPRmax
, (9.4)
then
K= CLPRmax
Un/λn . (9.5)
For the local values K the following we have
KOA ≠ f(T0); KAB ~ T0-1
; KBC ~ T00,5
; KAB/KOA ~ T0-1
. (9.6)
The necessary requirement of existence of a wave chemical reaction is a
magnification of generation rate LPR after a point A and presence of its diffusion
outlet after B. LPR diffusion rate does not depend from α.
To each LPR concentration the certain temperature in a flame front
corresponds irrespective of concentration of reactants (see Tab. 9.2). The diversion
from this rule is observed only in initial area of a front and at coefficients α, close to
1,0. It is caused by increment of a lapse of measuring at jump of parameters of a
front. But for our deductions the area with big α is more representative, and in this
area is almost full conformity of concentration LPR and temperatures is observed.
Табл. 9.2. Dependence of temperature of a front from LPR concentration at the same point
Т0 = 20 оС Т0 = 275
оС
α СО2,
%vol.
Тfr, оС
СО2,
%vol.
Тfr, оС
СО2,
%vol.
Тfr, оС
α СО2,
%vol.
Тfr, оС
СО2,
%vol.
Тfr, оС
СО2,
%vol.
Тfr, оС
1,08 2 550 4 650 6 750 1,12 2 800 3 900 4 1000
1,23 2 680 4 950 6 1150 1,30 2 850 3 1020 4 1030
1,45 2 690 4 1080 6 1200 1,80 2 900 3 1080 4 1180
1,70 2 680 4 1080 6 1200 2,20 2 900 3 1080 4 1180
It will be shown below the NO-profile practically retries a view ("tracks") of
СО2-profile; formation of nitrogen oxides begins and finishes in boundaries of the
laminar flame front. It is impossible to term the mechanism of their formation a
thermal; this mechanism is rigidly enough set by combustion process.
The normal (laminar) flame front is not any special object from the point of view
of chemical kinetics where microprocesses are managed by a specific macrostructure
of object. However, thanks to the ordered structure it allows to receive the integral
characteristics of process of burning in phenomenologically obvious view.
44
9.3. Chemical interpretation of the structure of a laminar front
A temperature profile and a concentration profile of СО2 as the product, formation
of which limits a combustion reaction rate of hydrocarbon-air (oxygen) mixtures
should reflect some general chemical and phenomenological features of the process.
On OA segment of a front the observed graph СО2 coincides with dependence
СLPR = СLPR max
(x/ λn), featuring diffusion allocation СО2 at the velocity of its
molecules which corresponds to the adiabatic combustion temperature of mixture Тc. It
is impossible to explain the shape of СО2 profile on this segment only on the physical
base, because value Тc for molecules СО2 on it can be supported only as a result of
their continuous formation in a reaction zone up to the forward boundary of a front.
Reaction of СО2 formation proceeds on ОА segment through the mechanism
which is essentially different from the mechanism, occurring on АВ segment where the
abrupt outburst of СО2 emission is observed. It is possibly that СО2 formation occurs
through the not branching chain reaction on ОА segment, and the way of process is
spotted here by hydrogen "burning-out". It follows from comparison Н2О- and СО2-
profiles in hydrocarbon flames. Formation of a peak value of Н2О concentration is
attained in the laminar front on (0,3 0,5) λn and takes place on initial area of АВ
segment.
When α is increasing the thickness of ОА segment promptly increases, while
general thickness of AC zone changes a little. The beginning of "cruption outburst" of
СО2 emission (if α is aimed to the inferior concentration limit - αin
) removes itself
further from a forward boundary of a front, and the absolute gain of СО2 concentration
on it promptly decreases.
The question about relation between self-ignition point ТSI (it is not a constant)
and ignition temperature in a front (it is a conventional quantity which can be related
with value ТSI only presumably) is difficult. But preliminarily ОА segment of a
laminar front can be viewed as the minimum thickness of a reaction zone at which
such development of process is attained that there is possible its further spreading into
a mixture irrespective of the further structural change of a front.
45
For an intermixture of natural gas with air at α close to 1,0 and at normal initial parametres it is
received: λn1 = Xa - Х0 = 0,25mm.
At a flame-out regime in Longvell reactor with d0 = 1,0mm the heat density of volume spotted
by the rate of flux of an intermixture at ηсг = 0,83 has made at Р =1bar the value QV = 26,7 108
kcal/m3∙h [15].
On the reactor with d0=1,75 at mixture complete combustion it has been received QV = 33,0 107
kcal/m3h. Recomputation by (2.5) for d0 =1,0mm yields QV = 37,0 10
7 kcal/m
3h.
Let's assume λn = 2mm. Then the average thickness of combustion zone attained in the reactor volume
on a flame-out regime can be spotted as the proportional quantity to the residence time of an intermixture in
the reactor or as inversely proportional to its rate of flux and correlates to λn1: λn (flame-out) = λn (37,0 107/26,7
108) (0,83/1,0) =0,23 mm.
Let's view, how the molecular weight and molecular composition of hydrocarbon
fuels influence chemical-physical constants. We already could be convinced that the
relations between chemical-physical constants have physical character. At the same
time constants are integrated characteristics of chemical kinetics. The description of
their by means of the dependences based on simplified mechanisms considering to
some extent «the basic features» of chemical process is possible with adequate
accuracy. But this accuracy is attained at the expense of empirical coefficients, suitable
only for a separated case. The formal character of these dependences detects itself
when the similar fuels (by the chemical nature), for example - hydrocarbons, cannot be
aggregated description Un on a general basis. Thus, the empirical coefficients entering
into these equations reflect properties of only narrow kind of hydrocarbon compounds.
Even the hydrocarbons entering into one homologous series, for example: 1-butin
and 2-butin, having an equal molecular weight and almost equal peak combustion
temperature (2413К and 2401К accordingly) considerably differ by value of the peak
velocity: Un =58,1 cm/s and 51,5 cm/s accordingly. Difference in structure which for
1-butina appears like C≡C-C-C, and for 2-butina C-C≡C-C and essentially changes
process kinetics that leads to individual character of the empirical coefficients entering
into relations for Un, for equations created on any base. Rather characteristic from the
point of view of blanket legitimacies of burning of hydrocarbons is the fact that (as it
was already noticed) the hydrogen which is a part of molecules of hydrocarbons, burns
out much earlier, than carbon.
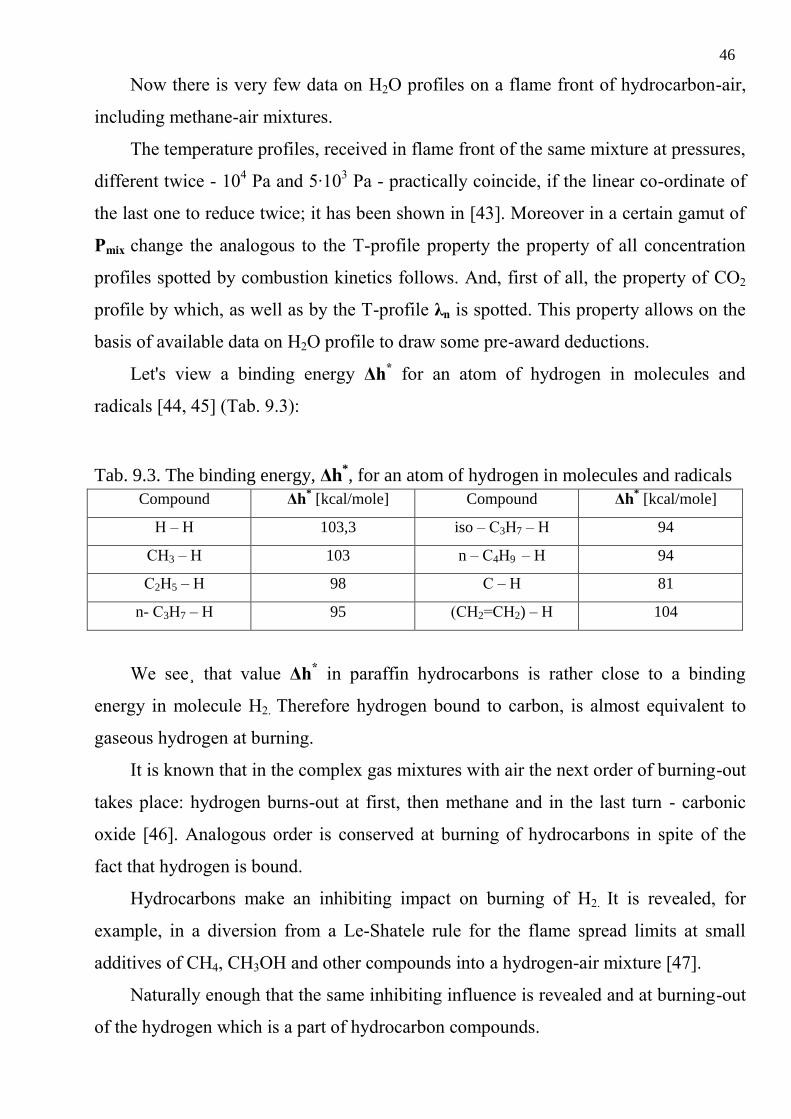
46
Now there is very few data on Н2О profiles on a flame front of hydrocarbon-air,
including methane-air mixtures.
The temperature profiles, received in flame front of the same mixture at pressures,
different twice - 104 Pa and 5∙10
3 Pa - practically coincide, if the linear co-ordinate of
the last one to reduce twice; it has been shown in [43]. Moreover in a certain gamut of
Pmix change the analogous to the T-profile property the property of all concentration
profiles spotted by combustion kinetics follows. And, first of all, the property of СО2
profile by which, as well as by the T-profile λn is spotted. This property allows on the
basis of available data on Н2О profile to draw some pre-award deductions.
Let's view a binding energy Δh* for an atom of hydrogen in molecules and
radicals [44, 45] (Tab. 9.3):
Tab. 9.3. The binding energy, Δh*, for an atom of hydrogen in molecules and radicals
Compound Δh* [kcal/mole] Compound Δh
* [kcal/mole]
Н – Н 103,3 iso – С3Н7 – Н 94
СН3 – Н 103 n – С4Н9 – Н 94
С2Н5 – Н 98 С – Н 81
n- С3Н7 – Н 95 (СН2=СН2) – Н 104
We see¸ that value Δh* in paraffin hydrocarbons is rather close to a binding
energy in molecule Н2. Therefore hydrogen bound to carbon, is almost equivalent to
gaseous hydrogen at burning.
It is known that in the complex gas mixtures with air the next order of burning-out
takes place: hydrogen burns-out at first, then methane and in the last turn - carbonic
oxide [46]. Analogous order is conserved at burning of hydrocarbons in spite of the
fact that hydrogen is bound.
Hydrocarbons make an inhibiting impact on burning of Н2. It is revealed, for
example, in a diversion from a Le-Shatele rule for the flame spread limits at small
additives of СН4, СН3ОН and other compounds into a hydrogen-air mixture [47].
Naturally enough that the same inhibiting influence is revealed and at burning-out
of the hydrogen which is a part of hydrocarbon compounds.
47
But, as we already see, kinetics, influencing chemical-physical constants, does not
influence their relations which are presented by Eq. (1.1) and (7.1).
Let's compare thickness of Н2О-profile in a methane-oxygen flame and in an
oxygen-hydrogen flame at equal Н2 concentrations.
In [48] for an intermixture of 7,85 % СН4 + 91,43 О2 at normal initial temperature
and Pmix = 10-2
MPa, Uн = 25cm/s; thus the thickness of Н2О profile is λn (Н20) = 0,3 cm
If the hydrogen, entered in СН4 to consider as if it is in free state as if Н2 then its
reduced concentration in a mixture will make approximately 16 %. We will calculate
Н2О-profile thickness for this case. And, we will take into account the following
condition. At burning of the free hydrogen in Н2-О2 mixture with such concentration
the value Un (Н2О) = 70 cm/s [30]. A certain value λn (Н20) and ωn (Н20) = Un (Н2О) / λn (Н20)
corresponds to this velocity.
At burning of the hydrogen which is a part of methane, rate of speed Un is defined
by the limiting product - СО2. But mass rate of burning out of hydrogen should not
change, i.e. the value ωn (Н20) for the reasons, viewed earlier should remain a stationary
value. But then the value λn (Н20) should decrease accordingly to ratio Un/Un (Н2О) also.
Taking into account it for Н2О-profile thickness in methane-oxygen flame front we
will write down according to (6.4), assuming for hydrogen n = 1,8 and m ≈ 0 [28],
λn(Н20) = (Un/ Un(Н2О))(DН2О0/ Un(Н20))(Тc/293)
1,8(Рmix/Р0)
-1 . (9.7)
For given case Тc = 1850 K [49]. Substituting all values in (9.7), we receive
λn (Н20) = 0,33 cm. This result is in good conformity with experimental data yielded in
[48].
Let's view one more instance. In [35] profiles of concentrations of an intermixture
9,6%СН4 - 21,3%О2 - 69,1%Ar were explored at initial parameters of Tmix = 293 K
and Pmix = 4∙10-2
МPa, Тc = 1850К, Un = 85 cm/s. In transfer on Н2 according to [50],
taking into account the value Pmix is found Uн(Н2О) = 180 cm/s. It is received by (5.22):
λn(Н20) = 0,45 cm. In [35] an observed Н2О profile has thickness λn (Н2О) ≈ 0,5 cm.
So, really, it is possible to consider that hydrogen burns-out in hydrocarbons thus
as if it is in the free molecular state.
48
9.4. The general combustion mechanism of hydrocarbons
It has been above told that not only λn, but also some building blocks of the
laminar front reflect its phenomenological properties. But at the same time, apparently,
they reflect also some common features of chemical transfomations of hydrocarbons in
flame front. This process, as we see, is in many respects spotted by general physical
characteristics. In this sense the fact of "burning-out" of hydrogen under the schema
which is not dependent on a view of hydrocarbon fuel is rather important. At the same
time and features of combustion of various fuels can be explained on general chemical-
physical basis.
A tensile energy of hydrogen atom from СН2-group in molecules of paraffin
hydrocarbons has such values (kcal/mole) [45].
93,6 88,8 86,9 86,1 85,8 85,7 85,7 85,8 86,1 86,9 88,8 93,6
(9.8) C- C- C- C- C- C- C- C- C- C- C- C-
This energy does not change practically, since the fifth carbon atom from the
chain end. Tensile energy of C-C bond is less than of С-Н bond. Tensile energy СН3-
СН2 - bond is more than dissociation energy СН2-СН2 (Tab. 9.4).
Tab. 9.4. Values of tensile energy of hydrogen atom from CN2-group.
kcal/mole kcal/mole
СН3– СН3 86,0 С2Н5 – С2Н5 79,5
С2Н5 – СН3 80,5 n - С3Н7 – n - С3Н7 76,0
С3Н7 – СН3 81,0 n – С4Н9 – СН3 80,0
Just the relations of tensile energies that are given in (9.8) and Tab. 9.4 are
spotting a sequence of destruction of long chained molecules of hydrocarbons in flame
front.
It is possible to draw a conclusion that the intermediate substances are formed not
as a result of a consecutive chain reaction, but arise, as it has been shown, at
49
independent "burning-out" of hydrogen, and the sequence of bond breaking is spotted
by their energy correspondingly, for example, Tab. 9.4.
This standing proves to be true also that for hexane-air mixtures a value λn is less
than for methane-air mixtures.
The beginning of burning of methane is investigated well enough [51]: СН4 + M
→СН3 + Н + M where a role of a particle M can carry out Н, OH, O, etc. It is natural
that hydrogen from chains middle comes off under the same schema, and, according to
(5.23), with more probability, than at the ends.
For methane the chain leading to СО2 looks like [51]:
СН4 СН3 СН2О СНО СО, (9.9)
For acetylene this chain is shorter [52]:
2 2 НС Н Н
2С С О СН СО (9.10)
But also in this case, Н2О formation in comparison with СО2 formation is leading
(see [53, p.169]).
The chemical-physical combustion mechanism of different hydrocarbons has
blanket character, and those features of kinetics which are caused by character of
bonds of atoms of carbon, have no principal value.
10. Formation of nitrogen oxides in a flame front
The results of measuring of volume concentrations СО2, Н2О and NO on a
thickness of the laminar flame front of a methane-air mixture at initial temperature,
Т0 = 20 oС, carried out in [42, 54, 55], are presented in a Fig. 10.1. Examinations
were made on V-shaped flames by means of a microprobe with outside and inner
diameter 0,15 and 0,05 mm accordingly.
The basic feature of NO-formation process in a front is that a profile of its
concentration is similar to the LPR-profile. Zones ОА and АВ for NO-profile coincide
with analogous for LPR by location and thickness. The same apparently occurs and for
the Н2О-profiles. Additional experiments are necessary to defining more precise
location of the typical zones of Н2О-profiles.
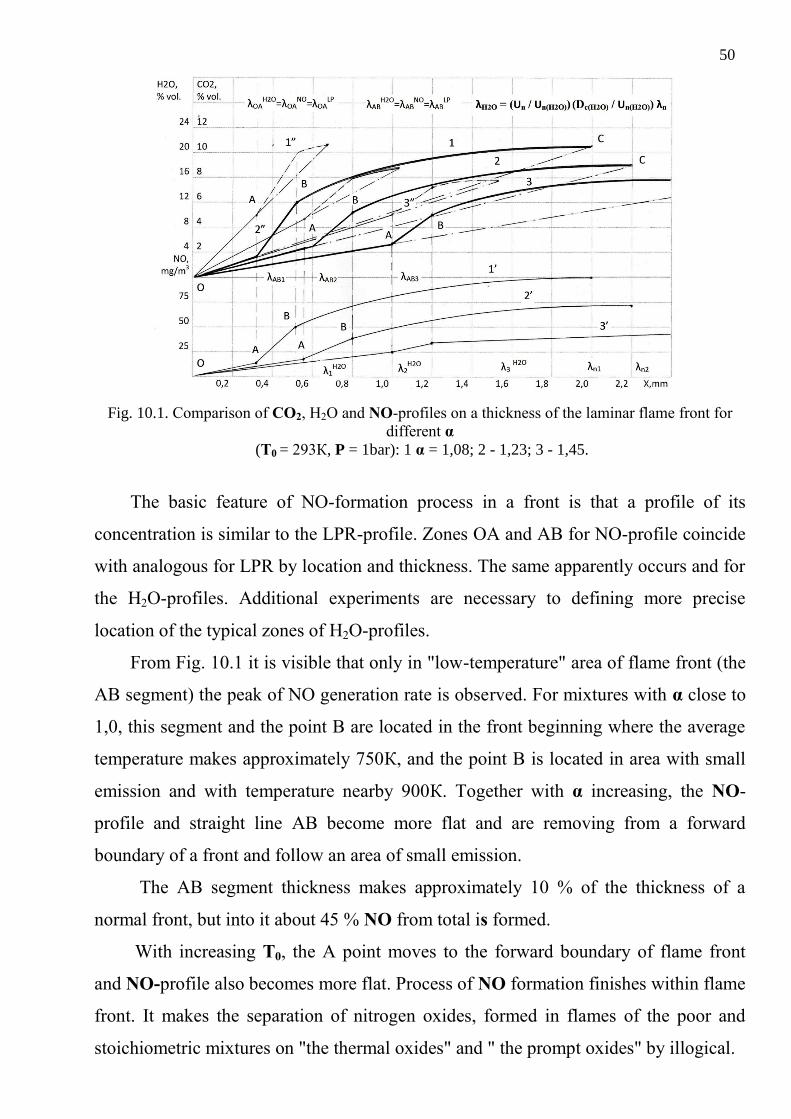
50
Fig. 10.1. Comparison of CO2, H2O and NO-profiles on a thickness of the laminar flame front for
different α (Т0 = 293К, P = 1bar): 1 α = 1,08; 2 - 1,23; 3 - 1,45.
The basic feature of NO-formation process in a front is that a profile of its
concentration is similar to the LPR-profile. Zones ОА and АВ for NO-profile coincide
with analogous for LPR by location and thickness. The same apparently occurs and for
the Н2О-profiles. Additional experiments are necessary to defining more precise
location of the typical zones of Н2О-profiles.
From Fig. 10.1 it is visible that only in "low-temperature" area of flame front (the
АВ segment) the peak of NO generation rate is observed. For mixtures with α close to
1,0, this segment and the point B are located in the front beginning where the average
temperature makes approximately 750К, and the point B is located in area with small
emission and with temperature nearby 900К. Together with α increasing, the NO-
profile and straight line АВ become more flat and are removing from a forward
boundary of a front and follow an area of small emission.
The АВ segment thickness makes approximately 10 % of the thickness of a
normal front, but into it about 45 % NO from total is formed.
With increasing Т0, the A point moves to the forward boundary of flame front
and NO-profile also becomes more flat. Process of NO formation finishes within flame
front. It makes the separation of nitrogen oxides, formed in flames of the poor and
stoichiometric mixtures on "the thermal oxides" and " the prompt oxides" by illogical.
51
Let's notice that the ionic profile NO + received in [56] for mixture CH4 - O2 - N2,
Tc = 2400К is rather close to the NOx-profiles received in the present investigations
for a mixture of natural gas (CH4 98 %) with air.
Effect of initial temperature on NO formation depends on Тc ambiguously also.
Different character of dependence NOx - Tmix in various temperatures Тc has not only
practical value, but represents also theoretical interest from the point of view of
revealing NOx formation kinetics at combustion.
Complexity of the mechanism (or mechanisms) NOx formations makes the more
systematized approach to phenomenological researches of NOx formation process
extremely necessary. Requirements should be maximally simple from the point of
view of external influencing factors. For determination of a dynamic causal
relationship in investigations of the given series of experiments the one only
influencing factor should be changing if it possibly.
This principle has been implemented at investigation of formation NOx at 2-stage
burning of gas [57 - 59]. Here, from the point of view of existing representations about
the mechanism of NOx formation, the most unexpected effects have been received.
10.1. Formation of nitrogen oxides at a stage burning of gas
From the technological point of view is available three principal expedient of
burning of gas. They differ among themselves by method of mixing of gaseous fuel
with air: 1) burning of a homogeneous mixture (kinetic); 2) diffusion gas burning; 3)
the burning with partial initial mixing of gas with air.
For defining the comparable results in such difficult conditions an experiment
should be definitely idealized for that the restricted number of explored alternatives
has allowed to receive full enough pattern of interconnection of performances and
parameters of processes.
In this connection the research technique when change of one factor allowed to
receive all views of burning has been used. The quantity of air was this factor; it is
possible to term it primary (this air is given for premixing with gas). Three schemas of
the organisation of burning were explored: 1) burning of partially aerated intermixture
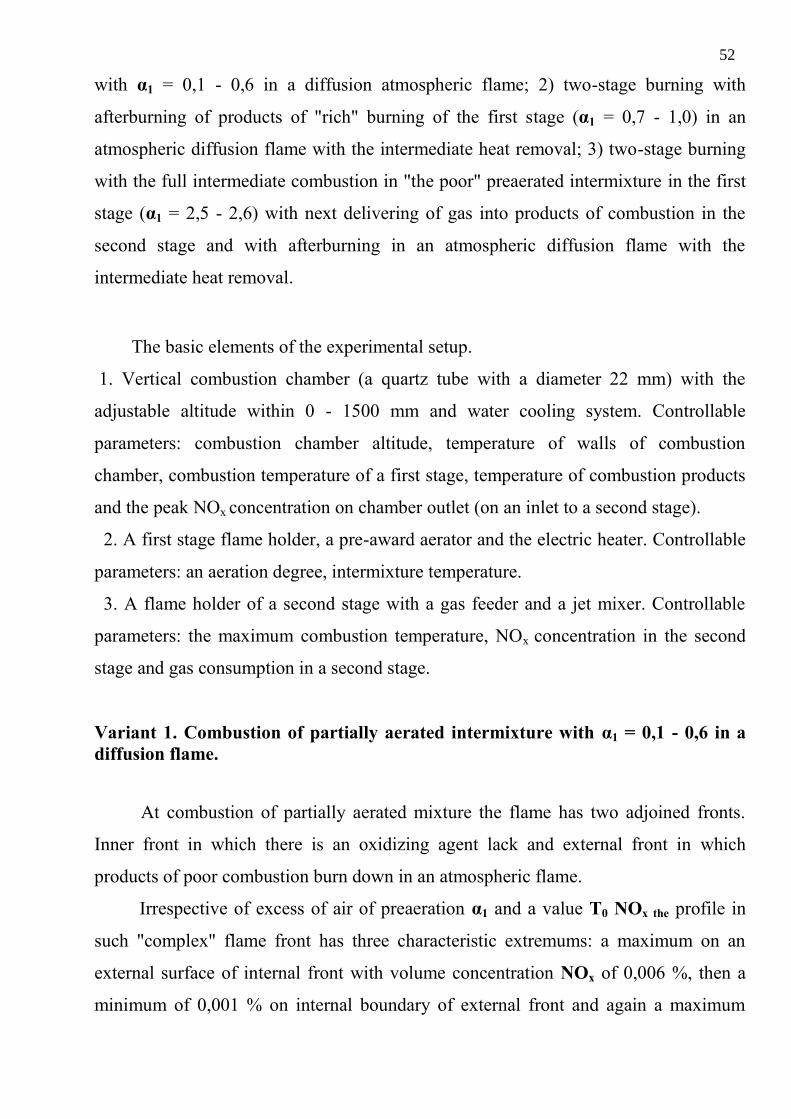
52
with α1 = 0,1 - 0,6 in a diffusion atmospheric flame; 2) two-stage burning with
afterburning of products of "rich" burning of the first stage (α1 = 0,7 - 1,0) in an
atmospheric diffusion flame with the intermediate heat removal; 3) two-stage burning
with the full intermediate combustion in "the poor" preaerated intermixture in the first
stage (α1 = 2,5 - 2,6) with next delivering of gas into products of combustion in the
second stage and with afterburning in an atmospheric diffusion flame with the
intermediate heat removal.
The basic elements of the experimental setup.
1. Vertical combustion chamber (a quartz tube with a diameter 22 mm) with the
adjustable altitude within 0 - 1500 mm and water cooling system. Controllable
parameters: combustion chamber altitude, temperature of walls of combustion
chamber, combustion temperature of a first stage, temperature of combustion products
and the peak NOx concentration on chamber outlet (on an inlet to a second stage).
2. A first stage flame holder, a pre-award aerator and the electric heater. Controllable
parameters: an aeration degree, intermixture temperature.
3. A flame holder of a second stage with a gas feeder and a jet mixer. Controllable
parameters: the maximum combustion temperature, NOx concentration in the second
stage and gas consumption in a second stage.
Variant 1. Combustion of partially aerated intermixture with α1 = 0,1 - 0,6 in a
diffusion flame.
At combustion of partially aerated mixture the flame has two adjoined fronts.
Inner front in which there is an oxidizing agent lack and external front in which
products of poor combustion burn down in an atmospheric flame.
Irrespective of excess of air of preaeration α1 and a value T0 NOx the profile in
such "complex" flame front has three characteristic extremums: a maximum on an
external surface of internal front with volume concentration NOx of 0,006 %, then a
minimum of 0,001 % on internal boundary of external front and again a maximum
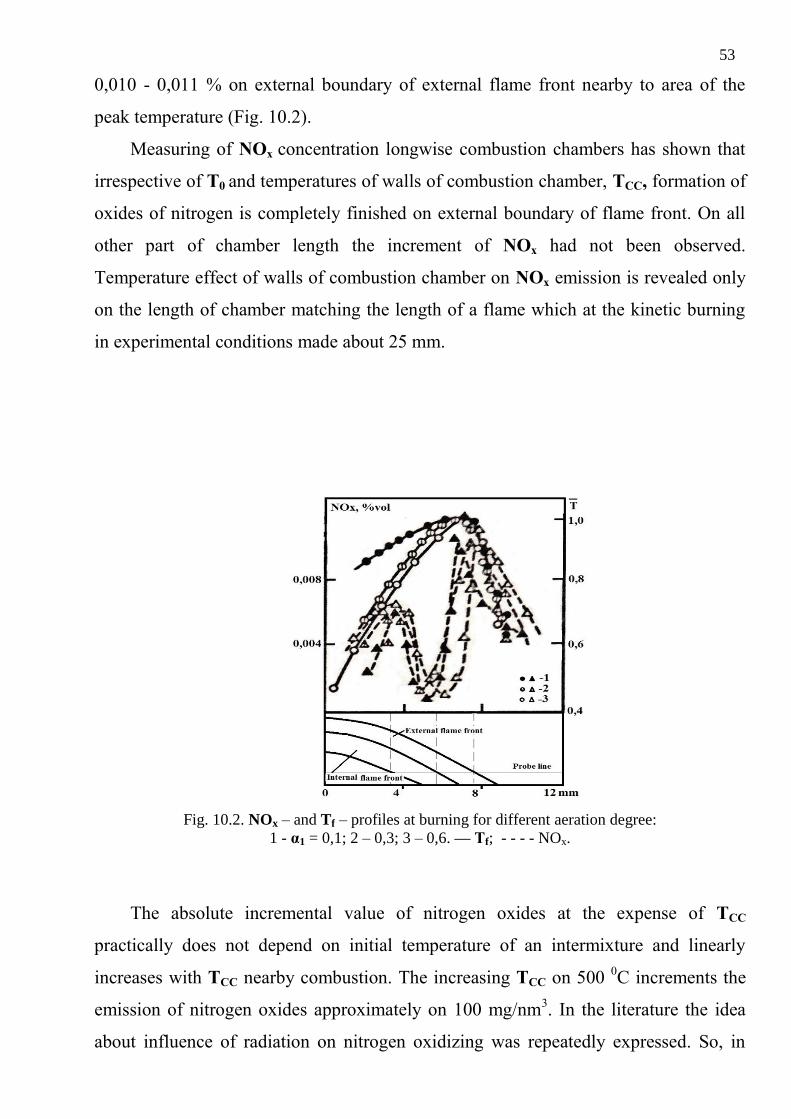
53
0,010 - 0,011 % on external boundary of external flame front nearby to area of the
peak temperature (Fig. 10.2).
Measuring of NOx concentration longwise combustion chambers has shown that
irrespective of Т0 and temperatures of walls of combustion chamber, ТСС, formation of
oxides of nitrogen is completely finished on external boundary of flame front. On all
other part of chamber length the increment of NOx had not been observed.
Temperature effect of walls of combustion chamber on NOx emission is revealed only
on the length of chamber matching the length of a flame which at the kinetic burning
in experimental conditions made about 25 mm.
Fig. 10.2. NOx – and Tf – profiles at burning for different aeration degree:
1 - α1 = 0,1; 2 – 0,3; 3 – 0,6. — Тf; - - - - NOx.
The absolute incremental value of nitrogen oxides at the expense of ТСС
practically does not depend on initial temperature of an intermixture and linearly
increases with ТСС nearby combustion. The increasing ТСС on 500 0С increments the
emission of nitrogen oxides approximately on 100 mg/nm3. In the literature the idea
about influence of radiation on nitrogen oxidizing was repeatedly expressed. So, in
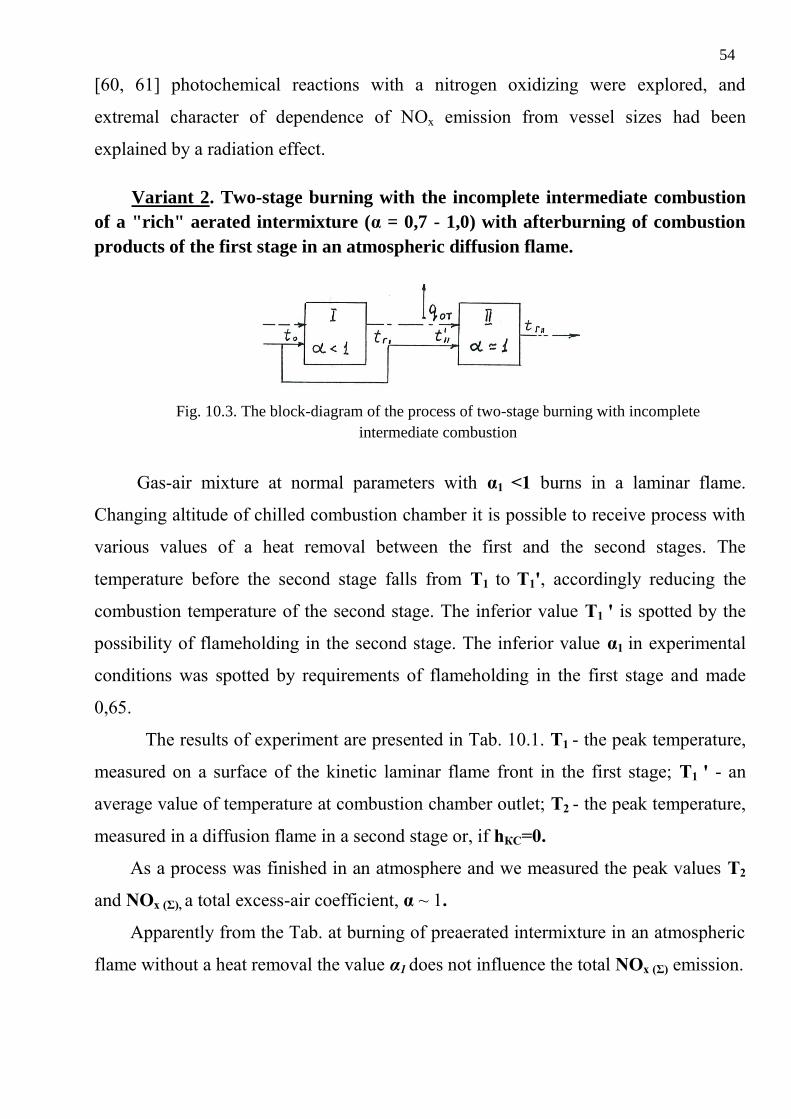
54
[60, 61] photochemical reactions with a nitrogen oxidizing were explored, and
extremal character of dependence of NОх emission from vessel sizes had been
explained by a radiation effect.
Variant 2. Two-stage burning with the incomplete intermediate combustion
of a "rich" aerated intermixture (α = 0,7 - 1,0) with afterburning of combustion
products of the first stage in an atmospheric diffusion flame.
Fig. 10.3. The block-diagram of the process of two-stage burning with incomplete
intermediate combustion
Gas-air mixture at normal parameters with α1 <1 burns in a laminar flame.
Changing altitude of chilled combustion chamber it is possible to receive process with
various values of a heat removal between the first and the second stages. The
temperature before the second stage falls from T1 to T1', accordingly reducing the
combustion temperature of the second stage. The inferior value T1 ' is spotted by the
possibility of flameholding in the second stage. The inferior value α1 in experimental
conditions was spotted by requirements of flameholding in the first stage and made
0,65.
The results of experiment are presented in Tab. 10.1. T1 - the peak temperature,
measured on a surface of the kinetic laminar flame front in the first stage; T1 ' - an
average value of temperature at combustion chamber outlet; T2 - the peak temperature,
measured in a diffusion flame in a second stage or, if hКС=0.
As a process was finished in an atmosphere and we measured the peak values T2
and NOx (Σ), a total excess-air coefficient, α ~ 1.
Apparently from the Tab. at burning of preaerated intermixture in an atmospheric
flame without a heat removal the value α1 does not influence the total NOx (Σ) emission.
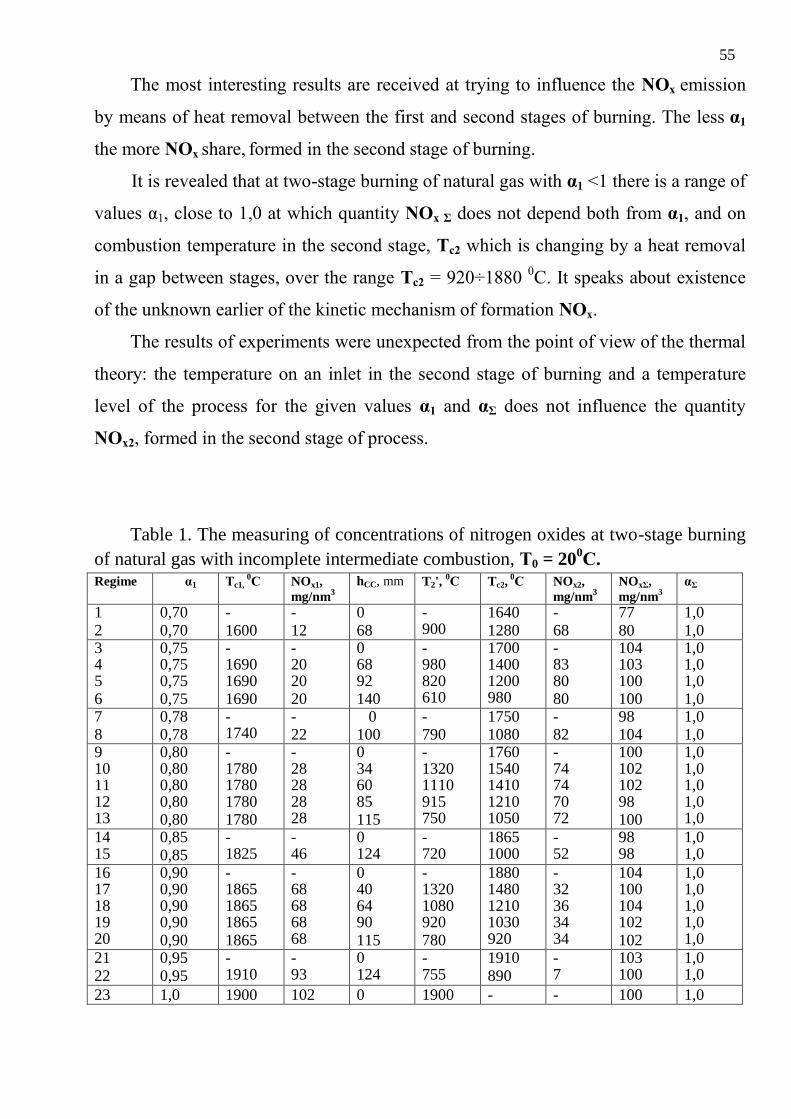
55
The most interesting results are received at trying to influence the NOx emission
by means of heat removal between the first and second stages of burning. The less α1
the more NOx share, formed in the second stage of burning.
It is revealed that at two-stage burning of natural gas with α1 <1 there is a range of
values α1, close to 1,0 at which quantity NOx Σ does not depend both from α1, and on
combustion temperature in the second stage, Тc2 which is changing by a heat removal
in a gap between stages, over the range Тc2 = 920÷1880 0С. It speaks about existence
of the unknown earlier of the kinetic mechanism of formation NOx.
The results of experiments were unexpected from the point of view of the thermal
theory: the temperature on an inlet in the second stage of burning and a temperature
level of the process for the given values α1 and αΣ does not influence the quantity
NOx2, formed in the second stage of process.
Table 1. The measuring of concentrations of nitrogen oxides at two-stage burning
of natural gas with incomplete intermediate combustion, Т0 = 200С.
Regime α1 Тc1, 0С NOx1,
mg/nm3
hCC, mm T2', 0С Tc2,
0С NOx2,
mg/nm3
NOxΣ,
mg/nm3
αΣ
1 2
0,70 0,70
- 1600
- 12
0 68
- 900
1640 1280
- 68
77 80
1,0 1,0
3 4 5 6
0,75 0,75 0,75 0,75
- 1690 1690 1690
- 20 20 20
0 68 92 140
- 980 820 610
1700 1400 1200 980
- 83 80 80
104 103 100 100
1,0 1,0 1,0 1,0
7 8
0,78 0,78
- 1740
- 22
0 100
- 790
1750 1080
- 82
98 104
1,0 1,0
9 10 11 12 13
0,80 0,80 0,80 0,80 0,80
- 1780 1780 1780 1780
- 28 28 28 28
0 34 60 85 115
- 1320 1110 915 750
1760 1540 1410 1210 1050
- 74 74 70 72
100 102 102 98 100
1,0 1,0 1,0 1,0 1,0
14 15
0,85 0,85
- 1825
- 46
0 124
- 720
1865 1000
- 52
98 98
1,0 1,0
16 17 18 19 20
0,90 0,90 0,90 0,90 0,90
- 1865 1865 1865 1865
- 68 68 68 68
0 40 64 90 115
- 1320 1080 920 780
1880 1480 1210 1030 920
- 32 36 34 34
104 100 104 102 102
1,0 1,0 1,0 1,0 1,0
21 22
0,95 0,95
- 1910
- 93
0 124
- 755
1910 890
- 7
103 100
1,0 1,0
23 1,0 1900 102 0 1900 - - 100 1,0
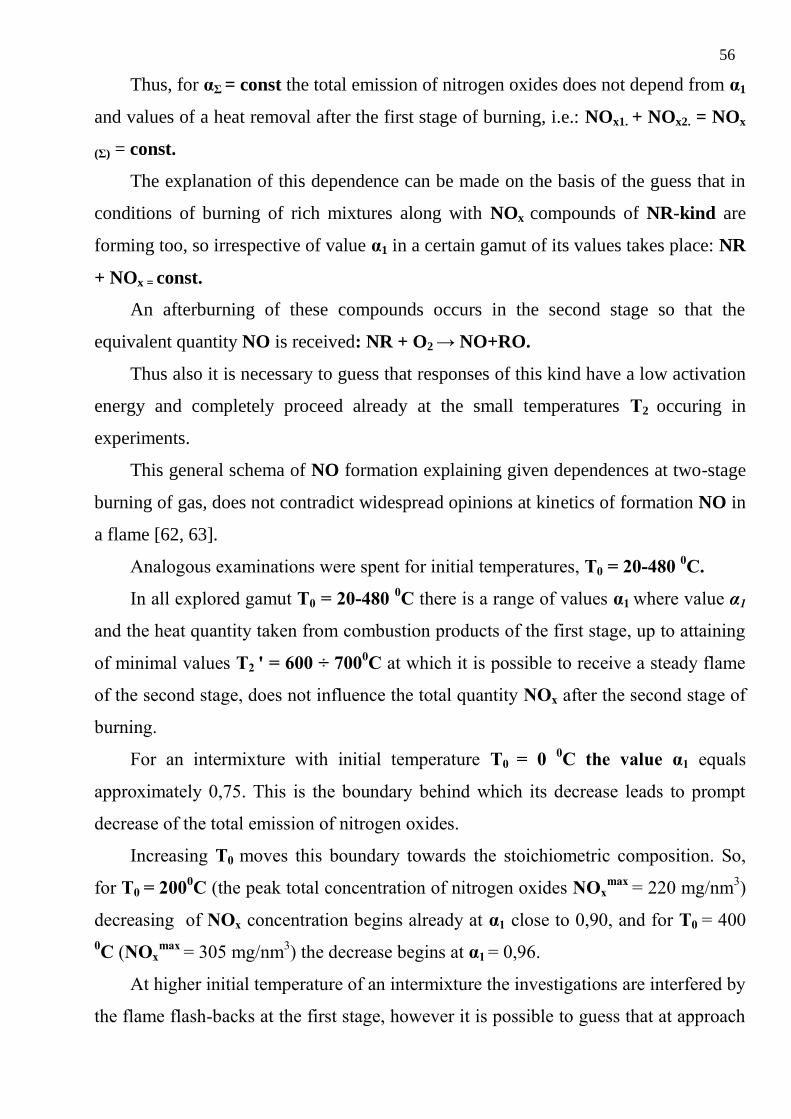
56
Thus, for αΣ = const the total emission of nitrogen oxides does not depend from α1
and values of a heat removal after the first stage of burning, i.e.: NOx1. + NOx2. = NOx
(Σ) = const.
The explanation of this dependence can be made on the basis of the guess that in
conditions of burning of rich mixtures along with NOx compounds of NR-kind are
forming too, so irrespective of value α1 in a certain gamut of its values takes place: NR
+ NOx = const.
An afterburning of these compounds occurs in the second stage so that the
equivalent quantity NO is received: NR + O2 → NO+RO.
Thus also it is necessary to guess that responses of this kind have a low activation
energy and completely proceed already at the small temperatures Т2 occuring in
experiments.
This general schema of NO formation explaining given dependences at two-stage
burning of gas, does not contradict widespread opinions at kinetics of formation NO in
a flame [62, 63].
Analogous examinations were spent for initial temperatures, Т0 = 20-480 0С.
In all explored gamut Т0 = 20-480 0С there is a range of values α1 where value α1
and the heat quantity taken from combustion products of the first stage, up to attaining
of minimal values Т2 ' = 600 ÷ 7000С at which it is possible to receive a steady flame
of the second stage, does not influence the total quantity NOx after the second stage of
burning.
For an intermixture with initial temperature Т0 = 0 0С the value α1 equals
approximately 0,75. This is the boundary behind which its decrease leads to prompt
decrease of the total emission of nitrogen oxides.
Increasing Т0 moves this boundary towards the stoichiometric composition. So,
for Т0 = 2000С (the peak total concentration of nitrogen oxides NOx
max = 220 mg/nm
3)
decreasing of NOx concentration begins already at α1 close to 0,90, and for Т0 = 400
0С (NOx
max = 305 mg/nm
3) the decrease begins at α1 = 0,96.
At higher initial temperature of an intermixture the investigations are interfered by
the flame flash-backs at the first stage, however it is possible to guess that at approach
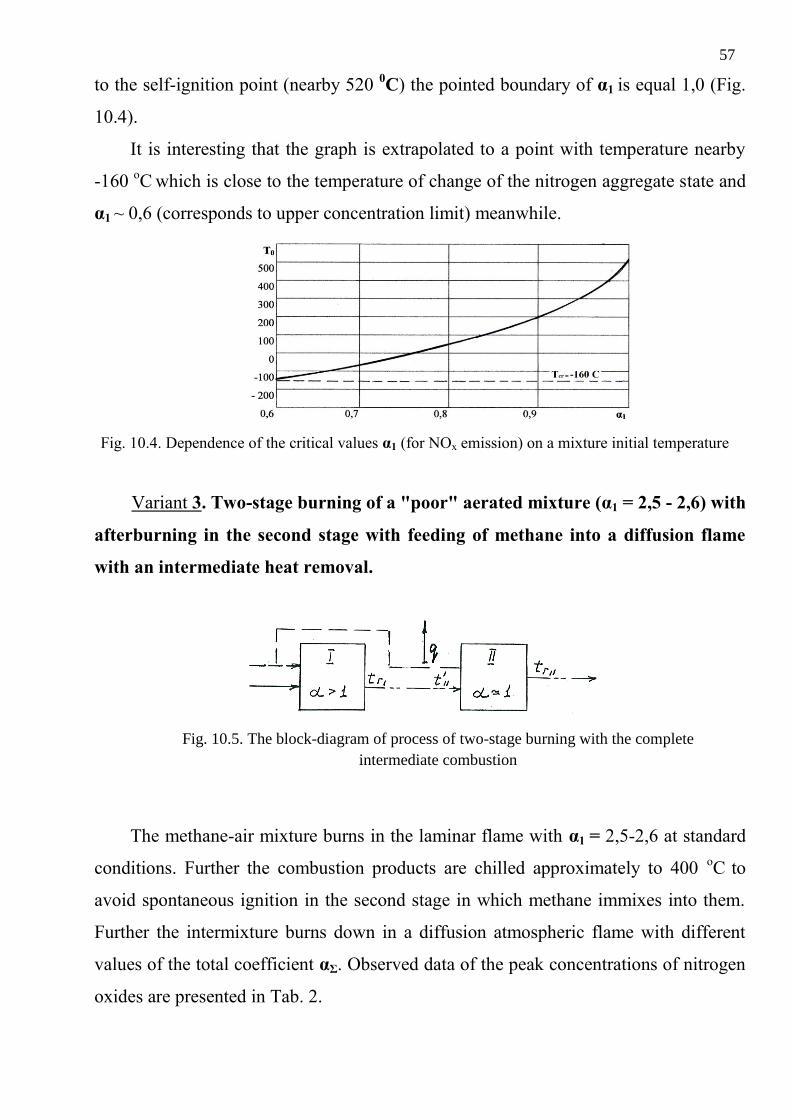
57
to the self-ignition point (nearby 520 0С) the pointed boundary of α1 is equal 1,0 (Fig.
10.4).
It is interesting that the graph is extrapolated to a point with temperature nearby
-160 oC
which is close to the temperature of change of the nitrogen aggregate state and
α1 ~ 0,6 (corresponds to upper concentration limit) meanwhile.
Fig. 10.4. Dependence of the critical values α1 (for NOx emission) on a mixture initial temperature
Variant 3. Two-stage burning of a "poor" aerated mixture (α1 = 2,5 - 2,6) with
afterburning in the second stage with feeding of methane into a diffusion flame
with an intermediate heat removal.
Fig. 10.5. The block-diagram of process of two-stage burning with the complete
intermediate combustion
The methane-air mixture burns in the laminar flame with α1 = 2,5-2,6 at standard
conditions. Further the combustion products are chilled approximately to 400 oC
to
avoid spontaneous ignition in the second stage in which methane immixes into them.
Further the intermixture burns down in a diffusion atmospheric flame with different
values of the total coefficient αΣ. Observed data of the peak concentrations of nitrogen
oxides are presented in Tab. 2.
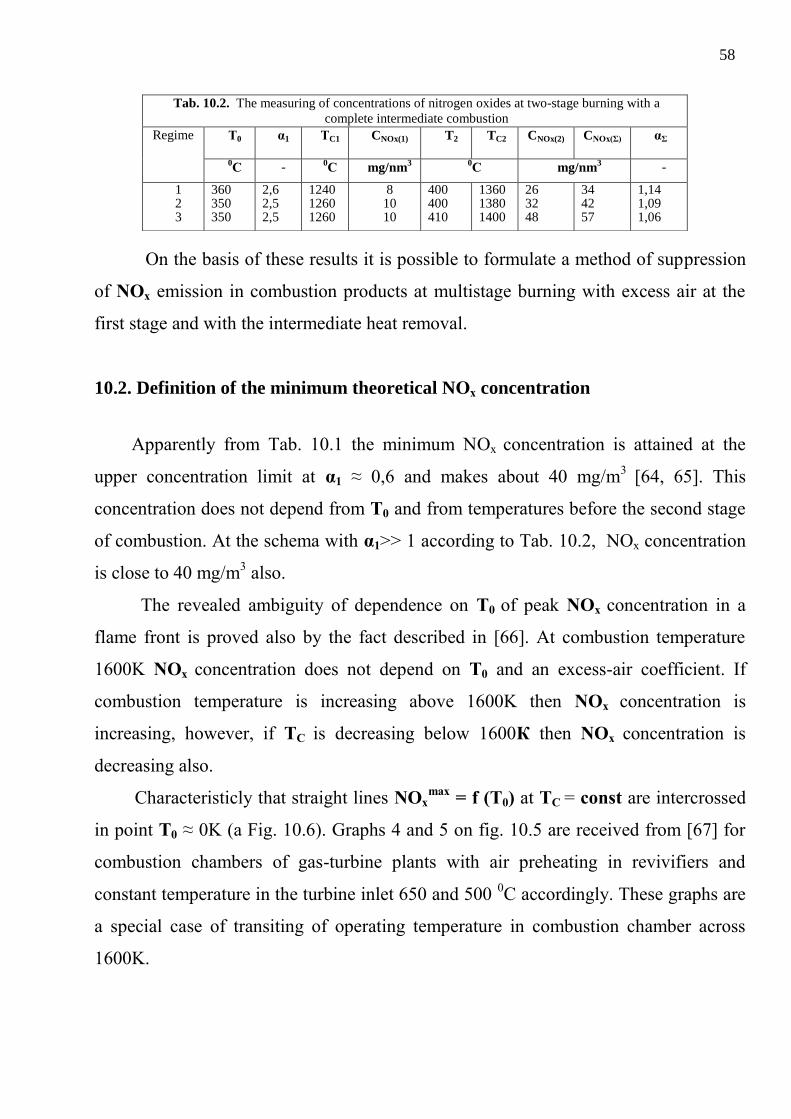
58
On the basis of these results it is possible to formulate a method of suppression
of NOx emission in combustion products at multistage burning with excess air at the
first stage and with the intermediate heat removal.
10.2. Definition of the minimum theoretical NОх concentration
Apparently from Tab. 10.1 the minimum NОх concentration is attained at the
upper concentration limit at α1 ≈ 0,6 and makes about 40 mg/m3
[64, 65]. This
concentration does not depend from Т0 and from temperatures before the second stage
of combustion. At the schema with α1>> 1 according to Tab. 10.2, NОх concentration
is close to 40 mg/m3 also.
The revealed ambiguity of dependence on Т0 of peak NOx concentration in a
flame front is proved also by the fact described in [66]. At combustion temperature
1600K NOx concentration does not depend on Т0 and an excess-air coefficient. If
combustion temperature is increasing above 1600K then NOx concentration is
increasing, however, if TC is decreasing below 1600К then NOx concentration is
decreasing also.
Characteristicly that straight lines NOxmax
= f (Т0) at TC = const are intercrossed
in point T0 ≈ 0K (a Fig. 10.6). Graphs 4 and 5 on fig. 10.5 are received from [67] for
combustion chambers of gas-turbine plants with air preheating in revivifiers and
constant temperature in the turbine inlet 650 and 500 0С accordingly. These graphs are
a special case of transiting of operating temperature in combustion chamber across
1600K.
Tab. 10.2. The measuring of concentrations of nitrogen oxides at two-stage burning with a
complete intermediate combustion
Regime Т0 α1 ТC1 CNOx(1) T2 TC2 CNOx(2) CNOx(Σ) αΣ
0С - 0
С mg/nm3
0С mg/nm
3 -
1 2 3
360 350 350
2,6 2,5 2,5
1240 1260 1260
8 10 10
400 400 410
1360 1380 1400
26 32 48
34 42 57
1,14 1,09 1,06
59
Various character of dependence NOx - Т0 at various combustion temperatures
represents as theoretical interest for definition of kinetics of formation NOx at burning
and has practical importance.
The phenomenology of NO formation at combustion demonstrates that they are
formed only within flame front and mechanisms of their formation should be
considered together with LPR formation. The explanation of the results received here
cannot be carried out on the basis of the thermal theory applied at present.
Fig. 10.6. Dependence of NOx - Tmix at Тc = const. 1 - Тc = 18750C; 2 - 1480; 3 - 1250. The
data given in [66], temperature in combustion chamber outlet, t2 = const: 4 - t2 = 650 0С; 5 - 500.
11. Stabilization of a flame and the flame-out characteristic
Flame stabilization in a gas mixture flow is a base of all processes of burning. The
stabilizing zone of reverse currents (RCZ) represents the same reactor, as well as a
flame front. Numerous observations of flames allow to guess that if the relation of an
average temperature and size of RCZ less than certain value the flame is not stabilized
in a flow and occurs flame-out.
Velocity at which there is a flame-out is directly proportional to a size of RCZ.
We already know that a flame front comprises of three typical zones. And the
temperature in a point A of a front is close to self-ignition point of an intermixture.
Thus, it is possible to guess that for flame stabilization a necessary size RCZ should be
sufficient for formation of the OA segment of thickness of a flame front. Thus in RCZ
the self-ignition temperature will be attained. In other words, RCZ should have such
60
size that transiting time across it of a flow of an intermixture with velocity v0 would
not less a formation time of a OA segment of a front, moving with velocity Un.
I.e. a requirement of stabilization of a flame:
LRCZ / v0 > λOA / Un (11.1)
For calculation of critical values we will rewrite this expression in a view:
LRCZmin
/ v0(fl-out)
= λOA / Un (11.2)
Example. For a stoichiometric methane-air mixture at standard conditions a ОА
segment thickness of a normal front is about 0,25 mm, Un = 300 mm/s. For practical
calculations RCZ length can be taken over six times more than stabilizer width, bst.
Then at bst = 5 mm, LRCZ ≈ 30 mm, v0 (f-out)
≈ 36 m/s. For bst = 15 mm, v0 (f-out)
≈ 108
m/s, and etc. In actual practice at large sizes bst, the flame-out velocity is incremented
in comparison with calculated one on 30 - 40 % at approaching of a size of the flow
passage to bст at the expense of interacting RCZ of the stabilizer with turbulent flow
structure.
At normal parameters of stoichiometric mixture СН4 - air the stabilizer with width
bst = 30 mm and with a size of the flow passage more than 30 mm provides a steady
flame at flow rate close to a sound velocity (Fig. 11.1).
Theoretically already this stabilizer (as the calculations with use of the data on ωf
demonstrates) at parameters of a mixture of Tmix = 1000К and Pmix = 4 МPa can
provide steady burning at flow rate close to M = 20.
Fig. 11.1. Association between flow rate at flame-out and a stabilizer typical dimension.
(Methane-air; Рmix = 0,1 МPa; Тmix = 300 K; α = 1.)
61
12. The microdiffusion mechanism of burning
12.1. Structure of a microdiffusion flame
From calculations it is visible that at normal initial parameters for intermixture
СН4-air the heat density of volume of combustion zone Qv makes more than 0,5 х 106
kW/m3. It is approximately at 10-15 times more, than in CC of GTP. With preheating
of a gas mixture the value Qv attains 1,7 х 106 kW/m
3, and at pressure 4 МПа and at
preheating makes already almost 300 х 106 kW/m
3.
For usage of hydrogen fuel the peak heat density of burning of an intermixture
increases almost in 20 times. The value of specific volume heat density, ωn increases
approximately so. At solving a task of widening a gamut of a steady burning of
diffusion flames, the investigations of dependence on excess-air coefficient of velocity
at flame-out have been conducted at various sizes of round and flat stabilizers (Fig.
12.1).
In the real airbreathing engine at the same parameters and the same stabilizer sizes
the stability of burning essentially drops because of irregularity of concentration ratio
of mixture in a stabilization zone and lack of homogeneous mixture.
Fig. 12.1. Flame-out characteristics of a circular (a) and a flat (b) stabilizer. 1 - Dн = 8мм; 2 - 14; 3 - 22;
4 - 32; 1 - аст = 7,5 mm; 2 - 12; 3 - 18.
For achievement of the peak stability of a flame it is necessary to use the flat
stabilizers providing optimum concentration of an intermixture in RCZ i.e. optimized
by an initial allocation of gas and arranging a microdiffusion flame (Fig. 12.2).
62
The arranging of burning of gas in a diffusion flame when a fuel and an air are
approaching to a flame front on the one hand and combustion products do not separate
gas and air or their areas with various concentration is termed as the microdiffusion
combustion mechanism. Formally such schema is analogous to the schema of turbulent
burning of homogeneous mixture, but in this case the corpuscles of fuel shattered by a
pulsation and air form a cellular structure where the gas or air mole is surrounded by
the second component. Here gauge of crushing of moles of gas and air of the same
order, as turbulence gauge, i.e. δ ~ lt.
Fig. 12.2. The schema of a microdiffusion flame in a combustion chamber.
The turbulent flame front moves on a surface of meshes according to the go-ahead
mechanism of transfer of a flame. Extending of process inside of moles occurs with the
help of the microdiffusion mechanism. For the first time the analogous schema
theoretically has been approximately viewed in [10]. The field of steady burning of a
microdiffusion flame is shown in Fig. 12.3.
From the received data it is visible that the microdiffusion flame on a small
interval from the peak flame-out velocity has wide "platform" of steady burning over
the gamut of α changes; this gamut almost 10 times more, than for the kinetic burning.
Fig. 12.3. Fields of stability of a microdiffusion flame on a right-angled collector-stabilizer.
(1 bst = 7,5; 2 - 12; 3 - 18).
63
The length of a microdiffusion flame for the values of a total excess-air
coefficient exceeding a peak excess for a kinetic flame is the same, as at the kinetic
flame for α = 1,2-1,5. It is caused by self-similarity of the mechanism of initial
allocation of gas in an air flow when local values α around the stabilizer are conserved
in the gamut of combustible concentrations and depend on general values α a little.
Self-similarity of combustion process is attained by fuel allocation in a flow of an
oxidizer by a great quantity of the small jets fed to it at an angle β near to a stabilizer
edge. The value α in a recirculation zone behind the stabilizer is thus spotted only by
the relative step of holes, S. In the base of calculation S, the depth of penetration of jets
in an air flow, taking into account aerodynamic structure of their interacting lie down.
For the flat stabilizer,
Sflat = αRCZ L0 π / 8 Ks sinβ (ρgas / ρair)0,5
, (12.1)
where L0 - stoichiometrical coefficient; Ks - the coefficient which consider the change
of a gas concentration on altitude of a jet .
Thus, for the slot channels at the given initial parametres of gas and air and αг
the uniform initial allocation of gas is provided at the same value Ssl irrespective of
values of designed characteristics, including b. At αг = 1 and normal initial
parametres of natural gas and air, at angle of feeding 90о, Кs = 1,55 and L0 =9,45
m3/m3 occurs Ssl = 3,1. Generally coefficient Кs depends on a step between holes a
little, but over the range of practical values of a step it is possible to consider it as a
stationary value.
Fig. 12.4. Dependence of completeness of combustion on a relative step for a slot channel; fuel
- natural gas (СН498 %) and air at normal initial parameters: b = 20mm, l = 14mm; water-cooled
combustion chamber 100 х 100 mm, LCC = 600 mm, υair = 15 m/s: 1 - d =1,2 mm; 2 - 2,0; 3 - 3,0; -. -
boundary of a steady burning.
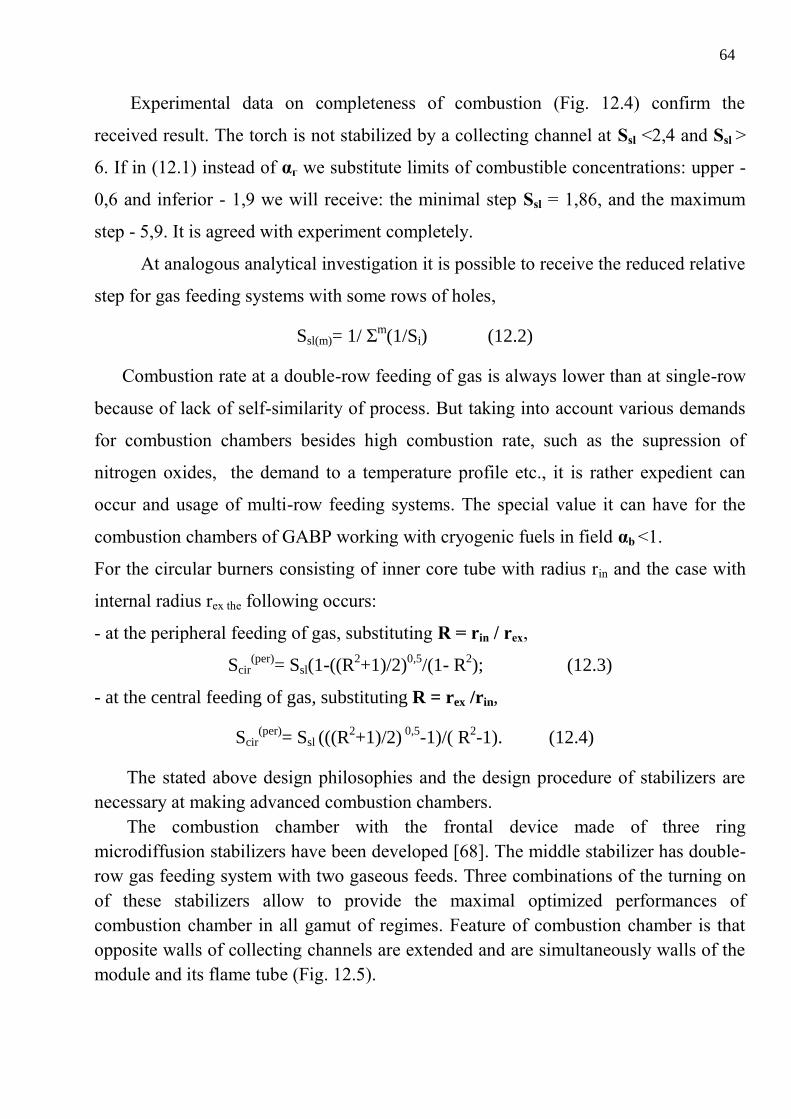
64
Experimental data on completeness of combustion (Fig. 12.4) confirm the
received result. The torch is not stabilized by a collecting channel at Ssl <2,4 and Ssl >
6. If in (12.1) instead of αг we substitute limits of combustible concentrations: upper -
0,6 and inferior - 1,9 we will receive: the minimal step Ssl = 1,86, and the maximum
step - 5,9. It is agreed with experiment completely.
At analogous analytical investigation it is possible to receive the reduced relative
step for gas feeding systems with some rows of holes,
Ssl(m)= 1/ Σm(1/Si) (12.2)
Combustion rate at a double-row feeding of gas is always lower than at single-row
because of lack of self-similarity of process. But taking into account various demands
for combustion chambers besides high combustion rate, such as the supression of
nitrogen oxides, the demand to a temperature profile etc., it is rather expedient can
occur and usage of multi-row feeding systems. The special value it can have for the
combustion chambers of GABP working with cryogenic fuels in field αb <1.
For the circular burners consisting of inner core tube with radius rin and the case with
internal radius rex the following occurs:
- at the peripheral feeding of gas, substituting R = rin / rex,
Scir(per)
= Ssl(1-((R2+1)/2)
0,5/(1- R
2); (12.3)
- at the central feeding of gas, substituting R = rex /rin,
Scir(per)
= Ssl (((R2+1)/2)
0,5-1)/( R
2-1). (12.4)
The stated above design philosophies and the design procedure of stabilizers are
necessary at making advanced combustion chambers.
The combustion chamber with the frontal device made of three ring
microdiffusion stabilizers have been developed [68]. The middle stabilizer has double-
row gas feeding system with two gaseous feeds. Three combinations of the turning on
of these stabilizers allow to provide the maximal optimized performances of
combustion chamber in all gamut of regimes. Feature of combustion chamber is that
opposite walls of collecting channels are extended and are simultaneously walls of the
module and its flame tube (Fig. 12.5).
65
Fig. 12.5. Combustion chamber with a microdiffusion frontal device.
The maximal analogy to the optimum organization of a gas flame for oil burning
can be provided at the expense of application of air spraying of liquid fuel and its
feeding, as well as gas by a great quantity of jets (in this case two-phase ones) [69].
12.2. Calculation of a microdiffusion flame
Gauge of crushing of moles of gas and air in the microdiffusion mechanism of the
same order, as turbulence gauge, i.e. δ ≈ lt. The time of mixing is approximately equal
to the burning time,
τphys = δ2 / Dт = δ / (lt v ’ + D). (12.5)
It means that for a strong turbulence the propagation rate of a flame front is close
to the pulsation component of a velocity stream,
Ut = ((lt v ’ + D) / τphys) 0,5
≈ v’. (12.6)
The thickness of flame front is spotted at the guess that through the mole of gas a
flame front with velocity Uт transits, then,
λMD = Ut τphys = ((lt v ’ + D) / δ) (δ2 / (lt v ’ + D) = δ. (12.7)
Intensity of combustion process, characterized by quantity of the intermixture
which is burning down in a unit volume of combustion zone, at a flat flame front for
this schema makes,
ωMD = Ut / λMD ≈ v ’ / δ. (12.8)
Let's find out the range of application of dependence (12.8). For this purpose a
viewed case with homogeneous mixture burning is comparable, assuming that a
kinetic burning has peak intensity. According to the model of surface burn of
homogeneous mixture in a turbulent flow the rate of propagation of flame front,
66
Ut ≈ Un (1 + v ’/Un). (12.9)
For a large turbulence when v ’>> Uн, neglecting the value of a normal flame
front velocity Un, as well as above, we receive Ut ≈ v ’. For the time of burning of a
mole, lt / Ut, the thickness of a turbulent flame front will make (with accuracy up to λn
which at the real conditions less lt on 1-2 order):
λt ~ lt v’/ Ut (12.10)
Thus, in the process of growth of the velocity of a flame the thickness of its front
grows also. Intensity in the flat turbulent flame front of homogeneous mixture,
ωk = Ut / λt ≈ Un / lt. (12.11)
Hence, at the given gauge of turbulence of a flow the combustion rate is spotted
by the macrokinetic characteristic of a hot intermixture Un and remains a stationary
value. However, for lt → 0 we will have again ωk → ∞.
The gauge of crushing decreases the combustion rate grows and in this case is
maximally approaching to combustion rate in a turbulent homogeneous flame. In a
case when δ ≈ lt, the gas particle is not intercrossed by a pulsation and concerning
velocity of its burning out we need to draw an analogy with burning of a mole of
homogeneous mixture from its surface. In this case for the thickness of a front of a
microdiffusion flame using (12.10) we can to write down,
λMD = lt v’/ КUn, (12.12)
where K <1 - coefficient depending on gauge of crushing; for δ → λn K → 1. From the
phenomenological dependence concluded in the beginning for ωfl follows,
ωMD = КUн / (l0+a), (12.13)
where lо - a typical dimension of a burning jet; a - an average thickness of
microdiffusion flame front at burning out of a mole. On the basis of experimental data:
a ≈ λ for α =1 at K = 1,3 [70-71].
67
References
1. L. N. Hitrin, V. A. Popov, Bases of burning of hydrocarbons, ICF, Moscow, USSR, 1960.
2. N. K. Kikoin, Tables of physical quantities, Moscow, USSR, “Atomizdat”, 1976.
3. B. P. Nikolsky, The manual of the chemist, V.3, Himiya, Moscow, USSR, 1965.
4. V. N. Kryzhanovsky, Research of structure and calculation of normal flame front width,
Scientific collection, Saratov, USSR, 1980.
5. E. B. Gordon, M. S. Drozdov, S. I. Svetlichny, About peak temperatures achieved in chemical
reactions, FGV, USSR, vol. 16, № 2, 1980.
6. V. R. Kuznetsov, V. A. Sabelnokov, Features of burning of gases in the strong turbulent flow,
FGV, USSR, vol. 13, № 4, 1977.
7. X. Hottel, G. Viliams, R. Levin, Effect of isotropic turbulence on a flame propagation, (ІV
International Symposium on Combustion), Moscow, USSR, 1958. – С. 439–447.
8. Козаченко Л. С. Горение бензино-воздушных смесей в турбулентном потоке. – В кн.:
Третье всесоюзное совещание по теории горения. ТІ. – М.: изд-во АН СССР, 1960. – С.
126–137.
9. Раушенбах Б. В., Белый С. А., Беспалов И. В. и др. Физические основы рабочего
процесса в камерах сгорания воздушно-реактивных двигателей. – М.: Машиностроение,
1971. – 256 с.
10. Крыжановский В. Н., Кондак М. А, Бабенко Ю. А., Батюк Г. С. Исследование
регистровых фронтовых устройств с центральной подачей газа. – К.: Энергетика и эл.-
техн. промышленность – № 1, 1965.
11. K. I. Stcelkin, About burning in a turbulent flow, GTF, vol. 13, 1943.
12. Clarkc A., Harrison A. – 7-th Symp. Combust. – London, 1959. – Р. 664–673.
13. Herbert M. K. – 8-th Symp. Combust. – Baltimore, 1962. – Р. 970–982.
14. B. Lewis, R. Pizz, T. Teilor, The combustion process, Moscow, USSR, FML, 1961.
15. Longwell, Veis, Speed of high-temperature reactions at burning of hydrocarbons, VRT, 1956.
16. Williams Y. C., Hottel H. C., Morgan A. C. Ibid. – Р. 913–925.
17. Кондак М. А., Крыжановский В. Н. Интенсификация процессов горения в камерах ГТУ,
работающих на природном газе. – Энергетика и электротехническая промышленность. –
№ 3. – К., 1964. – С. 34–36.
18. Вулис Л. А. Замечания о структуре факела однородной смеси. Там же. – 40–46 с.
19. Вулис Л. А., Ярин Л. П. Аэродинамика факела. – Л.: Энергия, 1978. – 216 с.
20. Власов Е. В., Гиневский А. С. – изд-во. АН СССР. Механ. жидк. и газа, 1967.– № 4. – С.
133–139.
21. Власов К. П., Иноземцев Н. Н. Исследование ионизации в ламинарном и турбулентном
пламени. – В кн.: Третье всесоюзное совещание по теории горения, т.I. – М.: изд-во АН
СССР, 1960. – С. 60–71.
22. Pratt D. T., Strakman E. S. – 12-th Symp. Combust., Pittsburgh, 1969. –
Р. 891–900.
23. V. N. Kryzhanovsky, Structure and calculation of a turbulent flame, USSR, Energetika, № 4,
1965.
68
24. V. N. Kryzhanovsky, Theoretical and experimental researches of burning of mixtures in
turbulent flow. Thesis, Academy of science KPI, Kyiv, USSR, 1965.
25. Семенов Н. Н., Шилов А. Е., Веденеев В. И. и др. Явление энергетического разветвления
цепей в химических реакциях. Открытие. Диплом № 172, 1982.
26. I. K. Kikoin, A. K. Kikoin, Molecular physics, Fizmatgiz, Moscow, USSR, 1963.
27. E. S. Shetinkov, Physics of burning of gases, Nauka, Moscow, USSR, 1956.
28. V. A. Sreisher, Gas burning at power plants and industry, Moscow, USSR, “Energia”, 1967.
29. Основы горения углеводородных топлив (пер. с англ. под ред. Л. Н. Хитрина и В. А.
Попова.) – М.: ИЛ, 1960.– 664 с.
30. Льюис Б., Эльбе Г. Горение, пламя и взрывы в газах. 2-е изд., пер. с англ./под ред. К. И.
Щелкина и А. А. Борисова. – М.: Мир, 1968. – 592 с.
31. Симон Д., Белз Ф., Спаковский А. Исследование областей воспламенения некоторых
бедных углеродо-воздушных смесей. Там же. – С. 100–110.
32. Заказнов В. Ф., Куршева Л. А.,Федина З. И. Определение нормальных скоростей и
критических диаметров гашения пламени аммиачно-воздушных смесей. – ФГВ, 1978,
т.14. – № 4. – С. 22–26.
33. V. V. Dubinin, B.Y. Kolesnikov, G. I. Ksandopulo, About correction of sample drawing from
flame, Fizika goreniya vzryva, vol.13, № 6, (1977).
34. V. N. Kryzhanovsky, Research of thickness of combustion zone inside a laminar flame, Kyiv,
USSR, The bulletin of KPI “Power Industry”, 1974.
35. Lazzaza C.P., Biordi J.C., Papp J.F. Combust. And Flame, 1973, v.21. – № 3. – Р. 371–382.
36. Stephenson P. L., Taylor R.J. – Combustion and Flame, 1973, v. 20. – № 2. –
Р. 231–244.
37. Blegjian L. Combustion and Flame, 1973, v. 20. – № 1. – Р. 5–17.
38. Гарнер Ф., Лонг Р., Торлей Б. Сравнение шлирен-метода, теневого и люминесцентного
методов определения нормальной скорости распространения пламени, (IV
Международный симпозиум по горению). М.: Оборониздат, 1958. – С. 281–285.
39. Дубовкин Н. Ф. Справочник по углеводородным топливам и их продуктам сгорания. –
М. – Л.: Госэнергоиздат, 1962. – 228 с.
40. G. I. Ksandopulo, Flame front and inhibition of combustion process, Thesis, Academy of
science, Alma-Ata, USSR, 1974.
41. V. N. Kryzhanovsky, Phenomenological bases of combustion theory of gases. Thesis, Academy
of science ICF, Chernogolovka, USSR, 1986.
42. V. N. Kryzhanovsky, J. V. N. Kryzhanovsky, Phenomenological bases of controversial
combustion theory, Osvita Ukrainy, Kyiv, Ukraine, 2011.
43. Фристром Р. М., Вестенберг А. А. Структура пламени. – М.: Металлургия, 1969. – 364 с.
44. Заказнов В. Ф., Куршева Л. А., Стрижевский И. И., Федина З. И. Гашение пламени
аммиачно-кислородных смесей. – ФГВ, 1976, т.12. – № 1. – С. 132– 133.
45. Suzuki N., Оba V., Hizano T.,Tsuji H. – Bull of JSME, 1979,v.22, 168. – Р. 848– 856.
46. Hurle J. R., Price R .B., Sugden T. M., Thomas A. – Proc. Roj. Sos., 1968.–
№ A303. – С. 409–427.
47. Fox M. D., Weinberg F. J. – 13-th Symposium jn Combust., Pittsburgh, Pensylvania, 1971. – Р.
641–648.
48. Westwnberg A. A., Fristrom R. M. - J. Phys.Chem., 1960, v.64. – № 10. – Р. 1393–1398.
49. Bertrand C. Delbourgo R. Combustion and Flame, 1981, v.41. – № 3. –
Р. 235–242.
69
50. G. Morgan, V. Kan, Effect of inert species on preparation velocity and temperature of a flame,
(IV International Symposium on Combustion), Moscow, USSR, 1958.
51. Аравин Г. С., Семенов Е. С. О связи между скоростями химической ионизации и реакции
горения в ламинарном пламени. – ФГВ, 1979, т. 15. – № 5. – С. 40–46.
52. Ловачев Л. А. Об определении макрокинетических характеристик пламени. – ФГВ, 1976,
т.12. – № 5. – С. 786–789.
53. G. I. Ksandopulo, Chemistry of flame, Himiya, Moscow, USSR, 1980.
54. V. N. Kryzhanovsky, Model researches of nitrogen oxides formation in furnaces, Naukova
Dumka, Kyiv, USSR, 1981.
55. V. N. Kryzhanovsky, A.I. Sigal, V.I. Speisher, About formation rate of prompt nitrogen oxides
at flame of natural gas, Problems of environment protection and harmful exhausts of plants,
ENIN, Moscow, USSR, 1989.
56. V. N. Kryzhanovsky, A.I. Sigal, Researches of nitrogen oxides formation in flame front,
Improvement of quality of fuel burning and environment protection, Thesis, Leningrad, USSR,
1977.
57. V. N. Kryzhanovsky, Improvement of Combustion of Gaseous and Liquid Fuels (A Survey). –
Heat Transfer Research, vol. 24.– No. 5, 1992.
58. V. N. Kryzhanovsky, Research of nitrogen oxides formation at two-stage burning of gas,
Scientific collection, Saratov, USSR, 1980.
59. V. N. Kryzhanovsky, Research of nitrogen oxides formation at two-stage burning of gas,
Scientific collection, Saratov, USSR, No. 4, 1978.
60. Мурзаков В. В. Основы теории и практики сжигания газа в паровых котлах.-М.:
Энергия,1996. – 464 с.
61. I. J. Sigal, V. N. Kryzhanovsky, O. I. Kosinov, N. A. Gurevich, Influence of method of burning
of gaseous fuel on nitrogen oxides formation, USSR, Gas Industry, № 11, 1974.
62. Merriam E. L., Levy A. – 13-th Symposium on Combust., Pittsburgh, 1974. – Р. 1073–1083.
63. Debrou J.B., Joodinga J.M., Bohme D.K.- Combust. And Flame, 1980, v.39.– № 1. – Р. 1–19.
64. V. N. Kryzhanovsky, Investigations of nitrogen oxides formation and suppression at gas
burning, Kyiv, USSR, “Znannia”, 1977.
65. V. N. Kryzhanovsky, Formation and methods of repressing of nitrogen oxides at burning (a
survey), Prom. Teplotechnika, № 5, Kyiv, Ukraine, (1990).
66. A. G. Tumanovsky, Formation of nitrogen oxides in combustors of stationary GTP, Theory and
practice of gas burning, Nedra, Leningrad, USSR, 1972. 67. V.N. Kryzhanovsky, Recent Developments in the Theory of Combustion of Gases (A Survey).
– Heat Transfer Research, vol. 24. – No. 4, 1992.
68. V. N. Kryzhanovsky, Y. V. Kryzhanovsky, Combustion chamber of GTP, patent of Ukraine №
75945, 2004.
69. V. N. Kryzhanovsky, Y. N. Saveliev, Calculation and analytic researches of diffusion gas
burners, Scientific collection, Energetica № 2, Kyiv, Ukraine, 1987.
70. V. N. Kryzhanovsky, Analysis and investigation of the model of microdiffusion flame,
Teplofizika & Teplotechnika, № 27, Kyiv, Ukraine,1974.
71. V. N. Kryzhanovsky, Determination of normal flame front thickness for different stoichiometric
and poor mixtures, Prom. Teplotechnika, № 3, Kyiv, Ukraine, (1984).