Structural and Raman Spectroscopic Characterization of C … · · 2017-11-25the as prepared TNTs...
11
Vol.1 No.1:4 iMedPub Journals www.imedpub.com Journal of Nanoscience & Nanotechnology Research 2017 1 © Under License of Creative Commons Attribution 3.0 License | This article is available in: http://www.imedpub.com/journal-nanoscience-nanotechnology- research/ Research Article Raymond Taziwa 1,2 *, Edson Meyer 1 and Nwabisa Takata 1,2 1 Fort Hare Instute of Technology (FHIT), University of Fort Hare, Alice, Republic of South Africa 2 Department of Chemistry, University of Fort Hare, Alice, Republic of South Africa Corresponding author: Raymond Taziwa [email protected] Fort Hare Instute of Technology (FHIT), University of Fort Hare, Alice, Republic of South Africa. Tel: +27 (0)40 602 2439 Citation: Taziwa R, Meyer E, Takata N (2017) Structural and Raman Spectroscopic Characterizaon of C-TiO 2 Nanotubes Synthesized by a Template- Assisted Sol-Gel Technique. J Nanosci Nanotechnol Res. Vol.1 No.1:4 Received: November 08, 2017; Accepted: November 22, 2017; Published: November 26, 2017 Structural and Raman Spectroscopic Characterizaon of C-TiO 2 Nanotubes Synthesized by a Template-Assisted Sol-Gel Technique Abstract It is of great importance to find ways of improving the charge transport within Titanium Dioxide Nanotubes (TNTs) which will in turn reduces electron-hole pair recombinaon and subsequently improves the cell efficiency of the Dye Sensized Solar Cells (DSSC). High electron mobility in TNTs relies on the morphology, surface defects and consistence in the crystalline composion. These factors are closely related to the preparaon condions. In this regard, this work focuses on fabricaon and structural characterizaon of carbon doped tanium dioxide nanotubes (C-TNTs). Un-doped and C-TNTs were synthesized using a template- assisted sol-gel technique employing tanium tetra butoxide precursor and oxalic acid as the dopant. SEM, XRD, and Confocal Raman spectroscopy (CRS) was exploited to evaluate the morphological and structural properes of the TNTs. SEM analysis has revealed the presence of closely-packed TNTs. SEM analysis has also shown that the TNTs become loosely-packed with increasing dopant concentraon. SEM-EDX spectra has revealed the presence of Ti peaks at 0.45 and 4.9 keV corresponding to Kα1 and Kβ1 emission line respecvely. Oxygen exhibits a signal at 0.5 keV corresponding to Kα1 emission line. The existence of these peaks in the EDX spectra validates the presence of tanium and oxygen atoms in the as prepared TNTs samples. XRD analysis has exposed the existence of a mixed Anatase-Brookite phase with diffracon peaks at 2θ angles of 25.49°, 38.11°, 40.60°, 48.14°, 54.58°, 63.00°, 70.11° and 75.66°. Addionally, XRD analysis has revealed elongaon of lace parameter “c” from 9.143 to 9.830 Å with increase carbon dopant concentraon. Lace expansion indicates the possibility of carbon substung oxygen sites. CRS large area scan in the XY direcon has revealed the presence of Raman modes at 153.78 cm -1 (Eg-A), 209.08 cm -1 (Eg-A), 331.04 cm -1 (B1g-B), 403.74 cm -1 (B1g-A), 527.16 cm -1 (A1g-A), 541.83 cm -1 (B1g-A) and 644.59 cm -1 (Eg-A) belonging to a mixed Anatase-Brookite phase. Moreover, CRS large area scans has exposed the existence of a Rule phase with Raman modes at 150.64 cm -1 (B1g-R), 252.14 cm -1 (mutli-phonon process), 447.42 cm -1 (Eg-R) and 616.09 cm -1 (A1g-R) belonging to the Rule phase of TiO 2 . CRS depth profiling in the XZ direcon has also validated the presence of a mixed Anatase-Brookite phase at Raman Acve modes 153.19 cm -1 , 208.87 cm -1 , 404.55 cm -1 , 523.26 cm -1 and 648.55 cm -1 . Keywords: Titanium dioxide nanotubes; Sol-gel, Carbon doping; Confocal Raman spectroscopy
Transcript of Structural and Raman Spectroscopic Characterization of C … · · 2017-11-25the as prepared TNTs...
Vol.1 No.1:4iMedPub Journals
www.imedpub.com Journal of Nanoscience & Nanotechnology Research2017
1© Under License of Creative Commons Attribution 3.0 License | This article is available in: http://www.imedpub.com/journal-nanoscience-nanotechnology-research/
Research Article
Raymond Taziwa1,2*, Edson Meyer1 and Nwabisa Takata1,2
1 FortHareInstituteofTechnology(FHIT),UniversityofFortHare,Alice,RepublicofSouthAfrica
2 DepartmentofChemistry,UniversityofFortHare,Alice,RepublicofSouthAfrica
Corresponding author: RaymondTaziwa
FortHareInstituteofTechnology(FHIT),UniversityofFortHare,Alice,RepublicofSouthAfrica.
Tel: +27(0)406022439
Citation: TaziwaR,MeyerE, TakataN(2017)StructuralandRamanSpectroscopicCharacterizationofC-TiO2 NanotubesSynthesizedbyaTemplate-AssistedSol-GelTechnique.JNanosciNanotechnolRes.Vol.1No.1:4
Received: November08,2017; Accepted: November22,2017; Published: November26,2017
Structural and Raman Spectroscopic Characterization of C-TiO2 Nanotubes
Synthesized by a Template-Assisted Sol-Gel Technique
AbstractIt isofgreat importancetofindwaysof improvingthechargetransportwithinTitaniumDioxideNanotubes(TNTs)whichwillinturnreduceselectron-holepairrecombinationandsubsequentlyimprovesthecellefficiencyoftheDyeSensitizedSolar Cells (DSSC). High electron mobility in TNTs relies on the morphology,surfacedefectsandconsistenceinthecrystallinecomposition.Thesefactorsareclosely related to the preparation conditions. In this regard, thiswork focusesonfabricationandstructuralcharacterizationofcarbondopedtitaniumdioxidenanotubes (C-TNTs).Un-dopedandC-TNTsweresynthesizedusinga template-assisted sol-gel technique employing titanium tetra butoxide precursor andoxalicacidasthedopant.SEM,XRD,andConfocalRamanspectroscopy(CRS)wasexploited toevaluate themorphological and structural propertiesof theTNTs.SEM analysis has revealed the presence of closely-packed TNTs. SEM analysishas also shown that the TNTs become loosely-packed with increasing dopantconcentration.SEM-EDXspectrahasrevealedthepresenceofTipeaksat0.45and4.9keVcorrespondingtoKα1andKβ1emissionlinerespectively.Oxygenexhibitsa signal at 0.5 keV corresponding toKα1emission line. Theexistenceof thesepeaksintheEDXspectravalidatesthepresenceoftitaniumandoxygenatomsintheaspreparedTNTssamples.XRDanalysishasexposedtheexistenceofamixedAnatase-Brookite phase with diffraction peaks at 2θ angles of 25.49°, 38.11°,40.60°,48.14°,54.58°,63.00°,70.11°and75.66°.Additionally,XRDanalysishasrevealedelongationoflatticeparameter“c”from9.143to9.830Åwithincreasecarbondopantconcentration.Latticeexpansionindicatesthepossibilityofcarbonsubstituting oxygen sites. CRS large area scan in the XY directionhas revealedthepresenceofRamanmodesat153.78cm-1(Eg-A),209.08cm-1(Eg-A),331.04cm-1 (B1g-B),403.74cm-1 (B1g-A),527.16cm-1 (A1g-A),541.83cm-1 (B1g-A)and644.59cm-1(Eg-A)belongingtoamixedAnatase-Brookitephase.Moreover,CRSlargeareascanshasexposedtheexistenceofaRutilephasewithRamanmodesat 150.64 cm-1 (B1g-R), 252.14 cm-1(mutli-phonon process), 447.42 cm-1 (Eg-R)and616.09cm-1(A1g-R)belongingtotheRutilephaseofTiO2.CRSdepthprofilingintheXZdirectionhasalsovalidatedthepresenceofamixedAnatase-BrookitephaseatRamanActivemodes153.19cm-1,208.87cm-1,404.55cm-1,523.26cm-1 and648.55cm-1.
Keywords: Titaniumdioxidenanotubes;Sol-gel,Carbondoping;ConfocalRamanspectroscopy
2017Vol.1 No.1:4
2
Journal of Nanoscience & Nanotechnology Research
This article is available in: http://www.imedpub.com/journal-nanoscience-nanotechnology-research/
IntroductionIn today's society, it is becoming ever essential to find othersourcesofenergythatareaffordablewithsocial,scientificandcommercialrelevance.Solarcellshavebecomeoneofthemostextensively researched approaches of obtaining energy in anenvironmental friendlymanner as compared to combustionoffossilfuels.Moreparticularly,thedyesensitizedsolarcells(DSSC)technologyemployingtitaniumdioxidenanotubes(TNTs)offeraviableandcosteffectivemannertoreplacethetraditionalsiliconsolarcell technology [1].SubstantialeffortshavebeenfocusedonfabricationofwellalignedTNTswithaconsistentcrystallinephase composition. Use of TNTs as an electrode to replacethe traditional titanium dioxide nanoparticle offers excellentopportunities for improvedvectorial charge transferofphotongeneratedelectronswithminimumlosses[1,2].TNTsofdifferentmorphologies and geometrical shapes have been prepared byvarious techniques such as electro-anodization, sonochemicaldeposition,hydrothermalmethodsandtemplateassistedsolgeltechniques[3-6].Whilemanyofthesefabricationtechniquesaresophisticatedandexpensive.Solgeltemplateassistedmethodsof fabricating TNTs has attracted considerable interest dueto its ability to produce nanomaterial at low cost. Moreover,template assisted sol gel techniques presents numerousadvantages such stoichiometric control of the compositionat molecular scale which enables production of nanomaterialof a consistent atomic composition [6]. On the other hand,before utilization of the fabricated TNTs by any technique forapplication as electrode material for DSSC, it is obligatory toassess the isomorphic crystalline composition and stability ofthephasespresent.Theisomorphiccrystallinecompositionandstability of the TiO2 in TNTs varieswith fabrication techniquesanddepositionparameters [7].Thestabilityof theTiO2phasesandhence,potentialapplicationinDSSCisentirelydependentontheisomorphiccrystallinephasecompositionpresentafterpre-treatmentanddepositiononthesurfaceoffunctionalsubstrate.ItiswellknownthattheAnatasepolymorphofTiO2ispreferredinsolarcellapplicationsduetothecontradistinctionintheflat-bandpotentialofAnataseascomparedtoRutile.ThisisduetothefactthattheAnatasepolymorphhasaconductionbandthatis0.2VmorenegativethanthatofRutilecounterpart.Henceasuperiormaximum photo-voltage can be achieved on AnatasethanonRutileonlyifanidenticalredoxelectrolyteisused[7-9].Eventhough,phasetransformationsarenecessaryforsolarcellapplications concerning TiO2 they have serious implications onthestabilityoftheTNTsmoreparticularlyinthepresenceforeignnon-metal and/ormetal species [10-12]. It is well known thatadditionofforeignspeciesinthroughnon-metalormetaldopingin TiO2 nanostructures can cause structural instability and/orstabilitywhicheitherimpedesorcatalysisphasetransformation[13]. Several studies have been reported on the effect ofannealing temperature on phase transformation in titaniumdioxidenanotubes.Tothebestofourknowledge,nosystematicattempt has been made to evaluate the effect of non-metaldopantsisomorphiccrystallinecompositionofTNTspreparedbya template assisted sol gel technique. This paper presents theeffect of carbon doping on the morphological, structural andisomorphiccrystallinephasecompositionofTNTspreparedbya
templateassistedsolgeltechnique.InadditiontothecomplexityoffabricatingdefectfreeTNTwithauniformlydistributedAnatasecrystalline phase. It must be pointed out that the difficulty infinding the appropriate characterization technique that is abletomapout thecrystallinephasedistributionon thesurfaceoftheTNTsandalongtheTNTsisakeychallenge.Therefore,thesedifficultiesincharacterizingTNTsstructureareacurrentchallengethatlimitsthedevelopmentofsolarcellscarbondopedtitaniumdioxide nanotubes (C-TNTs). The development of efficientelectrodematerials for solar cell applications requiresdetailedunderstanding of the morphological, isomorphic crystallinecomposition, chemical and as well as structural properties atnanometer scale. Raman spectroscopy provides about thechemical nature and isomophoric crystalline distribution onthesurfaceTNTs.ConfocalRamanspectroscopytechniqueshasbeen demonstrated to reveal unprecedented detail about thevibrationalstructureofcarbonnanotubes.InthisworkConfocalRaman Spectroscopy coupled with Raman imaging has beenused for the first time to successful mapping out crystallinephase composition of C-TNTs and has proven to be a fruitfultechnique to complement to a number of characterizationnormally used to probe crystalline phase distribution of TNTsover sample largearea. SuchRamanmeasurementswill provetobe invaluable forevaluatingthecrystallinephaseuniformityofTNTsfordevelopmentofefficientelectrodematerialsforsolarcellapplications.
ExperimentalMaterialsTitanium tetra butoxide ((Ti(OBu)4) ≥ 97.0%, Sigma Aldrich),Acetylacetone(ACAC≥99.0%,Sigma,Aldrich),deionizedwater(H2O),NaOHpellets(Sigma,Aldrich),OxalicAciddihydrate(≥99.0%,SigmaAldrich)andethylalcohol(EtOH,≥99.9%),Whatman25AnodicAluminaMembranes(AAM)withporediameter110-210nmandthicknessof58.98µm.
Synthesis of Sol-gel precursor solutionsTheprecursorsolutionforun-dopedandcarbondopedTiO2waspreparedbymixing(Ti(OBu)4),ACAC,deionizedwaterandEtOH,inmolarratioof1:1:3:20respectively.Inatypicalsynthesistwobeakers labelled “A” and “B” were used to prepare precursorsolutions. 24 cm3 of ethanol, 2.4 cm3 ofwater and 4.5 cm3 ofacetylacetoneweretransferredtobeakerA.ToensurecompletemixingBeakerAcontentsweresonicatedfor30minutes.BeakerBsolutionwasmadebymixing15cm3(Ti(OBu)4)in24cm
3EtOH.Afterthoroughmixing,solution“A”wasaddedinsmallquantitiesusing a 10 cm3 syringe to the solution “B” which resulted informationofayellowsolution“C”.Theyellowsolution“C”wasthenstirredforapproximately2hours.Differentmassesofthecarbondopant(oxalicaciddehydrate)weretodifferentportionsofsolutiontoprepared9mM,27mM,45mM,and75mMcarbondopedprecursorsolutions.
Fabrication of TiO2 nanotubesAAMwere immersed in the resulting precursor solutions. The
2017Vol.1 No.1:4
ARCHIVOS DE MEDICINAISSN 1698-9465
3© Under License of Creative Commons Attribution 3.0 License
Journal of Nanoscience & Nanotechnology Research
membraneswere allowed to stand for 72 hours for completeporefillingoftheNanopores.Thesampleswerethendriedinairfor10minutesfollowedbycalcinationat475°Cfor1hour.TheAAMwerecooledat roomtemperatureand transferred intoacentrifugetubecontaining1MNaOH(aq)solution.Thesolutionwasplacedinacentrifugefor1hourat10000rpmfordissolutionoftheAAM.Thesludgewasthenlefttodry.Thedriedsampleswerecollectedandreservedforanalysis.
CharacterizationXRDwasusedtoattaincrystallinepropertiesofthesynthesizedTNTs.ThescanswererecordedatseveralresolutionsusingaPanAnalyticalempyreanXRDsystemwithaCuanodeatKαradiationwavelengthof0.15418nmatanoperatingvoltageof40KVand40mA.ToprepareXRDsamples,powdersweresprinkledontoa zero-background sampleholder disk. TheXRDdiffract gramswere collected over a diffraction angle range 2θ=10 to 100°.Elementalanalysis,compositionandmorphologicalpropertiesoftheun-dopedandC-TNTswerecharacterizedusingaZeissCrossBeam540 Focus ion beamScanning ElectronMicroscope (FIB-SEM).TheFIB-SEMisequippedwithanOxfordAztecEDSsystemwitha50mm2silicondriftdetector (SDD).ThesamplesweremountedondoublesidedcarbonstickytabsandsputtercoatedwithcarbontoreducechargingwithintheSEM.ThecoatingwithcarbonwasperformedinanEdwardsCarbonCoater.TheTNTswerecharacterizedfortheirisomophoriccrystallinecompositionand structural properties using Confocal Raman MicroscopyusingconfocalRamanmicroscopycoupled(WitecALPHA300RA).A fibre coupled DPSS laser (752 nm) with maximum poweroutputof44mWafterasinglemodecouplingwasutilizedasanexcitationsource.Thesamplesweremountedonapiezo-driven
scanplatformhavingapositioningaccuracyof4nmand0.5nmhorizontallyandverticallyrespectively.Thepiezoelectricscanningtablepermitsthree-dimensionaldisplacementsinstepsof3nm,givingaveryhighspatialresolutionconfocalRamanmicroscopy.For confocal Raman image scans, an entire RS spectrum iscollected at over an image point. Each confocal Raman Imagecomprisedof526ᵡ526points.Wiproject4.1softwarewasusedtoprocessandanalyzetheacquiredspectra.
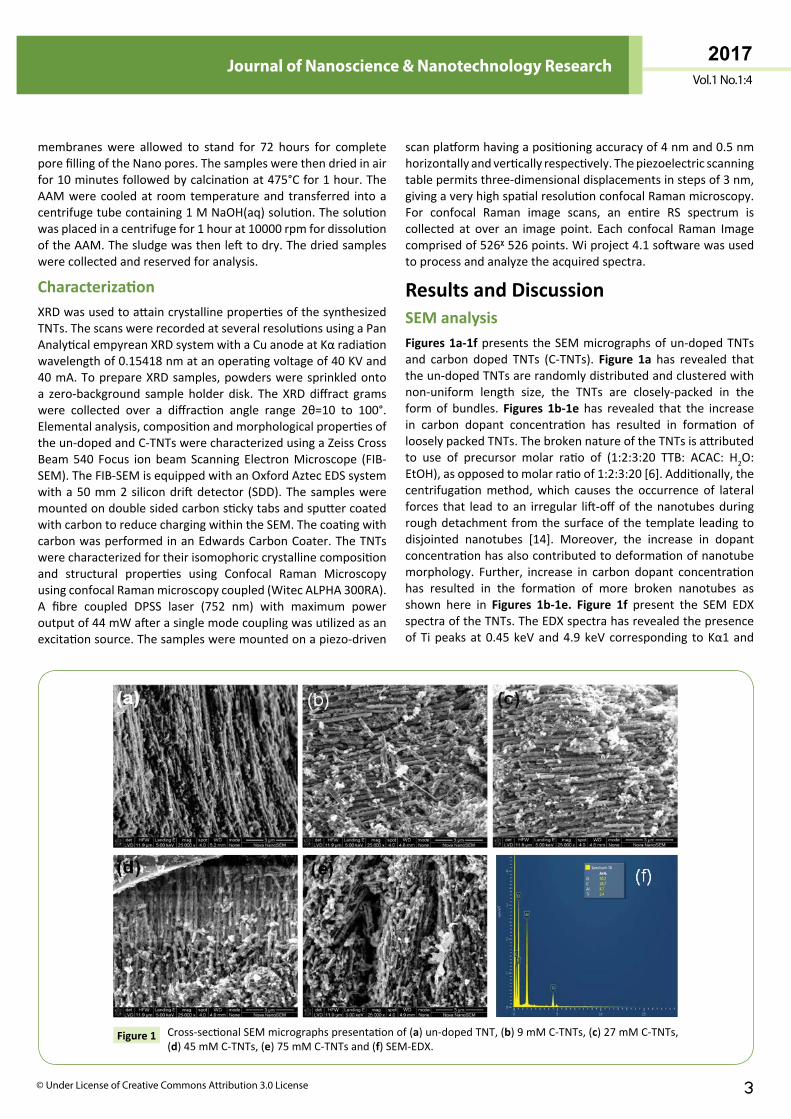
Results and Discussion SEM analysisFigures 1a-1fpresentstheSEMmicrographsofun-dopedTNTsand carbon doped TNTs (C-TNTs). Figure 1a has revealed thattheun-dopedTNTsarerandomlydistributedandclusteredwithnon-uniform length size, the TNTs are closely-packed in theformof bundles. Figures 1b-1e has revealed that the increasein carbon dopant concentration has resulted in formation oflooselypackedTNTs.ThebrokennatureoftheTNTsisattributedto use of precursor molar ratio of (1:2:3:20 TTB: ACAC: H2O:EtOH),asopposedtomolarratioof1:2:3:20[6].Additionally,thecentrifugationmethod,which causes the occurrence of lateralforces that lead toan irregular lift-offof thenanotubesduringroughdetachmentfromthesurfaceofthetemplate leadingtodisjointed nanotubes [14]. Moreover, the increase in dopantconcentrationhasalsocontributedtodeformationofnanotubemorphology. Further, increase in carbon dopant concentrationhas resulted in the formation of more broken nanotubes asshown here in Figures 1b-1e. Figure 1f present the SEM EDXspectraoftheTNTs.TheEDXspectrahasrevealedthepresenceofTipeaksat0.45keVand4.9keVcorresponding toKα1and
Cross-sectionalSEMmicrographspresentationof(a)un-dopedTNT,(b)9mMC-TNTs,(c)27mMC-TNTs,(d)45mMC-TNTs,(e)75mMC-TNTsand(f)SEM-EDX.
Figure 1
2017Vol.1 No.1:4
4
Journal of Nanoscience & Nanotechnology Research
This article is available in: http://www.imedpub.com/journal-nanoscience-nanotechnology-research/
Kβ1 emission line respectively. Additionally, the EDX spectrahasrevealedthepresenceofaTipeakat0.52keVpeakwhichis due to the oxidation state of Ti (IV) and the peak at 0.045keVarises fromanoxidationstateofTi (III) [10].Thepresenceof Ti (III) species is of particular interest for DSSC applicationsince these form a band ˜̃0.5 eV below the conduction bandofTiO2. This results in increasednumberof freeelectronsandhence increase then-conductivityandcurrentproducedwhichis ideal for DSSC device performance. Furthermore, the EDXspectrahaverevealedthepresenceofanOxygenpeakat0.5keVcorrespondingtoKα1emissionline.ThefactthattheEDXspectrahasrevealedthepresenceofanTi(IV)peakat0.52KeVandthepresenceof anOxygenpeak at 0.5 KeV this has endorsed thesuccessfulhydrolysisoftheprecursorsolutiontoformationofatitanium(IV)oxide(TiO2).AlsonoticeablefromtheEDXspectraisthepresenceofAlpeakat0.99keV,theobservedAlpeakisduetoincompleteremovalofanodicaluminaoxidetemplatesusedinpreparationoftheTNTs.Figure 1fhasalsorevealedthepresenceofCpeakinallsample.ThepresenceofcarboncanbeattributedtosamplepreparationprocedurepriorSEManalysiswhichusedaconductivecarbonmedium.ThesamplesweresputtercoatedwithcarbontoreducechargingduringSEMmeasurements.
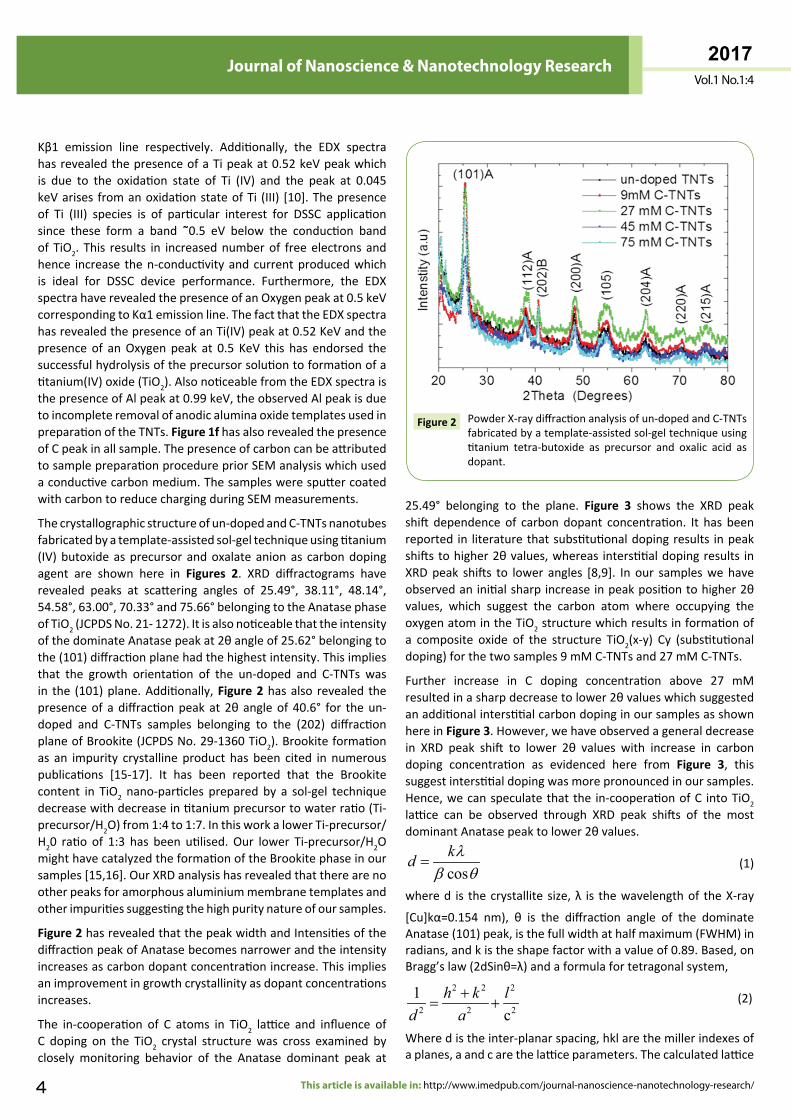
Thecrystallographicstructureofun-dopedandC-TNTsnanotubesfabricatedbyatemplate-assistedsol-geltechniqueusingtitanium(IV)butoxideasprecursorandoxalateanionas carbondopingagent are shown here in Figures 2. XRD diffractograms haverevealed peaks at scattering angles of 25.49°, 38.11°, 48.14°,54.58°,63.00°,70.33°and75.66°belongingtotheAnatasephaseofTiO2(JCPDSNo.21-1272).ItisalsonoticeablethattheintensityofthedominateAnatasepeakat2θangleof25.62°belongingtothe(101)diffractionplanehadthehighestintensity.Thisimpliesthat the growth orientation of the un-doped and C-TNTs wasin the (101)plane.Additionally,Figure 2hasalso revealed thepresenceof adiffractionpeakat2θangleof 40.6° for theun-doped and C-TNTs samples belonging to the (202) diffractionplaneofBrookite(JCPDSNo.29-1360TiO2).Brookiteformationas an impurity crystalline product has been cited in numerouspublications [15-17]. It has been reported that the Brookitecontent in TiO2 nano-particles preparedby a sol-gel techniquedecreasewithdecreaseintitaniumprecursortowaterratio(Ti-precursor/H2O)from1:4to1:7.InthisworkalowerTi-precursor/H20 ratio of 1:3 has been utilised. Our lower Ti-precursor/H2OmighthavecatalyzedtheformationoftheBrookitephaseinoursamples[15,16].OurXRDanalysishasrevealedthattherearenootherpeaksforamorphousaluminiummembranetemplatesandotherimpuritiessuggestingthehighpuritynatureofoursamples.
Figure 2hasrevealedthatthepeakwidthandIntensitiesofthediffractionpeakofAnatasebecomesnarrowerandtheintensityincreasesascarbondopantconcentrationincrease.Thisimpliesanimprovementingrowthcrystallinityasdopantconcentrationsincreases.
The in-cooperation of C atoms in TiO2 lattice and influence ofC doping on the TiO2 crystal structurewas cross examined byclosely monitoring behavior of the Anatase dominant peak at
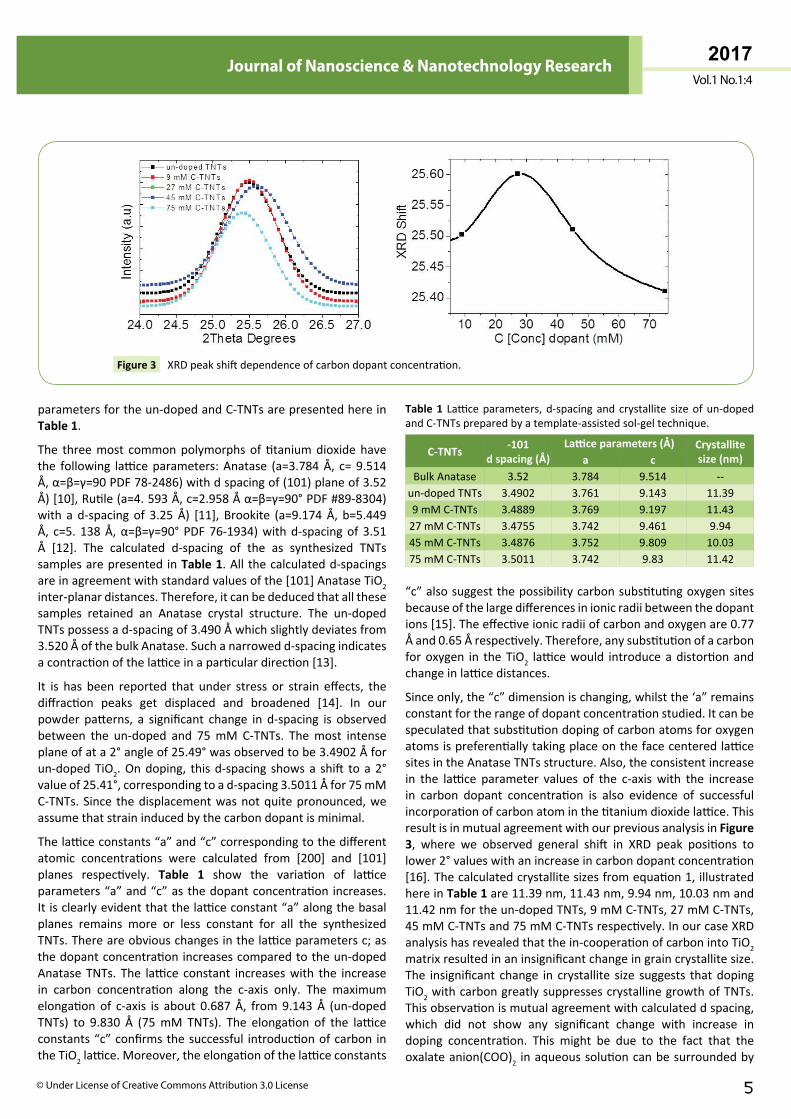
25.49° belonging to the plane. Figure 3 shows the XRD peakshift dependenceof carbondopant concentration. It has beenreported in literaturethatsubstitutionaldopingresults inpeakshiftstohigher2θvalues,whereas interstitialdopingresults inXRDpeak shifts to lower angles [8,9]. In our sampleswehaveobservedaninitialsharpincreaseinpeakpositiontohigher2θvalues, which suggest the carbon atom where occupying theoxygenatomintheTiO2structurewhichresultsinformationofa composite oxide of the structure TiO2(x-y) Cy (substitutionaldoping)forthetwosamples9mMC-TNTsand27mMC-TNTs.
Further increase in C doping concentration above 27 mMresultedinasharpdecreasetolower2θvalueswhichsuggestedanadditionalinterstitialcarbondopinginoursamplesasshownhereinFigure 3.However,wehaveobservedageneraldecreasein XRD peak shift to lower 2θ values with increase in carbondoping concentration as evidenced here from Figure 3, thissuggestinterstitialdopingwasmorepronouncedinoursamples.Hence,wecanspeculatethatthe in-cooperationofC intoTiO2 lattice can be observed through XRD peak shifts of the mostdominantAnatasepeaktolower2θvalues.
coskd λ
β θ= (1)
whered is thecrystallitesize,λ is thewavelengthof theX-ray
[Cu]kα=0.154 nm), θ is the diffraction angle of the dominateAnatase(101)peak,isthefullwidthathalfmaximum(FWHM)inradians,andkistheshapefactorwithavalueof0.89.Based,onBragg’slaw(2dSinθ=λ)andaformulafortetragonalsystem,
2 2 2
2 2 2
1c
h k ld a
+= + (2)
Wheredistheinter-planarspacing,hklarethemillerindexesof aplanes,aandcarethelatticeparameters.Thecalculatedlattice
PowderX-raydiffractionanalysisofun-dopedandC-TNTsfabricatedbyatemplate-assistedsol-geltechniqueusingtitanium tetra-butoxide as precursor and oxalic acid asdopant.
Figure 2
2017Vol.1 No.1:4
ARCHIVOS DE MEDICINAISSN 1698-9465
5© Under License of Creative Commons Attribution 3.0 License
Journal of Nanoscience & Nanotechnology Research
parametersfortheun-dopedandC-TNTsarepresentedhereinTable 1.
The threemost commonpolymorphsoftitaniumdioxidehavethe following latticeparameters:Anatase (a=3.784Å, c=9.514Å,α=β=γ=90PDF78-2486)withdspacingof(101)planeof3.52Å)[10],Rutile(a=4.593Å,c=2.958Åα=β=γ=90°PDF#89-8304)with a d-spacingof 3.25Å) [11], Brookite (a=9.174Å, b=5.449Å, c=5.138Å,α=β=γ=90°PDF76-1934)withd-spacingof3.51Å [12]. The calculated d-spacing of the as synthesized TNTssamplesarepresented inTable 1.All thecalculatedd-spacingsareinagreementwithstandardvaluesofthe[101]AnataseTiO2 inter-planardistances.Therefore,itcanbededucedthatallthesesamples retained an Anatase crystal structure. The un-dopedTNTspossessad-spacingof3.490Åwhichslightlydeviatesfrom3.520ÅofthebulkAnatase.Suchanarrowedd-spacingindicatesacontractionofthelatticeinaparticulardirection[13].
It is has been reported that under stress or strain effects, thediffraction peaks get displaced and broadened [14]. In ourpowder patterns, a significant change in d-spacing is observedbetween the un-doped and 75mM C-TNTs. Themost intenseplaneofata2°angleof25.49°wasobservedtobe3.4902Åforun-dopedTiO2.Ondoping, thisd-spacing showsa shift toa2°valueof25.41°,correspondingtoad-spacing3.5011Åfor75mMC-TNTs.Since thedisplacementwasnotquitepronounced,weassumethatstraininducedbythecarbondopantisminimal.
Thelatticeconstants“a”and“c”correspondingtothedifferentatomic concentrations were calculated from [200] and [101]planes respectively. Table 1 show the variation of latticeparameters“a”and“c”asthedopantconcentration increases.Itisclearlyevidentthatthelatticeconstant“a”alongthebasalplanes remains more or less constant for all the synthesizedTNTs.Thereareobviouschangesinthelatticeparametersc;asthedopantconcentrationincreasescomparedtotheun-dopedAnataseTNTs. The lattice constant increaseswith the increasein carbon concentration along the c-axis only. The maximumelongationof c-axis is about 0.687Å, from9.143Å (un-dopedTNTs) to 9.830 Å (75mM TNTs). The elongation of the latticeconstants“c”confirmsthesuccessful introductionofcarbon intheTiO2lattice.Moreover,theelongationofthelatticeconstants
“c”alsosuggestthepossibilitycarbonsubstitutingoxygensitesbecauseofthelargedifferencesinionicradiibetweenthedopantions[15].Theeffectiveionicradiiofcarbonandoxygenare0.77Åand0.65Årespectively.Therefore,anysubstitutionofacarbonforoxygen in theTiO2 latticewould introduceadistortionandchangeinlatticedistances.
Sinceonly,the“c”dimensionischanging,whilstthe‘a”remainsconstantfortherangeofdopantconcentrationstudied.ItcanbespeculatedthatsubstitutiondopingofcarbonatomsforoxygenatomsispreferentiallytakingplaceonthefacecenteredlatticesitesintheAnataseTNTsstructure.Also,theconsistentincreasein the lattice parameter values of the c-axiswith the increasein carbon dopant concentration is also evidence of successfulincorporationofcarbonatominthetitaniumdioxidelattice.ThisresultisinmutualagreementwithourpreviousanalysisinFigure 3, where we observed general shift in XRD peak positions tolower2°valueswithanincreaseincarbondopantconcentration[16].Thecalculatedcrystallitesizesfromequation1,illustratedhereinTable 1are11.39nm,11.43nm,9.94nm,10.03nmand11.42nmfortheun-dopedTNTs,9mMC-TNTs,27mMC-TNTs,45mMC-TNTsand75mMC-TNTsrespectively.InourcaseXRDanalysishasrevealedthatthein-cooperationofcarbonintoTiO2 matrixresultedinaninsignificantchangeingraincrystallitesize.The insignificant change in crystallite size suggests thatdopingTiO2withcarbongreatlysuppressescrystallinegrowthofTNTs.Thisobservationismutualagreementwithcalculateddspacing,which did not show any significant change with increase indoping concentration. This might be due to the fact that theoxalateanion(COO)2 inaqueoussolutioncanbesurroundedby
XRDpeakshiftdependenceofcarbondopantconcentration.Figure 3
C-TNTs -101d spacing (Å)
Lattice parameters (Å) Crystallite size (nm)a c
BulkAnatase 3.52 3.784 9.514 --un-dopedTNTs 3.4902 3.761 9.143 11.399mMC-TNTs 3.4889 3.769 9.197 11.4327mMC-TNTs 3.4755 3.742 9.461 9.9445mMC-TNTs 3.4876 3.752 9.809 10.0375mMC-TNTs 3.5011 3.742 9.83 11.42
Table 1 Latticeparameters,d-spacingandcrystallite sizeofun-dopedandC-TNTspreparedbyatemplate-assistedsol-geltechnique.
2017Vol.1 No.1:4
6
Journal of Nanoscience & Nanotechnology Research
This article is available in: http://www.imedpub.com/journal-nanoscience-nanotechnology-research/
hydratedwatermolecules (H2δ+Oδ-) due ion-dipole interaction,
the diffusion into TiO2matrix can be restricted. As a result oflimiteddiffusionalayercomposedofcarbonatespeciesformsonthesurfaceof thenano-crystals resulting in thesuppressionofTiO2crystalgrowthsize[16-22].
Background Raman SpectroscopyIt is well known that the Anatase TiO2 is characterized by thetetragonalspacegroupD194h(I4/amd)withtitaniumcationssix-foldcoordinatedtooxygenanions,formingdistortedoctahedraledges.TheprimitiveunitcellhastwoTiO2unitswithTiatoms(0,0,0)and(0,1/2,1/4)andOatomsat(0,0,u),(0,0,ū),(0,1/2,u+1/4)and(0,1/2,1/2-u),givingrisetosixactiveRamanmodes:A1g+2B1g+3Eg. Anatase phase of TiO2 has vibrational modesatofRaman frequenciesand symmetryat144cm−1 (Eg1),197cm−1(Eg2),399cm−1(B1g),513cm−1(A1g),519cm−1(B1g),and639cm−1 (Eg3) [23,24].TheRutilestructure is characterizedbythetetragonalspacegroupofP42/mnmandfiveactivemodes(B1g,multi-protonprocess, Eg, A1g, andB2g) appearing at 143cm−1 (B1g), 236 cm
−1 multi-proton process, 447 cm−1 (Eg), 613cm−1 (A1g), and826 cm-1 (B2g). Rutiletitaniumcations are six-foldcoordinatedtooxygenanions,formingdistortedoctahedraljoinedbysharing theoctahedraledges.BrookitephaseofTiO2 belongstothePbcaspacegroup,itslowersymmetryandlargerunit cell results in a larger number of Raman active phononscomparedtoAnataseandRutilestructures.Fromthesymmetryconsiderationsonecanexpect36(9A1g+9B2g+9B3g)[25].
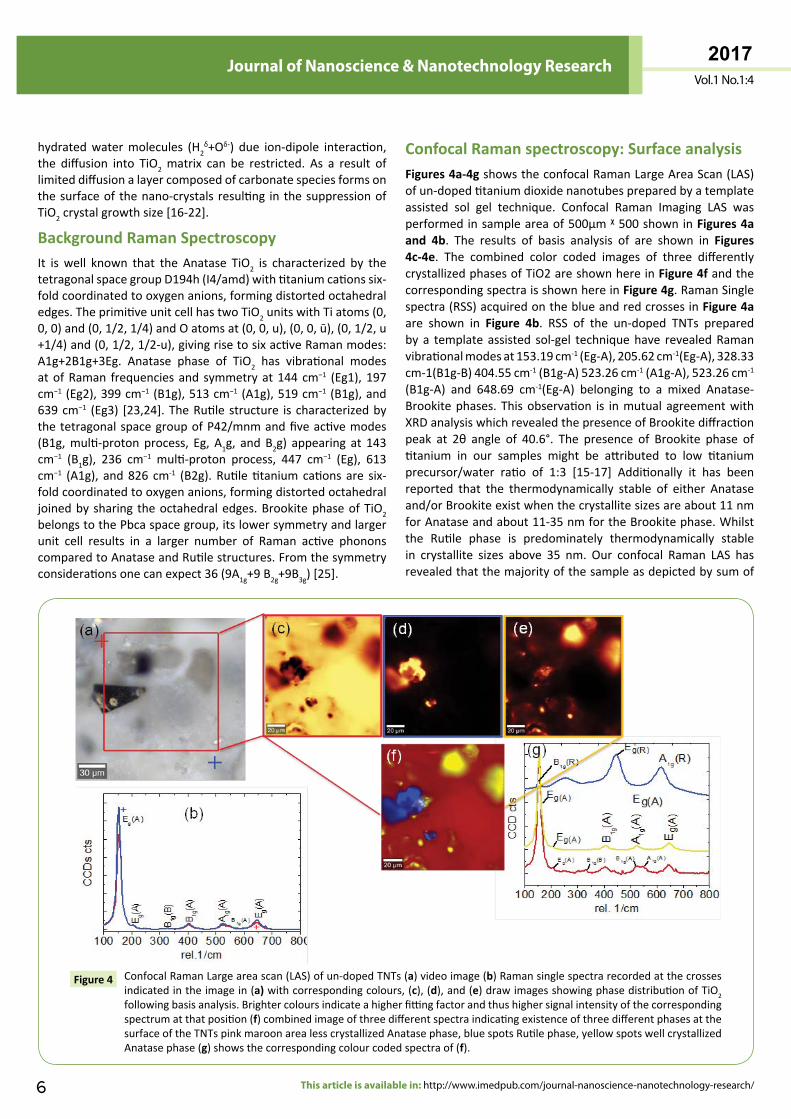
Confocal Raman spectroscopy: Surface analysisFigures 4a-4gshowstheconfocalRamanLargeAreaScan(LAS)ofun-dopedtitaniumdioxidenanotubespreparedbyatemplateassisted sol gel technique. Confocal Raman Imaging LAS wasperformedinsampleareaof500µmᵡ500showninFigures 4a and 4b. The results of basis analysis of are shown in Figures 4c-4e. The combined color coded images of three differentlycrystallizedphasesofTiO2areshownhereinFigure 4fandthecorrespondingspectraisshownhereinFigure 4g.RamanSinglespectra(RSS)acquiredontheblueandredcrossesinFigure 4a are shown in Figure 4b. RSS of the un-doped TNTs preparedbya template assisted sol-gel techniquehave revealedRamanvibrationalmodesat153.19cm-1(Eg-A),205.62cm-1(Eg-A),328.33cm-1(B1g-B)404.55cm-1(B1g-A)523.26cm-1(A1g-A),523.26cm-1
(B1g-A) and 648.69 cm-1(Eg-A) belonging to a mixed Anatase-Brookitephases.Thisobservation is inmutualagreementwithXRDanalysiswhichrevealedthepresenceofBrookitediffractionpeak at 2θ angle of 40.6°. The presence of Brookite phase oftitanium in our samples might be attributed to low titaniumprecursor/water ratio of 1:3 [15-17] Additionally it has beenreported that the thermodynamically stable of either Anataseand/orBrookiteexistwhenthecrystallitesizesareabout11nmforAnataseandabout11-35nmfortheBrookitephase.Whilstthe Rutile phase is predominately thermodynamically stablein crystallite sizes above 35 nm. Our confocal Raman LAS hasrevealedthatthemajorityofthesampleasdepictedbysumof
ConfocalRamanLargeareascan(LAS)ofun-dopedTNTs(a)videoimage(b)Ramansinglespectrarecordedatthecrossesindicatedintheimagein(a)withcorrespondingcolours,(c),(d),and(e)drawimagesshowingphasedistributionofTiO2 followingbasisanalysis.Brightercoloursindicateahigherfittingfactorandthushighersignalintensityofthecorrespondingspectrumatthatposition(f)combinedimageofthreedifferentspectraindicatingexistenceofthreedifferentphasesatthesurfaceoftheTNTspinkmaroonarealesscrystallizedAnatasephase,bluespotsRutilephase,yellowspotswellcrystallizedAnatasephase(g)showsthecorrespondingcolourcodedspectraof(f).
Figure 4
2017Vol.1 No.1:4
ARCHIVOS DE MEDICINAISSN 1698-9465
7© Under License of Creative Commons Attribution 3.0 License
Journal of Nanoscience & Nanotechnology Research
maroon–yellowareaconsistsofamixedAnatase-BrookitephasewhichismutualagreementwithXRDanalysiswhichrevealedacrystallitesizeof11.39nm[26].
Toobtainaconclusivecrystallinephasedistribution,aLASwasperformed on the video image in Figure 4a. Confocal RamanimagingLASscanwasperformedonthehighlightedrectangulararea330µm×330µmshownhereinFigure 4a. Figure 4fshowsthecombinedcolor-codedimagerevealsthedistributionofabout3distinctcrystallinephasesofTiO2andFigure 4gcorrespondingcolor-codedspectraofthe3distinctphasesofTiO2.Themajorityof theun-dopedTNTs sampledepictedby themaroonarea inFigure 4f, with corresponding maroon Raman spectra, hasrevealedRamanvibrationmodesat153.78cm-1 (Eg-A),209.08cm-1(Eg-A),331.04cm-1(B1g-B),403.74cm-1(B1g-A),527.16cm-1 (A1g-A),541.83cm-1(B1g-A)and644.59cm-1(Eg-A)whichconsistofAnatasephaseofTiO2 The lowestEg1-Anatasemodeof themaroon area which is dominant in the un-doped TNT samplehas been red shifted by ∆9. 78 cm-1whereas the highest Eg3-Anatasemodehasbeenblue shiftedby∆3.59 cm-1 comparedtothevibrationalfrequenciesthebulkTiO2.Thesignificantshiftis attributed to phonon confinement and decrease in particlesize.Additionally,Figure 4fhasrevealedthatthesurfaceoftheun-dopedTNTshasbluespotswithcorrespondingblueRamanspectra shown here in Figure 4g. The blue spots have Ramanvibrationalfrequenciesat150.64cm-1(B1g-R),252.14cm-1(mutli-phonon process), 447.42 cm-1 (Eg-R) and 616.09 cm-1 (A1g-R)allbelongingtoaRutilephaseofTiO2.Whilsttheyellowspots,Figure 4f have Raman spectra with Raman vibrational modesat 153.78 cm-1 (Eg-A), 204.72 cm-1 (Eg-A), 332.27 cm-1 (B1g-B),521.59cm-1(B1g-A),545.51cm-1(A1g-A),and644.57cm-1(Eg-A)allbelonging toaAnataseandBrookitemixedphase.ConfocalRamanLargeareascanofun-dopedTNTspreparedbyatemplateassisted sol-gel techniquehave revealed for thefirsttime thatthesurfaceofthenanotubesconsistsofAnatase,BrookiteandRutilephasesofTiO2.Theun-controllednatureofformationandco-existenceofthesethreephasesinTNTsmembranesmightbethemainreasonwhyDSSCbasedonTNTsanodesstillhavelowerefficiencyascomparedtotheTiO2nanoparticlecounterpart.
Theseresults inmutualagreementwithXRDmeasurementsoftheun-dopedTNTssamplethatrevealedpeaksat25.62°(101),38.33°(112),40.6°(202),48.40°(200),54.9°(105),62.5°(118),70.7°(220),and75.1°(215)belongingtomixedAnatase-BrookitephaseasshownhereinFigure 2.However,noadditionalpeaksdue Rutile phase of TiO2 have been detected through XRDmeasurements. Our confocal Raman LAS measurements haverevealed the presence of Rutile phase in our samples. OurmethodofcharacterizationofTNTsthroughconfocalRamanLAShasoutperformedXRDmeasurementswhichfailedtodetectthepresenceoftheRutilephaseintheun-dopedTNTssamples.
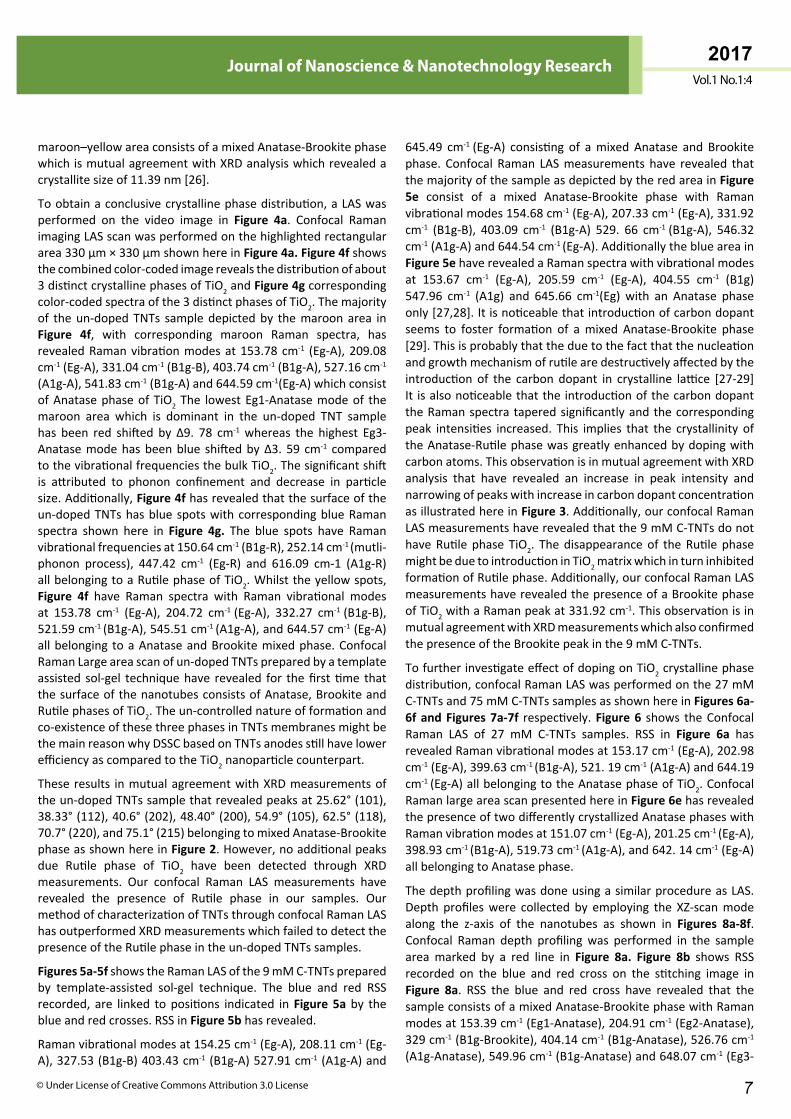
Figures 5a-5fshowstheRamanLASofthe9mMC-TNTspreparedby template-assisted sol-gel technique. The blue and red RSSrecorded, are linked topositions indicated inFigure 5a by theblueandredcrosses.RSSinFigure 5bhasrevealed.
Ramanvibrationalmodesat154.25cm-1(Eg-A),208.11cm-1(Eg-A),327.53(B1g-B)403.43cm-1(B1g-A)527.91cm-1(A1g-A)and
645.49 cm-1 (Eg-A) consisting of amixed Anatase and Brookitephase. Confocal Raman LASmeasurements have revealed thatthemajorityofthesampleasdepictedbytheredareainFigure 5e consist of a mixed Anatase-Brookite phase with Ramanvibrationalmodes154.68cm-1(Eg-A),207.33cm-1(Eg-A),331.92cm-1 (B1g-B), 403.09 cm-1 (B1g-A) 529. 66 cm-1 (B1g-A), 546.32cm-1(A1g-A)and644.54cm-1(Eg-A).AdditionallytheblueareainFigure 5ehaverevealedaRamanspectrawithvibrationalmodesat 153.67 cm-1 (Eg-A), 205.59 cm-1 (Eg-A), 404.55 cm-1 (B1g)547.96 cm-1 (A1g) and 645.66 cm-1(Eg) with an Anatase phaseonly[27,28].Itisnoticeablethatintroductionofcarbondopantseems to foster formation of amixed Anatase-Brookite phase[29].Thisisprobablythattheduetothefactthatthenucleationandgrowthmechanismofrutilearedestructivelyaffectedbytheintroduction of the carbon dopant in crystalline lattice [27-29]It isalsonoticeablethattheintroductionofthecarbondopanttheRamanspectrataperedsignificantlyandthecorrespondingpeak intensities increased. This implies that the crystallinity oftheAnatase-Rutilephasewasgreatlyenhancedbydopingwithcarbonatoms.ThisobservationisinmutualagreementwithXRDanalysis that have revealed an increase in peak intensity andnarrowingofpeakswithincreaseincarbondopantconcentrationasillustratedhereinFigure 3.Additionally,ourconfocalRamanLASmeasurementshaverevealedthatthe9mMC-TNTsdonothaveRutilephase TiO2. Thedisappearanceof theRutilephasemightbeduetointroductioninTiO2matrixwhichinturninhibitedformationofRutilephase.Additionally,ourconfocalRamanLASmeasurementshaverevealedthepresenceofaBrookitephaseofTiO2withaRamanpeakat331.92cm-1.ThisobservationisinmutualagreementwithXRDmeasurementswhichalsoconfirmedthepresenceoftheBrookitepeakinthe9mMC-TNTs.
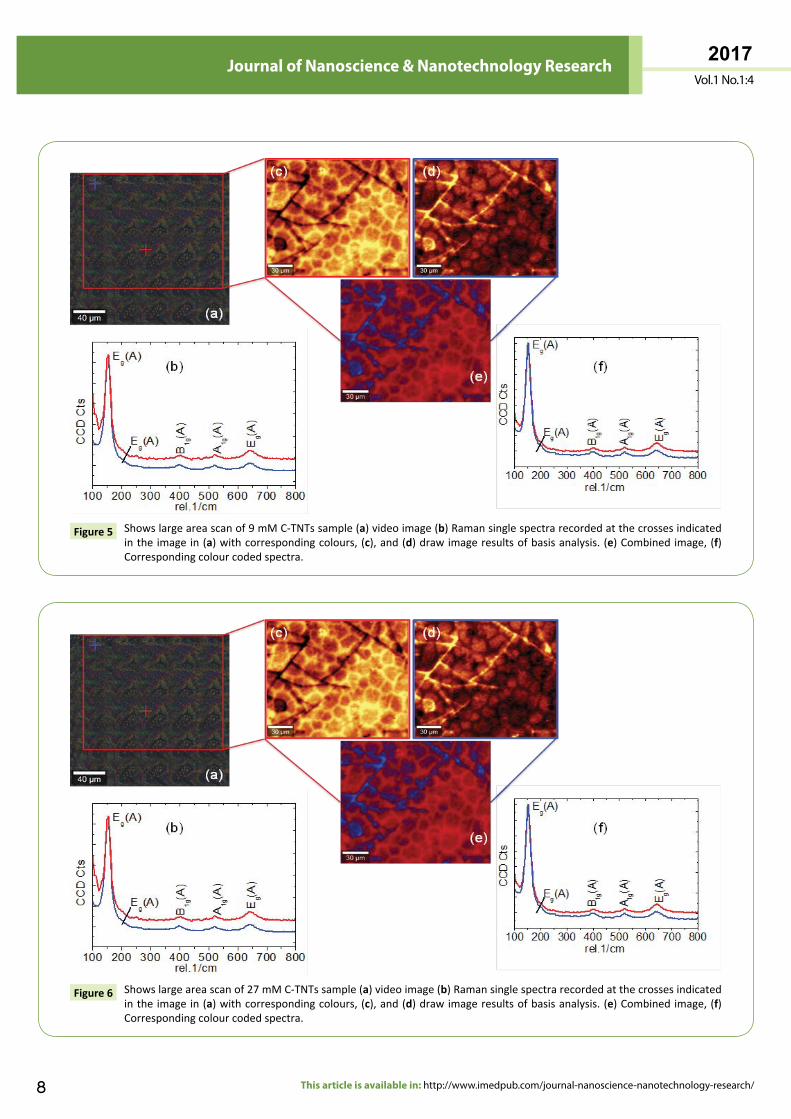
TofurtherinvestigateeffectofdopingonTiO2crystallinephasedistribution,confocalRamanLASwasperformedonthe27mMC-TNTsand75mMC-TNTssamplesasshownhereinFigures 6a-6f and Figures 7a-7f respectively.Figure 6 shows theConfocalRaman LAS of 27 mM C-TNTs samples. RSS in Figure 6a hasrevealedRamanvibrationalmodesat153.17cm-1(Eg-A),202.98cm-1(Eg-A),399.63cm-1(B1g-A),521.19cm-1(A1g-A)and644.19cm-1(Eg-A)allbelongingtotheAnatasephaseofTiO2.ConfocalRamanlargeareascanpresentedhereinFigure 6ehasrevealedthepresenceoftwodifferentlycrystallizedAnatasephaseswithRamanvibrationmodesat151.07cm-1(Eg-A),201.25cm-1(Eg-A),398.93cm-1(B1g-A),519.73cm-1(A1g-A),and642.14cm-1(Eg-A)allbelongingtoAnatasephase.
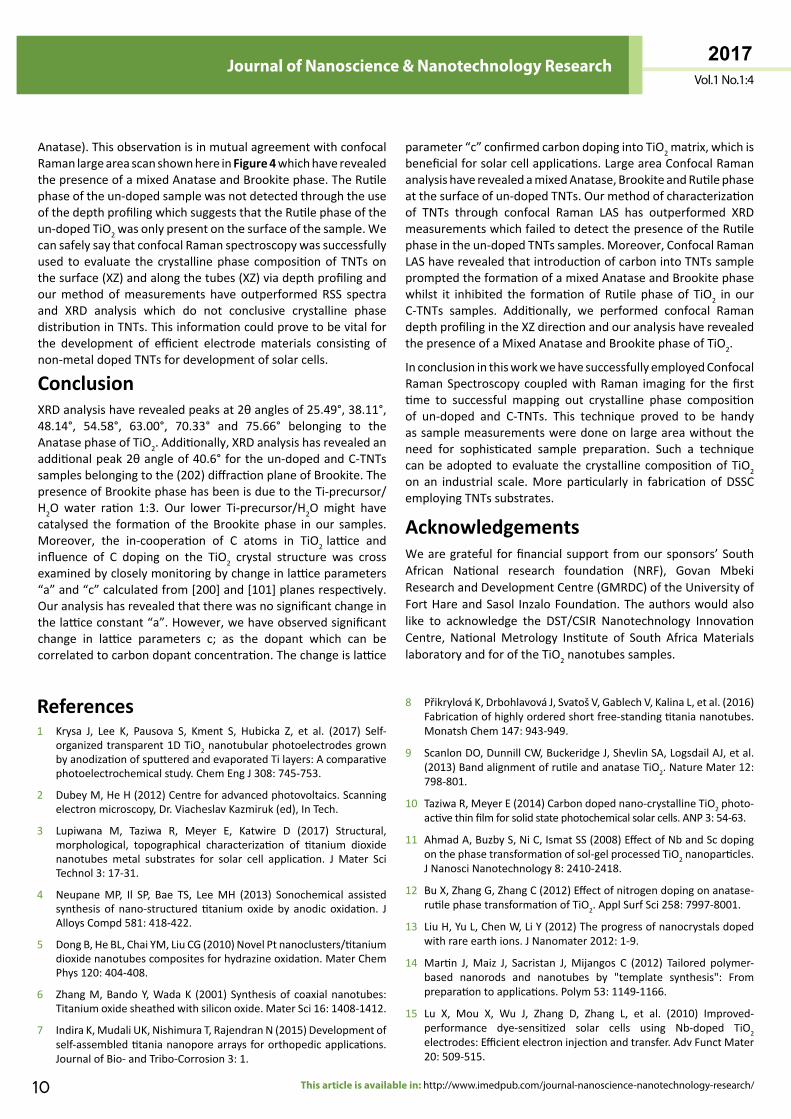
ThedepthprofilingwasdoneusingasimilarprocedureasLAS.Depth profileswere collected by employing the XZ-scanmodealong the z-axis of the nanotubes as shown in Figures 8a-8f.Confocal Raman depth profilingwas performed in the sampleareamarked by a red line in Figure 8a. Figure 8b shows RSSrecorded on the blue and red cross on the stitching image inFigure 8a. RSS the blue and red cross have revealed that thesampleconsistsofamixedAnatase-BrookitephasewithRamanmodesat153.39cm-1(Eg1-Anatase),204.91cm-1(Eg2-Anatase),329cm-1(B1g-Brookite),404.14cm-1(B1g-Anatase),526.76cm-1 (A1g-Anatase),549.96cm-1(B1g-Anatase)and648.07cm-1(Eg3-
2017Vol.1 No.1:4
8
Journal of Nanoscience & Nanotechnology Research
This article is available in: http://www.imedpub.com/journal-nanoscience-nanotechnology-research/
Showslargeareascanof9mMC-TNTssample(a)videoimage(b)Ramansinglespectrarecordedatthecrossesindicatedintheimagein(a)withcorrespondingcolours,(c),and(d)drawimageresultsofbasisanalysis.(e)Combinedimage,(f)Correspondingcolourcodedspectra.
Figure 5
Showslargeareascanof27mMC-TNTssample(a)videoimage(b)Ramansinglespectrarecordedatthecrossesindicatedintheimagein(a)withcorrespondingcolours,(c),and(d)drawimageresultsofbasisanalysis.(e)Combinedimage,(f)Correspondingcolourcodedspectra.
Figure 6
2017Vol.1 No.1:4
ARCHIVOS DE MEDICINAISSN 1698-9465
9© Under License of Creative Commons Attribution 3.0 License
Journal of Nanoscience & Nanotechnology Research
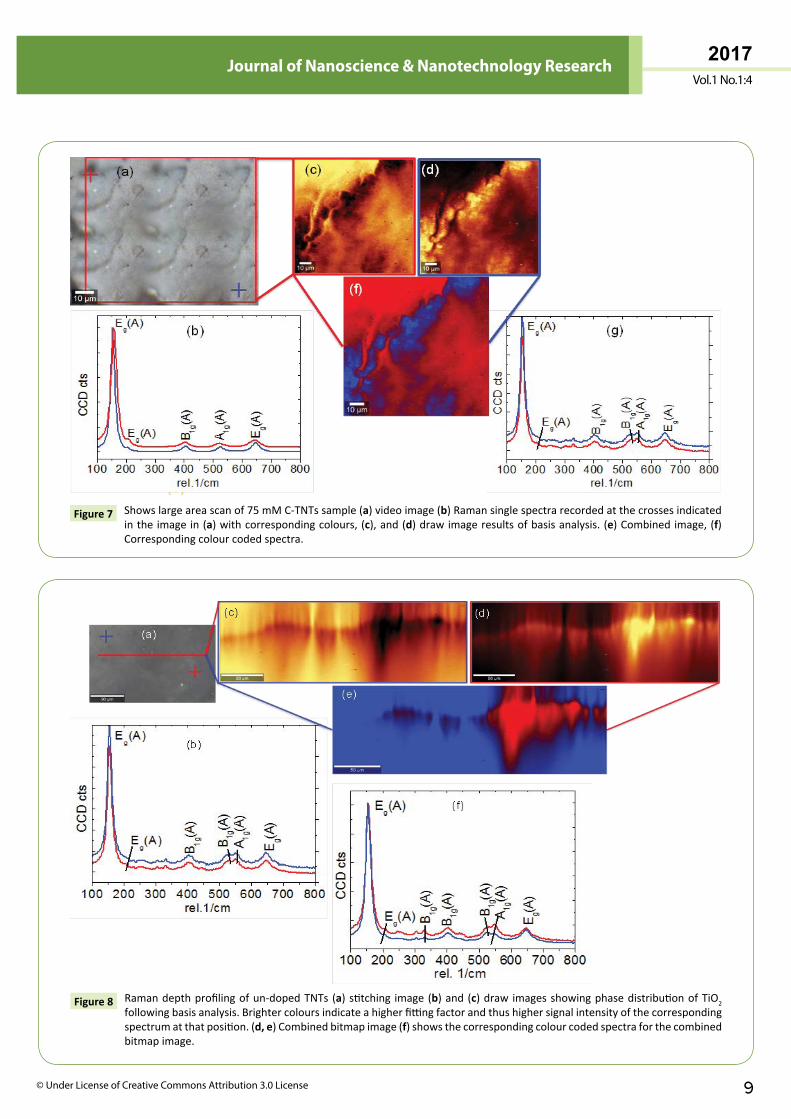
Showslargeareascanof75mMC-TNTssample(a)videoimage(b)Ramansinglespectrarecordedatthecrossesindicatedintheimagein(a)withcorrespondingcolours,(c),and(d)drawimageresultsofbasisanalysis.(e)Combinedimage,(f)Correspondingcolourcodedspectra.
Figure 7
Ramandepthprofilingofun-dopedTNTs(a)stitching image(b)and(c)draw imagesshowingphasedistributionofTiO2 followingbasisanalysis.Brightercoloursindicateahigherfittingfactorandthushighersignalintensityofthecorrespondingspectrumatthatposition.(d, e)Combinedbitmapimage(f)showsthecorrespondingcolourcodedspectraforthecombinedbitmapimage.
Figure 8
2017Vol.1 No.1:4
10
Journal of Nanoscience & Nanotechnology Research
This article is available in: http://www.imedpub.com/journal-nanoscience-nanotechnology-research/
Anatase).ThisobservationisinmutualagreementwithconfocalRamanlargeareascanshownhereinFigure 4 whichhaverevealedthepresenceofamixedAnataseandBrookitephase.TheRutilephaseoftheun-dopedsamplewasnotdetectedthroughtheuseofthedepthprofilingwhichsuggeststhattheRutilephaseoftheun-dopedTiO2wasonlypresentonthesurfaceofthesample.WecansafelysaythatconfocalRamanspectroscopywassuccessfullyused toevaluate the crystallinephase compositionofTNTsonthesurface(XZ)andalongthetubes(XZ)viadepthprofilingandourmethodofmeasurements have outperformedRSS spectraand XRD analysis which do not conclusive crystalline phasedistributioninTNTs.Thisinformationcouldprovetobevitalforthe development of efficient electrodematerials consisting ofnon-metaldopedTNTsfordevelopmentofsolarcells.
Conclusion XRDanalysishaverevealedpeaksat2θanglesof25.49°,38.11°,48.14°, 54.58°, 63.00°, 70.33° and 75.66° belonging to theAnatasephaseofTiO2.Additionally,XRDanalysishasrevealedanadditionalpeak2θangleof40.6°fortheun-dopedandC-TNTssamplesbelongingtothe(202)diffractionplaneofBrookite.ThepresenceofBrookitephasehasbeenisduetotheTi-precursor/H2O water ration 1:3. Our lower Ti-precursor/H2Omight havecatalysed the formationof theBrookite phase in our samples.Moreover, the in-cooperation of C atoms in TiO2 lattice andinfluence of C doping on the TiO2 crystal structure was crossexaminedbycloselymonitoringbychangeinlatticeparameters“a”and“c”calculatedfrom[200]and[101]planesrespectively.Ouranalysishasrevealedthattherewasnosignificantchangeinthelatticeconstant“a”.However,wehaveobservedsignificantchange in lattice parameters c; as the dopant which can becorrelatedtocarbondopantconcentration.Thechangeislattice
parameter“c”confirmedcarbondopingintoTiO2matrix,whichisbeneficialforsolarcellapplications.LargeareaConfocalRamananalysishaverevealedamixedAnatase,BrookiteandRutilephaseatthesurfaceofun-dopedTNTs.Ourmethodofcharacterizationof TNTs through confocal Raman LAS has outperformed XRDmeasurementswhichfailedtodetectthepresenceoftheRutilephaseintheun-dopedTNTssamples.Moreover,ConfocalRamanLAShaverevealedthatintroductionofcarbonintoTNTssamplepromptedtheformationofamixedAnataseandBrookitephasewhilst it inhibited the formationof Rutile phaseof TiO2 in ourC-TNTs samples. Additionally, we performed confocal RamandepthprofilingintheXZdirectionandouranalysishaverevealedthepresenceofaMixedAnataseandBrookitephaseofTiO2.
InconclusioninthisworkwehavesuccessfullyemployedConfocalRamanSpectroscopycoupledwithRaman imaging for thefirsttime to successful mapping out crystalline phase compositionof un-doped and C-TNTs. This technique proved to be handyassamplemeasurementsweredoneonlargeareawithouttheneed for sophisticated sample preparation. Such a techniquecanbeadoptedtoevaluate thecrystallinecompositionofTiO2 on an industrial scale.Moreparticularly in fabricationofDSSCemployingTNTssubstrates.
AcknowledgementsWearegrateful forfinancialsupport fromoursponsors’SouthAfrican National research foundation (NRF), Govan MbekiResearchandDevelopmentCentre(GMRDC)oftheUniversityofFortHareandSasol InzaloFoundation.Theauthorswouldalsolike to acknowledge the DST/CSIR Nanotechnology InnovationCentre, NationalMetrology Institute of South AfricaMaterialslaboratoryandforoftheTiO2nanotubessamples.
References1 Krysa J, Lee K, Pausova S, Kment S, Hubicka Z, et al. (2017) Self-
organizedtransparent1DTiO2nanotubularphotoelectrodesgrownbyanodizationofsputteredandevaporatedTilayers:Acomparativephotoelectrochemicalstudy.ChemEngJ308:745-753.
2 DubeyM,HeH(2012)Centreforadvancedphotovoltaics.Scanningelectronmicroscopy,Dr.ViacheslavKazmiruk(ed),InTech.
3 Lupiwana M, Taziwa R, Meyer E, Katwire D (2017) Structural,morphological, topographical characterization of titanium dioxidenanotubes metal substrates for solar cell application. J Mater SciTechnol3:17-31.
4 NeupaneMP, Il SP, Bae TS, LeeMH (2013) Sonochemical assistedsynthesis of nano-structuredtitaniumoxideby anodic oxidation. JAlloysCompd581:418-422.
5 DongB,HeBL,ChaiYM,LiuCG(2010)NovelPtnanoclusters/titaniumdioxidenanotubescompositesforhydrazineoxidation.MaterChemPhys120:404-408.
6 ZhangM,BandoY,WadaK (2001)Synthesisof coaxialnanotubes:Titaniumoxidesheathedwithsiliconoxide.MaterSci16:1408-1412.
7 IndiraK,MudaliUK,NishimuraT,RajendranN(2015)Developmentofself-assembledtitaniananoporearraysfororthopedicapplications.JournalofBio-andTribo-Corrosion3:1.
8 PřikrylováK,DrbohlavováJ,SvatošV,GablechV,KalinaL,etal.(2016)Fabricationofhighlyorderedshortfree-standingtitaniananotubes.MonatshChem147:943-949.
9 ScanlonDO,DunnillCW,BuckeridgeJ,ShevlinSA,LogsdailAJ,etal.(2013)BandalignmentofrutileandanataseTiO2.NatureMater12:798-801.
10 TaziwaR,MeyerE(2014)Carbondopednano-crystallineTiO2photo-activethinfilmforsolidstatephotochemicalsolarcells.ANP3:54-63.
11 AhmadA,BuzbyS,NiC,IsmatSS(2008)EffectofNbandScdopingonthephasetransformationofsol-gelprocessedTiO2nanoparticles.JNanosciNanotechnology8:2410-2418.
12 BuX,ZhangG,ZhangC(2012)Effectofnitrogendopingonanatase-rutilephasetransformationofTiO2.ApplSurfSci258:7997-8001.
13 LiuH,YuL,ChenW,LiY(2012)Theprogressofnanocrystalsdopedwithrareearthions.JNanomater2012:1-9.
14 Martin J,Maiz J, Sacristan J,Mijangos C (2012) Tailored polymer-based nanorods and nanotubes by "template synthesis": Frompreparationtoapplications.Polym53:1149-1166.
15 Lu X, Mou X, Wu J, Zhang D, Zhang L, et al. (2010) Improved-performance dye-sensitized solar cells using Nb-doped TiO2 electrodes:Efficientelectroninjectionandtransfer.AdvFunctMater20:509-515.
2017Vol.1 No.1:4
ARCHIVOS DE MEDICINAISSN 1698-9465
11© Under License of Creative Commons Attribution 3.0 License
Journal of Nanoscience & Nanotechnology Research
16 Zhang Q, Lian G (2003) Preparation of oxide nanocrystals withtunable morphologies by the moderate hydrothermal method:InsightsfromRutileTiO2.Langmuir19:967-971.
17 IsleySL,PennRL(2006)Relativebrookiteandanatasecontentinsol−gel-synthesizedtitaniumdioxidenanoparticles.JPhysChemB110:15134-15139.
18 MeagherEP,LagerGA (1979)Polyhedral thermalexpansion in theTiO2,polymorphs:Refinementofthecrystalstructuresofrutileandbrookiteathightemperature.CanMineral17:77-85.
19 BersaniD,LotticiPP,DingXZ(1998)PhononconfinementeffectsintheRamanscatteringbyTiO2nanocrystals.ApplPhysLett72:73-75.
20 Raja KS, MisraM (2011) Iron oxide nanotubes incorporated withfluoride anions for enhanced Li-ion intercalation. ECS transactions33:15-24.
21 Devi G,MuthyN, Kumar GS (2010) Photocatalytic activity of TiO2 doped with Zn 2+ and V 5+ transition metal ions: Influence ofcrystallitesizeanddopantelectronicconfigurationonphotocatalyticactivity.MaterSciEngB166:1-6.
22 Burns A, Hayes G, Li W, Hirvonen J, Demaree DJ, et al. (2005)Neodymiumiondopanteffectsonthephasetransformationinsol-gelderivedtitaniananostructures.MaterSciEngB111:150-155.
23 BalachandranU,ErorNG(1982)Ramanspectraoftitaniumdioxide.JSolidStateChem42:276-282.
24 Taziwa R, Meyer EL, Chinyama KG (2012) Raman temperaturedependenceanalysisofcarbon-dopedtitaniumdioxidenanoparticlessynthesizedbyultrasonicspraypyrolysistechnique.JMaterSci47:1531-1540.
25 TompsettGA,BowmakerGA,CooneyRP,MetsonJB,RodgersKA,etal.(1995)TheRamanspectrumofbrookite,TiO2 (Pbca,Z=8).JRamanSpectrosc26:57-62.
26 Kumar SG, Rao KSRK (2014) Polymorphic phase transition amongthetitaniacrystalstructuresusingasolution-basedapproach:fromprecursor chemistry to nucleation process. Nanoscale 6: 11574-11632.
27 Ogacho AA, Ajuoga P, Aduda BO (2015) Suppression of anatase torutilephasetransformationofniobiumdopedtio2synthesizedbyhightemperaturediffusiontechnique.IntJInnovationEduRes3:140-146.
28 HanaorDAH,SorrellCC(2011)Reviewoftheanatasetorutilephasetransformation.JMaterSci46:855-874.
29 ArnalP,CorriuJR,LeclercqD,MutinHP,ViouxA(1996)Preparationofanatase,brookiteandrutileatlowtemperaturebynon-hydrolyticsol–gelmethods.JMaterChem6:1925-1932.