Statistics II Factorial ANOVA
40
Statistics II Factorial ANOVA Çağrı Çöltekin University of Groningen Information Science April 22, 2014
Transcript of Statistics II Factorial ANOVA
Statistics IIFactorial ANOVA
Çağrı Çöltekin
University of GroningenInformation Science
April 22, 2014
Class activity Motivation Interaction Factorial ANOVA Example Effect size First lab Summary
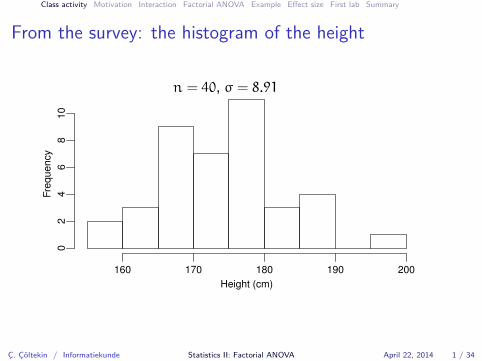
From the survey: the histogram of the height
Height (cm)
Freq
uenc
y
160 170 180 190 200
02
46
810
n = 40, σ = 8.91
Ç. Çöltekin / Informatiekunde Statistics II: Factorial ANOVA April 22, 2014 1 / 34
Class activity Motivation Interaction Factorial ANOVA Example Effect size First lab Summary
Class activity
▶ Your height measurements are in the bag.▶ Pick four height measurements randomly▶ Write them down.▶ Pass it to your neighbor.▶ Calculate the 95% confidence interval for the mean of the
numbers that you sampled.▶ During the break, draw a line on the board representing the
confidence interval you have calculated.
Ç. Çöltekin / Informatiekunde Statistics II: Factorial ANOVA April 22, 2014 2 / 34
Class activity Motivation Interaction Factorial ANOVA Example Effect size First lab Summary
Factorial ANOVA
▶ Factorial ANOVA is used when there are more than onecategorical variables (multiple factors, or groupingdimensions).
▶ treatment and type of illness▶ instruction method and gender▶ education and socio-economic status.
▶ Factorial (n-way) ANOVA follows essentially the same logic assingle (one-way) ANOVA.
Ç. Çöltekin / Informatiekunde Statistics II: Factorial ANOVA April 22, 2014 3 / 34
Class activity Motivation Interaction Factorial ANOVA Example Effect size First lab Summary
Example problems for Factorial ANOVA
▶ Compare time needed for lexical recognition in1. healthy adults2. patients with Wernicke’s aphasia3. patients with Broca’s aphasia
and gender of the subject.▶ Usability of an application based on different user interfaces
and input methods.▶ Language development of children based on their parent’s
education and socio-economic status.▶ Compare Dutch proficiency scores of second language learners
based on their native language and profession.
Ç. Çöltekin / Informatiekunde Statistics II: Factorial ANOVA April 22, 2014 4 / 34
Class activity Motivation Interaction Factorial ANOVA Example Effect size First lab Summary
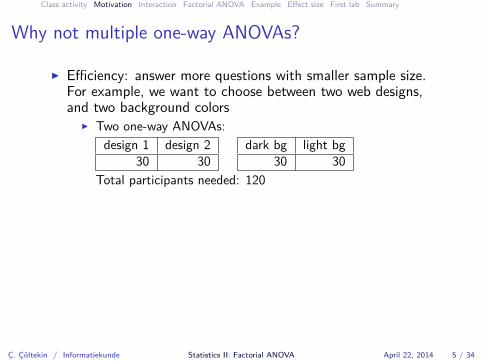
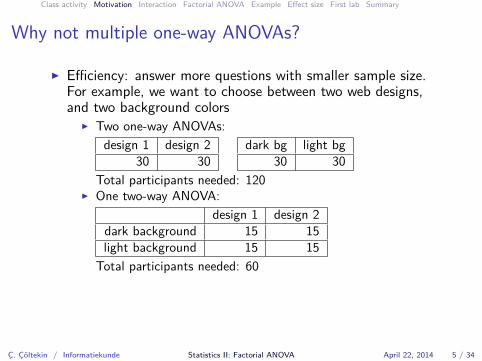
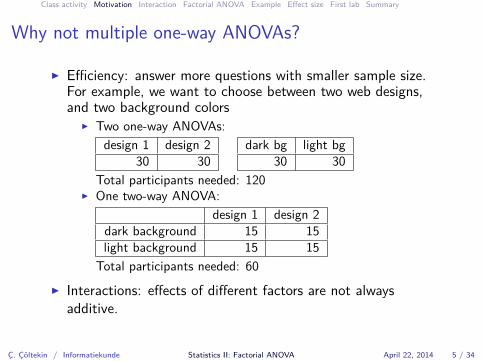
Why not multiple one-way ANOVAs?
▶ Efficiency: answer more questions with smaller sample size.For example, we want to choose between two web designs,and two background colors
▶ Two one-way ANOVAs:design 1 design 2
30 30dark bg light bg
30 30Total participants needed: 120
▶ One two-way ANOVA:design 1 design 2
dark background 15 15light background 15 15
Total participants needed: 60▶ Interactions: effects of different factors are not always
additive.
Ç. Çöltekin / Informatiekunde Statistics II: Factorial ANOVA April 22, 2014 5 / 34
Class activity Motivation Interaction Factorial ANOVA Example Effect size First lab Summary
Why not multiple one-way ANOVAs?
▶ Efficiency: answer more questions with smaller sample size.For example, we want to choose between two web designs,and two background colors
▶ Two one-way ANOVAs:design 1 design 2
30 30dark bg light bg
30 30Total participants needed: 120
▶ One two-way ANOVA:design 1 design 2
dark background 15 15light background 15 15
Total participants needed: 60
▶ Interactions: effects of different factors are not alwaysadditive.
Ç. Çöltekin / Informatiekunde Statistics II: Factorial ANOVA April 22, 2014 5 / 34
Class activity Motivation Interaction Factorial ANOVA Example Effect size First lab Summary
Why not multiple one-way ANOVAs?
▶ Efficiency: answer more questions with smaller sample size.For example, we want to choose between two web designs,and two background colors
▶ Two one-way ANOVAs:design 1 design 2
30 30dark bg light bg
30 30Total participants needed: 120
▶ One two-way ANOVA:design 1 design 2
dark background 15 15light background 15 15
Total participants needed: 60▶ Interactions: effects of different factors are not always
additive.
Ç. Çöltekin / Informatiekunde Statistics II: Factorial ANOVA April 22, 2014 5 / 34
Class activity Motivation Interaction Factorial ANOVA Example Effect size First lab Summary
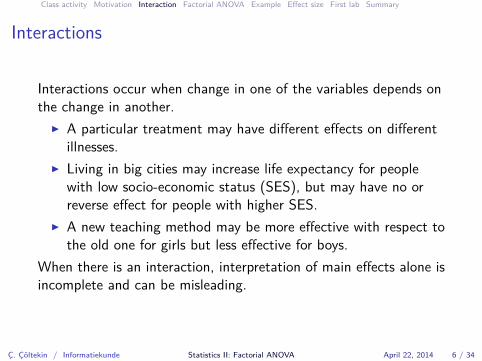
Interactions
Interactions occur when change in one of the variables depends onthe change in another.
▶ A particular treatment may have different effects on differentillnesses.
▶ Living in big cities may increase life expectancy for peoplewith low socio-economic status (SES), but may have no orreverse effect for people with higher SES.
▶ A new teaching method may be more effective with respect tothe old one for girls but less effective for boys.
When there is an interaction, interpretation of main effects alone isincomplete and can be misleading.
Ç. Çöltekin / Informatiekunde Statistics II: Factorial ANOVA April 22, 2014 6 / 34
Class activity Motivation Interaction Factorial ANOVA Example Effect size First lab Summary
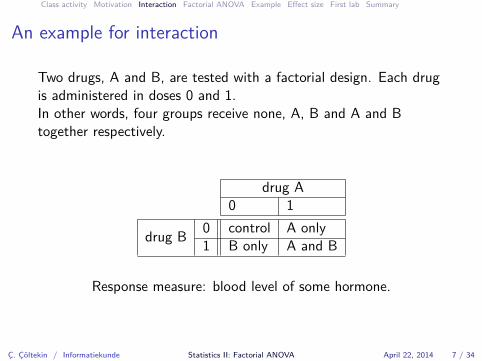
An example for interaction
Two drugs, A and B, are tested with a factorial design. Each drugis administered in doses 0 and 1.In other words, four groups receive none, A, B and A and Btogether respectively.
drug A0 1
drug B 0 control A only1 B only A and B
Response measure: blood level of some hormone.
Ç. Çöltekin / Informatiekunde Statistics II: Factorial ANOVA April 22, 2014 7 / 34
Class activity Motivation Interaction Factorial ANOVA Example Effect size First lab Summary
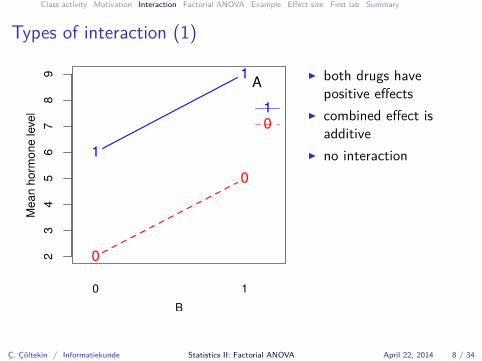
Types of interaction (1)
0
0
23
45
67
89
B
Mea
nho
rmon
ele
vel
1
1
0 1
A
10
▶ both drugs havepositive effects
▶ combined effect isadditive
▶ no interaction
Ç. Çöltekin / Informatiekunde Statistics II: Factorial ANOVA April 22, 2014 8 / 34
Class activity Motivation Interaction Factorial ANOVA Example Effect size First lab Summary
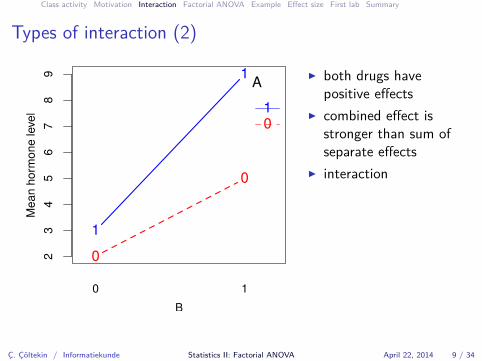
Types of interaction (2)
0
0
23
45
67
89
B
Mea
nho
rmon
ele
vel
1
1
0 1
A
10
▶ both drugs havepositive effects
▶ combined effect isstronger than sum ofseparate effects
▶ interaction
Ç. Çöltekin / Informatiekunde Statistics II: Factorial ANOVA April 22, 2014 9 / 34
Class activity Motivation Interaction Factorial ANOVA Example Effect size First lab Summary
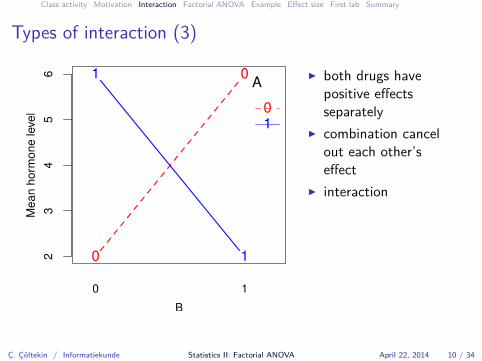
Types of interaction (3)
0
0
23
45
6
B
Mea
nho
rmon
ele
vel
1
1
0 1
A
01
▶ both drugs havepositive effectsseparately
▶ combination cancelout each other’seffect
▶ interaction
Ç. Çöltekin / Informatiekunde Statistics II: Factorial ANOVA April 22, 2014 10 / 34
Class activity Motivation Interaction Factorial ANOVA Example Effect size First lab Summary
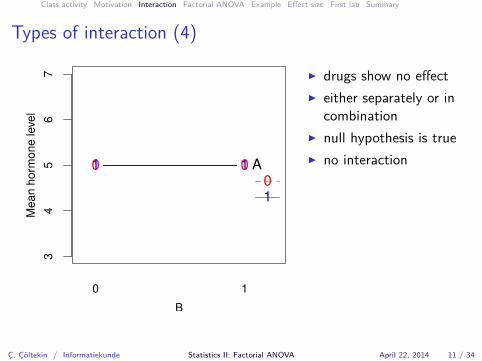
Types of interaction (4)
0 0
34
56
7
B
Mea
nho
rmon
ele
vel
1 1
0 1
A01
▶ drugs show no effect▶ either separately or in
combination▶ null hypothesis is true▶ no interaction
Ç. Çöltekin / Informatiekunde Statistics II: Factorial ANOVA April 22, 2014 11 / 34
Class activity Motivation Interaction Factorial ANOVA Example Effect size First lab Summary
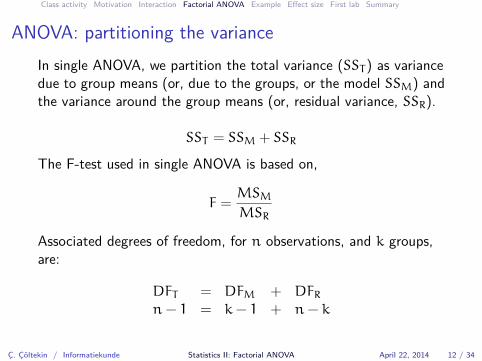
ANOVA: partitioning the varianceIn single ANOVA, we partition the total variance (SST ) as variancedue to group means (or, due to the groups, or the model SSM) andthe variance around the group means (or, residual variance, SSR).
SST = SSM + SSR
The F-test used in single ANOVA is based on,
F =MSM
MSR
Associated degrees of freedom, for n observations, and k groups,are:
DFT = DFM + DFRn− 1 = k− 1 + n− k
Ç. Çöltekin / Informatiekunde Statistics II: Factorial ANOVA April 22, 2014 12 / 34
Class activity Motivation Interaction Factorial ANOVA Example Effect size First lab Summary
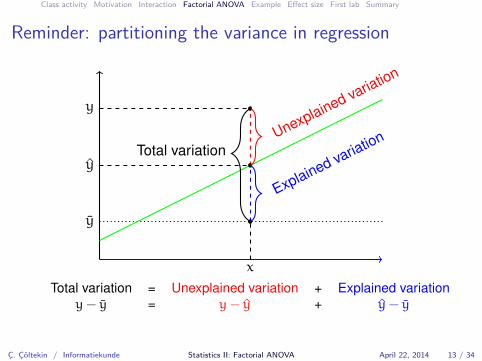
Reminder: partitioning the variance in regression
y
y
y
x
Total variationUnexplained variation
Explained variation
Total variation = Unexplained variation + Explained variationy− y = y− y + y− y
Ç. Çöltekin / Informatiekunde Statistics II: Factorial ANOVA April 22, 2014 13 / 34
Class activity Motivation Interaction Factorial ANOVA Example Effect size First lab Summary
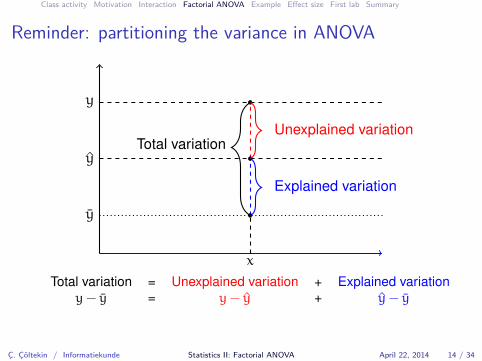
Reminder: partitioning the variance in ANOVA
y
y
y
x
Total variationUnexplained variation
Explained variation
Total variation = Unexplained variation + Explained variationy− y = y− y + y− y
Ç. Çöltekin / Informatiekunde Statistics II: Factorial ANOVA April 22, 2014 14 / 34
Class activity Motivation Interaction Factorial ANOVA Example Effect size First lab Summary
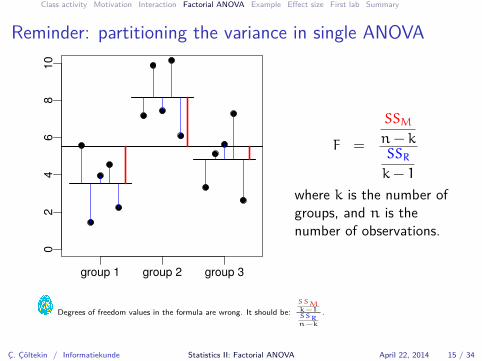
Reminder: partitioning the variance in single ANOVA0
24
68
10
group 1 group 2 group 3
F =
SSM
n− kSSR
k− 1
where k is the number ofgroups, and n is thenumber of observations.
Degrees of freedom values in the formula are wrong. It should be:SSMk−1SSRn−k
.
Ç. Çöltekin / Informatiekunde Statistics II: Factorial ANOVA April 22, 2014 15 / 34
Class activity Motivation Interaction Factorial ANOVA Example Effect size First lab Summary
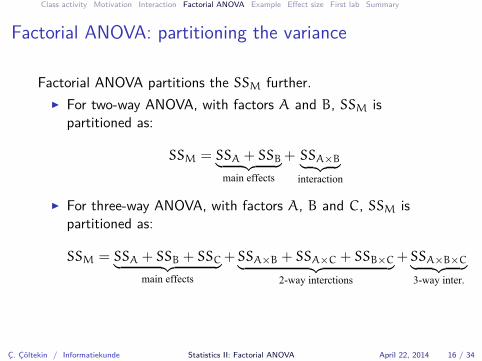
Factorial ANOVA: partitioning the variance
Factorial ANOVA partitions the SSM further.▶ For two-way ANOVA, with factors A and B, SSM is
partitioned as:
SSM = SSA + SSB︸ ︷︷ ︸main effects
+ SSA×B︸ ︷︷ ︸interaction
▶ For three-way ANOVA, with factors A, B and C, SSM ispartitioned as:
SSM = SSA + SSB + SSC︸ ︷︷ ︸main effects
+SSA×B + SSA×C + SSB×C︸ ︷︷ ︸2-way interctions
+SSA×B×C︸ ︷︷ ︸3-way inter.
Ç. Çöltekin / Informatiekunde Statistics II: Factorial ANOVA April 22, 2014 16 / 34
Class activity Motivation Interaction Factorial ANOVA Example Effect size First lab Summary
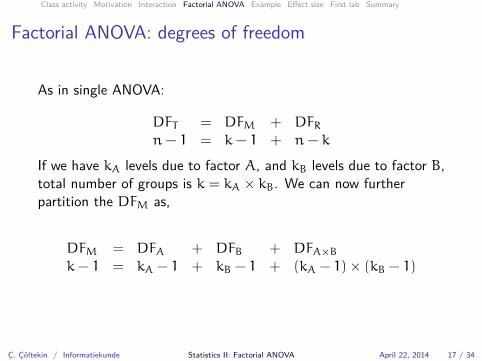
Factorial ANOVA: degrees of freedom
As in single ANOVA:
DFT = DFM + DFRn− 1 = k− 1 + n− k
If we have kA levels due to factor A, and kB levels due to factor B,total number of groups is k = kA × kB. We can now furtherpartition the DFM as,
DFM = DFA + DFB + DFA×B
k− 1 = kA − 1 + kB − 1 + (kA − 1)× (kB − 1)
Ç. Çöltekin / Informatiekunde Statistics II: Factorial ANOVA April 22, 2014 17 / 34
Class activity Motivation Interaction Factorial ANOVA Example Effect size First lab Summary
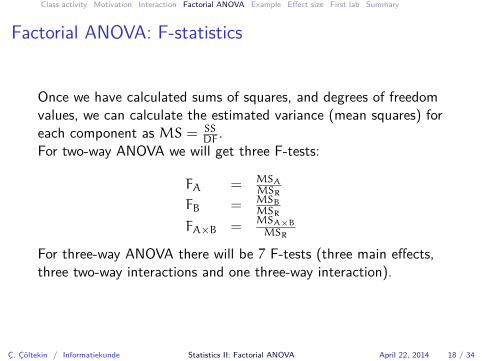
Factorial ANOVA: F-statistics
Once we have calculated sums of squares, and degrees of freedomvalues, we can calculate the estimated variance (mean squares) foreach component as MS = SS
DF.
For two-way ANOVA we will get three F-tests:
FA = MSAMSR
FB = MSBMSR
FA×B =MSA×B
MSR
For three-way ANOVA there will be 7 F-tests (three main effects,three two-way interactions and one three-way interaction).
Ç. Çöltekin / Informatiekunde Statistics II: Factorial ANOVA April 22, 2014 18 / 34
Class activity Motivation Interaction Factorial ANOVA Example Effect size First lab Summary
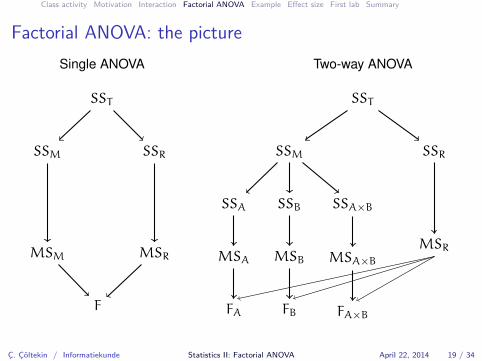
Factorial ANOVA: the picture
SST
SSM SSR
MSRMSM
F
Single ANOVA
SST
SSM SSR
MSR
SSA×BSSBSSA
MSA MSB MSA×B
FA FB FA×B
Two-way ANOVA
Ç. Çöltekin / Informatiekunde Statistics II: Factorial ANOVA April 22, 2014 19 / 34
Class activity Motivation Interaction Factorial ANOVA Example Effect size First lab Summary
Factorial ANOVA: an example
We return to our ‘web design’ example.▶ We have two new web page designs.▶ We also want know the effect of dark or light background.▶ This is a two-way ANOVA with two levels at each dimension:
commonly called 2×2 (experiment) design.▶ If we also wanted to know the effect of age (young, middle
aged, old), we would do a three-way, 2×2×3, ANOVA.
Ç. Çöltekin / Informatiekunde Statistics II: Factorial ANOVA April 22, 2014 20 / 34
Class activity Motivation Interaction Factorial ANOVA Example Effect size First lab Summary
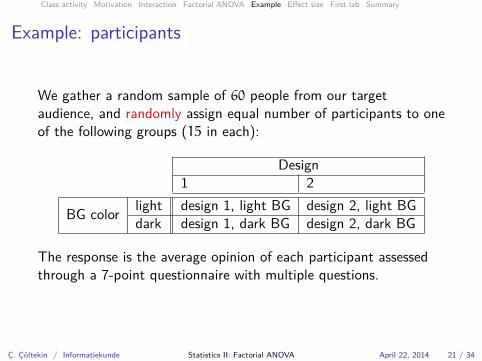
Example: participants
We gather a random sample of 60 people from our targetaudience, and randomly assign equal number of participants to oneof the following groups (15 in each):
Design1 2
BG color light design 1, light BG design 2, light BGdark design 1, dark BG design 2, dark BG
The response is the average opinion of each participant assessedthrough a 7-point questionnaire with multiple questions.
Ç. Çöltekin / Informatiekunde Statistics II: Factorial ANOVA April 22, 2014 21 / 34
Class activity Motivation Interaction Factorial ANOVA Example Effect size First lab Summary
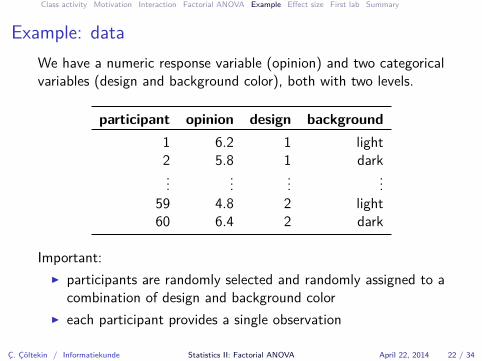
Example: dataWe have a numeric response variable (opinion) and two categoricalvariables (design and background color), both with two levels.
participant opinion design background1 6.2 1 light2 5.8 1 dark... ... ... ...
59 4.8 2 light60 6.4 2 dark
Important:▶ participants are randomly selected and randomly assigned to a
combination of design and background color▶ each participant provides a single observation
Ç. Çöltekin / Informatiekunde Statistics II: Factorial ANOVA April 22, 2014 22 / 34
Class activity Motivation Interaction Factorial ANOVA Example Effect size First lab Summary
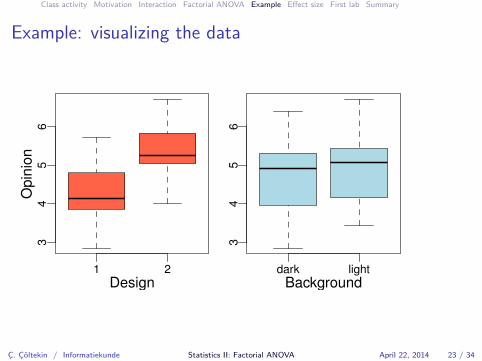
Example: visualizing the data
1 2
34
56
Design
Opi
nion
dark light
34
56
Background
Ç. Çöltekin / Informatiekunde Statistics II: Factorial ANOVA April 22, 2014 23 / 34
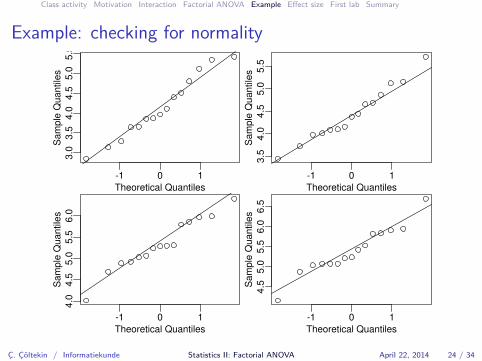
Class activity Motivation Interaction Factorial ANOVA Example Effect size First lab Summary
Example: checking for normality
-1 0 1
3.0
3.5
4.0
4.5
5.0
5.5
Theoretical Quantiles
Sam
ple
Qua
ntile
s
-1 0 1
3.5
4.0
4.5
5.0
5.5
Theoretical Quantiles
Sam
ple
Qua
ntile
s
-1 0 1
4.0
4.5
5.0
5.5
6.0
Theoretical Quantiles
Sam
ple
Qua
ntile
s
-1 0 1
4.5
5.0
5.5
6.0
6.5
Theoretical Quantiles
Sam
ple
Qua
ntile
s
Ç. Çöltekin / Informatiekunde Statistics II: Factorial ANOVA April 22, 2014 24 / 34
Class activity Motivation Interaction Factorial ANOVA Example Effect size First lab Summary
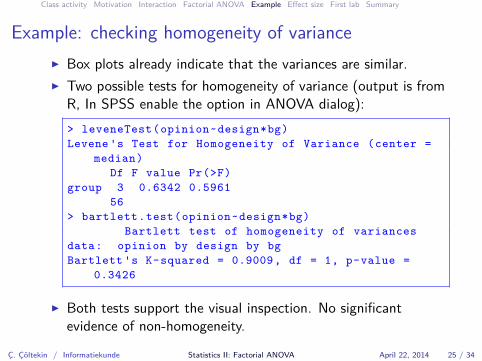
Example: checking homogeneity of variance▶ Box plots already indicate that the variances are similar.▶ Two possible tests for homogeneity of variance (output is from
R, In SPSS enable the option in ANOVA dialog):> leveneTest(opinion~design*bg)Levene's Test for Homogeneity of Variance (center =
median)Df F value Pr(>F)
group 3 0.6342 0.596156
> bartlett.test(opinion~design*bg)Bartlett test of homogeneity of variances
data: opinion by design by bgBartlett's K-squared = 0.9009, df = 1, p-value =
0.3426
▶ Both tests support the visual inspection. No significantevidence of non-homogeneity.
Ç. Çöltekin / Informatiekunde Statistics II: Factorial ANOVA April 22, 2014 25 / 34
Class activity Motivation Interaction Factorial ANOVA Example Effect size First lab Summary
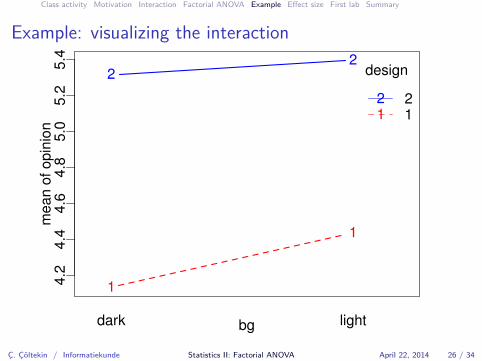
Example: visualizing the interaction
1
1
4.2
4.4
4.6
4.8
5.0
5.2
5.4
bg
mea
nof
opin
ion
22
dark light
design
21
21
Ç. Çöltekin / Informatiekunde Statistics II: Factorial ANOVA April 22, 2014 26 / 34
Class activity Motivation Interaction Factorial ANOVA Example Effect size First lab Summary
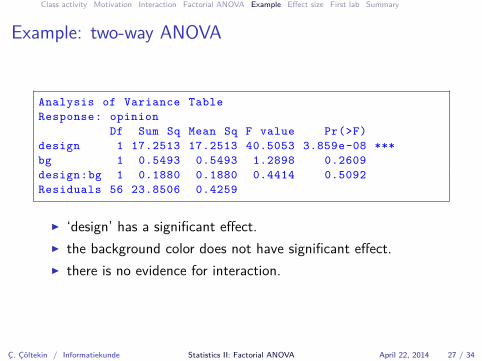
Example: two-way ANOVA
Analysis of Variance TableResponse: opinion
Df Sum Sq Mean Sq F value Pr(>F)design 1 17.2513 17.2513 40.5053 3.859e-08 ***bg 1 0.5493 0.5493 1.2898 0.2609design:bg 1 0.1880 0.1880 0.4414 0.5092Residuals 56 23.8506 0.4259
▶ ‘design’ has a significant effect.▶ the background color does not have significant effect.▶ there is no evidence for interaction.
Ç. Çöltekin / Informatiekunde Statistics II: Factorial ANOVA April 22, 2014 27 / 34
Class activity Motivation Interaction Factorial ANOVA Example Effect size First lab Summary
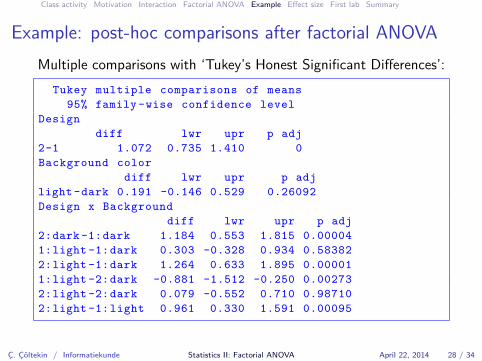
Example: post-hoc comparisons after factorial ANOVAMultiple comparisons with ‘Tukey’s Honest Significant Differences’:
Tukey multiple comparisons of means95% family-wise confidence level
Designdiff lwr upr p adj
2-1 1.072 0.735 1.410 0Background color
diff lwr upr p adjlight-dark 0.191 -0.146 0.529 0.26092Design x Background
diff lwr upr p adj2:dark-1:dark 1.184 0.553 1.815 0.000041:light -1:dark 0.303 -0.328 0.934 0.583822:light -1:dark 1.264 0.633 1.895 0.000011:light -2:dark -0.881 -1.512 -0.250 0.002732:light -2:dark 0.079 -0.552 0.710 0.987102:light -1:light 0.961 0.330 1.591 0.00095
Ç. Çöltekin / Informatiekunde Statistics II: Factorial ANOVA April 22, 2014 28 / 34
Class activity Motivation Interaction Factorial ANOVA Example Effect size First lab Summary
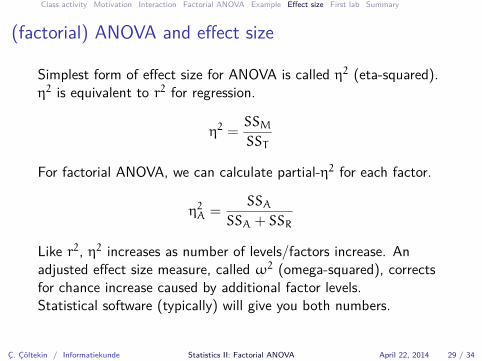
(factorial) ANOVA and effect size
Simplest form of effect size for ANOVA is called η2 (eta-squared).η2 is equivalent to r2 for regression.
η2 =SSM
SST
For factorial ANOVA, we can calculate partial-η2 for each factor.
η2A =SSA
SSA + SSR
Like r2, η2 increases as number of levels/factors increase. Anadjusted effect size measure, called ω2 (omega-squared), correctsfor chance increase caused by additional factor levels.Statistical software (typically) will give you both numbers.
Ç. Çöltekin / Informatiekunde Statistics II: Factorial ANOVA April 22, 2014 29 / 34
Class activity Motivation Interaction Factorial ANOVA Example Effect size First lab Summary
(factorial) ANOVA and effect size (2)
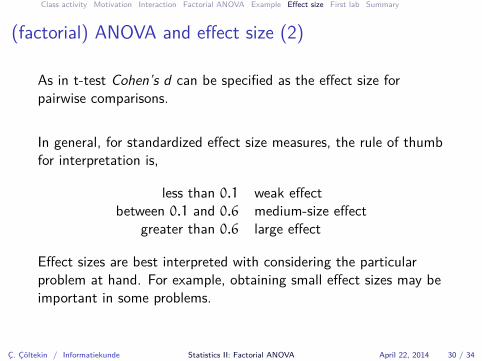
As in t-test Cohen’s d can be specified as the effect size forpairwise comparisons.
In general, for standardized effect size measures, the rule of thumbfor interpretation is,
less than 0.1 weak effectbetween 0.1 and 0.6 medium-size effect
greater than 0.6 large effect
Effect sizes are best interpreted with considering the particularproblem at hand. For example, obtaining small effect sizes may beimportant in some problems.
Ç. Çöltekin / Informatiekunde Statistics II: Factorial ANOVA April 22, 2014 30 / 34
Class activity Motivation Interaction Factorial ANOVA Example Effect size First lab Summary
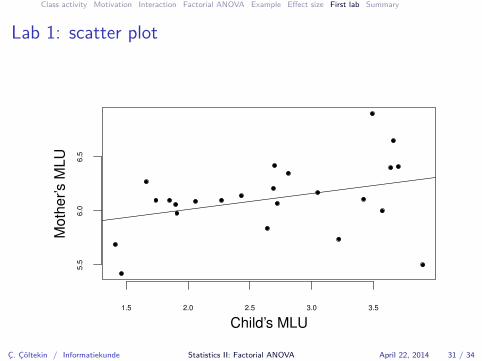
Lab 1: scatter plot
1.5 2.0 2.5 3.0 3.5
5.5
6.0
6.5
Child’s MLU
Mot
her’s
MLU
Ç. Çöltekin / Informatiekunde Statistics II: Factorial ANOVA April 22, 2014 31 / 34
Class activity Motivation Interaction Factorial ANOVA Example Effect size First lab Summary
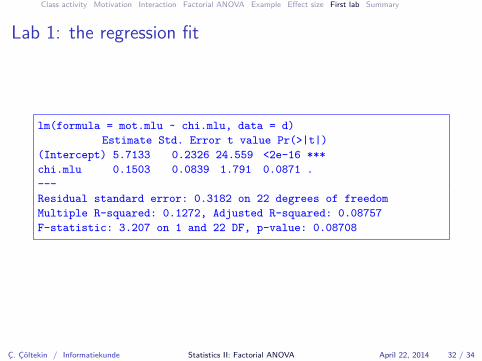
Lab 1: the regression fit
lm(formula = mot.mlu ~ chi.mlu, data = d)Estimate Std. Error t value Pr(>|t|)
(Intercept) 5.7133 0.2326 24.559 <2e-16 ***chi.mlu 0.1503 0.0839 1.791 0.0871 .---Residual standard error: 0.3182 on 22 degrees of freedomMultiple R-squared: 0.1272, Adjusted R-squared: 0.08757F-statistic: 3.207 on 1 and 22 DF, p-value: 0.08708
Ç. Çöltekin / Informatiekunde Statistics II: Factorial ANOVA April 22, 2014 32 / 34
Class activity Motivation Interaction Factorial ANOVA Example Effect size First lab Summary
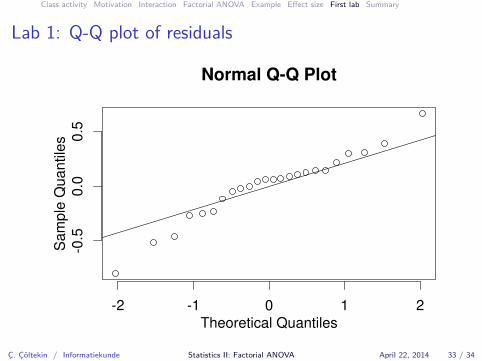
Lab 1: Q-Q plot of residuals
-2 -1 0 1 2
-0.5
0.0
0.5
Normal Q-Q Plot
Theoretical Quantiles
Sam
ple
Qua
ntile
s
Ç. Çöltekin / Informatiekunde Statistics II: Factorial ANOVA April 22, 2014 33 / 34
Class activity Motivation Interaction Factorial ANOVA Example Effect size First lab Summary
Factorial ANOVA: summary
▶ Factorial ANOVA is a generalization of single ANOVA (ort-test).
▶ Compare groups along more than one dimension.▶ Assumptions: the response variable in all groups
▶ is (approximately) normally distributed▶ have (approximately) equal variances
▶ Efficient in use of subjects.▶ Allows to investigate interaction.
Next week: Repeated-measures ANOVA. Reading: 19.1–19.5 (3e),20.1–20.5 (4e).
Ç. Çöltekin / Informatiekunde Statistics II: Factorial ANOVA April 22, 2014 34 / 34
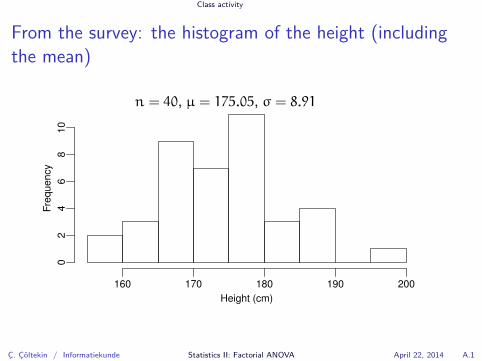
Class activity
From the survey: the histogram of the height (includingthe mean)
Height (cm)
Freq
uenc
y
160 170 180 190 200
02
46
810
n = 40, µ = 175.05, σ = 8.91
Ç. Çöltekin / Informatiekunde Statistics II: Factorial ANOVA April 22, 2014 A.1
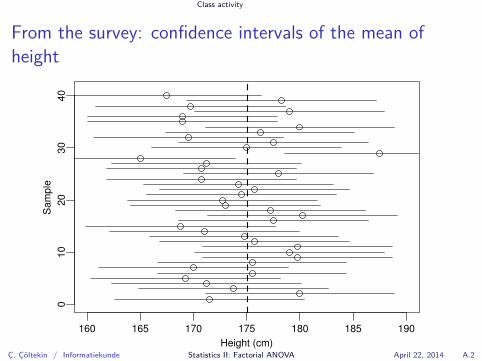
Class activity
From the survey: confidence intervals of the mean ofheight
160 165 170 175 180 185 190
010
2030
40
Height (cm)
Sam
ple
Ç. Çöltekin / Informatiekunde Statistics II: Factorial ANOVA April 22, 2014 A.2