Statistics: For what, for who? Basics: Mean, Median, Mode
32
Statistics: For what, for who? Basics: Mean, Median, Mode
-
Upload
kalinda-kapoor -
Category
Documents
-
view
35 -
download
0
description
Statistics: For what, for who? Basics: Mean, Median, Mode. Where:. Σ is Sigma
Transcript of Statistics: For what, for who? Basics: Mean, Median, Mode
Statistics:
For what, for who?
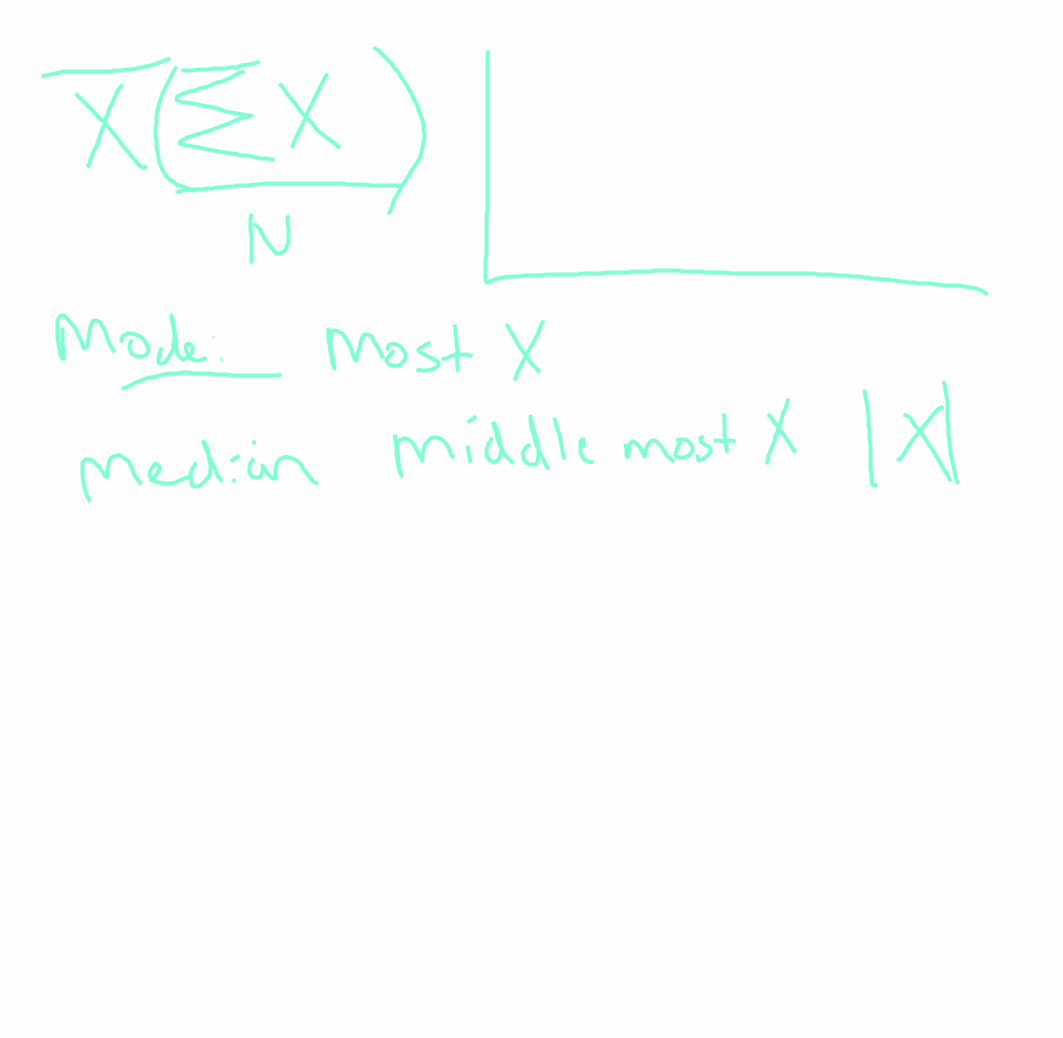
Basics: Mean, Median, Mode
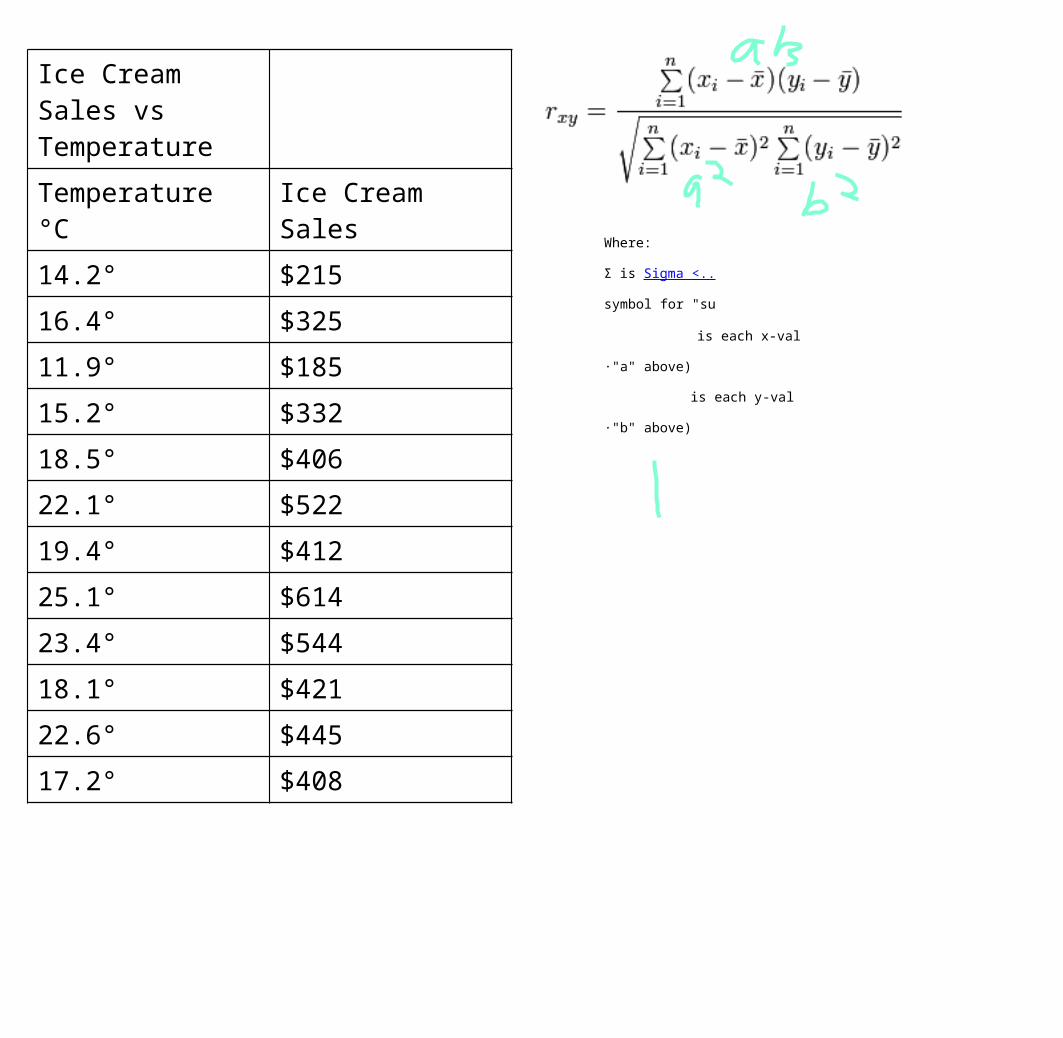
Ice Cream Sales vs Temperature
Temperature °C Ice Cream Sales
14.2° $215
16.4° $325
11.9° $185
15.2° $332
18.5° $406
22.1° $522
19.4° $412
25.1° $614
23.4° $544
18.1° $421
22.6° $445
17.2° $408
Where:
Σ is Sigma <..
symbol for "su
is each x-val
·"a" above)
is each y-val
·"b" above)
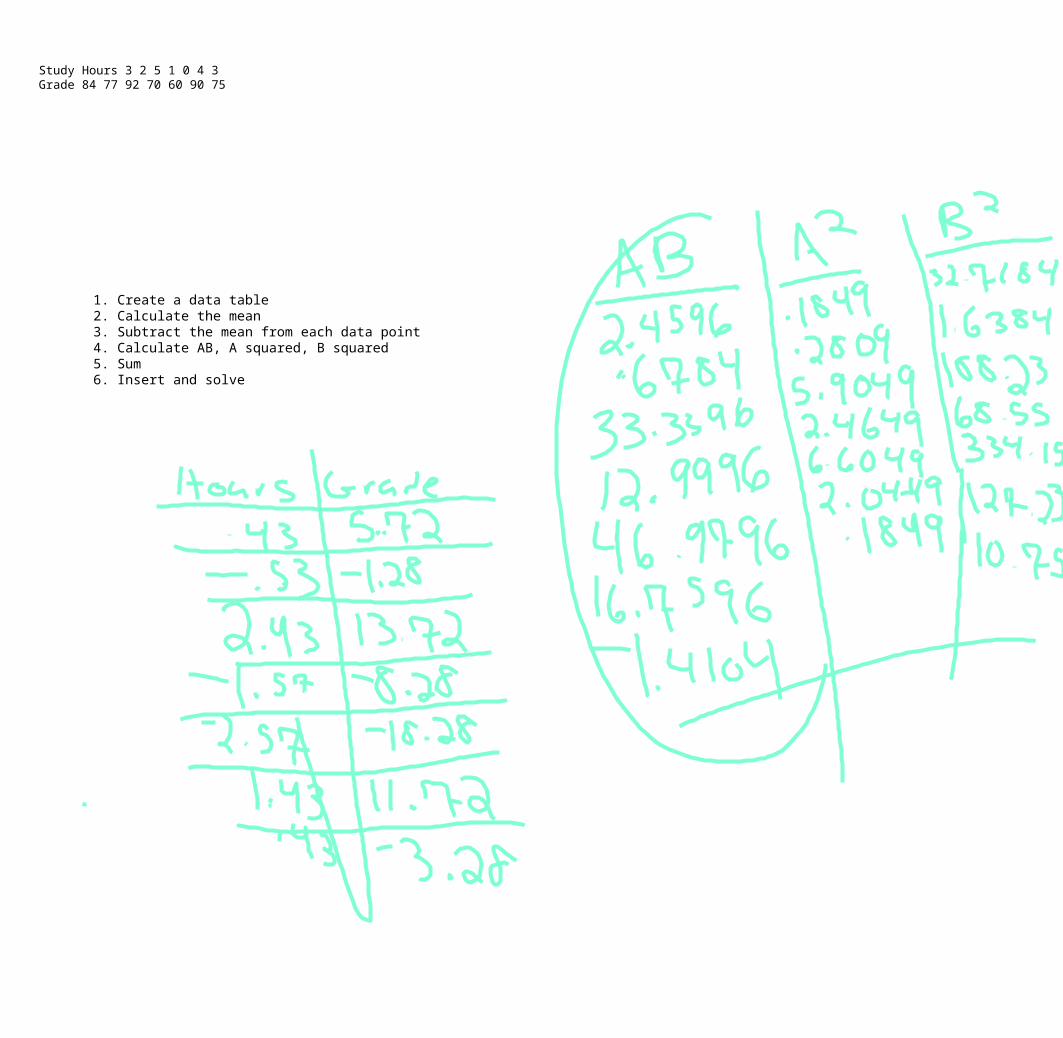
Study Hours 3 2 5 1 0 4 3Grade 84 77 92 70 60 90 75
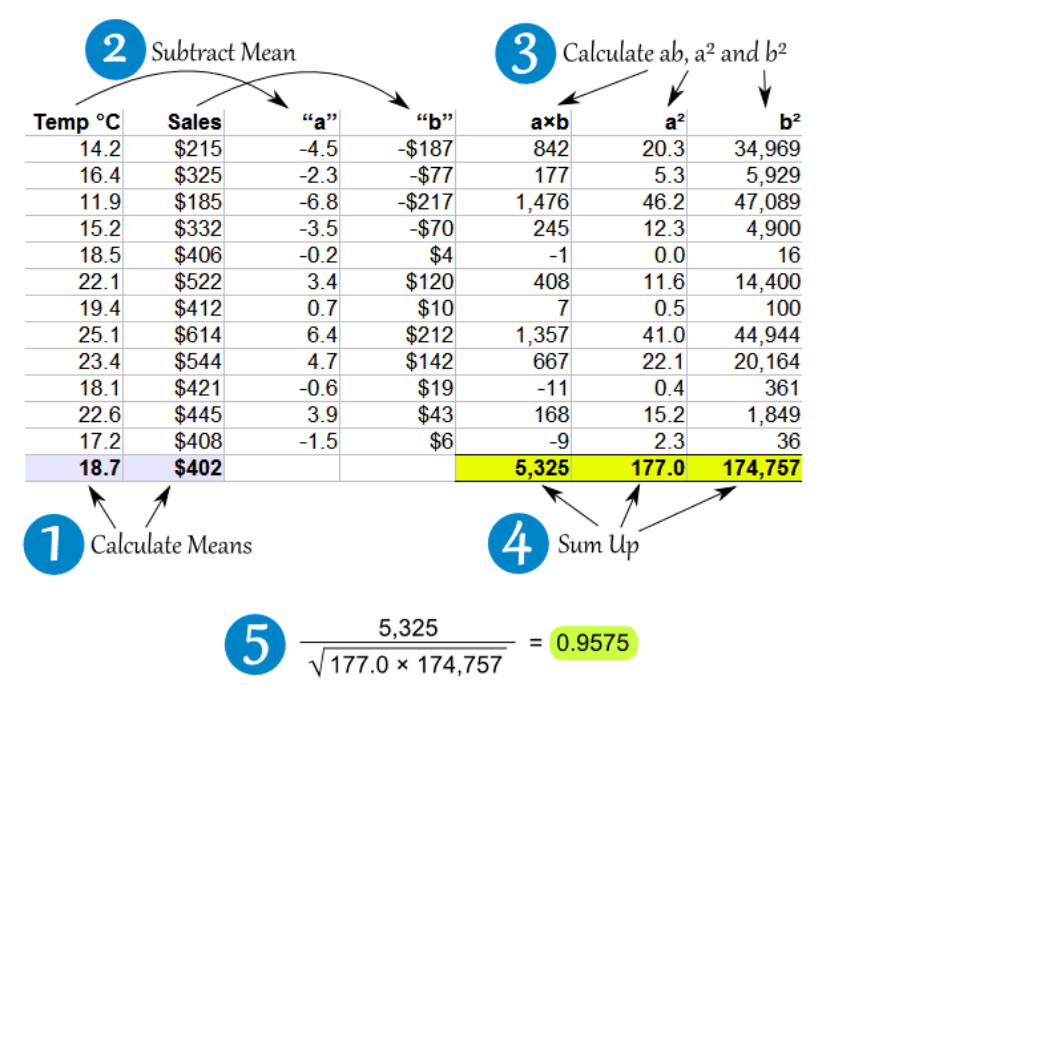
1. Create a data table2. Calculate the mean3. Subtract the mean from each data point4. Calculate AB, A squared, B squared5. Sum6. Insert and solve
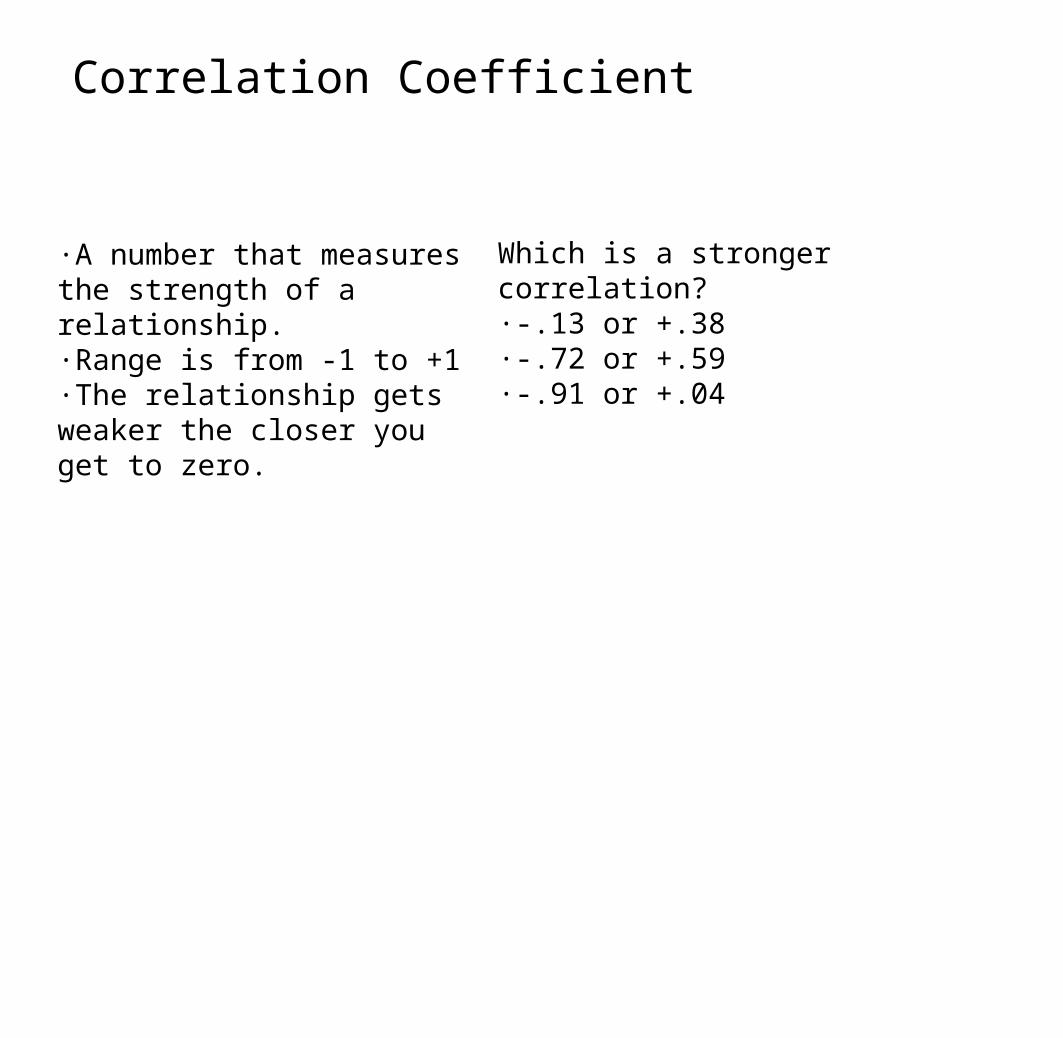
Correlation Coefficient
·A number that measures the strength of a relationship.·Range is from -1 to +1·The relationship gets weaker the closer you get to zero.
Which is a stronger correlation?·-.13 or +.38·-.72 or +.59·-.91 or +.04
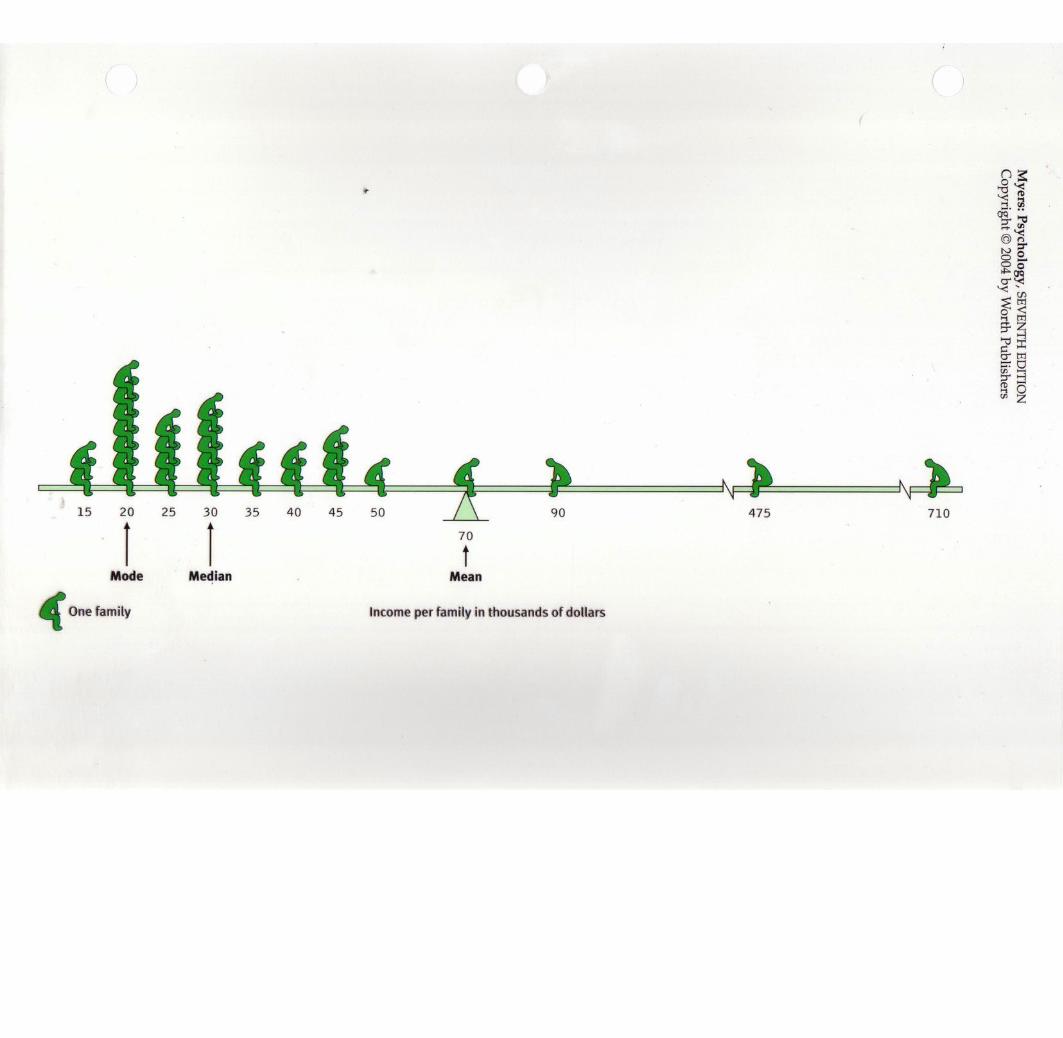

·Mean, Median and Mode.Watch out for extreme scores or outliers
The median salary looks good at $100,000.The mean salary also looks good at about $110,000.But the mode salary is only $25,000.Maybe not the best place to work.Then again living in Scranton is kind of cheap.

·Range – the difference between the highest and lowest scores in a distribution·Standard Deviation – A computed measure of how much scores vary around the mean score·Statistical Significance – A statistical statement of how likely it is that an obtained result occurred by chance
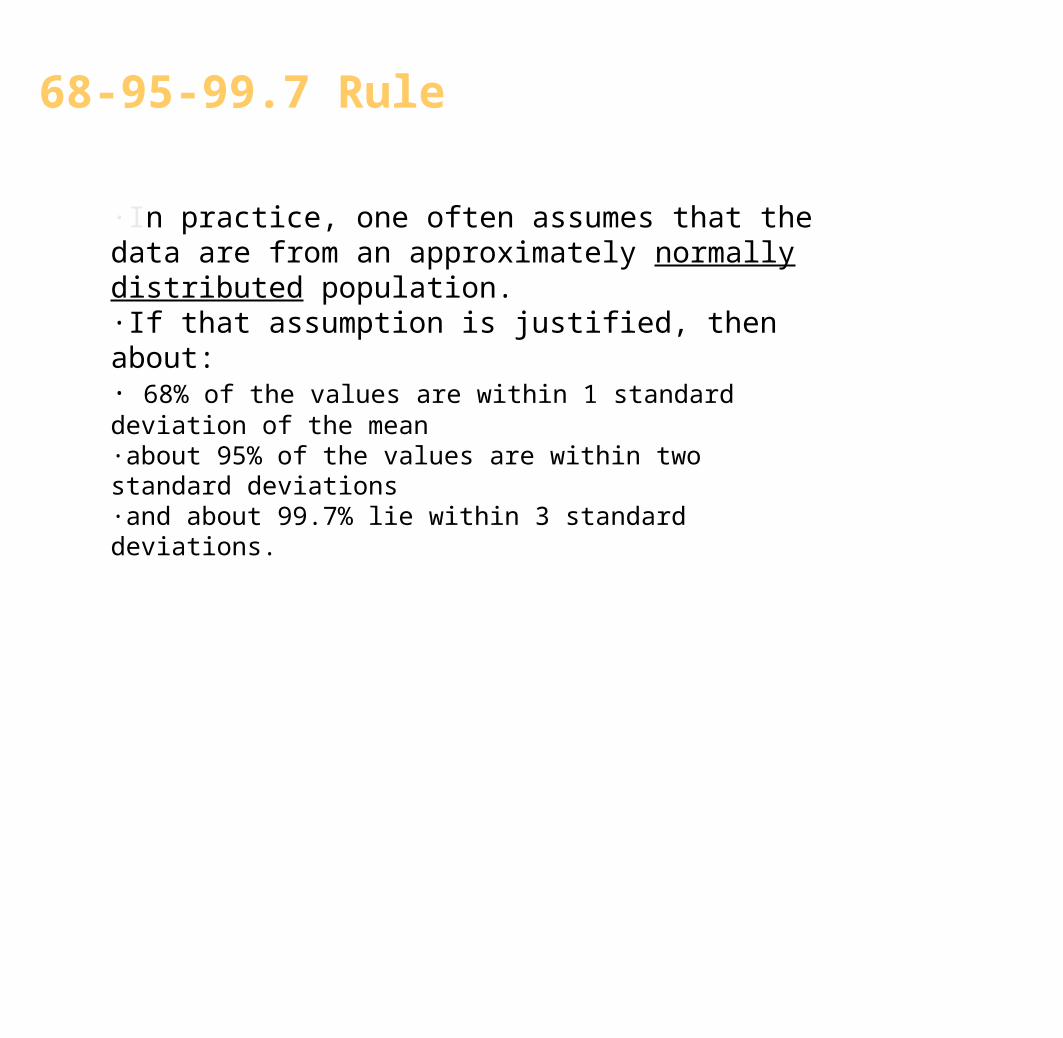
68-95-99.7 Rule
·In practice, one often assumes that the data are from an approximately normally distributed population. ·If that assumption is justified, then about:· 68% of the values are within 1 standard deviation of the mean·about 95% of the values are within two standard deviations·and about 99.7% lie within 3 standard deviations.
The student will be able to:
· find the variance of a data set.
find the standard deviation of a data set
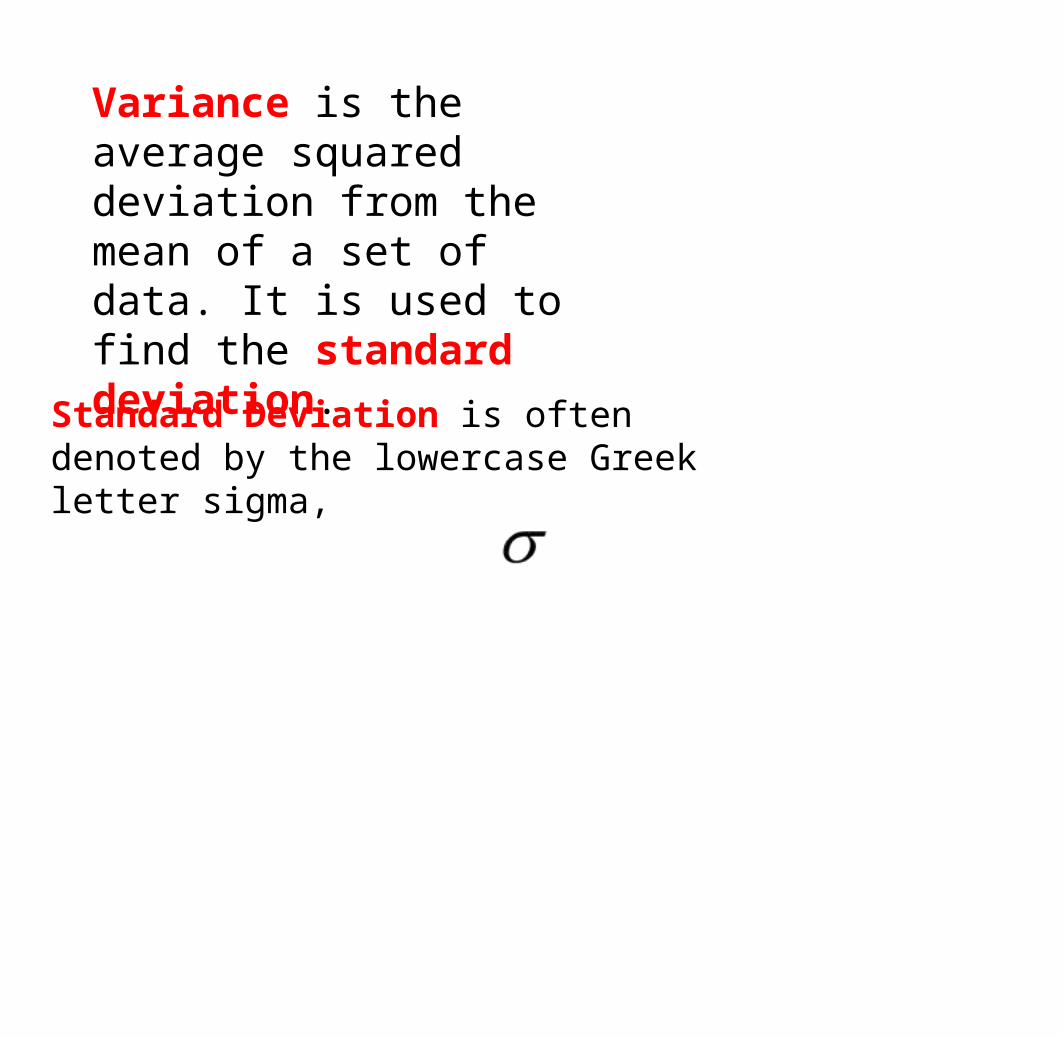
Variance is the average squared deviation from the mean of a set of data. It is used to find the standard deviation.
Standard Deviation is often denoted by the lowercase Greek letter sigma,
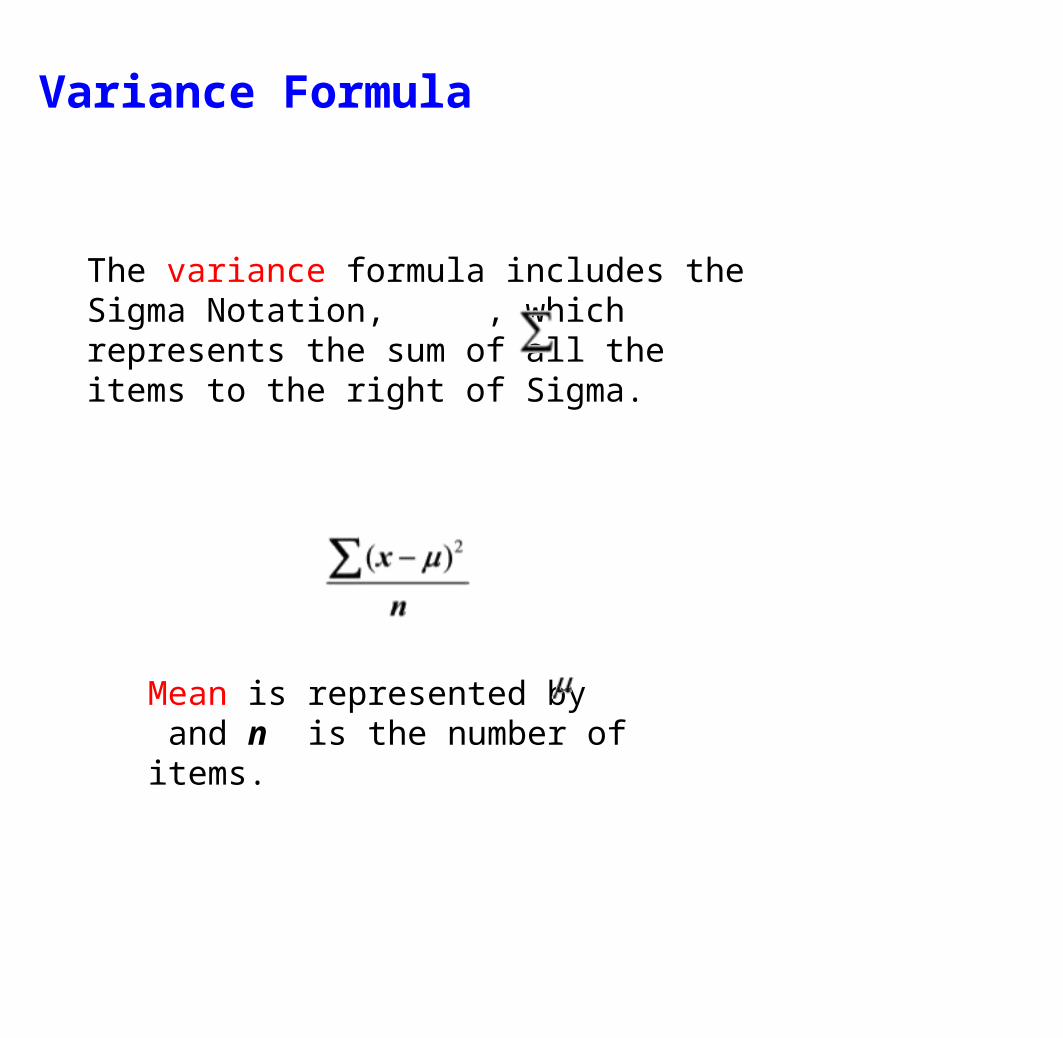
Variance Formula
The variance formula includes the Sigma Notation, , which represents the sum of all the items to the right of Sigma.
Mean is represented by and n is the number of items.
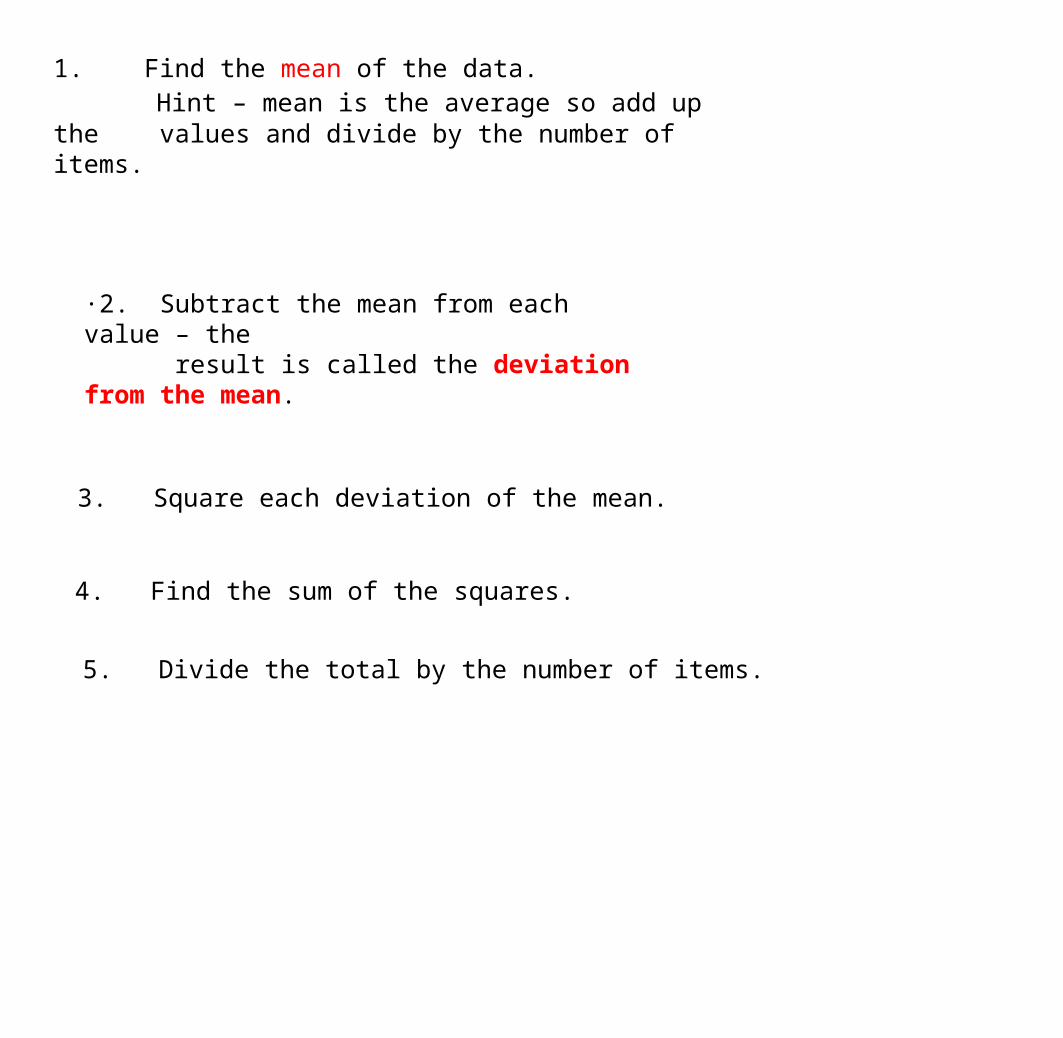
1. Find the mean of the data. Hint – mean is the average so add up the values and divide by the number of items.
·2. Subtract the mean from each value – the result is called the deviation from the mean.
3. Square each deviation of the mean.
4. Find the sum of the squares.
5. Divide the total by the number of items.
Standard Deviation shows the variation in data. If the data is close together, the standard deviation will be small. If the data is spread out, the standard deviation will be large.
Standard Deviation is often denoted by the lowercase Greek letter sigma, .

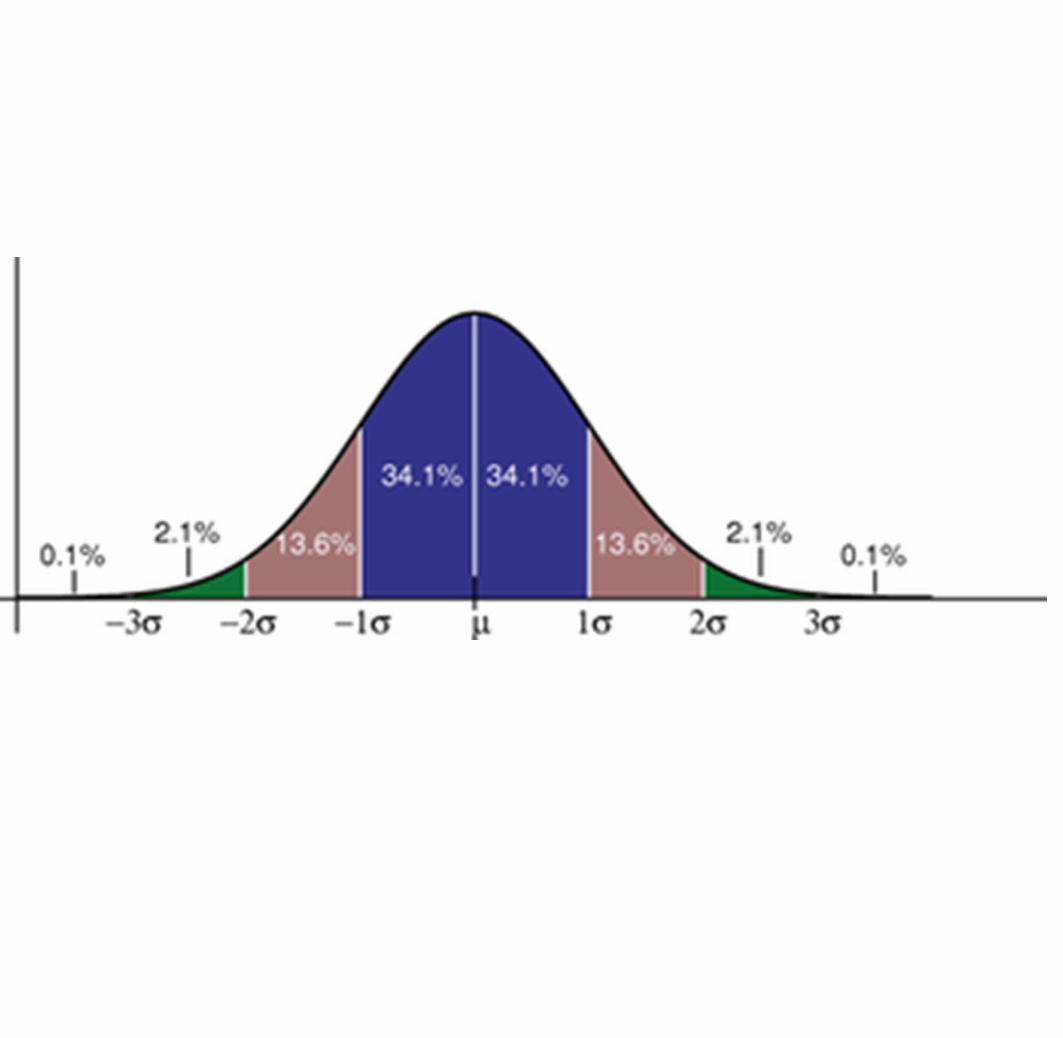
The bell curve which represents a normal distribution of data shows what standard deviation represents.
One standard deviation away from the mean ( ) in either direction on the horizontal axis accounts for around 68 percent of the data. Two standard deviations away from the mean accounts for roughly 95 percent of the data with three standard deviations representing about 99 percent of the data.
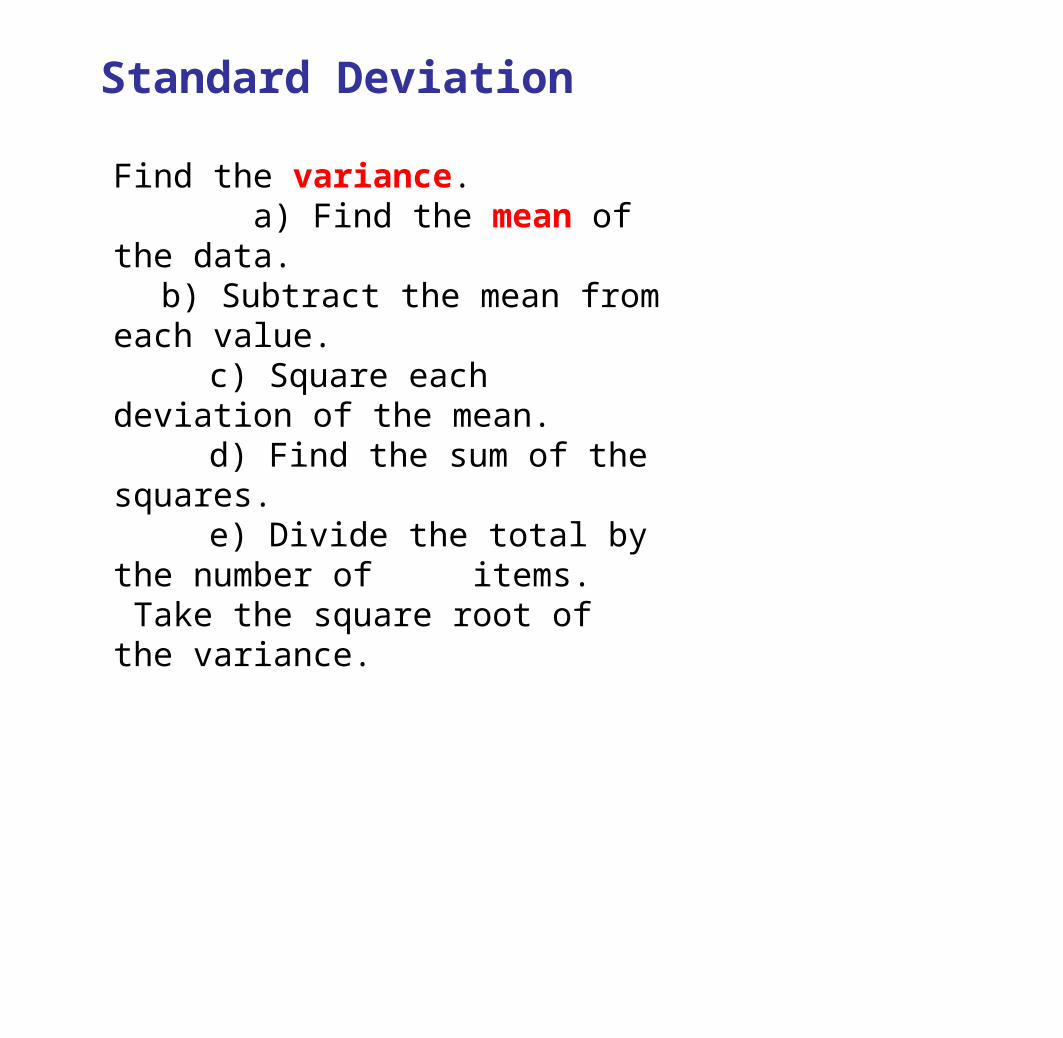
Find the variance. a) Find the mean of the data.
b) Subtract the mean from each value. c) Square each deviation of the mean. d) Find the sum of the squares. e) Divide the total by the number of items. Take the square root of the variance.
Standard Deviation
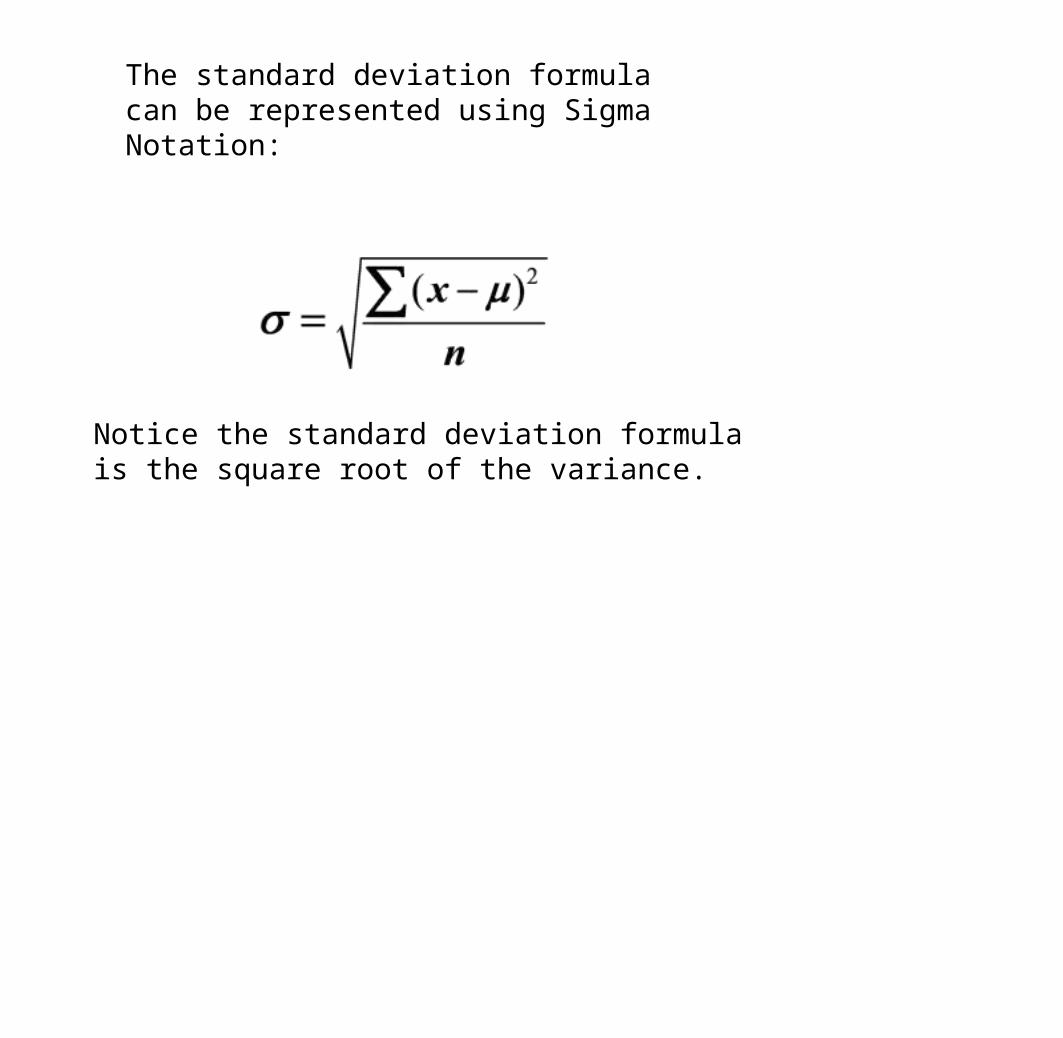
The standard deviation formula can be represented using Sigma Notation:
Notice the standard deviation formula is the square root of the variance.
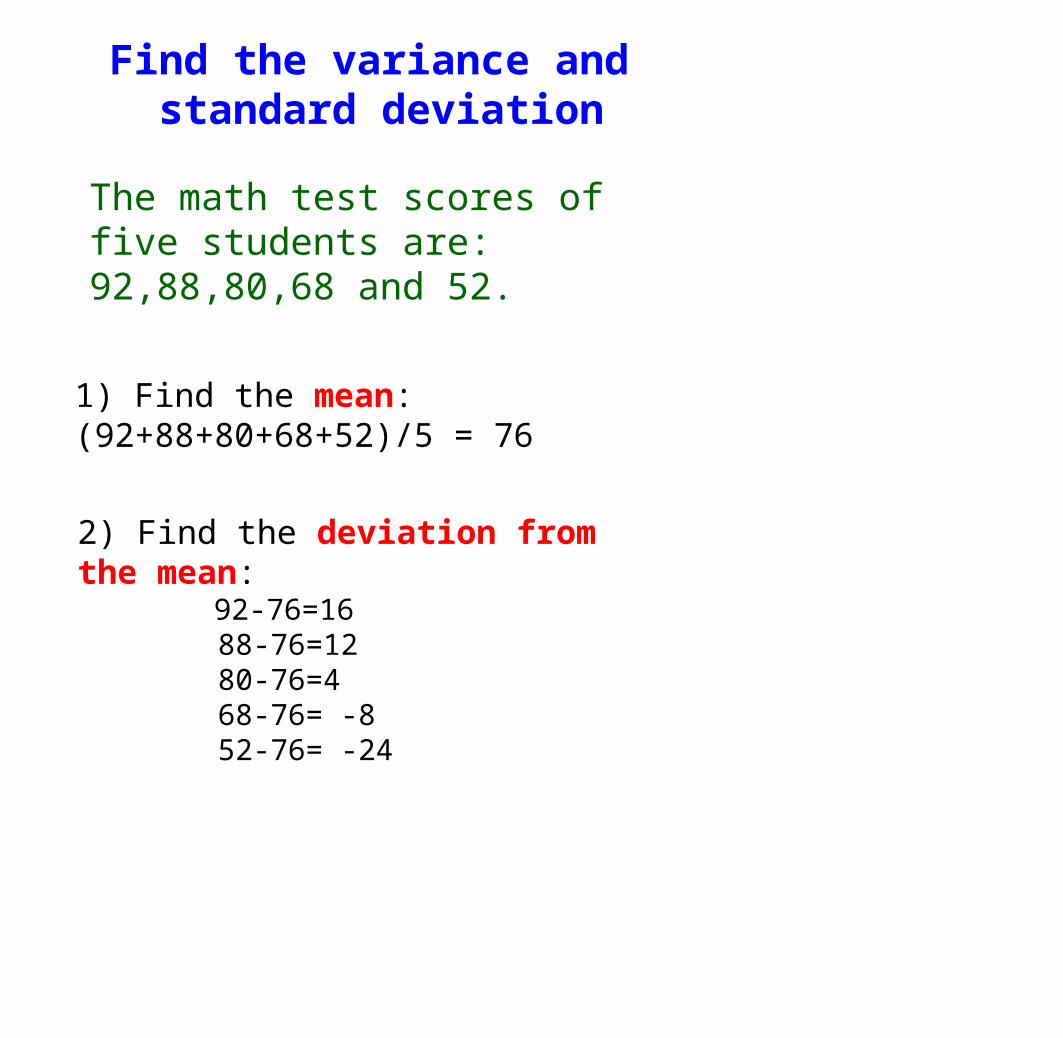
Find the variance and standard deviation
The math test scores of five students are: 92,88,80,68 and 52.
1) Find the mean: (92+88+80+68+52)/5 = 76
2) Find the deviation from the mean: 92-76=16 88-76=12 80-76=4 68-76= -8 52-76= -24
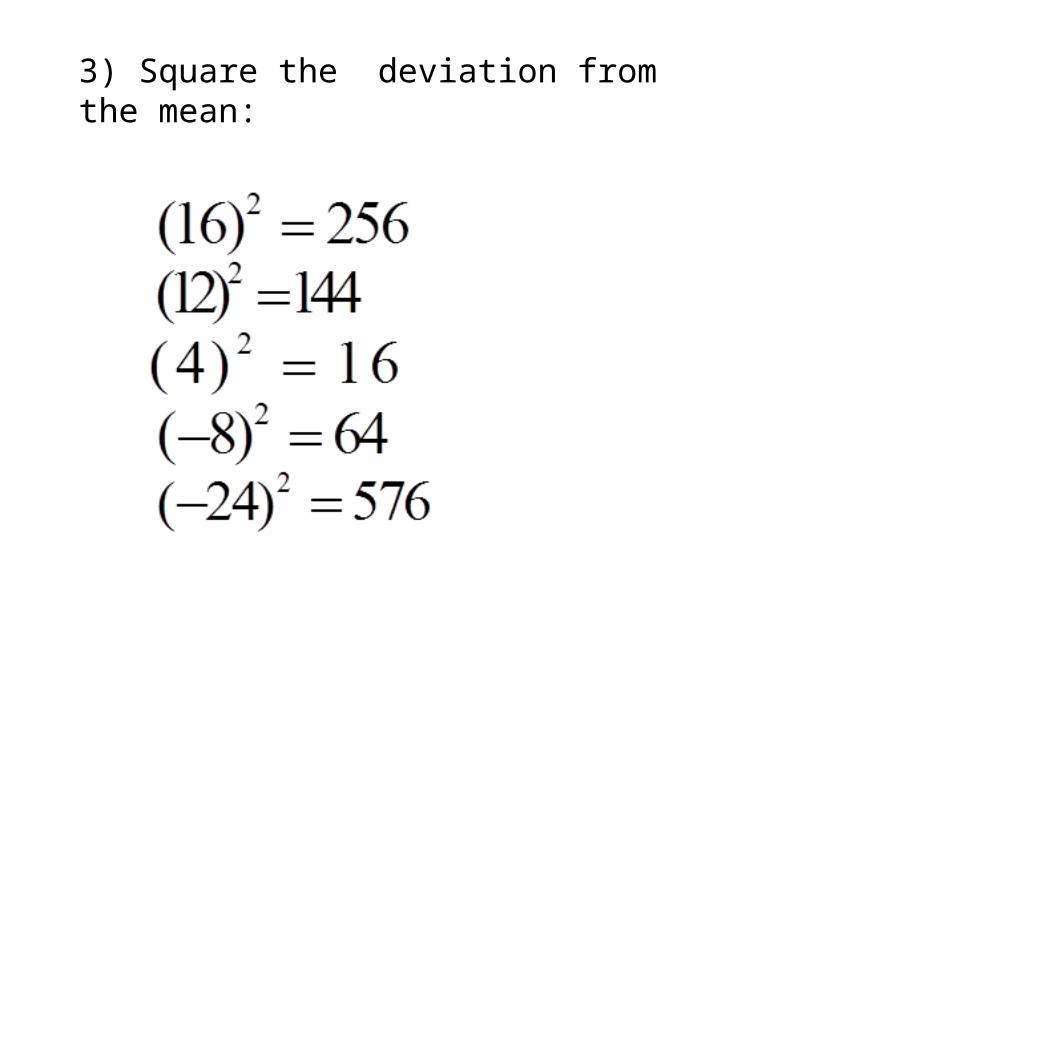
3) Square the deviation from the mean:
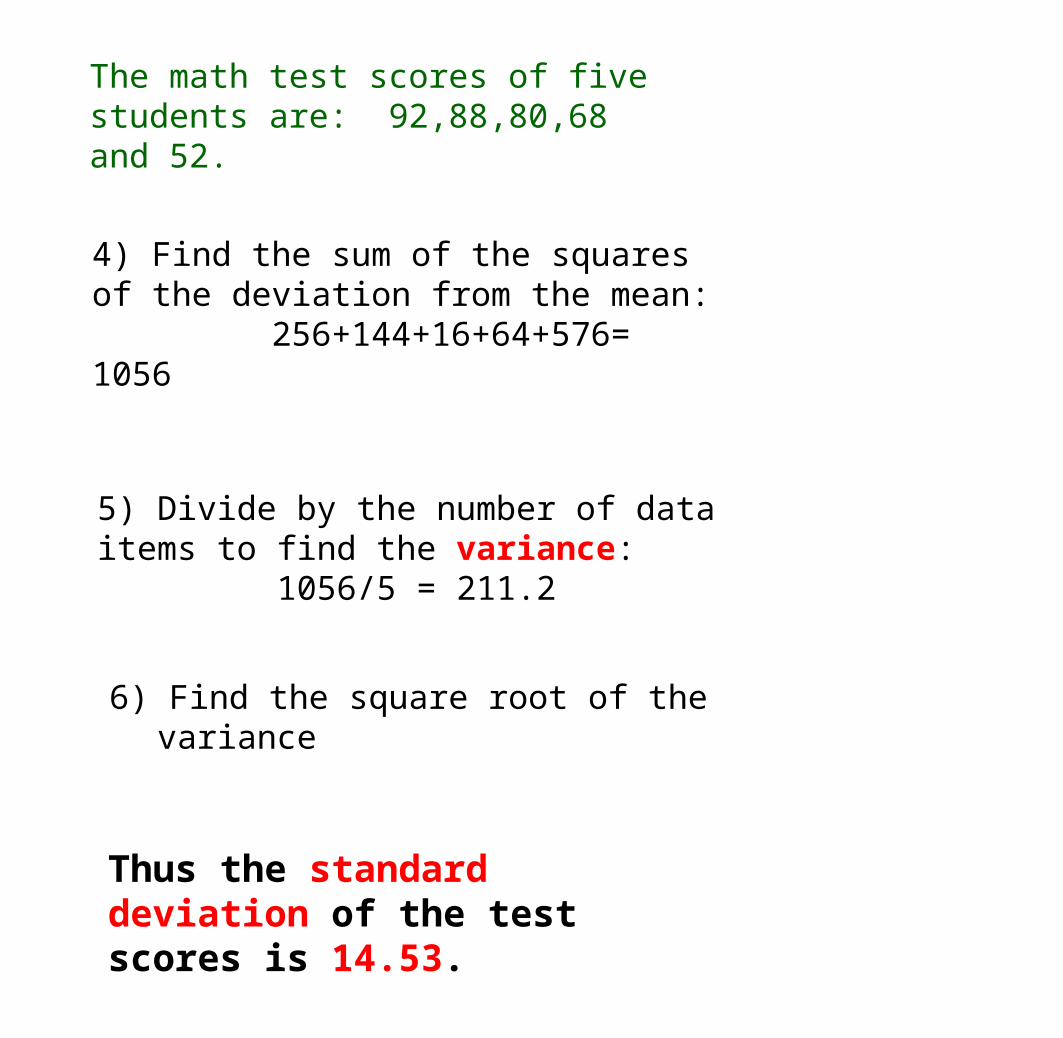
The math test scores of five students are: 92,88,80,68 and 52.
4) Find the sum of the squares of the deviation from the mean: 256+144+16+64+576= 1056
5) Divide by the number of data items to find the variance: 1056/5 = 211.2
6) Find the square root of the variance
Thus the standard deviation of the test scores is 14.53.
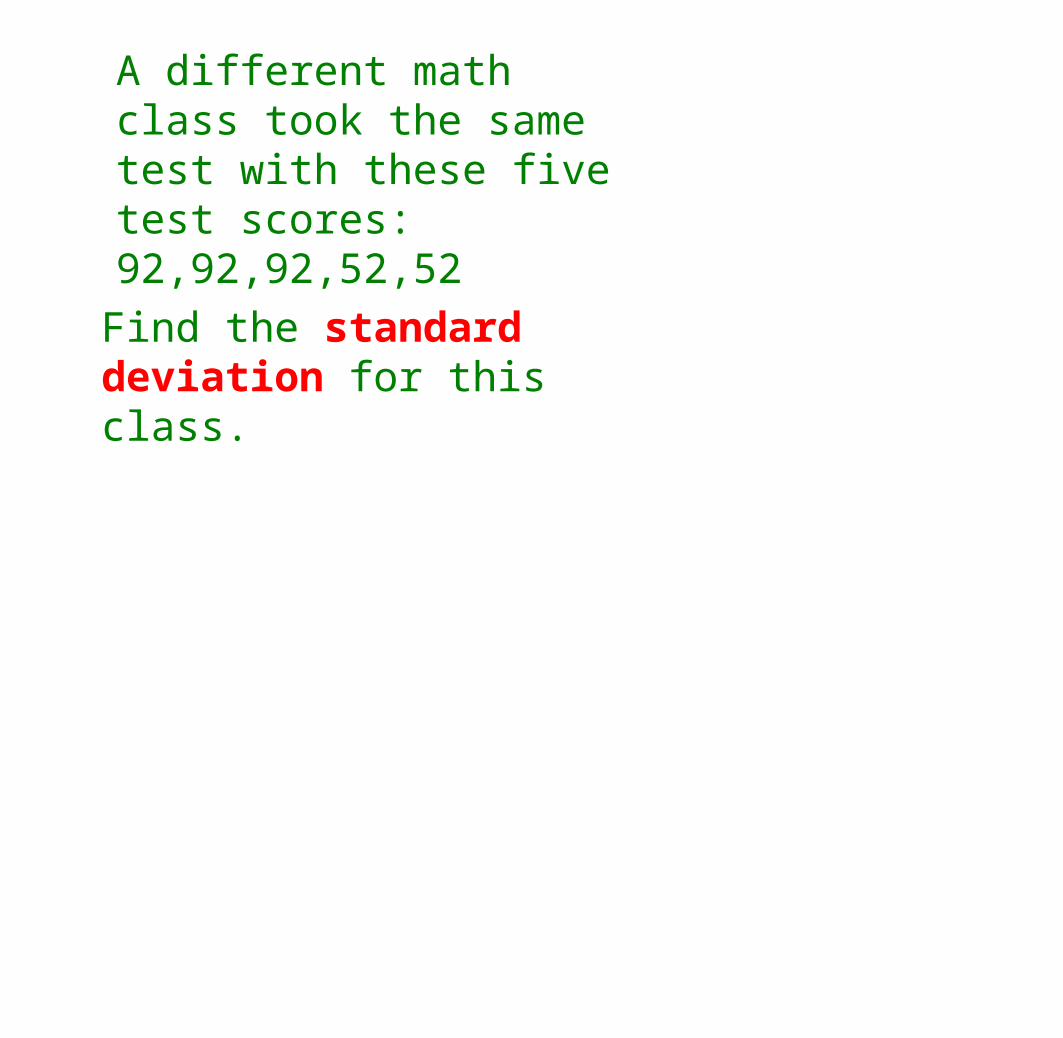
A different math class took the same test with these five test scores: 92,92,92,52,52
Find the standard deviation for this class.
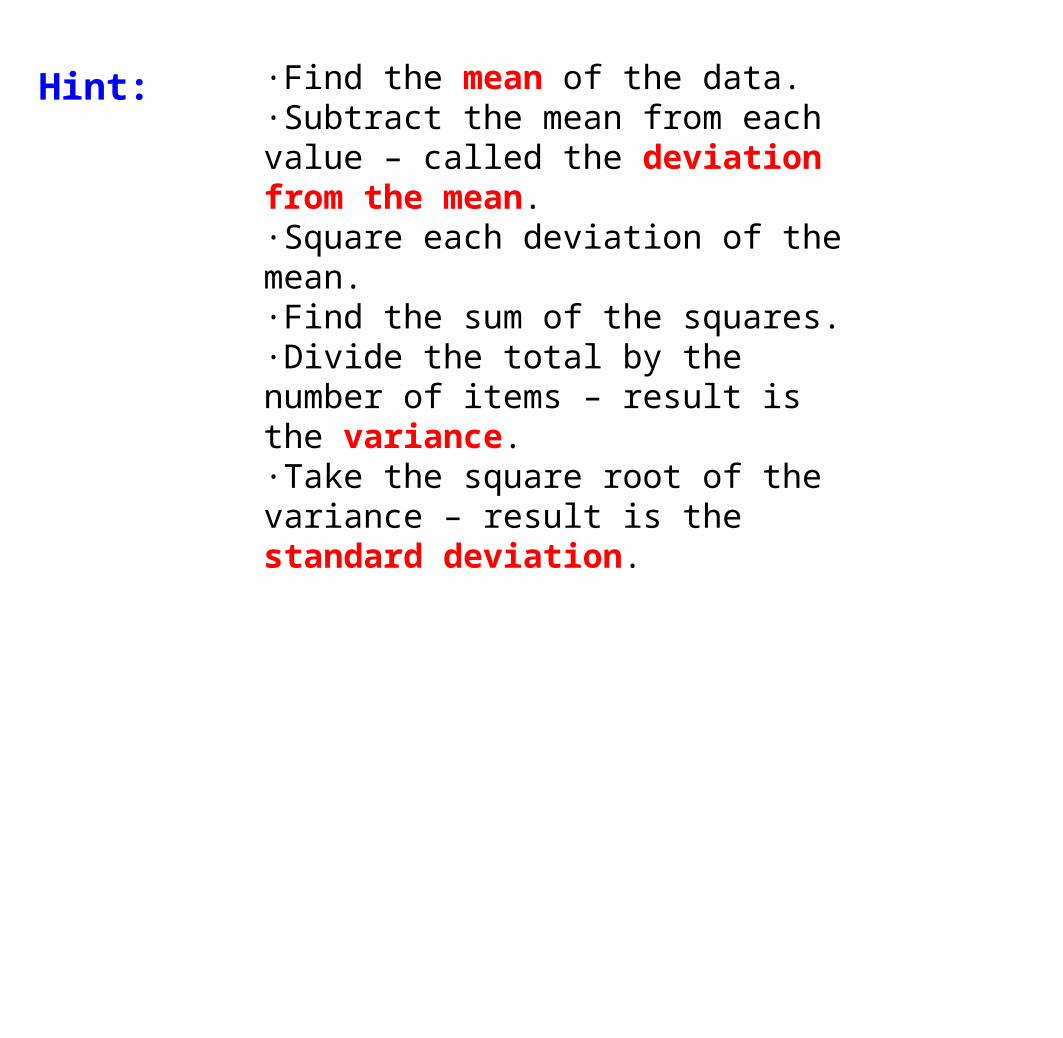
Hint: ·Find the mean of the data.·Subtract the mean from each value – called the deviation from the mean.·Square each deviation of the mean.·Find the sum of the squares.·Divide the total by the number of items – result is the variance. ·Take the square root of the variance – result is the standard deviation.
the standard deviation of the second set of test scores is 19.6.
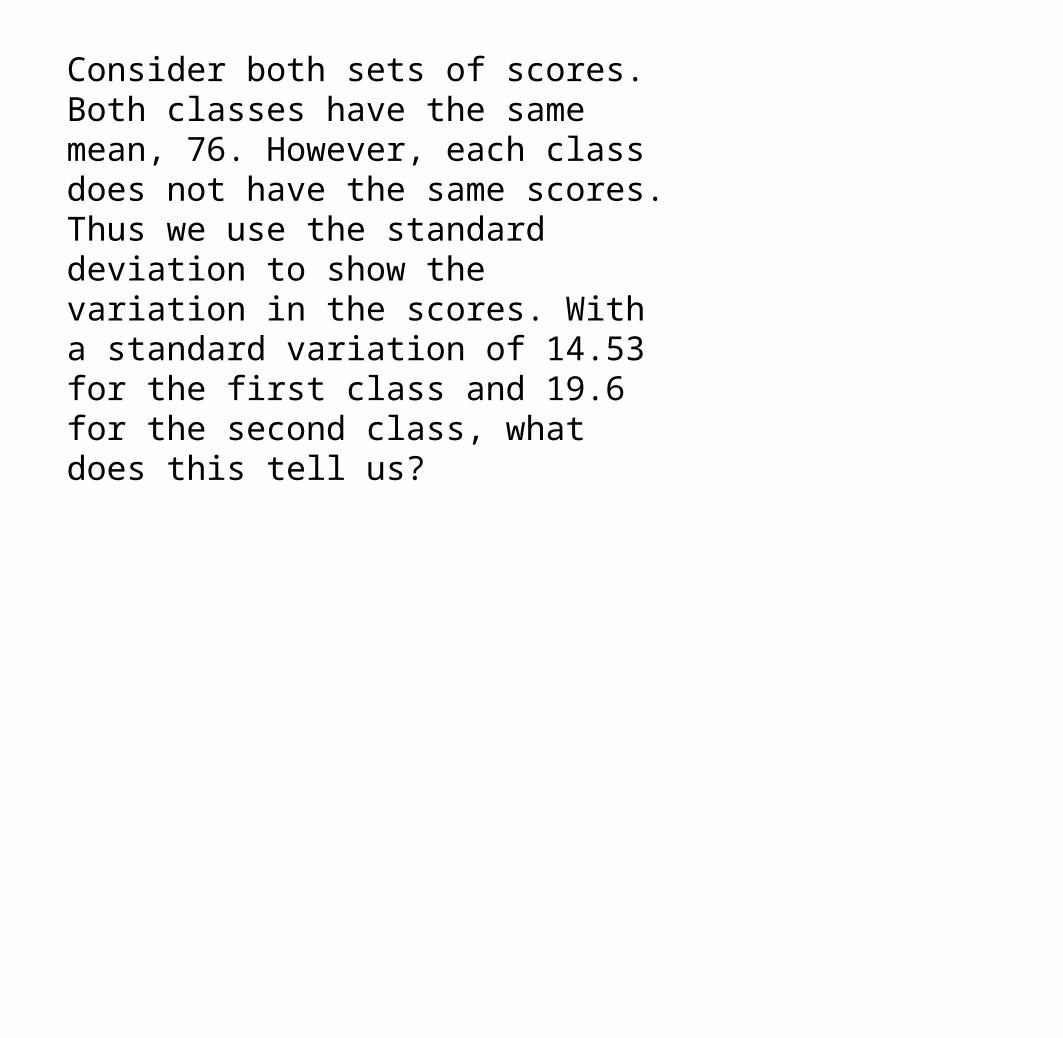
Consider both sets of scores. Both classes have the same mean, 76. However, each class does not have the same scores. Thus we use the standard deviation to show the variation in the scores. With a standard variation of 14.53 for the first class and 19.6 for the second class, what does this tell us?
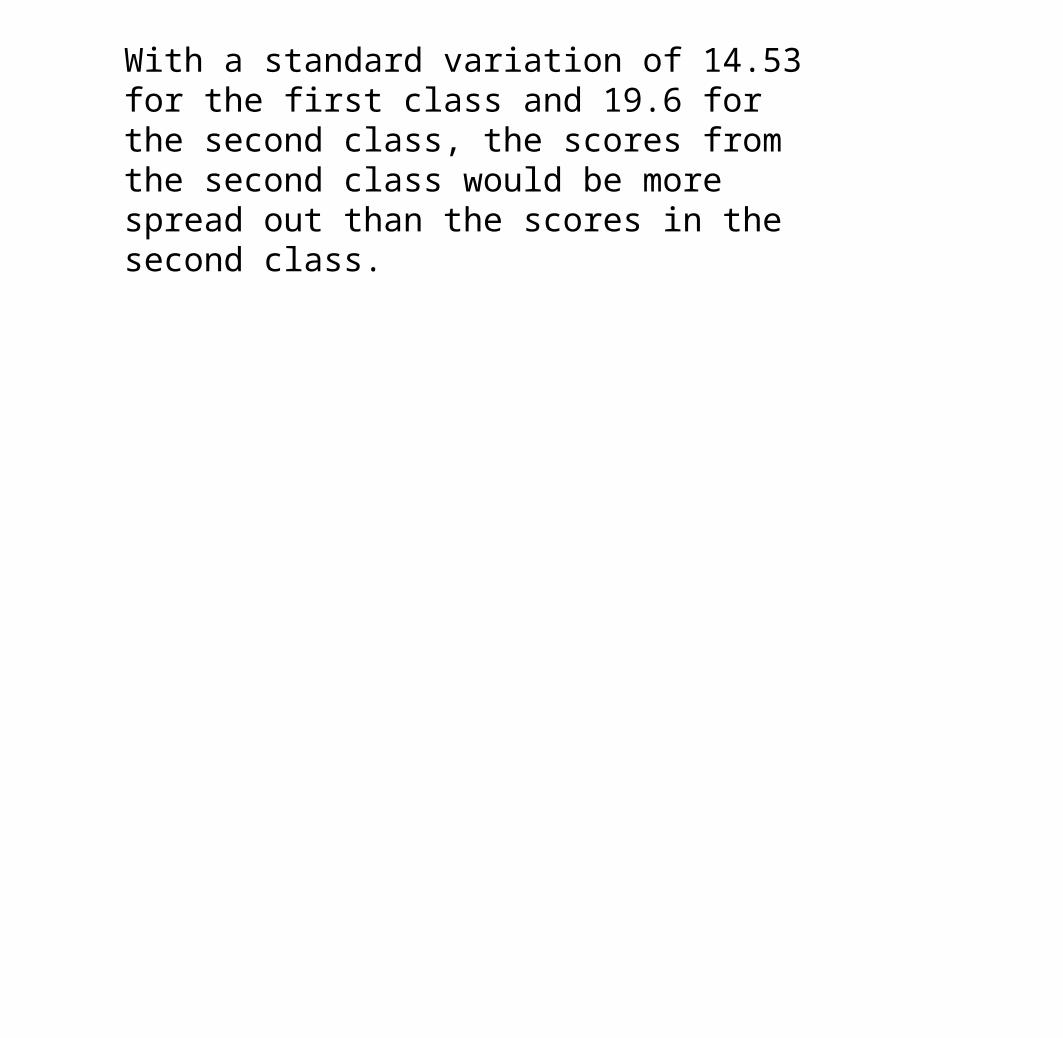
With a standard variation of 14.53 for the first class and 19.6 for the second class, the scores from the second class would be more spread out than the scores in the second class.
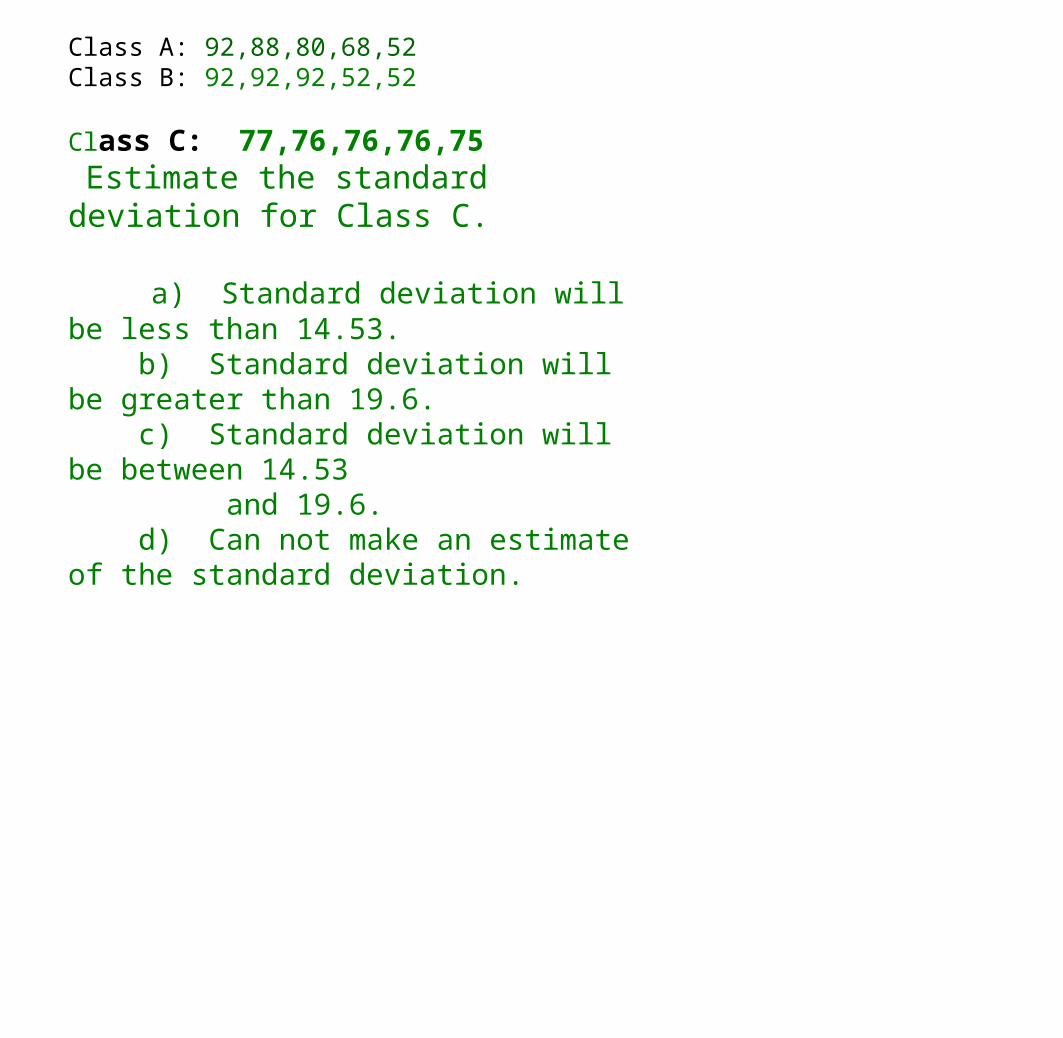
Class A: 92,88,80,68,52 Class B: 92,92,92,52,52
Class C: 77,76,76,76,75 Estimate the standard deviation for Class C.
a) Standard deviation will be less than 14.53. b) Standard deviation will be greater than 19.6. c) Standard deviation will be between 14.53 and 19.6. d) Can not make an estimate of the standard deviation.

Answer: A The scores in class C have the same mean of 76 as the other two classes. However, the scores in Class C are all much closer to the mean than the other classes so the standard deviation will be smaller than for the other classes.
As we have seen, standard deviation measures the dispersion of data.
The greater the value of the standard deviation, the further the data tend to be dispersed from the mean.