Statistical Exercises with SAT Data
14
Keri A. Catalfomo TriCounty Technical College
-
Upload
kareem-owens -
Category
Documents
-
view
43 -
download
0
description
Statistical Exercises with SAT Data. Keri A. Catalfomo TriCounty Technical College. Empirical Rule Diagram for Females. 163. 275. 387. 499. 611. 723. 835. µ - 3 σ. µ - 2 σ. µ - 1 σ. µ. µ + 1 σ. µ + 2 σ. µ + 3 σ. Mean Math SAT Score. µ = 499 σ = 112. Calculating z-scores. - PowerPoint PPT Presentation
Transcript of Statistical Exercises with SAT Data
Keri A. CatalfomoTriCounty Technical College

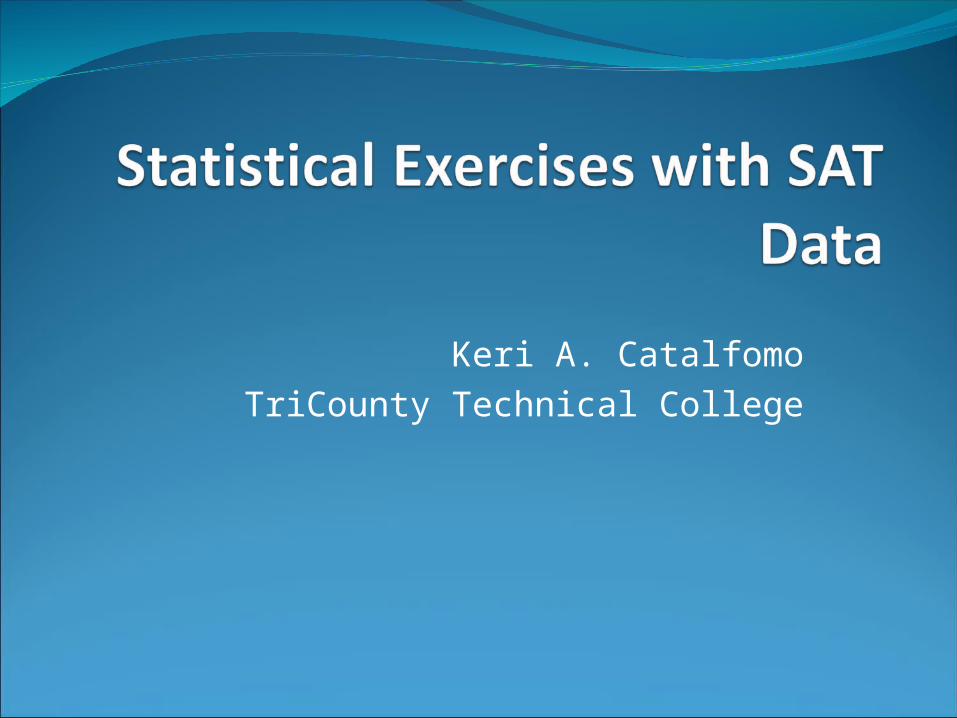
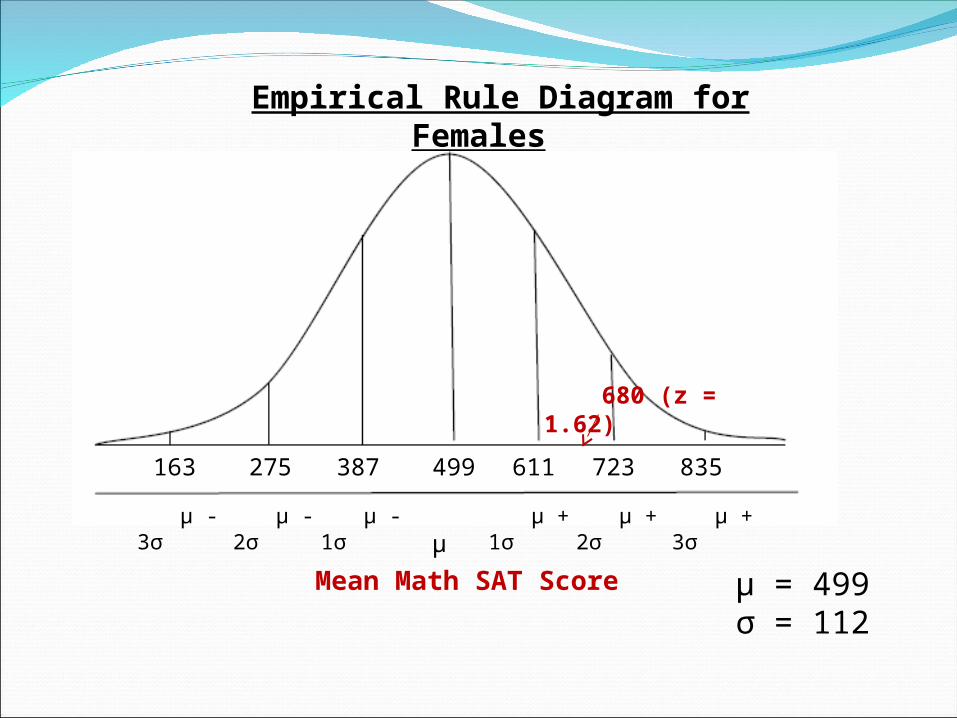
Empirical Rule Diagram for Females
Mean Math SAT Score µ = 499σ = 112
163 387 499275 835723611
µ µ + 1σ µ + 2σ µ - 3σ µ - 2σ µ - 1σ µ + 3σ
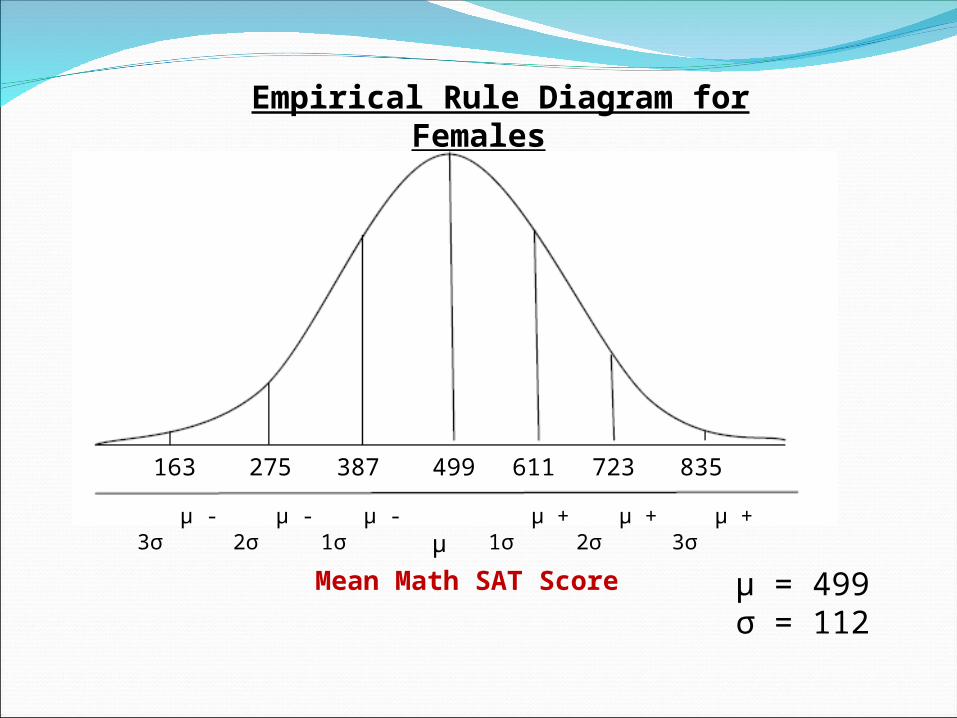
What was your Math SAT Score?
Ex. Female student: Math SAT Score was 680
How many Standard Deviations is this from the mean?
680 4991.62
112
xz
So, your score was 1.62 standard deviations above the mean.
Calculating z-scores
Empirical Rule Diagram for Females
Mean Math SAT Score µ = 499σ = 112
163 387 499275 835723611
µ µ + 1σ µ + 2σ µ - 3σ µ - 2σ µ - 1σ µ + 3σ
680 (z = 1.62)
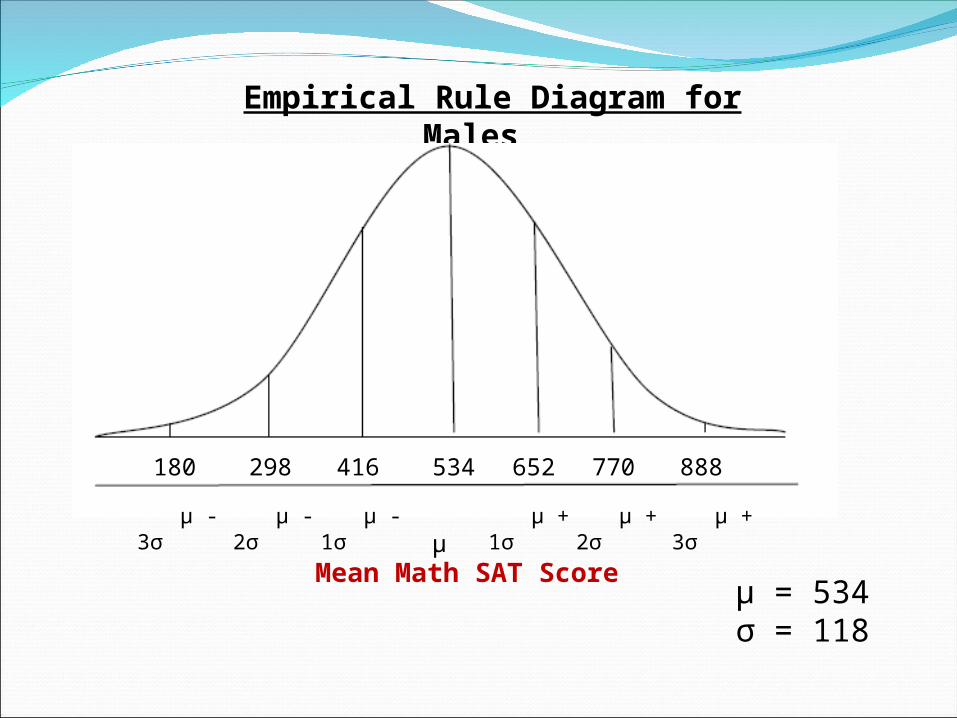
Empirical Rule Diagram for Males
Mean Math SAT Scoreµ = 534σ = 118
180 416 534298 888770652
µ µ + 1σ µ + 2σ µ - 3σ µ - 2σ µ - 1σ µ + 3σ
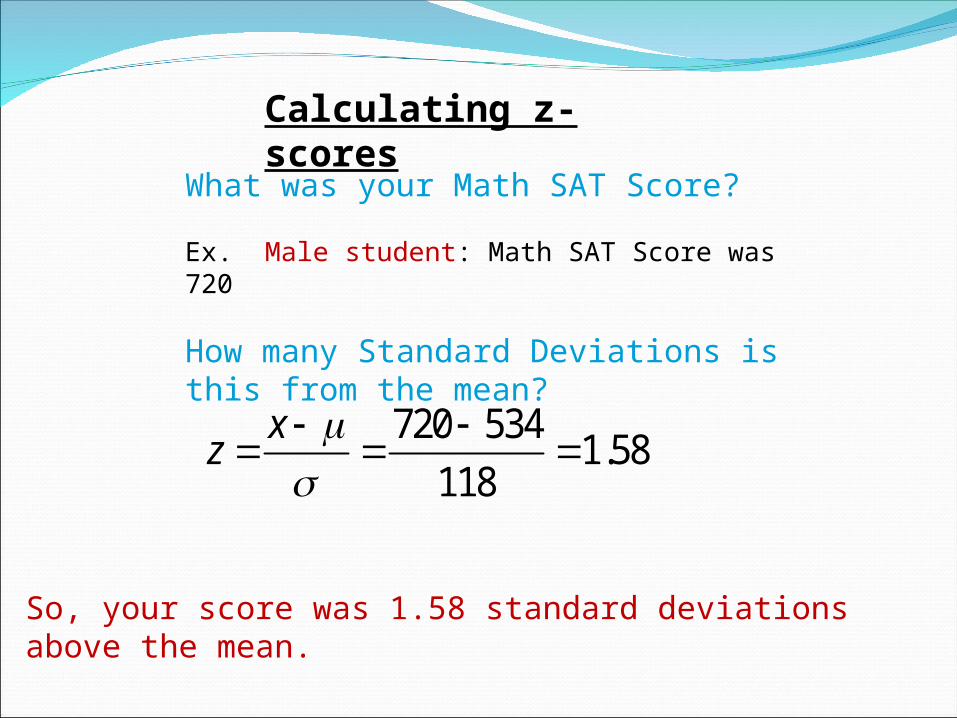
What was your Math SAT Score?
Ex. Male student: Math SAT Score was 720
How many Standard Deviations is this from the mean?
So, your score was 1.58 standard deviations above the mean.
Calculating z-scores
720 5341.58
118
xz
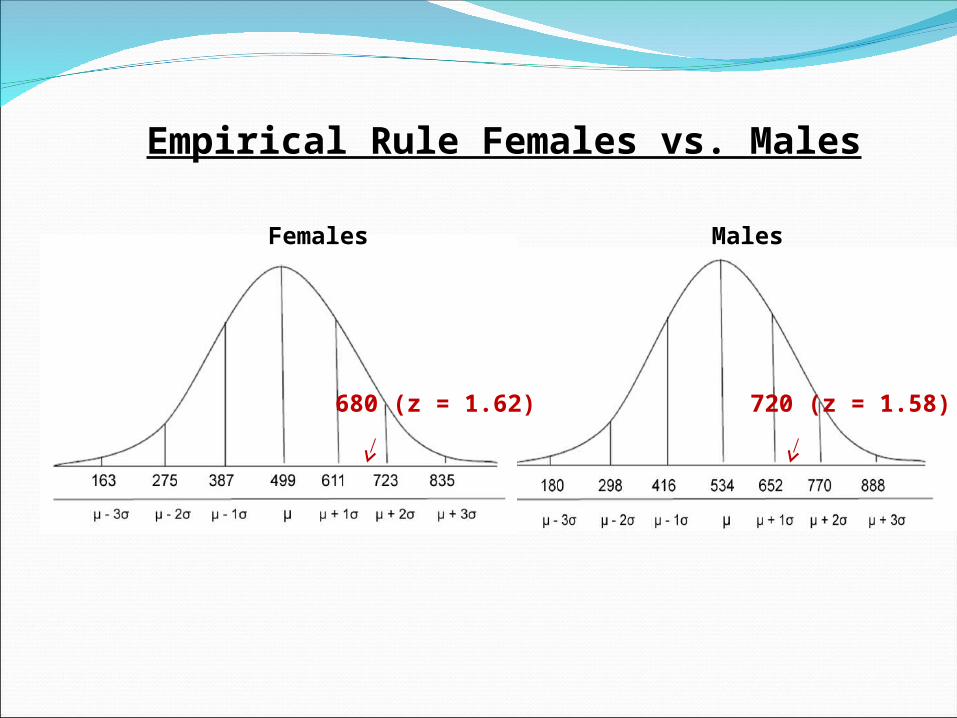
Empirical Rule Females vs. Males
Females Males
680 (z = 1.62) 720 (z = 1.58)
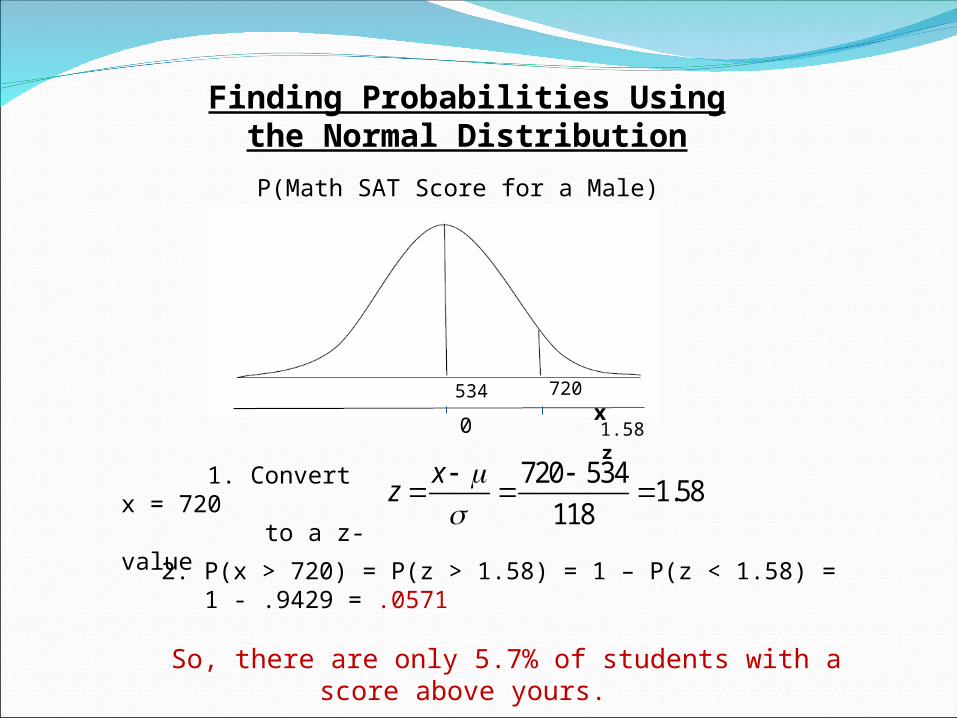
P(Math SAT Score for a Male) > 720
Finding Probabilities Using the Normal Distribution
720 5341.58
118
xz
2. P(x > 720) = P(z > 1.58) = 1 – P(z < 1.58) = 1 - .9429 = .0571
So, there are only 5.7% of students with a score above yours.
1. Convert x = 720 to a z-value
720 x
1.58 z
534
0
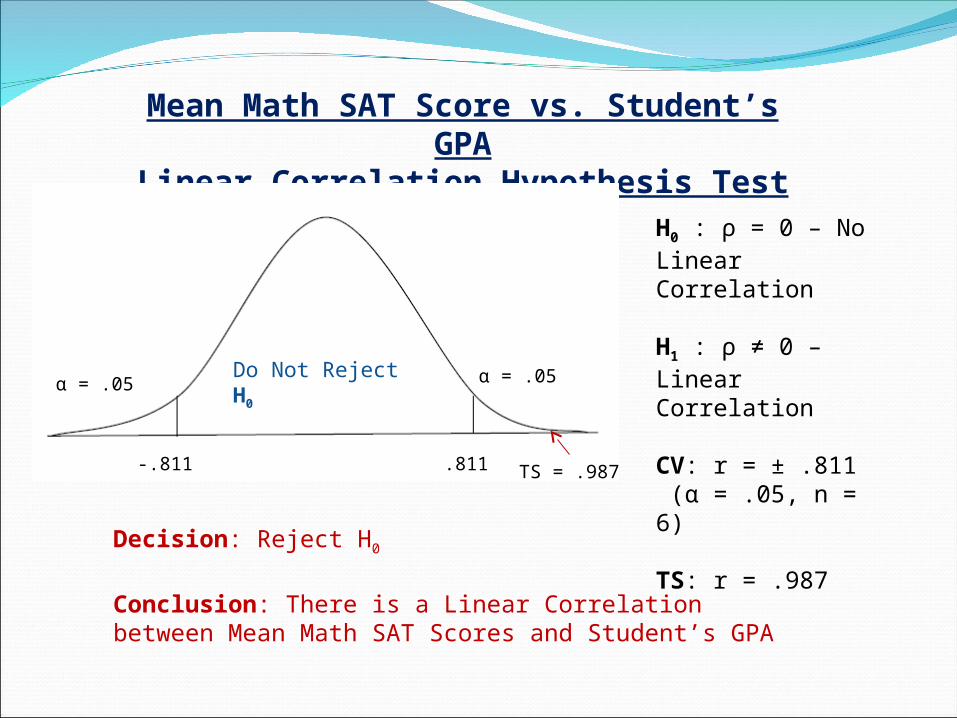
H0 : ρ = 0 – No Linear Correlation
H1 : ρ ≠ 0 – Linear Correlation
CV: r = ± .811 (α = .05, n = 6)
TS: r = .987
Decision: Reject H0
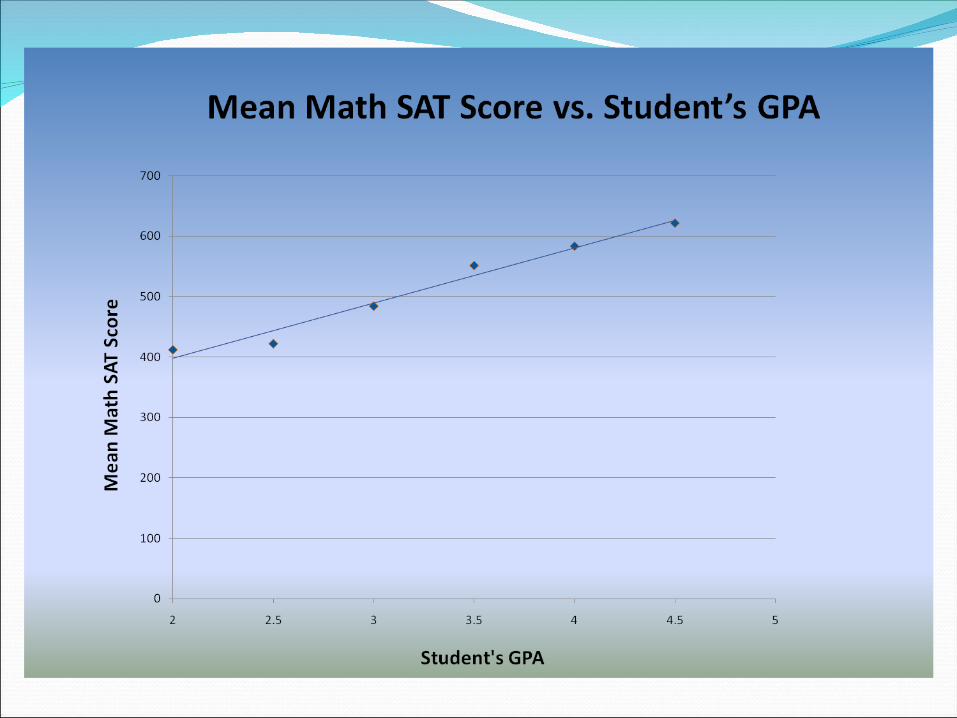
Conclusion: There is a Linear Correlation between Mean Math SAT Scores and Student’s GPA
Mean Math SAT Score vs. Student’s GPALinear Correlation Hypothesis Test
α = .05α = .05
-.811 .811
Do Not Reject H0
TS = .987
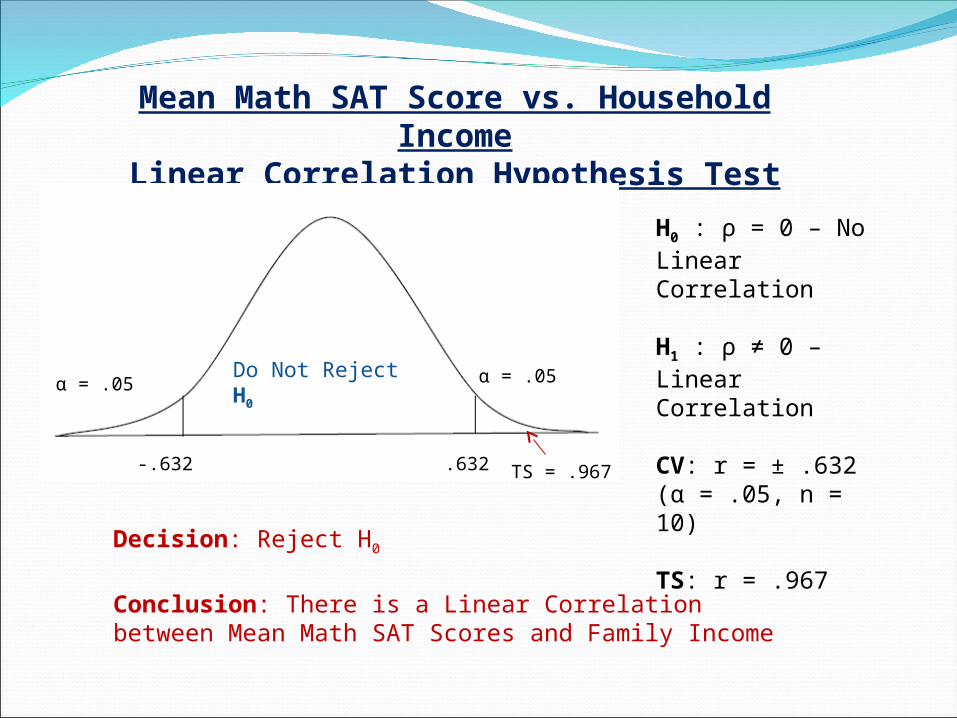
H0 : ρ = 0 – No Linear Correlation
H1 : ρ ≠ 0 – Linear Correlation
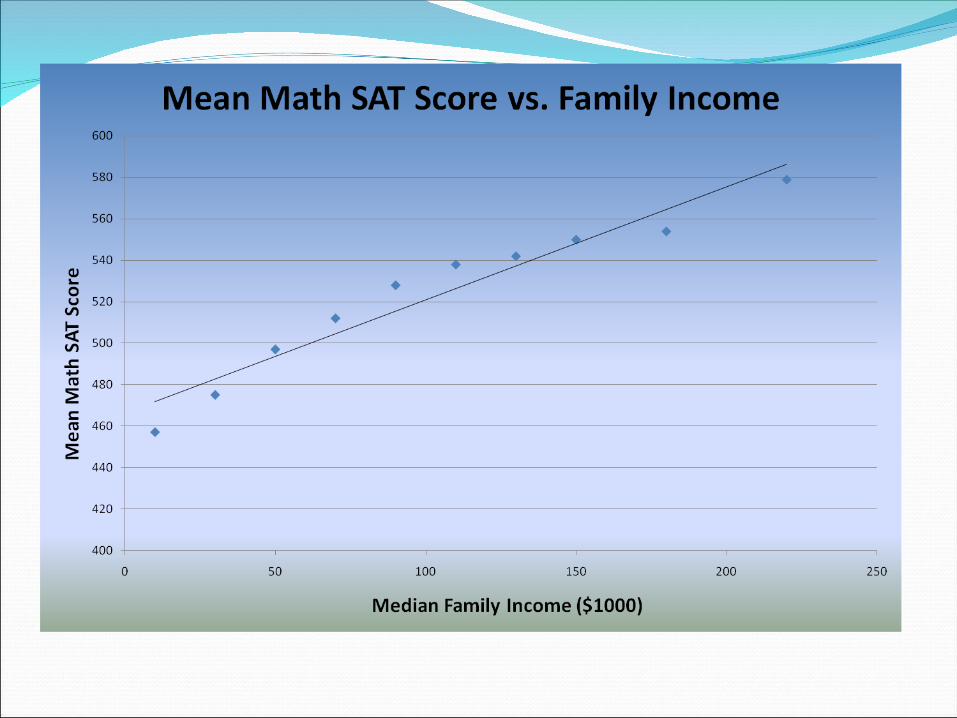
CV: r = ± .632 (α = .05, n = 10)
TS: r = .967
Decision: Reject H0
Conclusion: There is a Linear Correlation between Mean Math SAT Scores and Family Income
Mean Math SAT Score vs. Household IncomeLinear Correlation Hypothesis Test
α = .05α = .05
-.632 .632
Do Not Reject H0
TS = .967