Stat Review Handbook Andrew Ainsworth Psych 420ata20315/psy420/320 workbook.pdf · Ψ420 Ainsworth...
16
Ψ420 Ainsworth Stat Review Handbook Andrew Ainsworth Psych 420
Transcript of Stat Review Handbook Andrew Ainsworth Psych 420ata20315/psy420/320 workbook.pdf · Ψ420 Ainsworth...
Ψ420 Ainsworth
Stat Review Handbook Andrew Ainsworth
Psych 420

Ψ420 Ainsworth
Data
Subjects Aggression Difference
Scores
Locus of Control Video Type Gender Class Level Age Major
1 -10 18 Non-aggressive Female Junior 20 Psychology 2 -13 6 Non-aggressive Female Freshman 18 Biology 3 2 9 Non-aggressive Female Freshman 18 Biology 4 -3 8 Aggressive Female Sophomore 20 Art 5 16 17 Aggressive Female Freshman 19 Child Development 6 -9 8 Aggressive Female Senior 23 Psychology/Biology 7 0 10 Non-aggressive Female Junior 33 Health Administration 8 3 11 Non-aggressive Male Freshman 18 Business 9 2 11 Non-aggressive Male Sophomore 20 Journalism 10 -7 9 Aggressive Female Junior 20 Psychology
11 -6 11 Aggressive Female Sophomore 19 Psychology/Child Development
12 2 9 Aggressive Male Freshman 19 English Literature 13 3 16 Non-aggressive Female Junior 20 Physical Therapy 14 -21 6 Non-aggressive Female Freshman 18 Political Science 15 -4 10 Non-aggressive Male Senior 21 Computer Science 16 3 8 Non-aggressive Female Freshman 18 Accounting 17 -5 10 Non-aggressive Female Freshman 18 Undecided 18 -9 8 Non-aggressive Male Sophomore 19 Biology 19 -9 14 Aggressive Male Junior 20 Psychology 20 -6 11 Aggressive Female Sophomore 19 Health Science 21 3 10 Aggressive Female Freshman 19 Child Development 22 -10 6 Non-aggressive Female Senior 23 Biology 23 6 11 Non-aggressive Male Sophomore 19 Criminology 24 -13 14 Non-aggressive Female Sophomore 19 Physical Therapy 25 -5 9 Aggressive Male Sophomore 20 Undecided 26 -5 5 Aggressive Female Sophomore 21 Undecided 27 -1 14 Aggressive Male Junior 20 Psychology 28 -15 9 Aggressive Female Junior 23 Psychology 29 1 12 Aggressive Female Freshman 22 Biology 30 4 15 Aggressive Female Freshman 18.5 Undecided
Ψ420 Ainsworth
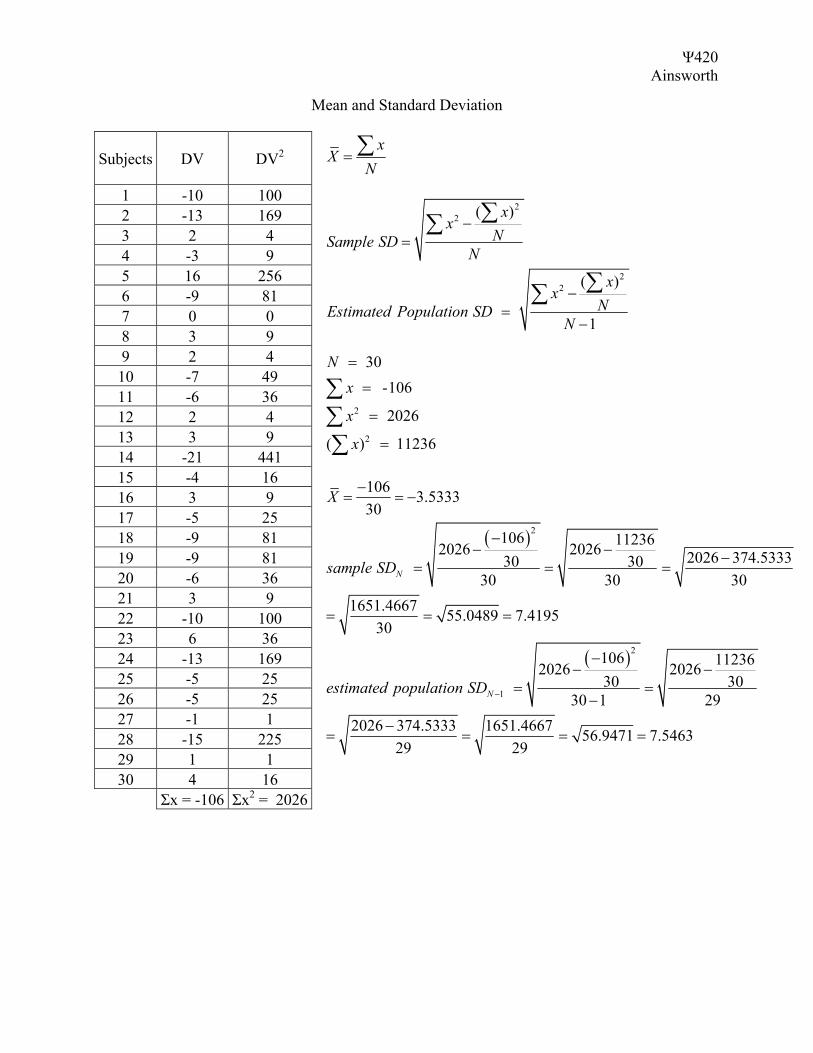
Mean and Standard Deviation
xX
N= ∑
2
2 ( )
xx
NSample SDN
22 ( )
1
xx
Estimated Population SD
−=
=
∑∑
∑ NN
−
−
∑
2
2
30 -106
2026
( ) 11236
Nx
x
x
=
=
=
=
∑∑∑
( )
( )
2
2
1
106 3.533330
106 112362026 2026 2026 374.533330 30 30 30 30
1651.4667 55.0489 7.419530
106 112362026 202630 30
30 1 292026 374.5333 1651.4667 56.9471 7.54
29 29
N
N
X
sample SD
estimated population SD −
−= = −
−− − −
= = =
= = =
−− −
= =−
−= = = = 63
Subjects DV DV2
1 -10 100 2 -13 169 3 2 4 4 -3 9 5 16 256 6 -9 81 7 0 0 8 3 9 9 2 4 10 -7 49 11 -6 36 12 2 4 13 3 9 14 -21 441 15 -4 16 16 3 9 17 -5 25 18 -9 81 19 -9 81 20 -6 36 21 3 9 22 -10 100 23 6 36 24 -13 169 25 -5 25 26 -5 25 27 -1 1 28 -15 225 29 1 1 30 4 16 Σx = -106 Σx2 = 2026
Ψ420 Ainsworth
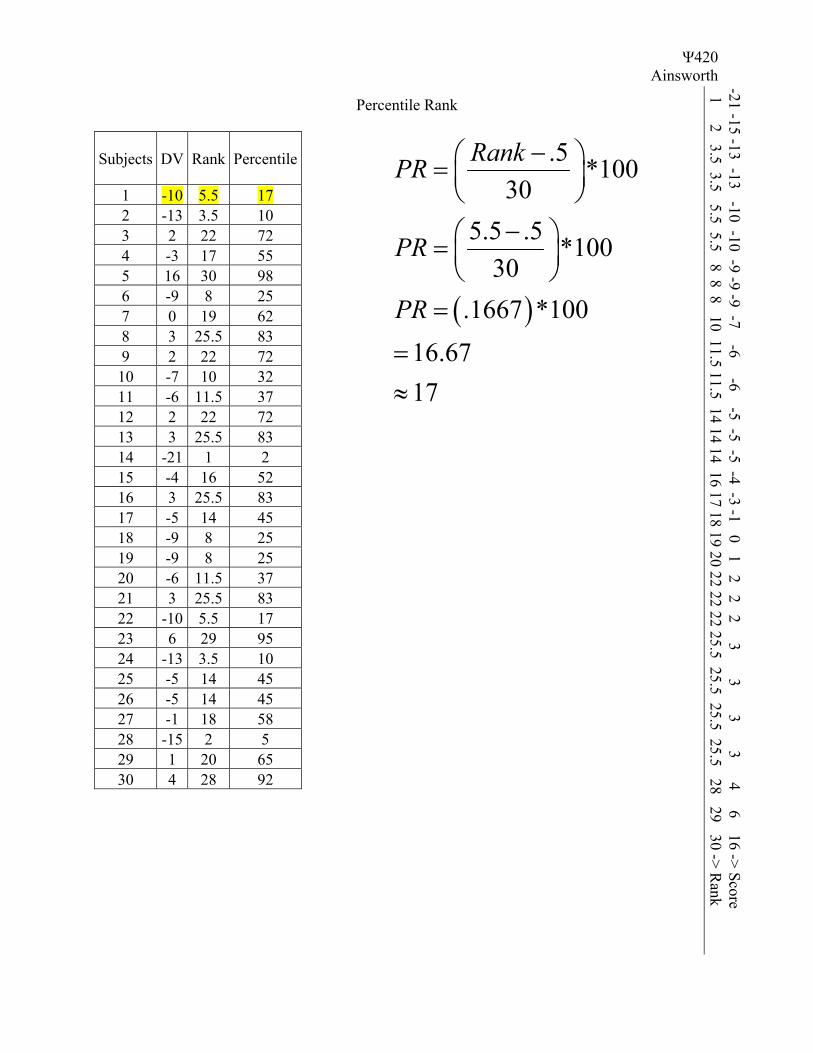
Percentile Rank
( )
.5 *10030
.5 *10030
*100
Rank −
−
5.5
.166716.6717
PR
PR
PR
=
=
=
=≈
Subjects DV Rank Percentile
1 -10 5.5 17 2 -13 3.5 10 3 2 22 72 4 -3 17 55 5 16 30 98 6 -9 8 25 7 0 19 62 8 3 25.5 83 9 2 22 72 10 -7 10 32 11 -6 11.5 37 12 2 22 72 13 3 25.5 83 14 -21 1 2 15 -4 16 52 16 3 25.5 83 17 -5 14 45 18 -9 8 25 19 -9 8 25 20 -6 11.5 37 21 3 25.5 83 22 -10 5.5 17 23 6 29 95 24 -13 3.5 10 25 -5 14 45 26 -5 14 45 27 -1 18 58 28 -15 2 5 29 1 20 65 30 4 28 92
-21 -15 -13 -13 -10 -10 -9 -9 -9 -7 -6 -6 -5 -5 -5 -4 -3 -1 0 1 2 2 2 3 3 3 3 4 6 16 -> Score 1 2 3.5 3.5 5.5 5.5 8 8 8 10 11.5 11.5 14 14 14 16 17 18 19 20 22 22 22 25.5 25.5 25.5 25.5 28 29 30 -> R
ank
Ψ420 Ainsworth
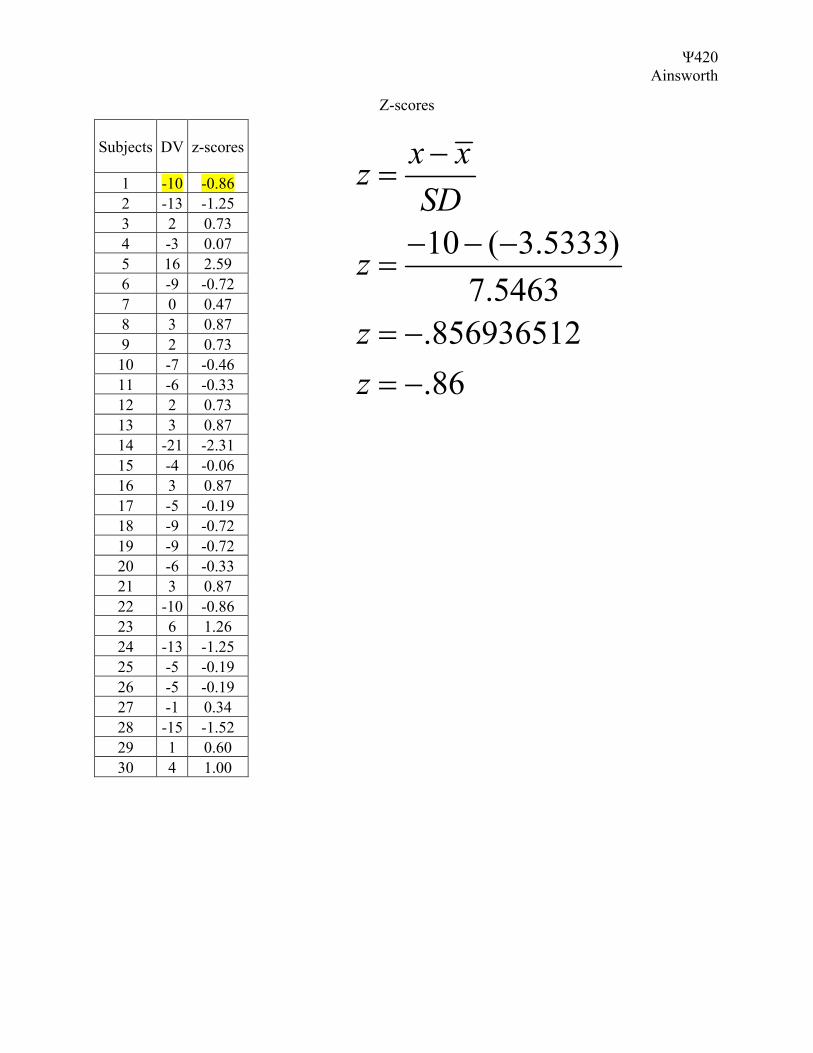
Z-scores
Subjects DV z-scores
1 -10 -0.86 2 -13 -1.25 3 2 0.73 4 -3 0.07 5 16 2.59 6 -9 -0.72 7 0 0.47 8 3 0.87 9 2 0.73 10 -7 -0.46 11 -6 -0.33 12 2 0.73 13 3 0.87 14 -21 -2.31 15 -4 -0.06 16 3 0.87 17 -5 -0.19 18 -9 -0.72 19 -9 -0.72 20 -6 -0.33 21 3 0.87 22 -10 -0.86 23 6 1.26 24 -13 -1.25 25 -5 -0.19 26 -5 -0.19 27 -1 0.34 28 -15 -1.52 29 1 0.60 30 4 1.00
10 ( 3.5333)7.5463
.856936512
.86
x xSD−
=
=
= −
− − −
z
z
zz = −
Ψ420 Ainsworth
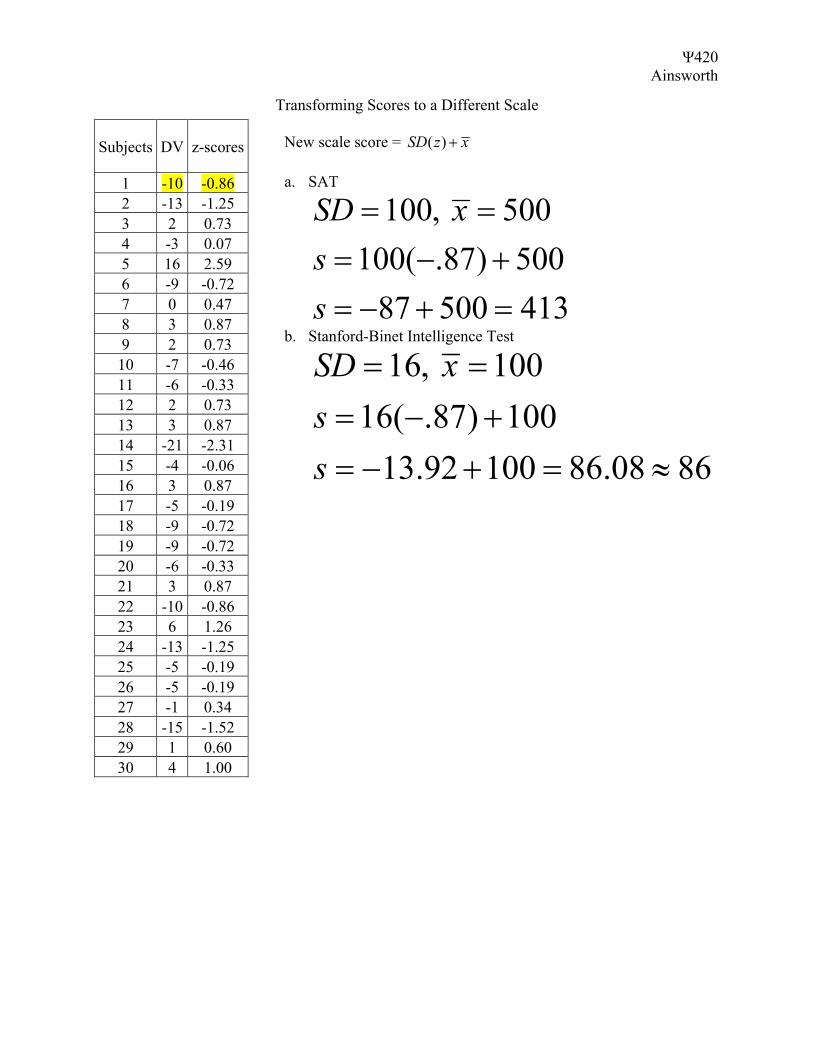
Transforming Scores to a Different Scale
New scale score = ( )SD z x+
a. SAT
100, 500100( .87) 500
87 500 413
SD xss
= == − += − + =
b. Stanford-Binet Intelligence Test
16, 10016( .87) 100
13.92 100 86.08 86
SD xss
= == − += − + = ≈
Subjects DV z-scores
1 -10 -0.86 2 -13 -1.25 3 2 0.73 4 -3 0.07 5 16 2.59 6 -9 -0.72 7 0 0.47 8 3 0.87 9 2 0.73 10 -7 -0.46 11 -6 -0.33 12 2 0.73 13 3 0.87 14 -21 -2.31 15 -4 -0.06 16 3 0.87 17 -5 -0.19 18 -9 -0.72 19 -9 -0.72 20 -6 -0.33 21 3 0.87 22 -10 -0.86 23 6 1.26 24 -13 -1.25 25 -5 -0.19 26 -5 -0.19 27 -1 0.34 28 -15 -1.52 29 1 0.60 30 4 1.00
Ψ420 Ainsworth
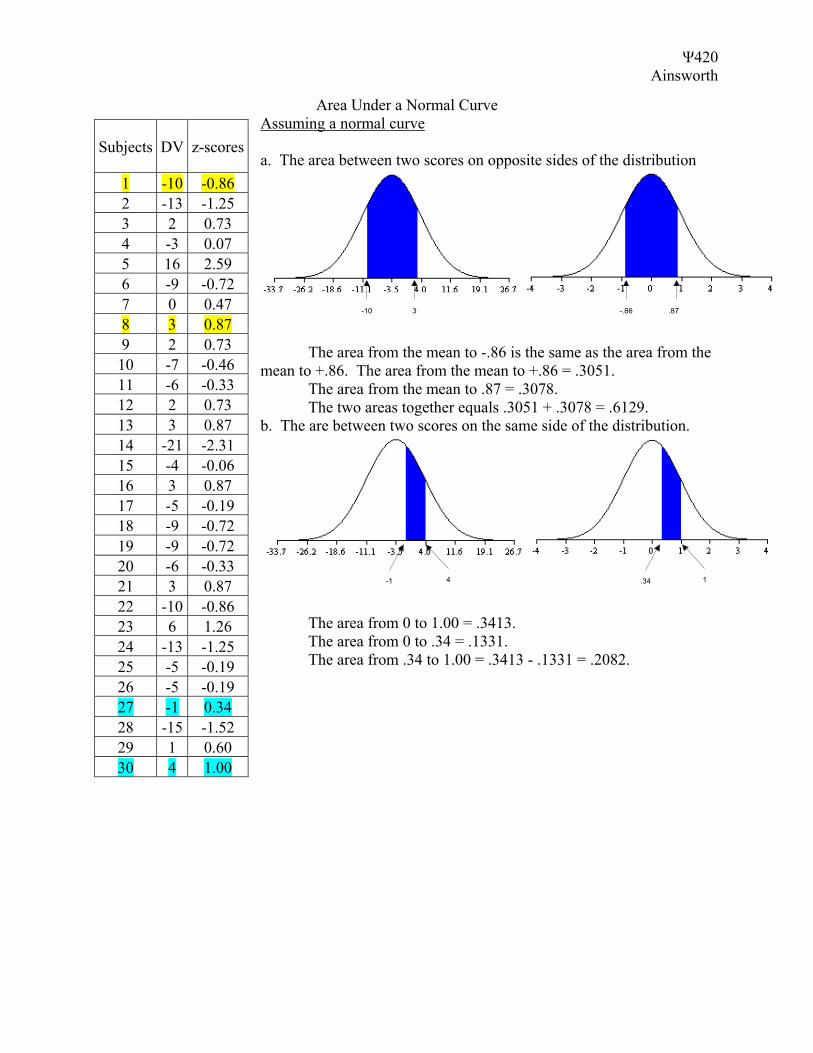
Area Under a Normal Curve Assuming a normal curve a. The area between two scores on opposite sides of the distribution
-10 3 -.86 .87
The area from the mean to -.86 is the same as the area from the mean to +.86. The area from the mean to +.86 = .3051. The area from the mean to .87 = .3078. The two areas together equals .3051 + .3078 = .6129. b. The are between two scores on the same side of the distribution.
-1 4 .34 1
The area from 0 to 1.00 = .3413. The area from 0 to .34 = .1331. The area from .34 to 1.00 = .3413 - .1331 = .2082.
Subjects DV z-scores
1 -10 -0.86 2 -13 -1.25 3 2 0.73 4 -3 0.07 5 16 2.59 6 -9 -0.72 7 0 0.47 8 3 0.87 9 2 0.73 10 -7 -0.46 11 -6 -0.33 12 2 0.73 13 3 0.87 14 -21 -2.31 15 -4 -0.06 16 3 0.87 17 -5 -0.19 18 -9 -0.72 19 -9 -0.72 20 -6 -0.33 21 3 0.87 22 -10 -0.86 23 6 1.26 24 -13 -1.25 25 -5 -0.19 26 -5 -0.19 27 -1 0.34 28 -15 -1.52 29 1 0.60 30 4 1.00
Ψ420 Ainsworth
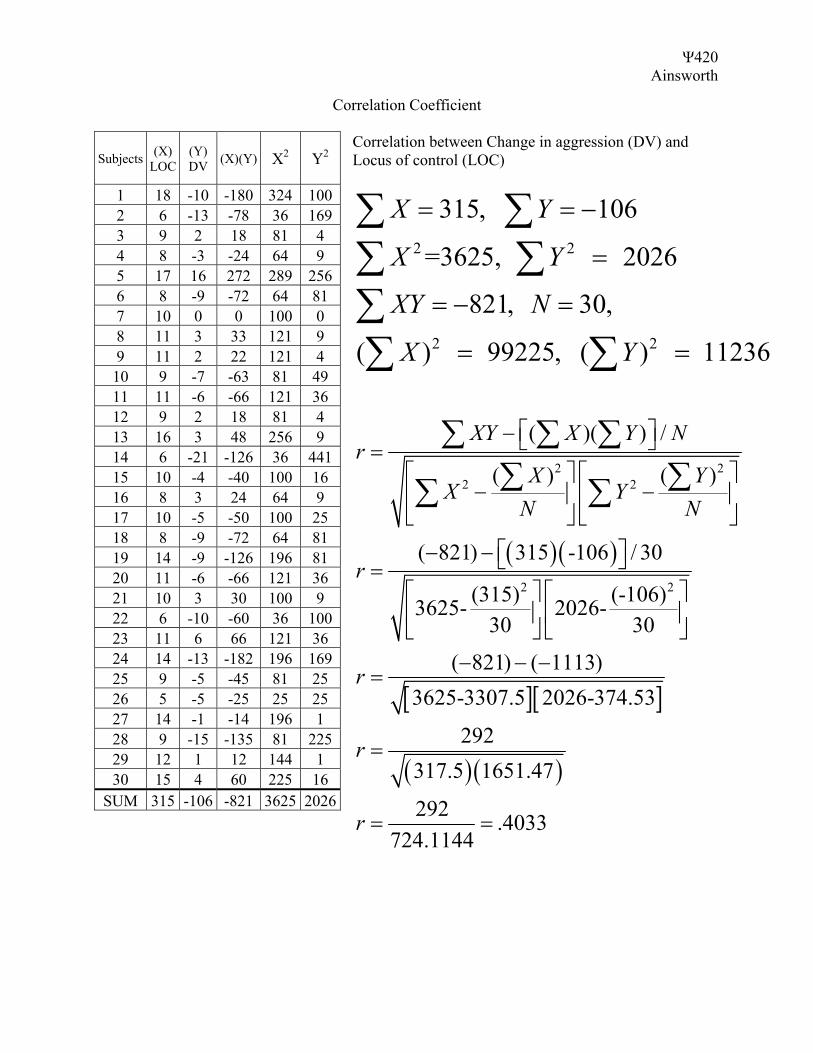
Correlation Coefficient Correlation between Change in aggression (DV) and Locus of control (LOC)
2 2
2 2
315, 106
=3625, 2026
821, 30,
( ) 99225, ( ) 11236
X Y
X Y
XY N
X Y
= = −
=
= − =
= =
∑ ∑∑ ∑∑∑ ∑
( )( )
[ ][ ]
( )( )
2 22 2
2 2
( )( ) /
( ) ( )
( 821) 315 -106 / 30
(315) (-106)3625- 2026-30 30
( 821) ( 1113)3625-3307.5 2026-374.53
292317.5 1651.47
292 .4033724.1144
XY X Y Nr
X YX Y
N N
r
r
r
r
− =
− −
− − =
− − −=
=
= =
∑ ∑ ∑∑ ∑∑ ∑
Subjects (X) LOC
(Y) DV (X)(Y) X2 Y2
1 18 -10 -180 324 1002 6 -13 -78 36 1693 9 2 18 81 4 4 8 -3 -24 64 9 5 17 16 272 289 2566 8 -9 -72 64 81 7 10 0 0 100 0 8 11 3 33 121 9 9 11 2 22 121 4 10 9 -7 -63 81 49 11 11 -6 -66 121 36 12 9 2 18 81 4 13 16 3 48 256 9 14 6 -21 -126 36 44115 10 -4 -40 100 16 16 8 3 24 64 9 17 10 -5 -50 100 25 18 8 -9 -72 64 81 19 14 -9 -126 196 81 20 11 -6 -66 121 36 21 10 3 30 100 9 22 6 -10 -60 36 10023 11 6 66 121 36 24 14 -13 -182 196 16925 9 -5 -45 81 25 26 5 -5 -25 25 25 27 14 -1 -14 196 1 28 9 -15 -135 81 22529 12 1 12 144 1 30 15 4 60 225 16
SUM 315 -106 -821 3625 2026
Ψ420 Ainsworth
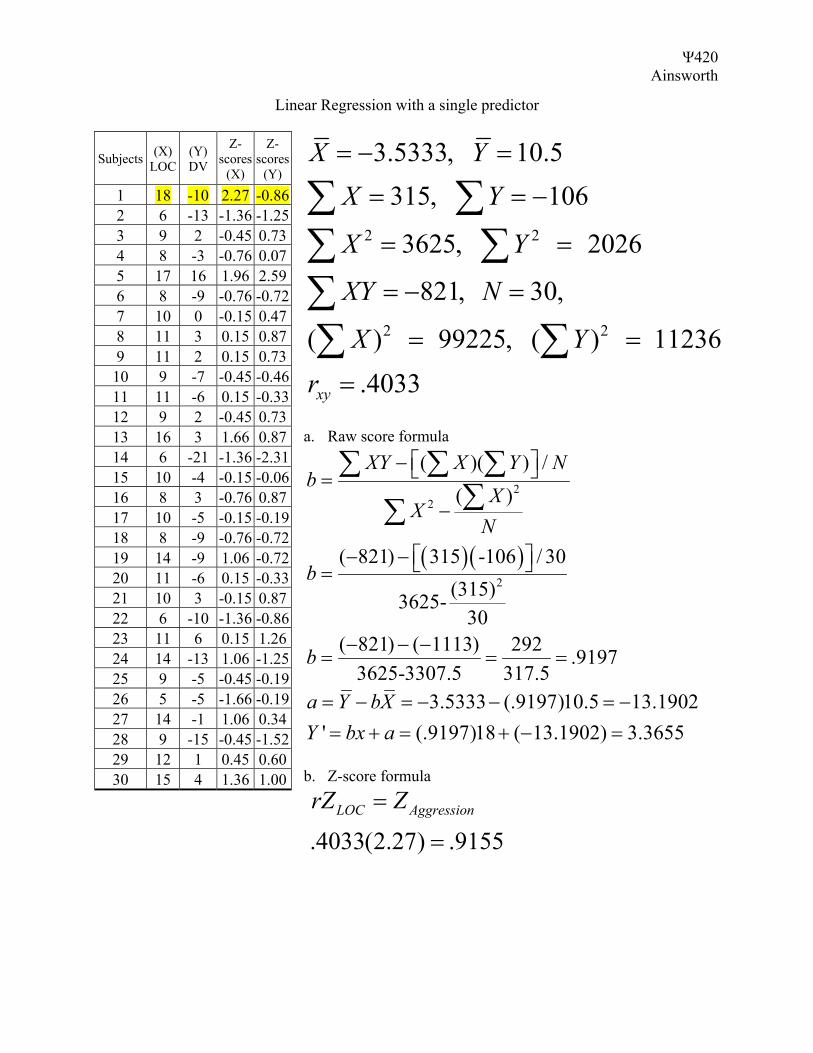
Linear Regression with a single predictor
2 2
2 2
3.5333, 10.5315, 106
3625, 2026
821, 30,
( ) 99225, ( ) 11236 .4033xy
X YX Y
X Y
XY N
X Yr
= − =
= = −
= =
= − =
= =
=
∑ ∑∑ ∑∑∑ ∑
a. Raw score formula
( )( )
22
2
( )( ) /( )
( 821) 315 -106 / 30(315)3625-
30( 821) ( 1113) 292 .9197
3625-3307.5 317.53.5333 (.9197)10.5 13.1902
' (.9197)18 ( 13.1902) 3.3655
XY X Y Nb
XX
N
b
b
a Y bXY bx a
− =−
− − =
− − −= = =
= − = − − = −= + = + − =
∑ ∑ ∑∑∑
b. Z-score formula
.4033(2.27) .9155LOC AggressionrZ Z=
=
Subjects (X) LOC
(Y) DV
Z-scores
(X)
Z-scores
(Y)
1 18 -10 2.27 -0.86 2 6 -13 -1.36 -1.25 3 9 2 -0.45 0.73 4 8 -3 -0.76 0.07 5 17 16 1.96 2.59 6 8 -9 -0.76 -0.72 7 10 0 -0.15 0.47 8 11 3 0.15 0.87 9 11 2 0.15 0.73 10 9 -7 -0.45 -0.46 11 11 -6 0.15 -0.33 12 9 2 -0.45 0.73 13 16 3 1.66 0.87 14 6 -21 -1.36 -2.31 15 10 -4 -0.15 -0.06 16 8 3 -0.76 0.87 17 10 -5 -0.15 -0.19 18 8 -9 -0.76 -0.72 19 14 -9 1.06 -0.72 20 11 -6 0.15 -0.33 21 10 3 -0.15 0.87 22 6 -10 -1.36 -0.86 23 11 6 0.15 1.26 24 14 -13 1.06 -1.25 25 9 -5 -0.45 -0.19 26 5 -5 -1.66 -0.19 27 14 -1 1.06 0.34 28 9 -15 -0.45 -1.52 29 12 1 0.45 0.60 30 15 4 1.36 1.00
Ψ420 Ainsworth
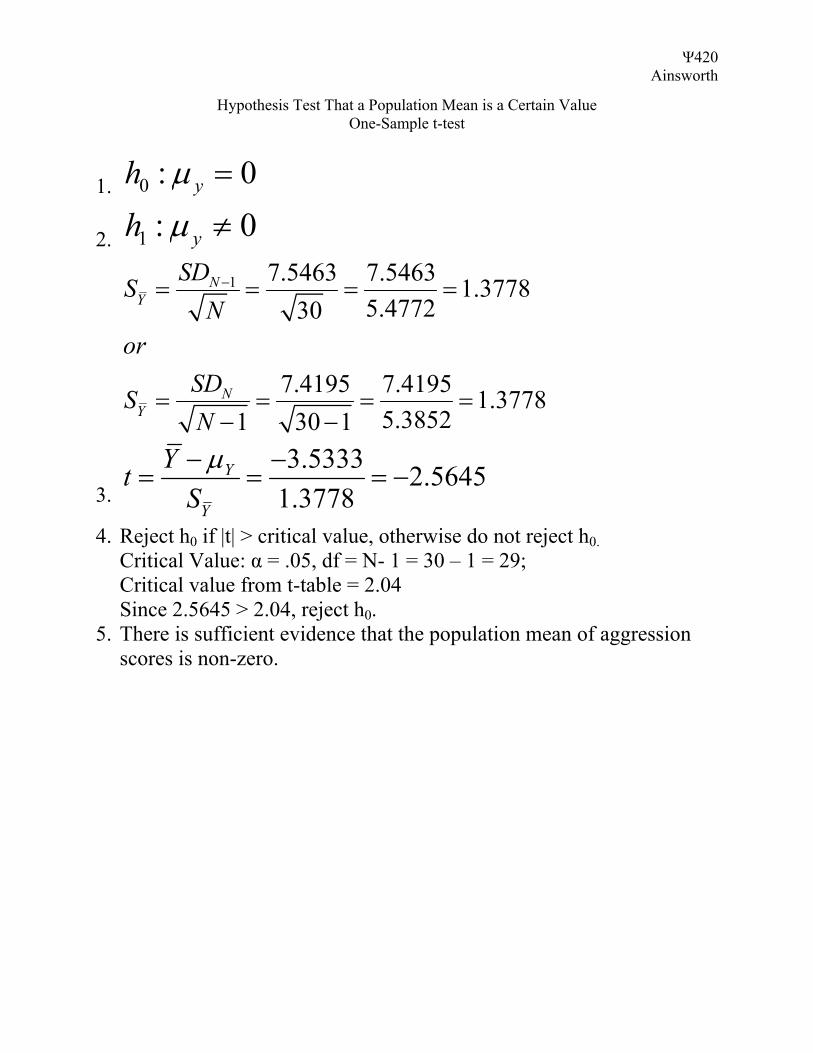
Hypothesis Test That a Population Mean is a Certain Value One-Sample t-test
1. 0 : 0yh µ =
2. 1 : 0yh µ ≠
1 7.5463 7.5463 1.37785.477230
7.4195 7.4195 1.37785.38521 30 1
NY
NY
SDSN
orSDSN
−= = = =
= = = =− −
3. 3.5333 2.5645
1.3778Y
Y
YtSµ− −
= = = −
4. Reject h0 if |t| > critical value, otherwise do not reject h0. Critical Value: α = .05, df = N- 1 = 30 – 1 = 29; Critical value from t-table = 2.04 Since 2.5645 > 2.04, reject h0.
5. There is sufficient evidence that the population mean of aggression scores is non-zero.
Ψ420 Ainsworth
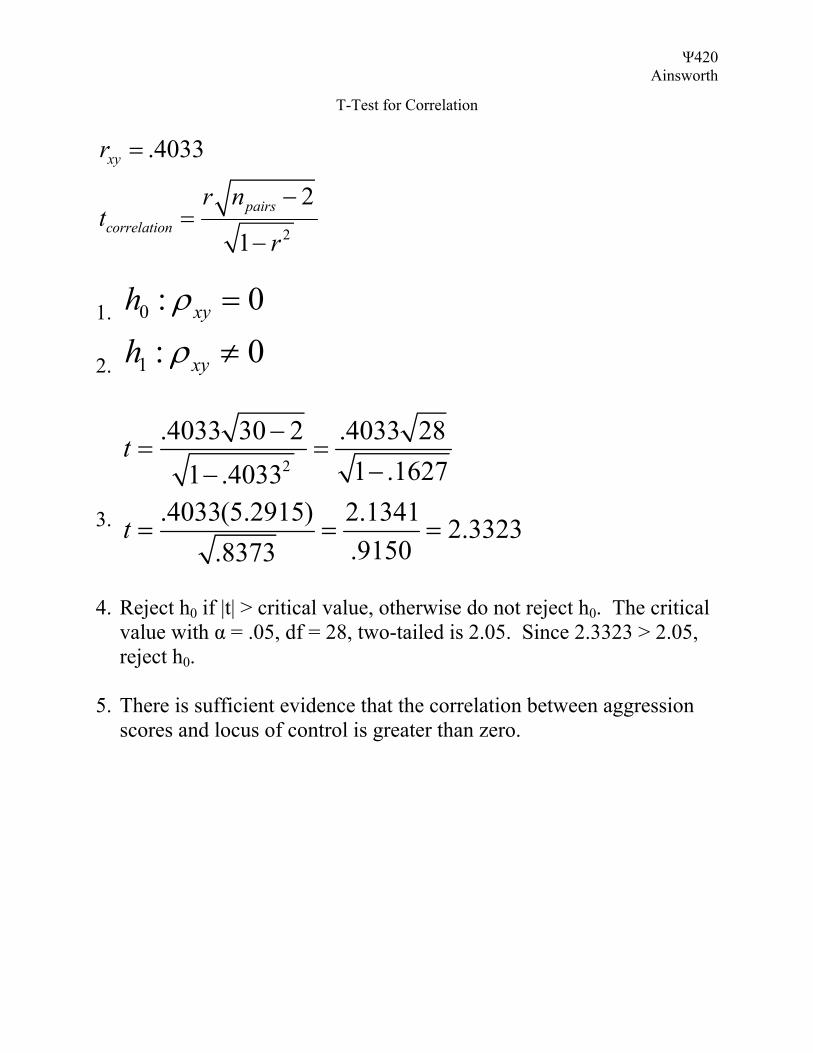
T-Test for Correlation
2
.4033
2
1
xy
pairscorrelation
r
r nt
r
=
−=
−
1. 0 : 0xyh ρ =
2. 1 : 0xyh ρ ≠
3.
2
.4033 30 2 .4033 281 .16271 .4033
.4033(5.2915) 2.1341 2.3323.9150.8373
t
t
−= =
−−
= = =
4. Reject h0 if |t| > critical value, otherwise do not reject h0. The critical
value with α = .05, df = 28, two-tailed is 2.05. Since 2.3323 > 2.05, reject h0.
5. There is sufficient evidence that the correlation between aggression
scores and locus of control is greater than zero.
Ψ420 Ainsworth
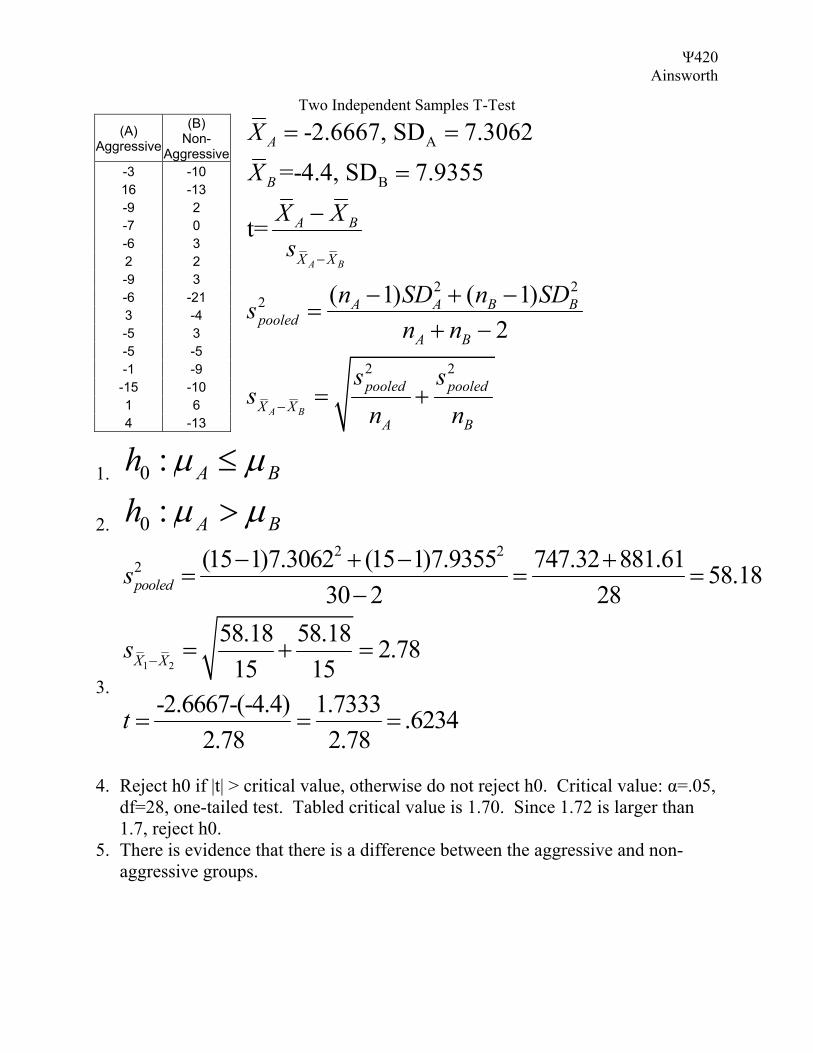
Two Independent Samples T-Test
A
B
2 22
2 2
-2.6667, SD 7.3062=-4.4, SD 7.9355
t=
( 1) ( 1)2
A B
A B
A
B
A B
X X
A A B Bpooled
A B
pooled pooledX X
A B
XXX Xs
n SD n SDsn n
s ss
n n
−
−
= =
=
−
− + −=
+ −
= +
1. 0 : A Bh µ µ≤
(A) Aggressive Non-
Aggressive
(B)
-3 -10 16 -13 -9 2 -7 0 -6 3 2 2 -9 3 -6 -21 3 -4 -5 3 -5 -5 -1 -9
-15 -10 1 6 4 -13
2. 0 : A Bh µ µ>
3. 1 2
2 22 (15 1)7.3062 (15 1)7.9355 747.32 881.61 58.18
30 2 2858.18 58.18 2.78
15 15-2.6667-(-4.4) 1.7333 .6234
2.78 2.78
pooled
X X
s
s
t
−
− + − += =
−
= + =
= = =
=
4. Reject h0 if |t| > critical value, otherwise do not reject h0. Critical value: α=.05,
df=28, one-tailed test. Tabled critical value is 1.70. Since 1.72 is larger than 1.7, reject h0.
5. There is evidence that there is a difference between the aggressive and non-aggressive groups.
Ψ420 Ainsworth
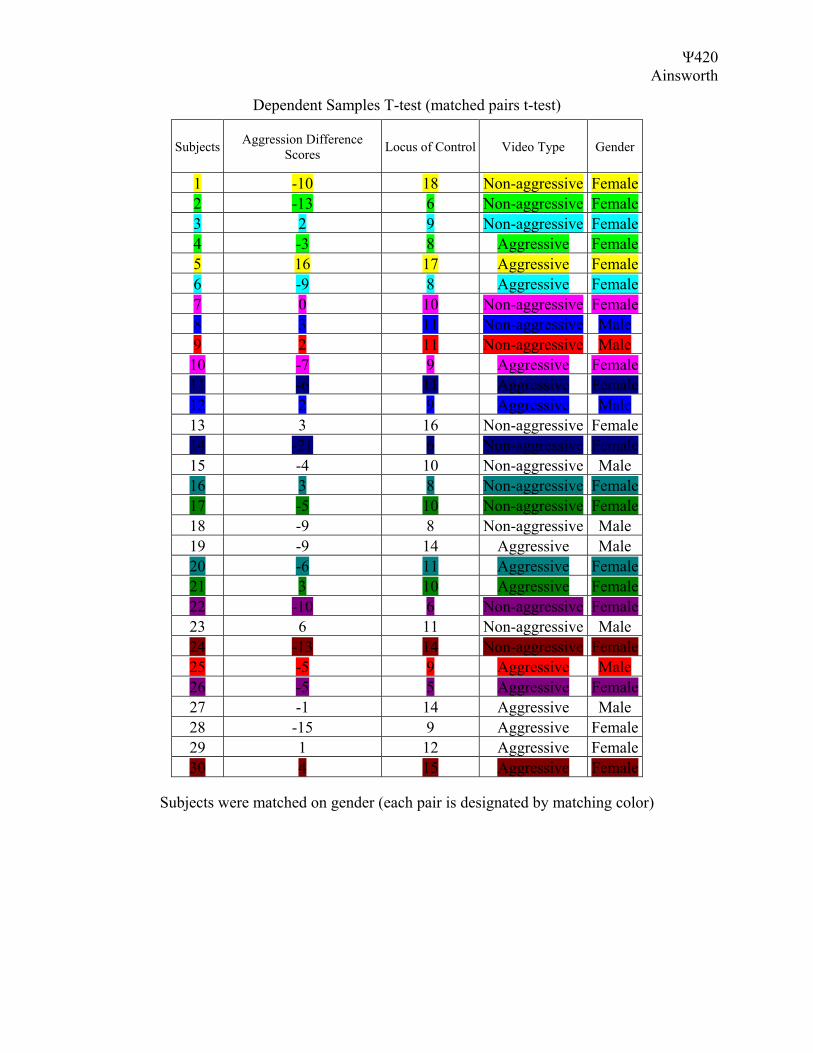
Dependent Samples T-test (matched pairs t-test)
Subjects Aggression Difference Scores Locus of Control Video Type Gender
1 -10 18 Non-aggressive Female 2 -13 6 Non-aggressive Female 3 2 9 Non-aggressive Female 4 -3 8 Aggressive Female 5 16 17 Aggressive Female 6 -9 8 Aggressive Female 7 0 10 Non-aggressive Female 8 3 11 Non-aggressive Male 9 2 11 Non-aggressive Male 10 -7 9 Aggressive Female 11 -6 11 Aggressive Female 12 2 9 Aggressive Male 13 3 16 Non-aggressive Female 14 -21 6 Non-aggressive Female 15 -4 10 Non-aggressive Male 16 3 8 Non-aggressive Female 17 -5 10 Non-aggressive Female 18 -9 8 Non-aggressive Male 19 -9 14 Aggressive Male 20 -6 11 Aggressive Female 21 3 10 Aggressive Female 22 -10 6 Non-aggressive Female 23 6 11 Non-aggressive Male 24 -13 14 Non-aggressive Female 25 -5 9 Aggressive Male 26 -5 5 Aggressive Female 27 -1 14 Aggressive Male 28 -15 9 Aggressive Female 29 1 12 Aggressive Female 30 4 15 Aggressive Female
Subjects were matched on gender (each pair is designated by matching color)
Ψ420 Ainsworth
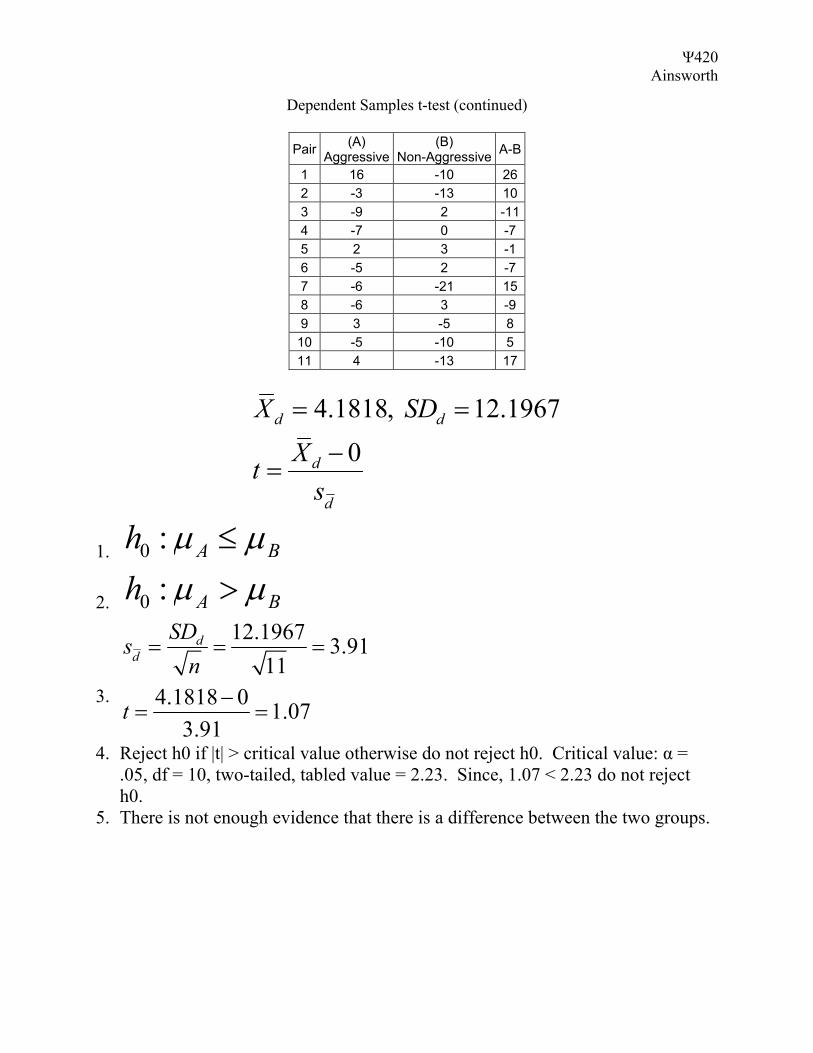
Dependent Samples t-test (continued)
Pair (A) Aggressive
(B) Non-Aggressive A-B
1 16 -10 262 -3 -13 103 -9 2 -114 -7 0 -7 5 2 3 -1 6 -5 2 -7 7 -6 -21 158 -6 3 -9 9 3 -5 8 10 -5 -10 5 11 4 -13 17
4.1818, 12.19670
d d
d
d
X SDXts
= =
−=
1. 0 : A Bh µ µ≤
2. 0 : A Bh µ µ>
3.
12.1967 3.9111
4.1818 0 1.073.91
dd
SDsn
t
= = =
−= =
4. Reject h0 if |t| > critical value otherwise do not reject h0. Critical value: α = .05, df = 10, two-tailed, tabled value = 2.23. Since, 1.07 < 2.23 do not reject h0.
5. There is not enough evidence that there is a difference between the two groups.
Ψ420 Ainsworth
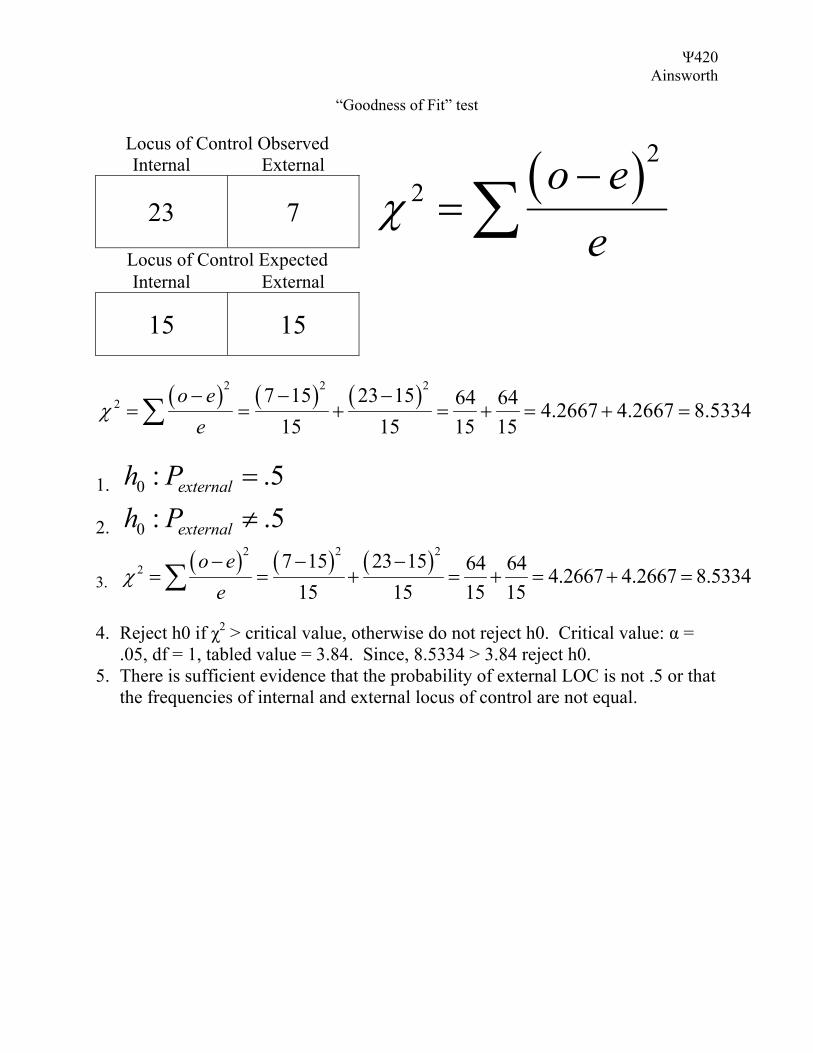
“Goodness of Fit” test
( )22 o e
eχ
−=∑
Locus of Control Observed Internal External
23 7
Locus of Control Expected Internal External
15 15
( ) ( ) ( )2 2 22 7 15 23 15 64 64 4.2667 4.2667 8.5334
15 15 15 15o ee
χ− − −
= = + = + = + =∑
1. 0 : .externalh P = 552. 0 : .externalh P ≠
3. ( ) ( ) ( )2 2 2
2 7 15 23 15 64 64 4.2667 4.2667 8.533415 15 15 15
o ee
χ− − −
= = + = + = + =∑
4. Reject h0 if χ2 > critical value, otherwise do not reject h0. Critical value: α = .05, df = 1, tabled value = 3.84. Since, 8.5334 > 3.84 reject h0.
5. There is sufficient evidence that the probability of external LOC is not .5 or that the frequencies of internal and external locus of control are not equal.
Ψ420 Ainsworth
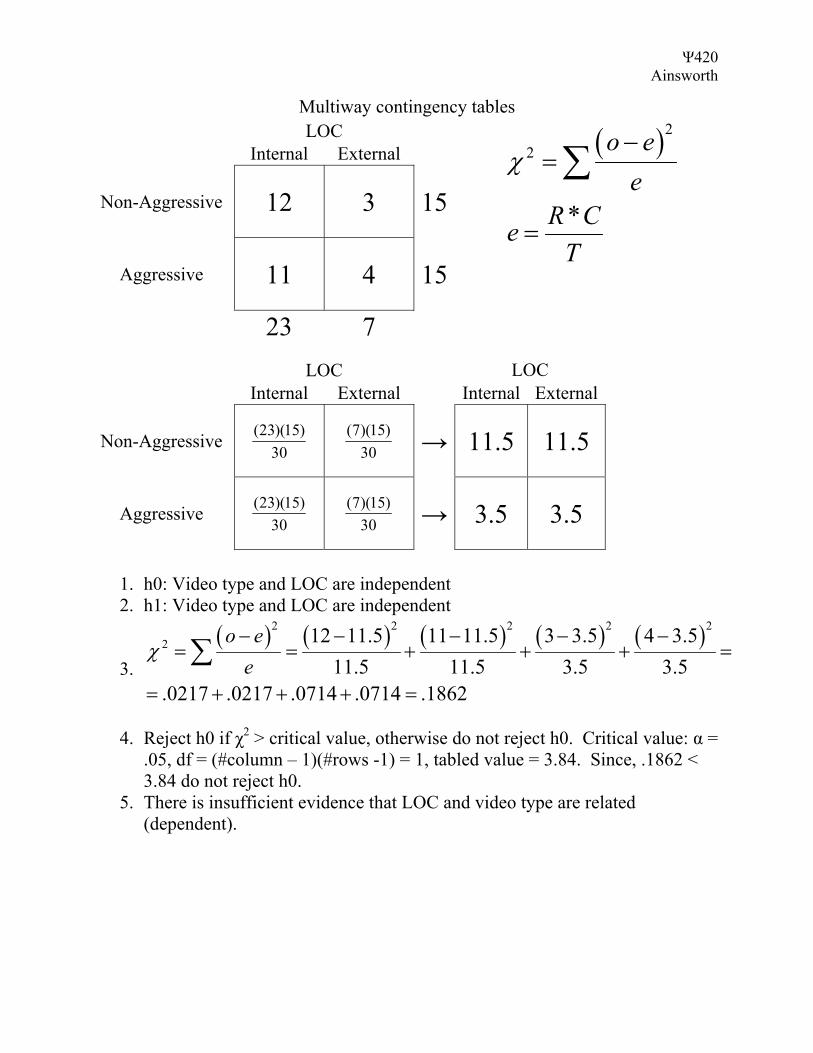
Multiway contingency tables
( )22
*
o ee
R CeT
χ−
=
=
∑
LOC Internal External
Non-Aggressive 12 3 15
Aggressive 11 4 15
23 7
LOC LOC Internal External Internal External
Non-Aggressive (23)(15)30
(7)(15)30
→ 11.5 11.5
Aggressive (23)(15)30
(7)(15)30
→ 3.5 3.5
1. h0: Video type and LOC are independent 2. h1: Video type and LOC are independent
3.
( ) ( ) ( ) ( ) ( )2 2 2 22 12 11.5 11 11.5 3 3.5 4 3.5
11.5 11.5 3.5 3.5.0217 .0217 .0714 .0714 .1862
o ee
χ− − − − −
= = + + +
= + + + =
∑2
=
4. Reject h0 if χ2 > critical value, otherwise do not reject h0. Critical value: α =
.05, df = (#column – 1)(#rows -1) = 1, tabled value = 3.84. Since, .1862 < 3.84 do not reject h0.
5. There is insufficient evidence that LOC and video type are related (dependent).


![α Physiologic correlation - medinfo2.psu.ac.thmedinfo2.psu.ac.th/pr/chest2012/chest2010/pdf/[12] Cases with physiologic correlation... · Morphology Physiology Physiology of lung](https://static.fdocument.org/doc/165x107/5d4b913888c99388658b7bf0/-physiologic-correlation-12-cases-with-physiologic-correlation-morphology.jpg)