Sr/Ca δ88/86Sr and δ Ca as a Tool to Study Corals ... · Ca-Isotopeneinbau in Aragonit. Korallen,...
90
Sr/Ca δ 88/86 Sr and δ 44/40 Ca as a Tool to Study Corals’ Calci�ication Mechanisms Noa Fruchter Dissertation Submitted to the Christian Albrechts University for the degree of Dr. rer. nat. at the faculty of Mathematics and Natural Sciences May 2014
Transcript of Sr/Ca δ88/86Sr and δ Ca as a Tool to Study Corals ... · Ca-Isotopeneinbau in Aragonit. Korallen,...
Sr/Ca δ88/86Sr and δ44/40Ca as a Tool to Study Corals’ Calci�ication Mechanisms
Noa Fruchter
DissertationSubmitted to the Christian Albrechts University
for the degree ofDr. rer. nat.
at the faculty of Mathematics and Natural Sciences
May 2014
First referee: Prof. Dr. Anton Eisenhauer
Second referee: Prof. Dr. Thor Hansteen
Date of the oral examination: July 07, 2014
Approved for publication:
The Dean
I hereby declare that I wrote the present doctorate thesis independently and without the use of
unauthorized aid. Neither this thesis nor a similar work has been submitted to any other
examination board. Further, I declare that I have carried out my scientific work according to the
principles of good scientific practice of the German research community.
Noa Fruchter
TABLE OF CONTENTS |4
TABLE OF CONTENTS
ABSTARCT 8
KURZZUSAMMENFASSUNG 10
CHAPTER I. INTRODUCTION 12
SCLERACTINIAN PHYSIOLOGY 12
CALCIFICATION PROCESS MODELS 15
TRACE ELEMENTS AND ISOTOPES INCORPORATION IN THE CORAL’S SKELETON 16
SR AND CA ISOTOPES INCORPORATION IN CACO3 17
THESIS STRUCTURE 20
REFERENCES 21
CHAPTER II.PATCHY CALCIFICATION PATTERN IN ACROPORA SP. DETERMINED BY
ELECTRON MICROPROBE AND MICRO-SXRF ELEMENT MAPPINGS USING TWO DISTINCT
SR ELEMENT CONCENTRATIONS 26
ABSTRACT 27
INTRODUCTION 27
METHODS 28
RESULTS AND DISCUSSION 30
APPENDIX: CORRECTION OF HETEROGENEOUS SAMPLES MEASURED IN THE Μ-SXRF 35
REFERENCES 37
CHAPTER III.88
SR/86
SR FRACTIONATION IN INORGANIC ARAGONITE AND IN CORALS
39
ABSTRACT 40
INTRODUCTION 40
METHODS 41
RESULTS 50
DISCUSSION 59
CONCLUSIONS 61
TABLE OF CONTENTS |5
REFERENCES 62
CHAPTER IV.KINETIC CONTROL ON 44
CA/40
CA INCORPORATION IN CORALS ARAGONITE
66
ABSTRACT 67
INTRODUCTION 67
METHODS 69
RESULTS 74
DISCUSSION 74
CONCLUSIONS 80
REFERENCES 81
SUMMARY 84
ACKNOWLEDGMENTS 86
APPENDIX 1 87
APPENDIX 2 90
LIST OF FIGURES |6
LIST OF FIGURES
FIGURE I.1 A CROSS SECTION SKETCH OF A CORAL’S POLYP 13
FIGURE I.2 A SKETCH OF A CORAL’S SINGLE POLYP SKELETON 14
FIGURE II.1 SR/CA RATIOS IN THE CORALS’ SKELETON MAPPED WITH THE ELECTRON MICROPROBE 30
FIGURE II.2 SR/CA RATIO RESULTS OF 9 LAYERS IN THE 19°C EXPERIMENT AS MEASURED ON ΜICRO-
SXRF 31
FIGURE II.3 SR/CA RATIO RESULTS OF 9 LAYERS IN THE 25°C EXPERIMENT AS MEASURED ON ΜICRO-
SXRF 32
FIGURE II.4 DISTRIBUTION OF SR/CA IN A 30 BY 30 PIXEL AREA OF THE 25°C CORAL EXPERIMENT AS
OBSERVED IN EMPA 33
FIGURE II.5 CORRELATION BETWEEN THE PERCENTAGES OF SKELETON GROWTH DURING THE
EXPERIMENT AS CALCULATED FROM THE PIXEL AREA RESULTS IN THE EMPA AND AS
CALCULATED FROM THE ALKALINITY DIFFERENCE MEASUREMENTS 34
FIGURE II.6 A MAGNIFIED IMAGE OF SULFUR (S) MAPPING IN THE 25°C EXPERIMENT 34
FIGURE II.7 ATTENUATION OF CA SIGNAL WITH DEPTH. 36
FIGURE III.1 RESULTS OF Δ18
O AND ∆88/86
SR ON A PORITES SP. FROM TAHITI 51
FIGURE III.2 CORRELATION BETWEEN SST AND THE MEASURED SR/CA WITH ∆88/86
SR VALUES 52
FIGURE III.3 SR/CA RESULTS OF CULTURED ACROPORA SP. COMPARED TO THE TEMPERATURE OF
PRECIPITATION IN THE CURRENT STUDY AND IN PREVIOUS STUDIES 53
FIGURE III.4 87
SR/86
SR IN THE ACROPORA SP. SKELETONS VERSUS THE AMOUNT OF MIXTURE BETWEEN
THE PRE-EXPERIMENT AND THE EXPERIMENT SKELETON 54
FIGURE III.5 ∆88/86
SR VARIATIOS OF CULTURED ACROPORA SP. WITH TEMPERATURE AND WITH CO3
-2 55
FIGURE III.6 ∆88/86
SR RESULTS OF CLADOCORA CEASPITOSA 56
FIGURE III.7 ∆88/86
SR IN INORGANIC ARAGONITE 57
FIGURE III.8 ∆88/86
SR VERSUS TEMPERATURE IN BIOGENIC AND INORGANIC ARAGONITE FROM THE
CURRENT STUDY 59
FIGURE IV.1 GRAPH OF TEMPERATURE VERSUS ∆44/40
CA IN ARAGONITE 75
FIGURE IV.2 PRECIPITATION RATE IN ARAGONITE IS POSITIVELY CORRELATED TO ∆44/40
CA 78
FIGURE IV.3 ∆44/40
CA IN ACROPORA SP. SKELETON VS. CALCIFICATION RATES 79
LIST OF TABLES |7
LIST OF TABLES
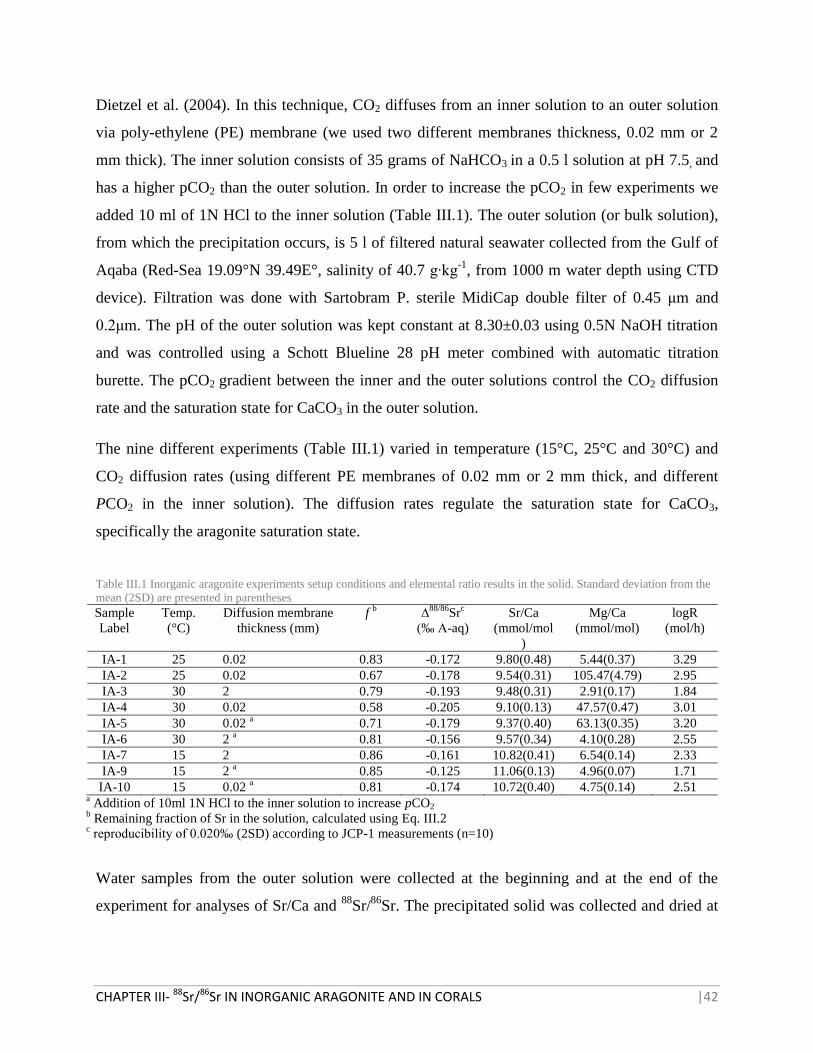
TABLE III.1 INORGANIC ARAGONITE EXPERIMENTS SETUP CONDITIONS AND ELEMENTAL RATIO RESULTS
IN THE SOLID 42
TABLE III.2 Δ88/86
SR RESULTS OF PORITES SP. CORALS 46
TABLE III.3 ACROPORA SP. SETUP CONDITIONS AND RESULTS 54
TABLE III.4 RESULTS OF CLADOCORA CAESPITOSA EXPERIMENTS 56
TABLE III.5 RAYLEIGH BASED MODEL CALCULATION FOR ∆88/86
SR IN CORALS 58
TABLE IV.1 PARAMETERS AND ∆44/40
CA RESULTS OF ACROPORA SP. AND INORGANIC ARAGONITE
PRECIPITATION EXPERIMENTS 72
TABLE IV.2 INORGANIC ARAGONITE EXPERIMENTAL CONDITIONS 76
ABSTARCT |8
ABSTARCT
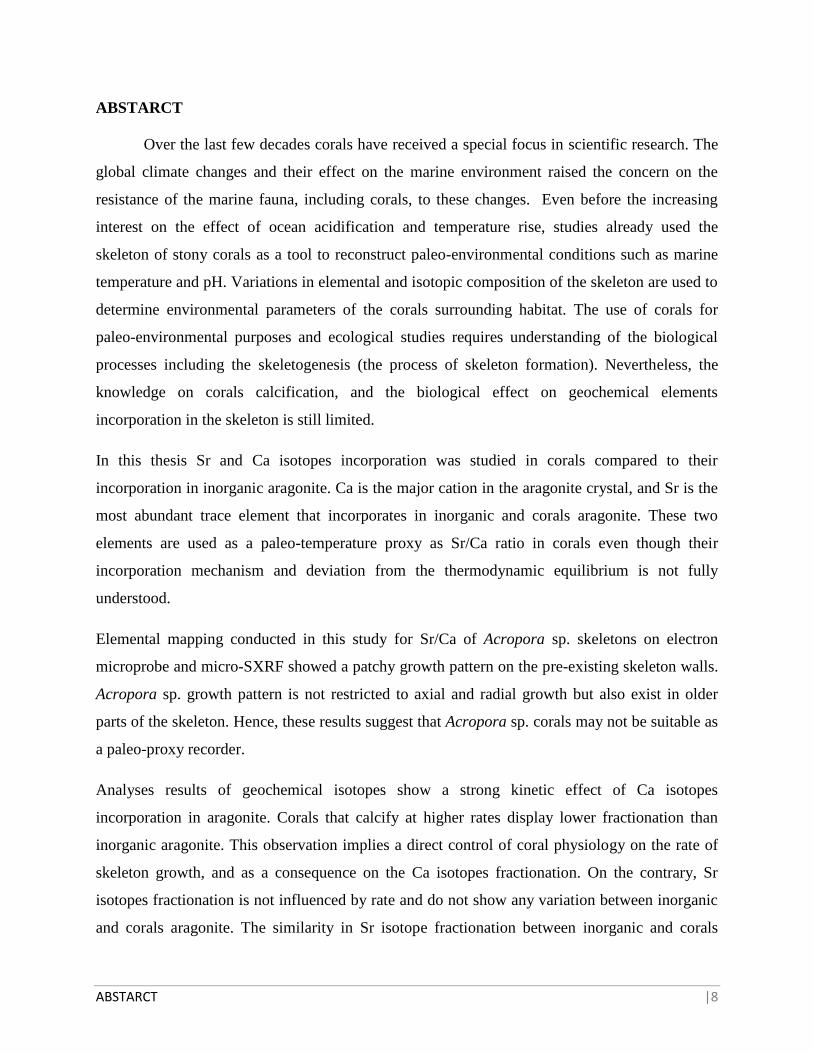
Over the last few decades corals have received a special focus in scientific research. The
global climate changes and their effect on the marine environment raised the concern on the
resistance of the marine fauna, including corals, to these changes. Even before the increasing
interest on the effect of ocean acidification and temperature rise, studies already used the
skeleton of stony corals as a tool to reconstruct paleo-environmental conditions such as marine
temperature and pH. Variations in elemental and isotopic composition of the skeleton are used to
determine environmental parameters of the corals surrounding habitat. The use of corals for
paleo-environmental purposes and ecological studies requires understanding of the biological
processes including the skeletogenesis (the process of skeleton formation). Nevertheless, the
knowledge on corals calcification, and the biological effect on geochemical elements
incorporation in the skeleton is still limited.
In this thesis Sr and Ca isotopes incorporation was studied in corals compared to their
incorporation in inorganic aragonite. Ca is the major cation in the aragonite crystal, and Sr is the
most abundant trace element that incorporates in inorganic and corals aragonite. These two
elements are used as a paleo-temperature proxy as Sr/Ca ratio in corals even though their
incorporation mechanism and deviation from the thermodynamic equilibrium is not fully
understood.
Elemental mapping conducted in this study for Sr/Ca of Acropora sp. skeletons on electron
microprobe and micro-SXRF showed a patchy growth pattern on the pre-existing skeleton walls.
Acropora sp. growth pattern is not restricted to axial and radial growth but also exist in older
parts of the skeleton. Hence, these results suggest that Acropora sp. corals may not be suitable as
a paleo-proxy recorder.
Analyses results of geochemical isotopes show a strong kinetic effect of Ca isotopes
incorporation in aragonite. Corals that calcify at higher rates display lower fractionation than
inorganic aragonite. This observation implies a direct control of coral physiology on the rate of
skeleton growth, and as a consequence on the Ca isotopes fractionation. On the contrary, Sr
isotopes fractionation is not influenced by rate and do not show any variation between inorganic
and corals aragonite. The similarity in Sr isotope fractionation between inorganic and corals

ABSTRACT |9
aragonite rules out the Rayleigh Based multi element model to explain corals calcification
process.
KURZZUSAMMENFASSUNG |10
KURZZUSAMMENFASSUNG
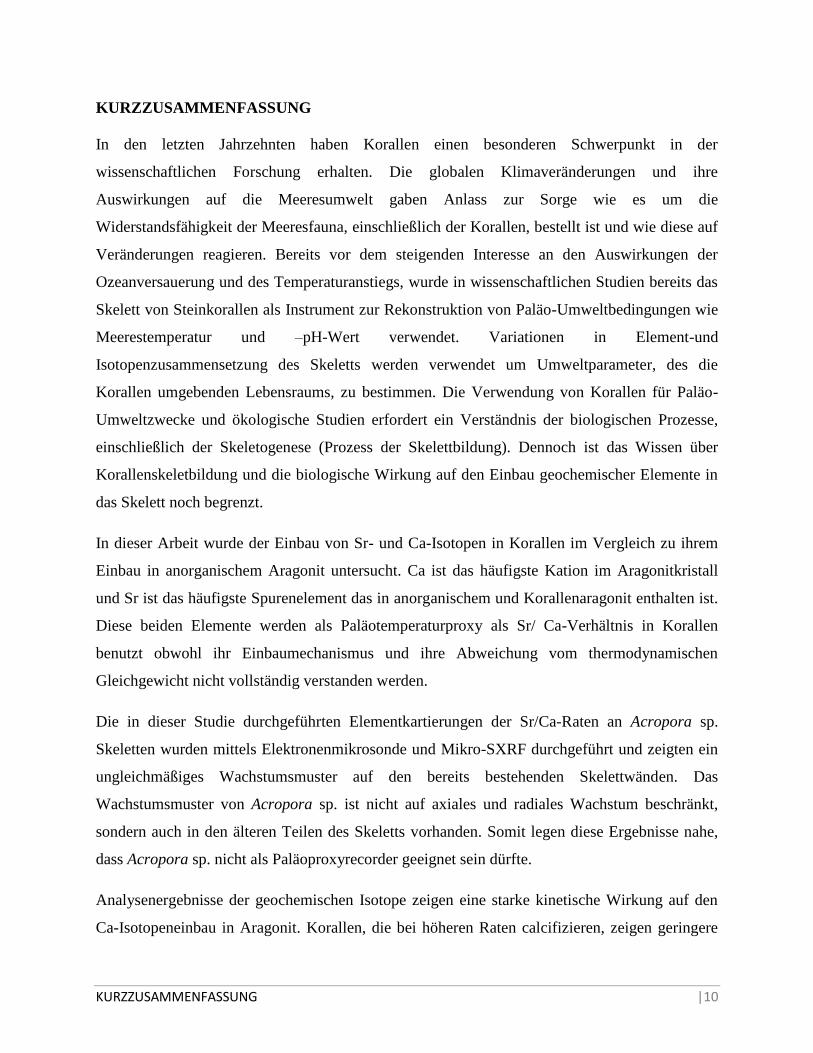
In den letzten Jahrzehnten haben Korallen einen besonderen Schwerpunkt in der
wissenschaftlichen Forschung erhalten. Die globalen Klimaveränderungen und ihre
Auswirkungen auf die Meeresumwelt gaben Anlass zur Sorge wie es um die
Widerstandsfähigkeit der Meeresfauna, einschließlich der Korallen, bestellt ist und wie diese auf
Veränderungen reagieren. Bereits vor dem steigenden Interesse an den Auswirkungen der
Ozeanversauerung und des Temperaturanstiegs, wurde in wissenschaftlichen Studien bereits das
Skelett von Steinkorallen als Instrument zur Rekonstruktion von Paläo-Umweltbedingungen wie
Meerestemperatur und –pH-Wert verwendet. Variationen in Element-und
Isotopenzusammensetzung des Skeletts werden verwendet um Umweltparameter, des die
Korallen umgebenden Lebensraums, zu bestimmen. Die Verwendung von Korallen für Paläo-
Umweltzwecke und ökologische Studien erfordert ein Verständnis der biologischen Prozesse,
einschließlich der Skeletogenese (Prozess der Skelettbildung). Dennoch ist das Wissen über
Korallenskeletbildung und die biologische Wirkung auf den Einbau geochemischer Elemente in
das Skelett noch begrenzt.
In dieser Arbeit wurde der Einbau von Sr- und Ca-Isotopen in Korallen im Vergleich zu ihrem
Einbau in anorganischem Aragonit untersucht. Ca ist das häufigste Kation im Aragonitkristall
und Sr ist das häufigste Spurenelement das in anorganischem und Korallenaragonit enthalten ist.
Diese beiden Elemente werden als Paläotemperaturproxy als Sr/ Ca-Verhältnis in Korallen
benutzt obwohl ihr Einbaumechanismus und ihre Abweichung vom thermodynamischen
Gleichgewicht nicht vollständig verstanden werden.
Die in dieser Studie durchgeführten Elementkartierungen der Sr/Ca-Raten an Acropora sp.
Skeletten wurden mittels Elektronenmikrosonde und Mikro-SXRF durchgeführt und zeigten ein
ungleichmäßiges Wachstumsmuster auf den bereits bestehenden Skelettwänden. Das
Wachstumsmuster von Acropora sp. ist nicht auf axiales und radiales Wachstum beschränkt,
sondern auch in den älteren Teilen des Skeletts vorhanden. Somit legen diese Ergebnisse nahe,
dass Acropora sp. nicht als Paläoproxyrecorder geeignet sein dürfte.
Analysenergebnisse der geochemischen Isotope zeigen eine starke kinetische Wirkung auf den
Ca-Isotopeneinbau in Aragonit. Korallen, die bei höheren Raten calcifizieren, zeigen geringere
KURZZUSAMMENFASSUNG |11
Fraktionierung als anorganischer Aragonit. Diese Beobachtung impliziert eine direkte Steuerung
der Korallenphysiologie auf die Rate des Skelettwachstums und als Folge davon auf die Ca-
Isotopenfraktionierung. Im Gegensatz dazu, ist die Sr-Isotopenfraktionierung nicht durch die
Rate beeinflusst und zeigt keine Variation zwischen anorganischem und Korallenaragonit. Durch
die Ähnlichkeit in der Sr-Isotopenfraktionierung zwischen anorganischem und Korallenaragonit,
kann das rayleighbasierte Multi-Element-Model als Erklärung für den
Korallencalcifizierungsprozess ausgeschlossen werden.
CHAPTER I- INTRODUCTION |12
CHAPTER I. INTRODUCTION
Stony corals, which are termed scleractinians, are a crucial organism in the existence of
the marine ecosystem (Smith, 1978). They form thriving reefs in continental shelves of
oligotrophic zones and enable the subsistence of many of the marine fauna (Hallock and
Schlager, 1986; Stanley, 2006). In addition, they have an important role in the global carbon
cycle as about 50% of the CaCO3 production in the ocean is made in the reef areas (Smith, 1978;
Milliman, 1993). Over the last decades scleractinians have been widely applied as proxies for
paleo-climate reconstructions. The scleractinians are considered to have many advantages as
paleo-climate proxies for their prolonging life over centuries and for their unique skeleton
composition and structure. The scleractinians’ skeleton contains a continuous record of the
environmental conditions prevailed during their growth. In most of the scleractinians the
skeleton consists of seasonal banding that enables to determine the growth period of the skeleton.
In many cases fossil corals are well preserved and can be used to reconstruct paleo-climate
proxies together with an accurate dating of the skeleton.
The use of geochemical elements and isotopes in corals’ skeletons for climate parameters
reconstruction purposes is dependent on understanding the calcification mechanisms. Similarly,
the effect of the atmospheric CO2 increase on corals calcification process can be comprehended
better if the mechanism of calcification was understood. Many attempts are made to decipher the
calcification mechanism in corals (e.g. Allemand et al., 2004; Gaetani and Cohen, 2006;
Holcomb et al., 2009; Tambutté et al., 2011). Despite these efforts, there is still a poor
knowledge of the mechanism of corals’ skeleton formation. In my work I will try to shed some
light on the geochemical perspective of corals’ calcification process by comparing elemental
ratio and isotopes (Sr/Ca, 88
Sr/86
Sr and 44
Ca/40
Ca) incorporation in inorganic aragonite and in
corals’ skeletons.
Scleractinian Physiology
The Polyp
Scleractinians are mostly colonial and hermatypic (contains symbiotic photosynthetic
algae), and therefore are restricted to warm (above 18°C) and shallow water in the tropics and
CHAPTER I- INTRODUCTION |13
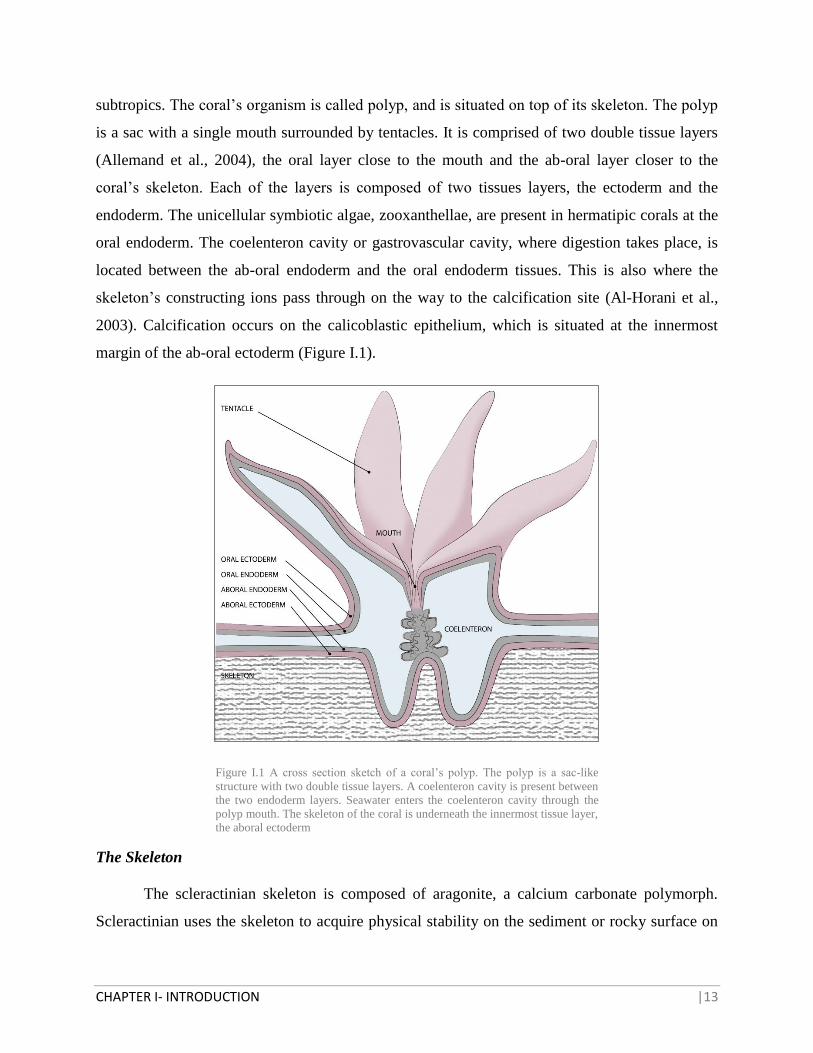
subtropics. The coral’s organism is called polyp, and is situated on top of its skeleton. The polyp
is a sac with a single mouth surrounded by tentacles. It is comprised of two double tissue layers
(Allemand et al., 2004), the oral layer close to the mouth and the ab-oral layer closer to the
coral’s skeleton. Each of the layers is composed of two tissues layers, the ectoderm and the
endoderm. The unicellular symbiotic algae, zooxanthellae, are present in hermatipic corals at the
oral endoderm. The coelenteron cavity or gastrovascular cavity, where digestion takes place, is
located between the ab-oral endoderm and the oral endoderm tissues. This is also where the
skeleton’s constructing ions pass through on the way to the calcification site (Al-Horani et al.,
2003). Calcification occurs on the calicoblastic epithelium, which is situated at the innermost
margin of the ab-oral ectoderm (Figure I.1).
Figure I.1 A cross section sketch of a coral’s polyp. The polyp is a sac-like
structure with two double tissue layers. A coelenteron cavity is present between
the two endoderm layers. Seawater enters the coelenteron cavity through the
polyp mouth. The skeleton of the coral is underneath the innermost tissue layer,
the aboral ectoderm
The Skeleton
The scleractinian skeleton is composed of aragonite, a calcium carbonate polymorph.
Scleractinian uses the skeleton to acquire physical stability on the sediment or rocky surface on
CHAPTER I- INTRODUCTION |14
which they live. Aragonite calcification is a hundred times faster than inorganic aragonite
precipitation (Cohen and McConnaughey, 2003). The high calcification rates enable corals to
cope with the dissolution and erosion processes, and to expand their colonies (Cohen and
McConnaughey, 2003).
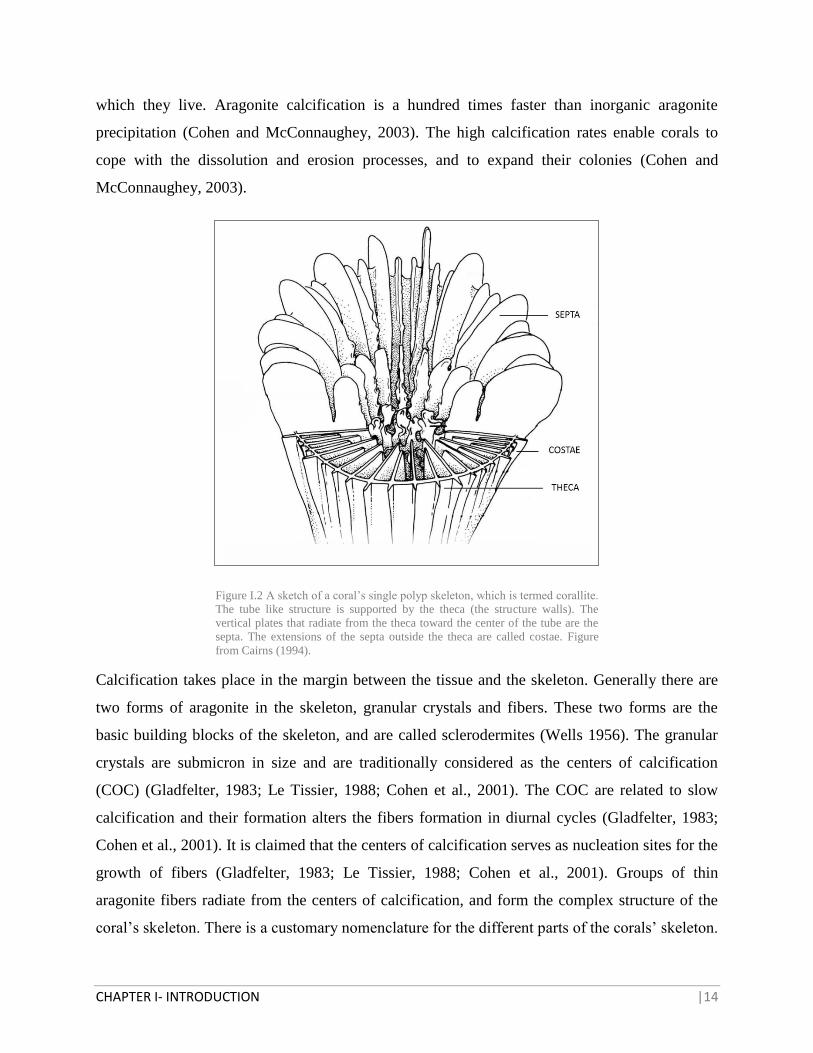
Figure I.2 A sketch of a coral’s single polyp skeleton, which is termed corallite.
The tube like structure is supported by the theca (the structure walls). The
vertical plates that radiate from the theca toward the center of the tube are the
septa. The extensions of the septa outside the theca are called costae. Figure
from Cairns (1994).
Calcification takes place in the margin between the tissue and the skeleton. Generally there are
two forms of aragonite in the skeleton, granular crystals and fibers. These two forms are the
basic building blocks of the skeleton, and are called sclerodermites (Wells 1956). The granular
crystals are submicron in size and are traditionally considered as the centers of calcification
(COC) (Gladfelter, 1983; Le Tissier, 1988; Cohen et al., 2001). The COC are related to slow
calcification and their formation alters the fibers formation in diurnal cycles (Gladfelter, 1983;
Cohen et al., 2001). It is claimed that the centers of calcification serves as nucleation sites for the
growth of fibers (Gladfelter, 1983; Le Tissier, 1988; Cohen et al., 2001). Groups of thin
aragonite fibers radiate from the centers of calcification, and form the complex structure of the
coral’s skeleton. There is a customary nomenclature for the different parts of the corals’ skeleton.
CHAPTER I- INTRODUCTION |15
The skeleton of each polyp in the colony is termed corallite (Figure I.2). Each corallite is
connected to adjacent corallites by the coenostea. The corallite itself is a tube shape with walls
that are termed theca. From the theca toward the center of the corallite radiate vertical plates that
are called septa, the extensions of the septa outside the theca are costae. Only the few upper
millimeters of the corallite is the active skeleton that is directly connected to the polyp's tissue.
As the colony grows, the polyps are being pushed higher leaving the old skeleton surface
inactive. This growth upwards creates the axial growth and the growth bands that are visible in
most scleractinians.
Calcification Process Models
The high rates of calcification and the complex skeleton structure together with the non-
equilibrium state of the isotopic composition (McConnaughey, 1989; Adkins et al., 2003)
intrigued scientists to understand the mechanism of corals’ calcification. The differences
between coral calcification and inorganic aragonite precipitation are controlled by the organism’s
biology, and were termed ‘the vital effect’(Weber and Woodhead, 1972). Coral’s skeleton is
precipitated extracellularly in the calicoblastic fluid (ECF) at the interface between the aboral
ectoderm and the existing skeleton (Clode and Marshall, 2002a; Allemand et al., 2004; Tambutté
et al., 2007). There are generally two theories that approach the transport pathways to the
calcifying fluid. Some studies claim that ions are transported in transcellular pathway
(Krishnaveni et al., 1989; Tambutté et al., 1996), while other studies support a passive
paracellular transport (Erez and Braun, 2007; Gagnon et al., 2012; Tambutté et al., 2012). The
transcellular pathway is an active transport, in which ions are carried through the cells using
designated enzymes. The enzyme that is responsible for Ca transport is called Ca2+
-ATPase. The
activity of this enzyme is detected in eukaryotic cells (Strehler and Zacharias, 2001) including
corals. Al-Horani et al. (2003) proposed a mechanism that correlates the enzyme activity to
calcification process. According to them, Ca2+
is transported from the cells to the ECF, and in
exchange H+ is transported out of the calciblastic fluid. In this manner, Ca
2+ concentration
increases in the ECF and the pH increases causing inorganic carbon system to shift toward
increasing concentration of the CO32-
species. According to this model an additional amount of
carbon diffuses to the ECF as CO2 from respiration and is converted to CO32-
due to the high pH
conditions (Goreau, 1977; Erez, 1978; Furla et al., 2000). The supporting observations for this
CHAPTER I- INTRODUCTION |16
model include pH and Ca2+
concentration measurements of the ECF (Al-Horani et al., 2003), as
well as the use of Ca2+
-ATPase and ruthenium red inhibitors that cause a significant decrease in
corals calcification (Krishnaveni et al., 1989; Marshall, 1996; Allison et al., 2011). While the
transcellular pathway model is supported by several observations and experiments, other studies
supply supporting observations for paracellular pathway mechanism. Erez and Braun (2007) and
Tambutté et al. (2012) provided a supporting evidence for paracellular transport using Calcein
and FITC-Dextran dyes. These dyes molecules that are used to label calcification have a large
diameter that cannot pass through cells in transcellular pathway, and therefore, can pass only
between the cells. Gagnon et al. (2012) observe synchronous incorporation of Ca, Sr, Ba and Tb
in the coral’s skeleton and assume that it is more likely to indicate a paracellular transport rather
than different pathways that acts similarly on different elements.
Trace elements and Isotopes Incorporation in the Coral’s Skeleton
The deviation of trace elements and isotopes incorporation in corals compared to their
incorporation in inorganic aragonite is an obstacle for paleo-climate reconstruction but can be a
useful tool for studying the mechanism of corals’ calcification. Several hypotheses were
proposed for calcification mechanism to explain the elements incorporation differences between
corals and inorganic aragonite. Disequilibrium precipitation of carbonate in marine organisms
was first detected on δ13
C and δ18
O (Urey, 1947). Also the Ca uptake in corals was investigated
and isotopic disequilibrium was found when 45
Ca was added to the corals’ experimental
environment (Goreau and Bowen, 1955; Goreau and Goreau, 1960; Erez, 1978). Over the years
δ18
O and Sr/Ca became important paleo-temperature proxies in corals (e.g. Weber and
Woodhead, 1972; Beck et al., 1992). Yet, the explanation for the disequilibrium effect was not
found, and at the same time that these proxies are used to reconstruct paleo-temperature other
researches try to model their incorporation mechanism. For example, in carbon incorporation it is
hypothesized that photosynthesis and respiration alters the isotopic composition of C in corals
(Goreau, 1959; Erez, 1978; McConnaughey, 1989). Erez (1978) and Adkins et al. (2003)
suggested that C composition in corals is a result of a mixture of a metabolic source with
isotopically lighter composition and an equilibrium seawater source.
Ca is a major component in CaCO3 crystal as it comprises ~40% of the crystal’s molar mass. Sr
is a trace element that incorporates into the CaCO3 crystal. The element binds to the CO32-
ion
CHAPTER I- INTRODUCTION |17
and substitutes the Ca. The incorporation of Sr into inorganic aragonite and corals’ aragonite is
about 1% of the crystal’s molar mass. The Sr/Ca ratios in corals and marine inorganic aragonite
are close to seawater composition, meaning that the partitioning coefficient of Sr (KDSr,a) is close
to unity. Sr/Ca ratio in corals is temperature dependent, but displays significantly different
Sr/Ca- temperature slopes between inorganic aragonite and corals (Dietzel et al., 2004). The
different partitioning coefficients of Mg/Ca and Sr/Ca in corals compared to inorganic aragonite
are claimed to occur due to Rayleigh distillation effect (Gaetani and Cohen, 2006; Gaetani et al.,
2011). According to this proposed model, seawater enters the site of calcification in a passive
paracellular pathway, but is slightly modified by active enzyme pumps and ion transport
channels. After entering the calcification site the precipitation takes place as an inorganic process
from a renewable finite solution. Gagnon et al., (2007) offered an explanation for calcification
process in the COC’s. While they agree that the growth of the fiber aragonite crystals in the coral
is a result of a Rayleigh effect, they claim that the COC’s are formed in a different process that
induces higher Mg/Ca ratios. They proposed that either biomolecules or organic matrix are
involved in calcification of the COC’s or that high rate precipitation following the inorganic
surface entrapment model (Watson, 2004) is responsible for the calcification. Despite these many
efforts, there is no satisfactory explanation for the mechanism of trace elements and isotopes
incorporation in corals’ skeletons.
Sr and Ca Isotopes Incorporation in CaCO3
Recent advances in the analytical abilities and development of new analytical methods
such as the double spike method enabled investigating small variations in isotopic ratios that
could not be detected till then. Two of such isotopic systems are 44
Ca/40
Ca and 88
Sr/86
Sr. The use
of the double spike method is possible for elements that have at least four stable isotopes. Two of
these isotopes are added as a double spike with a known isotopic ratio, and other two isotopes are
measured as the sample’s analyte. Both Ca isotopes and Sr isotopes are reported in the δ notation
normalized to the element’s standard (NIST SRM915a and SRM NBS987, respectively).
⁄ ( ⁄
⁄
) Eq. I.1
⁄ ( ⁄
⁄
) Eq. I.2
CHAPTER I- INTRODUCTION |18
Sr Isotopes
88Sr/
86Sr ratios were used until recently only as a constant value (
88Sr/
86Sr=8.375209,
which is the accepted value of the Sr standard SRM987) to correct the well-established sediment
origin reconstruction method of 87
Sr/86
Sr (e.g. Dasch, 1969) and the dating method of 87
Rb/86
Sr.
Even before applying the double spike technique, significant variations in 88
Sr/86
Sr ratios were
detected in both marine and terrestrial environments (Fietzke and Eisenhauer, 2006; Halicz et al.,
2008). It was discovered that 88
Sr/86
Sr in marine carbonates and corals in particular is
significantly lighter than seawater, meaning that the carbonates tend to favor incorporation of the
light isotope. Few early researches found correlation between 88
Sr/86
Sr isotopes and temperature
in corals (Fietzke and Eisenhauer, 2006; Rüggeberg et al., 2008). These studies used the
bracketing method on MC-ICP-MS. However, later studies could not repeat this observation
(Halicz et al., 2008; Raddatz et al., 2013). The double spike method in Sr isotopes was developed
to correct for the fractionation occurring during sample preparation and analytical measurement
(Krabbenhöft et al., 2009). The double spike solution is a mixture of 87
Sr and 84
Sr with a known
and calibrated ratio value, and is added to the sample solution before the sample preparation
process. Even though introducing the double spike method on Sr isotopes measurements
(Krabbenhöft et al., 2009) improved significantly the analytical error by a factor of 2-3, a
temperature relation to 88
Sr/86
Sr in L. pertusa, could not be reproduced (Raddatz et al., 2013).
Ca Isotopes
Ca isotopes were used from the 1950’s as a tool to investigate the Ca uptake in corals
(Goreau and Bowen, 1955; Goreau and Goreau, 1960; Erez, 1978). The synthetic and radioactive
45Ca was added to the bulk solution, and the
45Ca uptake by the polyp was counted using G-M
tubes (Geiger-Müller Tube). Measuring small variations in stable Ca isotopes became possible
with the analytical improvements of the Thermal Ionization Mass Spectrometry (TIMS) and the
Inductively Coupled Plasma Mass Spectrometry (ICP-MS). The double spike method, using
43Ca/
48Ca ratios, was applied for Ca measurements on the multi collector TIMS (Heuser et al.,
2002), even though other double spikes were tested and are being used as well ((42
Ca/48
Ca
(Russell and Papanastassiou, 1978; Zhu and Macdougall, 1998) and 42
Ca/43
Ca (Gopalan et al.,
2006)). Similar to Sr isotopes fractionation, marine carbonates tend to be significantly lighter in
CHAPTER I- INTRODUCTION |19
Ca isotopes than the bulk seawater from which they precipitate. Several studies reported a
temperature dependence on Ca isotopes fractionation in inorganic aragonite (Gussone et al.,
2003; Niedermayr, 2011), inorganic calcite (Marriott et al., 2004; Tang et al., 2008), foraminifera
(Zhu and Macdougall, 1998; Nägler et al., 2000; Gussone et al., 2003), and even in corals (Böhm
et al., 2006). The Ca isotopes-temperature correlation is positive, meaning that as temperature
increases the isotopic composition of the carbonate becomes heavier and less fractionated.
A special focus on Ca isotopes is attained in studies of mechanism of inorganic calcite
precipitation. Many studies try to understand the process of crystallization in the interface
between the existing crystal and the solution, and Ca isotopes are used to test these models. The
surface entrapment model, SEMO (Watson, 2004), claims that the trace elements concentration
in the new growth of the calcite crystal is a result of a competition between the growth rate and
the elements’ diffusivity from the crystal. The model was tested and verified on Ca isotopes in
inorganic calcite (Tang et al., 2008). According to the SEMO model, the surface of the calcite
crystal entraps the light 40
Ca isotope and discriminate the heavy 44
Ca isotope. This kinetically
controlled process is balanced by a re-equilibration process of solid state diffusion of 44
Ca into
the surface layer, which is strongly dependent on the rate of precipitation. DePaolo (2011)
proposes the surface reaction model and criticized the SEMO model. He claims that the solid
state diffusion in moderate temperatures is too slow to be considered as competitive with the
precipitation rate. The surface reaction model is proposing a balance between forward
(attachment) and backward reactions (detachment), each with different fractionations. Both of
the described models are explaining the general negative correlation between the rate of calcite
formation and 44
Ca/40
Ca ratio in the calcite. However, one obtained a positive 44
Ca/40
Ca -
precipitation rate correlation in inorganic calcite (Lemarchand et al., 2004). The positive
correlation was later explained as precipitation from highly oversaturated solutions, where calcite
grows by the formation of amorphous calcium carbonate (ACC) (Nielsen et al., 2012). Data of
Ca isotopes in inorganic aragonite show a positive 44
Ca/40
Ca - precipitation rate correlation,
which is opposite to the two described models (Gussone et al., 2005; Niedermayr, 2011). The
difference in the behavior of Ca isotopes incorporation in inorganic aragonite and calcite can be
used to explain the corals’ biological calcification mechanism when compared to corals Ca
isotopes data.
CHAPTER I- INTRODUCTION |20
In conclusion, Sr and Ca isotopes measurements in corals can provide another perspective on the
incorporation mechanism of one of the most important marine paleo-proxy, Sr/Ca. Through these
isotopes and their different incorporation properties we can learn about the mechanism of
calcification in corals as compared to inorganic precipitation.
Thesis Structure
In this thesis I provide a geochemical perspective on the process of corals calcification
using Sr and Ca isotopes and Sr/Ca ratios. The thesis is divided into chapters, which are
manuscripts intended to be sent to scientific journals in the next few months.
Chapter II – Sr/Ca distribution in Acropora sp. coral as observed in elemental mapping using
Electron Microprobe and Synchrotron X-ray fluorescence micro analyses. A significantly
different Sr/Ca ratio in the bulk solution of the pre-experiement and the experiment conditions,
resulted in two distinctive Sr/Ca ratios in the corals’ skeletons. The results show a patchy
calcification pattern. Calcification that is not restricted only to the normal axial and radial growth
known in other coral genus (e.g. Porites spp., Pocillopora spp.), but is present also in contact of
old skeleton that is no longer active.
Chapter III – δ88/86
Sr results in inorganic aragonite and various coral species show high
fractionation from the bulk seawater. The corals and the inorganic aragonite incorporate at the
same extent in which the light, 86
Sr, isotope is preferred over the heavy, 88
Sr, isotope. As
opposed to previous studies on δ88/86
Sr in corals, we observe no correlation between δ88/86
Sr and
temperature. In addition, the previously proposed Rayleigh based model for mechanism of coral
calcification is applied on Sr isotopes. Despite the promising results in trace elements, the model
cannot predict the 88
Sr/86
Sr incorporation in corals.
Chapter IV –δ44/40
Ca was measured on Acropora sp. corals and inorganic aragonite that was
precipitated from natural seawater. The inorganic and corals were precipitated at different
temperatures and different saturation states of the solutions. Comparison of the inorganic
aragonite results with previous studies indicates no effect of ionic strength and salinity on the
aragonite δ44/40
Ca. In addition, a strong kinetic effect was observed in δ44/40
Ca in inorganic
aragonite. The significant lighter 44
Ca/40
Ca ratio in corals is interpreted here as a kinetic effect of
very high rates of aragonite formation.
CHAPTER I- INTRODUCTION |21
References
Adkins J. F., Boyle E. A., Curry W. B. and Lutringer A. (2003) Stable isotopes in deep-sea
corals and a new mechanism for “vital effects”. Geochim. Cosmochim. Acta 67, 1129–1143.
Al-Horani F. A., Al-Moghrabi S. M. and De Beer D. (2003) The mechanism of calcification and
its relation to photosynthesis and respiration in the scleractinian coral Galaxea fascicularis.
Mar. Biol. 142, 419–426.
Allemand D., Ferrier-Pagès C., Furla P., Houlbrèque F., Puverel S., Reynaud S., Tambutté É.,
Tambutté S. and Zoccola D. (2004) Biomineralisation in reef-building corals: from
molecular mechanisms to environmental control. Comptes Rendus Palevol 3, 453–467.
Allison N., Cohen I., Finch A. A. and Erez J. (2011) Controls on Sr/Ca and Mg/Ca in
scleractinian corals: The effects of Ca-ATPase and transcellular Ca channels on skeletal
chemistry. Geochim. Cosmochim. Acta 75, 6350–6360.
Beck J. W., Edwards R. L., Ito E., Taylor F. W., Recy J., Rougerie F., Joannot P. and Henin C.
(1992) Sea-surface temperature from coral skeletal strontium/calcium ratios. Science (80-. ).
257, 644–7.
Böhm F., Gussone N., Eisenhauer A., Dullo W. C., Reynaud S. and Paytan A. (2006) Calcium
isotope fractionation in modern scleractinian corals. Geochim. Cosmochim. Acta 70, 4452–
4462.
Clode P. L. and Marshall A. T. (2002) Low temperature FESEM of the calcifying interface of a
scleractinian coral. Tissue Cell 34, 187–198.
Cohen A. L., Layne G. D., Hart S. R. and Lobel P. S. (2001) Kinetic control of skeletal Sr/Ca in
a symbiotic coral: Implications for the paleotemperature proxy. Paleoceanography 16, 20–
26.
Cohen A. L. and McConnaughey T. A. (2003) Geochemical perspectives on coral
mineralization. Rev. Mineral. Geochemistry 54, 151–187.
Dasch E. J. (1969) Strontium isotopes in weathering profiles, deep-sea sediments, and
sedimentary rocks. Geochim. Cosmochim. Acta 33, 1521–1552.
DePaolo D. J. (2011) Surface kinetic model for isotopic and trace element fractionation during
precipitation of calcite from aqueous solutions. Geochim. Cosmochim. Acta 75, 1039–1056.
Dietzel M., Gussone N. and Eisenhauer A. (2004) Co-precipitation of Sr2+
and Ba2+
with
aragonite by membrane diffusion of CO2 between 10 and 50°C. Chem. Geol. 203, 139–151.
CHAPTER I- INTRODUCTION |22
Erez J. (1978) Vital effect on stable-isotope composition seen in foraminifera and coral
skeletons. Nature 273, 199–202.
Erez J. and Braun A. (2007) Calcification in hermatypic corals is based on direct seawater supply
to the biomineralization site. Geochim. Cosmochim. Acta 71, SA260.
Fietzke J. and Eisenhauer A. (2006) Determination of temperature-dependent stable strontium
isotope (88
Sr/86
Sr) fractionation via bracketing standard MC-ICP-MS. Geochemistry
Geophys. Geosystems 7.
Furla P., Galgani I., Durand I. and Allemand D. (2000) Sources and mechanisms of inorganic
carbon transport for coral calcification and photosynthesis. J. Exp. Biol. 203, 3445–57.
Gaetani G. A. and Cohen A. L. (2006) Element partitioning during precipitation of aragonite
from seawater: A framework for understanding paleoproxies. Geochim. Cosmochim. Acta
70, 4617–4634.
Gaetani G. A., Cohen A. L., Wang Z. and Crusius J. (2011) Rayleigh-based, multi-element coral
thermometry: A biomineralization approach to developing climate proxies. Geochim.
Cosmochim. Acta 75, 1920–1932.
Gagnon A. C., Adkins J. F. and Erez J. (2012) Seawater transport during coral biomineralization.
Earth Planet. Sci. Lett. 329-330, 150–161.
Gagnon A. C., Adkins J. F., Fernandez D. and Robinson L. (2007) Sr/Ca and Mg/Ca vital effects
correlated with skeletal architecture in a scleractinian deep-sea coral and the role of
Rayleigh fractionation. Earth Planet. Sci. Lett. 261, 280–295.
Gladfelter E. H. (1983) Skeletal development in Acropora cervicornis. II. Diel patterns of
calcium carbonate accretion. Coral Reefs 2, 91–100.
Gopalan K., Macdougall J. D. and Macisaac C. (2006) Evaluation of a 42Ca –43Ca double-spike
for high precision Ca isotope analysis. Int. J. Mass Spectrom. 248, 9–16.
Goreau T. F. (1959) The physiology of skeleton formation in corals. I. A method for measuring
the rate of calcium deposition by corals under different conditions. Biol. Bull 116, 59–75.
Goreau T. F. and Bowen V. T. (1955) Calcium uptake by a coral. Science (80-. ). 122, 1188–
1189.
Goreau T. F. and Goreau N. I. (1960) physiology of skeleton formation in corals. IV. On isotopic
equilibrium exchanges of calcium between corallum and environment in living and dead
reef-building corals. Biol. Bull. 416–427.
CHAPTER I- INTRODUCTION |23
Goreau T. J. (1977) Coral skeletal chemistry: physiological and environmental regulation of
stable isotopes and trace metals in Montastrea annularis. Proc. R. Soc. London. Ser. B 196,
291–315.
Gussone N., Böhm F., Eisenhauer A., Dietzel M., Heuser A., Teichert B. M. A., Reitner J. and
Dullo W. C. (2005) Calcium isotope fractionation in calcite and aragonite. Geochim.
Cosmochim. Acta 69, 4485– 4494.
Gussone N., Eisenhauer A., Heuser A., Dietzel M., Bock B., Böhm F., Spero H. J., Lea D. W.,
Bijma J. and Nägler T. F. (2003) Model for kineticeffects on calciumisotopefractionation
(δ44
Ca) in inorganic aragonite and cultured planktonic foraminifera. Geochim. Cosmochim.
Acta 67, 1375–1382.
Halicz L., Segal I., Fruchter N., Stein M. and Lazar B. (2008) Strontium stable isotopes
fractionate in the soil environments? Earth Planet. Sci. Lett. 272, 406–411.
Hallock P. T. and Schlager W. (1986) Nutrient Excess and the Demise of Coral Reefs and
Carbonate Platforms. Palaios 1, 389.
Heuser A., Eisenhauer A., Gussone N., Bock B., Hansen B. T. and Nägler T. F. (2002)
Measurement of calcium isotopes (δ44
Ca) using a multicollector TIMS technique. Int. J.
Mass Spectrom. 220, 385–397.
Holcomb M., Cohen A. L., Gabitov R. I. and Hutter J. L. (2009) Compositional and
morphological features of aragonite precipitated experimentally from seawater and
biogenically by corals. Geochim. Cosmochim. Acta 73, 4166–4179.
Krabbenhöft A., Fietzke J., Eisenhauer A., Liebetrau V., Böhm F. and Vollstaedt H. (2009)
Determination of radiogenic and stable strontium isotope ratios (87
Sr/86
Sr; δ88/86
Sr) by
thermal ionization mass spectrometry applying an 87
Sr/84
Sr double spike. J. Anal. At.
Spectrom. 24, 1267.
Krishnaveni P., Chou L. and Ip Y. K. (1989) Deposition of calcium (45
Ca2+
) in the coral, Galaxea
fascicularis. Comp. Biochem. Physiol. Part A Physiol. 94, 509–513.
Lemarchand D., Wasserburg G. J. and Papanastassiou D. A. (2004) Rate-controlled calcium
isotope fractionation in synthetic calcite. Geochim. Cosmochim. Acta 68, 4665–4678.
Marriott C. S., Henderson G. M., Belshaw N. S. and Tudhope A. W. (2004) Temperature
dependence of δ7Li, δ
44Ca and Li/Ca during growth of calcium carbonate. Earth Planet. Sci.
Lett. 222, 615–624.
Marshall A. T. (1996) Calcification in Hermatypic and Ahermatypic Corals. Science (80-. ). 271,
637–639.
CHAPTER I- INTRODUCTION |24
McConnaughey T. A. (1989) 13C and 18O isotopic disequilibrium in biological carbonates: I.
Patterns. Geochim. Cosmochim. Acta 53, 151–162.
Milliman J. D. (1993) Production and accumulation of calcium carbonate in the ocean: Budget of
a nonsteady state. Global Biogeochem. Cycles 7, 927–957.
Nägler T. F., Eisenhauer A., Müller A., Hemleben C. and Kramers J. (2000) The δ44
Ca-
temperature calibration on fossil and cultured Globigerinoides sacculifer : New tool for
reconstruction of past sea surface temperatures. Geochemistry Geophys. Geosystems 1.
Niedermayr A. (2011) Effects of magnesium , polyaspartic acid , carbonate accumulation rate
and temperature on the crystallization , morphology , elemental incorporation and isotopic
fractionation of calcium carbonate phases.
Nielsen L. C., DePaolo D. J. and De Yoreo J. J. (2012) Self-consistent ion-by-ion growth model
for kinetic isotopic fractionation during calcite precipitation. Geochim. Cosmochim. Acta
86, 166–181.
Raddatz J., Liebetrau V., Rüggeberg A., Hathorne E. C., Krabbenhöft A., Eisenhauer A., Böhm
F., Vollstaedt H., Fietzke J., López Correa M., Freiwald A. and Dullo W.-C. (2013) Stable
Sr-isotope, Sr/Ca, Mg/Ca, Li/Ca and Mg/Li ratios in the scleractinian cold-water coral
Lophelia pertusa. Chem. Geol. 352, 143–152.
Rüggeberg A., Fietzke J., Liebetrau V., Eisenhauer A., Dullo W. C. and Freiwald A. (2008)
Stable strontium isotopes (δ88/86Sr) in cold-water corals — A new proxy for reconstruction
of intermediate ocean water temperatures. Earth Planet. Sci. Lett. 269, 570–575.
Russell W. A. and Papanastassiou D. A. (1978) Calcium isotope fractionation in ion-exchange
chromatography. Anal. Chem.
Smith S. V. (1978) Coral-reef area and the contributions of reefs to processes and resources of
the world’s oceans. Nature 273, 225–226.
Stanley G. D. (2006) Photosymbiosis and the Evolution of Modern Coral Reefs Auxin Transport
, but. Science (80-. ). 312.
Strehler E. E. and Zacharias D. a (2001) Role of alternative splicing in generating isoform
diversity among plasma membrane calcium pumps. Physiol. Rev. 81, 21–50.
Tambutté É., Allemand D., Müller E. and Juabert J. (1996) A compartmental approach to the
mechanism of calcification in hermatypic corals. J. Exp. Biol. 1041, 1029–1041.
Tambutté É., Allemand D., Zoccola D., Meibom A., Lotto S., Caminiti N. and Bénazet-Tambutté
S. (2007) Observations of the tissue-skeleton interface in the scleractinian coral Stylophora
pistillata. Coral Reefs 26, 517–529.
CHAPTER I- INTRODUCTION |25
Tambutté É., Tambutté S., Segonds N., Zoccola D., Venn A., Erez J. and Allemand D. (2012)
Calcein labelling and electrophysiology: insights on coral tissue permeability and
calcification. Proc. R. Soc. B Biol. Sci. 279, 19–27.
Tambutté S., Holcomb M., Ferrier-Pagès C., Reynaud S., Tambutté É., Zoccola D. and Allemand
D. (2011) Coral biomineralization: From the gene to the environment. J. Exp. Mar. Bio.
Ecol. 408, 58–78.
Tang J., Dietzel M., Böhm F., Köhler S. J. and Eisenhauer A. (2008) Sr2+
/Ca2+
and 44
Ca/40
Ca
fractionation during inorganic calcite formation: II. Ca isotopes. Geochim. Cosmochim.
Acta 72, 3733–3745.
Le Tissier M. A. A. (1988) Patterns of formation and the ultrastructure of the larval skeleton of
Pocillopora damicornis. Mar. Biol. 98, 493–501.
Urey H. C. (1947) The thermodynamic properties of isotopic substances. J. Chem. Soc. 561–581.
Watson E. B. (2004) A conceptual model for near-surface kinetic controls on the trace-element
and stable isotope composition of abiogenic calcite crystals1. Geochim. Cosmochim. Acta
68, 1473–1488.
Weber J. N. and Woodhead P. M. J. (1972) Temperature dependence of oxygen-18 concentration
in reef coral carbonates. J. Geophys. Res. 77, 463.
Zhu P. and Macdougall J. D. (1998) Calcium isotopes in the marine environment and the oceanic
calcium cycle. Geochim. Cosmochim. Acta 62, 1691–1698.
CHAPTER II. PATCHY CALCIFICATION PATTERN IN
ACROPORA SP. DETERMINED BY ELECTRON MICROPROBE
AND MICRO-SXRF ELEMENT MAPPINGS USING TWO
DISTINCT Sr ELEMENT CONCENTRATIONS
Noa Fruchter1*
, Anton Eisenhauer1, Thor Hansteen
1, Jan Fietzke
1, Florian Böhm
1, Karen Appel
2,
Jonathan Erez3
1 GEOMAR, Helmholtz-Zentrum für Ozeanforschung Kiel, Wischhofstr. 1-3, 24148 Kiel, Germany
2 Deutsches Elektronen-Synchrotron Notkestraße 85, D-22607 Hamburg, Germany
3 The Hebrew University, The Edmond J. safra Campus Givat Ram Jerusalem, Israel
*Present address: Geological Survey of Israel, Malkhei Israel 30 Jerusalem, Israel
In preparation, to be submitted to Coral Reef
CHAPTER II- PATCHY CALCIFICATION PATTERN IN ACROPORA SP. |27
Abstract
Electron microprobe and synchrotron X-ray fluorescence micro-analyses were used to
study the calcification pattern of Acropora sp.. Specimens of Acropora sp. were cultured in two
stages at two distinct Sr concentrations in the bulk solutions, where the low concentrations
represent the pre-experiment and the high concentrations represent the conditions during the
experiments. The experimental, high concentrations, Sr comprise both patches on the pre-
existing skeleton walls and growth extensions of the skeleton. We show a clear visualization of
the patchy calcification pattern in Acropora. We assume that the precipitation in older parts of
the skeleton is biogenically controlled. That secondary infilling calcification reduces the porosity
and increases the stability of the skeleton.
Introduction
Scleractinia (stony corals) have a broad application in geochemistry as paleo-proxy
recorder. Their aragonite skeleton records the marine conditions through changes in trace
elements (e.g. Sr, Ba, etc.) and isotopes composition (e.g. 87
Sr/86
Sr δ18
O, δ11
B etc), and can
provide valuable information on past climate and the marine environment. Corals exhibit an
approximate linear growth pattern with maximum extension in the growth axis. The rate of
extension is controlled by environmental parameters such as light intensities and temperature (de
Villiers et al., 1995). In many corals, seasonal growth bands can be detected and can be used as a
timescale.
Acropora corals are among the fastest growing corals as their mean extension rates can exceed
10 cm per year (Huston, 1985). This allows gaining high resolution records of environmental
changes through geochemical proxies. However, several studies have raised the question of the
enigmatic growth pattern of this genus. Gladfelter (1982); Oliver et al. (1983) and others
observed an axial gradient in the Acropora skeleton density as a function of age. In addition to
the observation of no distinct growth bands and a deep gastrovascular system, researchers
suggested that Acropora show secondary infilling of skeletal pores in older portions of the
colony (Gladfelter, 1982; Oliver et al., 1983; Roche et al., 2011). Shirai et al. 2008 observed
(using NanoSIMS and EPMA) inhomogeneous element distribution on the micro-scale level of
Acropora nobilis. They attributed this heterogeneity to secondary infilling. As opposed to the
CHAPTER II- PATCHY CALCIFICATION PATTERN IN ACROPORA SP. |28
current study, where we have two distinct Sr concentrations that represent two different stages of
growth, Shirai et al., (2008) show inhomogeneity that does not necessarily indicate secondary
infilling. Despite this infilling theory, Acropora is being used for calibrating proxies and for
reconstructing paleo-environmental conditions (e.g. Juillet-Leclerc at al., 1997; Reynaud et al.,
2004; Rollion-Bard et al., 2009).
Methods
Micro colonies of Acropora sp. were cultured for several weeks in different temperatures
(19°C, 22°C, 25°C, 28°C). The micro colonies were collected from the same mother colony that
was held in a depleted Sr concentration aquarium (i.e. holding aquarium) in the coral laboratory
of Prof. Jonathan Erez at the Hebrew University, Jerusalem Israel. Each of the micro colonies
was attached to stable surface using underwater epoxy putty (AquaStik, Aquasonic, Ingleburn,
New South Wales, Australia) and was left in the holding aquarium for recovery of five weeks. In
the experiment we used natural seawater from the Gulf of Aqaba (at the pier of the
Interuniversity Institute for Marine Sciences in Eilat (IUI)), which was then diluted to 37 g·kg-1
.
The experiments took place in a flow through system with water residence time of 12 hours,
while Sr and Ca concentrations in the seawater solution remained stable throughout the
experiment. Total alkalinity measurements were performed weekly on the reservoir seawater
solution and on the collected outflow seawater solution. Total alkalinity was determined by Gran
titration using a Metrohm DMS Titrino. The amount of calcification was determined using the
alkalinity anomaly technique (Smith and Kinsey, 1978; Chisholm and Gattuso, 1991), and was
divided by the final weight of the skeleton to obtain percent of growth. After seven weeks the
experiment was terminated. The corals’ tissue was removed by high air pressure and was then
rinsed with deionized water to remove tissue and seawater remaining. Bleaching (1% NaClO)
and ultrasonic treatment were done in addition to each branch that was used for mapping
analyses. Skeleton powder were collected from the specimens’ epoxy surfaces, dissolved in 2%
HNO3 and measured on Agilent 7500 Quadrupole ICP-MS at GEOMAR, Kiel. Water samples
from the pre-experimental and experimental water were measured on Varian 720-ES ICP-OES at
GEOMAR, Kiel. The Sr/Ca ratio of the experimental water (8.5±0.1 mmol·mol-1
) is
approximately 2 times higher than the ratio in the pre-experimental water (~3.7 mmol·mol-1
).
The rough estimation of Sr/Ca in the pre-experimental water is based on a single water sampling
CHAPTER II- PATCHY CALCIFICATION PATTERN IN ACROPORA SP. |29
(3.7±0.1 mmol·mol-1
). Due to the addition of Ca to the pre-experimental solution to compensate
for the consumption by calcification, Sr/Ca was variable in the pre-experimental phase, and
therefore the single Sr/Ca measurement is considered as an approximation only.
A branch from each coral specimen was used for Sr Ca and S elemental mapping using an
electron microprobe (JEOL JXA 8200 super probe) at GEOMAR, Kiel. The branches were
embedded into resin, polished, and carbon coated. For the measurements we used an acceleration
voltage of 15.0 kV, a beam current of 0.04 μA, a beam diameter of 10 μm, a dwell time of 20
msec, and 10 accumulations for each image. Calibration of Sr and Ca concentrations were done
using four standards with known average concentrations (VG-2 (Jarosewich et al., 1980), KAN-1
(Reay et al., 1993), Strontionite (Jarosewich and White, 1987) and Calcite (Jarosewich and
MacIntyre, 1983)). For the calibration we used only 1 accumulation and dwell time of 50 msec
on an area of 10 pixels by 10 pixels.
Two branches from the 19°C and 25°C experiments were measured using synchrotron X-ray
fluorescence micro-analysis (μ-SXRF) at beamline L of HASYLAB (Hamburger
Synchrotronstrahlungs-Labor) which is located at DESY (Deutsches Elektronen-Synchrotron) in
Hamburg, Germany. The synchrotron radiation at the second-generation electron/positron
storage ring DORIS III originates from positrons with 4.5 GeV at a bending magnet with 12.12
m radius, and is emitted in a tangential direction into the beam pipe (Janssens et al., 2004). At
beamline L, the complete SXRF set-up can be adjusted in the vertical and horizontal directions
by stepper motors. The photon beam reaches the sample surface at a 45° angle, and can both be
collimated and focused. In order to enable a tomographic imaging of the carbonate samples, we
used a confocal glass capillary designed to concentrate more than 95% of the incoming energy of
the white X-Ray beam within a pre-defined volume of 20 x 20 x 20 micrometers. Characteristic
X-Rays emitted from each such 3D-pixel was detected with a SiLi EDS-detector, and corrected
off-line for the attenuation arising from the overlying pixels (i.e. those pixels between the
measured pixel and the detector). We measured Ca and Sr in both branches. Thus in contrast to
the EMPA, μ-SXRF can be used to obtain a three dimensional micro-chemical map of a given
sample. This is due to the high penetration of the hard X-rays used for the investigation.
Data processing and calculations were done in Matlab R2011a software (MathWorks®).
CHAPTER II- PATCHY CALCIFICATION PATTERN IN ACROPORA SP. |30
Results and discussion
Aragoite infilling in Acropora sp.
Both the Electron microprobe (EMPA) and the μ-SXRF mapping results indicate two
distinctive Sr/Ca ratios (3.0±1.0 mmol·mol-1
, 8.5±1.5 mmol·mol-1
), which roughly correlate to
the average Sr/Ca ratios measurements of the pre-experiment skeleton and the experiment’s
skeleton, respectively (3.0±0.1 mmol·mol-1
; 9.4±0.1 mmol·mol-1
). The large difference in Sr/Ca
thus represents two periods in the corals’ skeleton growth, which enables us to observe the
unique growth pattern of Acropora sp. skeleton.
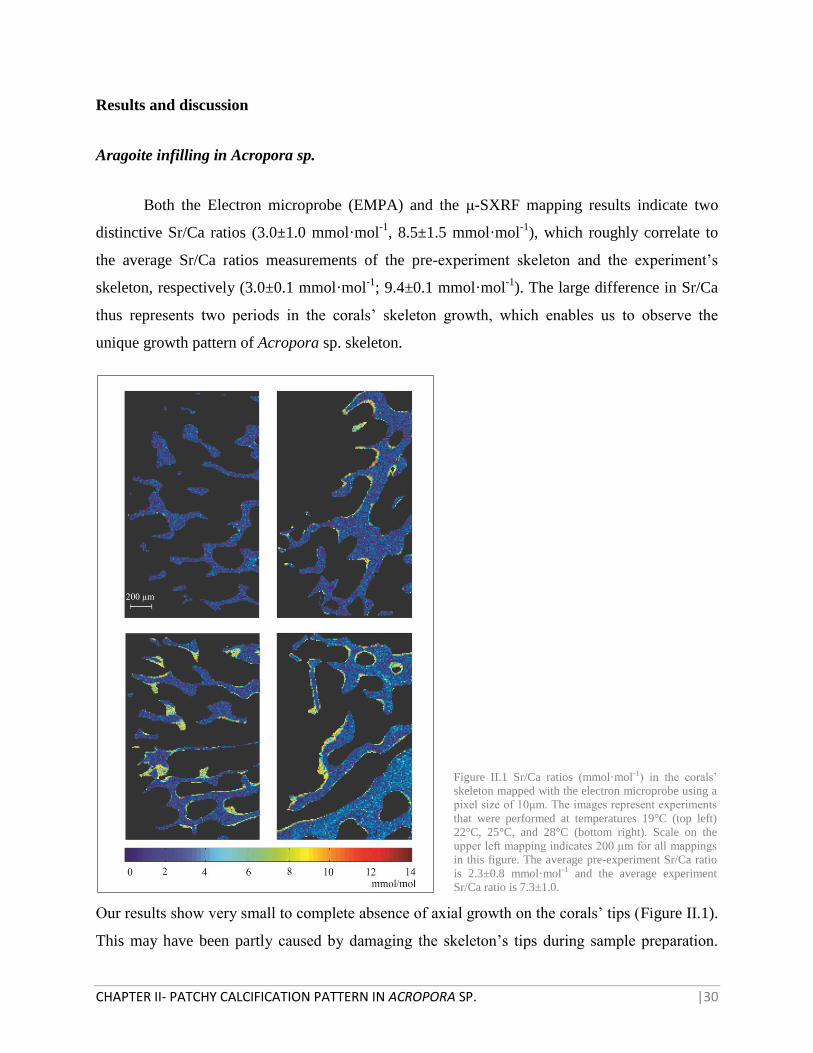
Our results show very small to complete absence of axial growth on the corals’ tips (Figure II.1).
This may have been partly caused by damaging the skeleton’s tips during sample preparation.
Figure II.1 Sr/Ca ratios (mmol·mol-1) in the corals’
skeleton mapped with the electron microprobe using a
pixel size of 10μm. The images represent experiments
that were performed at temperatures 19°C (top left)
22°C, 25°C, and 28°C (bottom right). Scale on the
upper left mapping indicates 200 μm for all mappings
in this figure. The average pre-experiment Sr/Ca ratio
is 2.3±0.8 mmol·mol-1 and the average experiment
Sr/Ca ratio is 7.3±1.0.
CHAPTER II- PATCHY CALCIFICATION PATTERN IN ACROPORA SP. |31
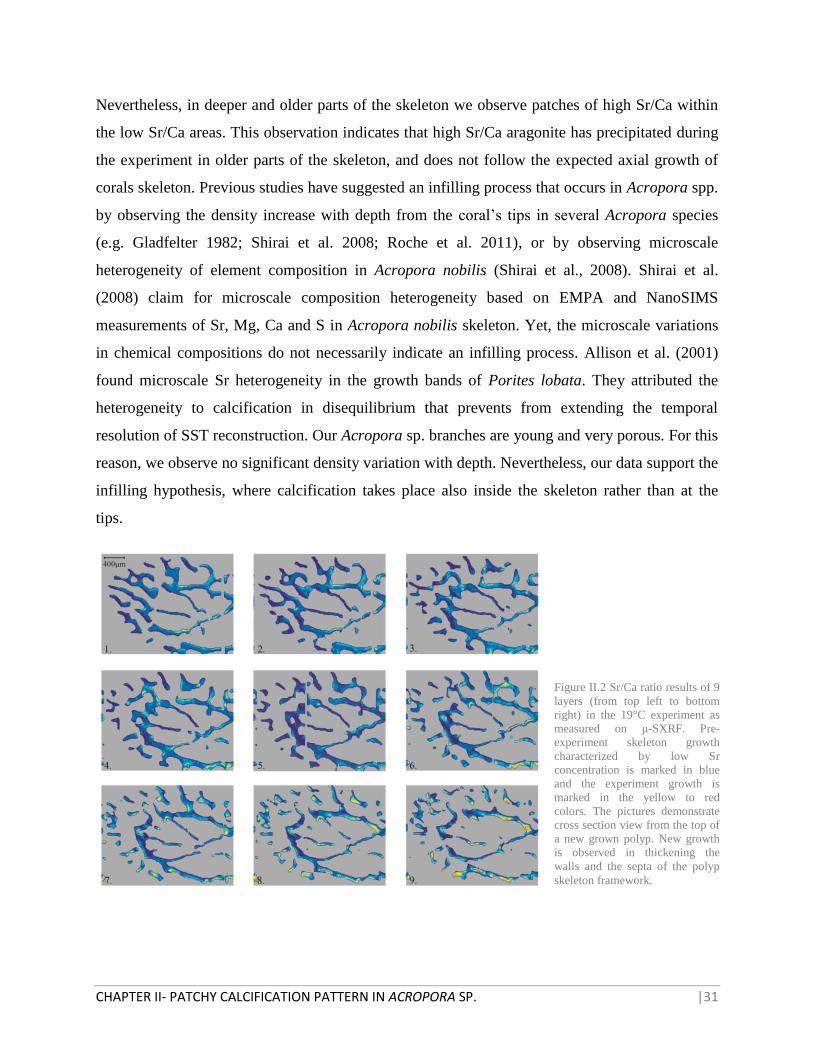
Nevertheless, in deeper and older parts of the skeleton we observe patches of high Sr/Ca within
the low Sr/Ca areas. This observation indicates that high Sr/Ca aragonite has precipitated during
the experiment in older parts of the skeleton, and does not follow the expected axial growth of
corals skeleton. Previous studies have suggested an infilling process that occurs in Acropora spp.
by observing the density increase with depth from the coral’s tips in several Acropora species
(e.g. Gladfelter 1982; Shirai et al. 2008; Roche et al. 2011), or by observing microscale
heterogeneity of element composition in Acropora nobilis (Shirai et al., 2008). Shirai et al.
(2008) claim for microscale composition heterogeneity based on EMPA and NanoSIMS
measurements of Sr, Mg, Ca and S in Acropora nobilis skeleton. Yet, the microscale variations
in chemical compositions do not necessarily indicate an infilling process. Allison et al. (2001)
found microscale Sr heterogeneity in the growth bands of Porites lobata. They attributed the
heterogeneity to calcification in disequilibrium that prevents from extending the temporal
resolution of SST reconstruction. Our Acropora sp. branches are young and very porous. For this
reason, we observe no significant density variation with depth. Nevertheless, our data support the
infilling hypothesis, where calcification takes place also inside the skeleton rather than at the
tips.
Figure II.2 Sr/Ca ratio results of 9
layers (from top left to bottom
right) in the 19°C experiment as
measured on μ-SXRF. Pre-
experiment skeleton growth
characterized by low Sr
concentration is marked in blue
and the experiment growth is
marked in the yellow to red
colors. The pictures demonstrate
cross section view from the top of
a new grown polyp. New growth
is observed in thickening the
walls and the septa of the polyp
skeleton framework.
CHAPTER II- PATCHY CALCIFICATION PATTERN IN ACROPORA SP. |32
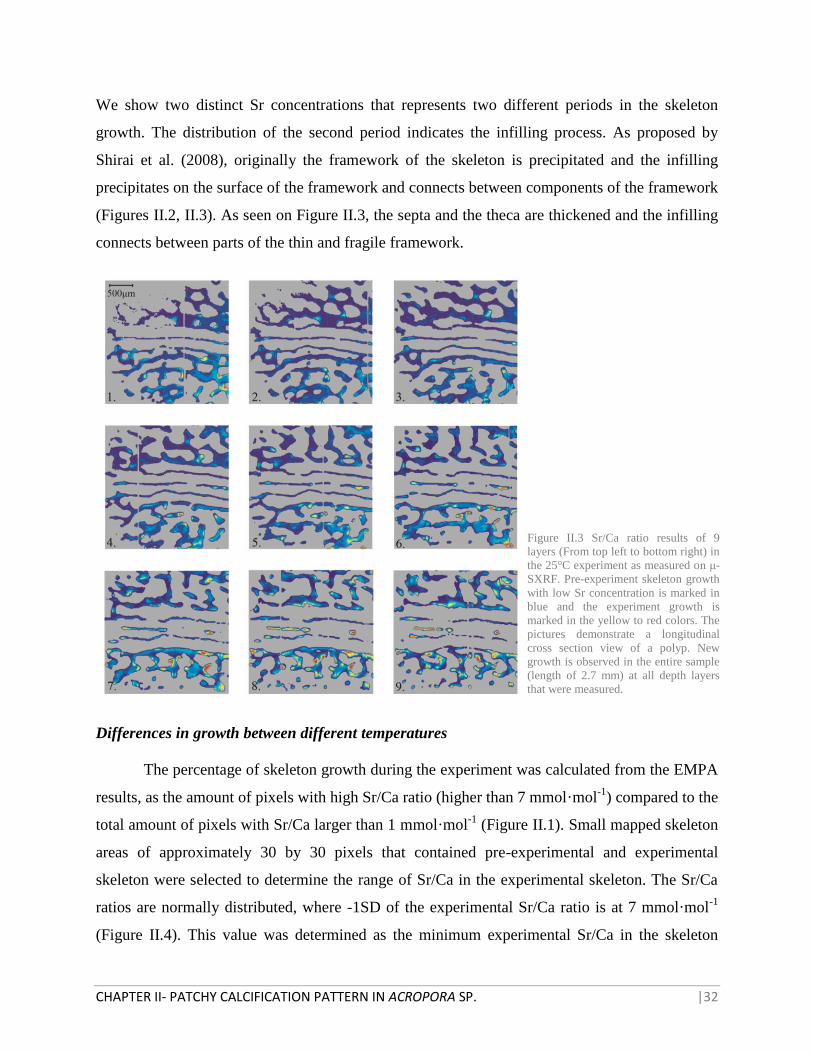
We show two distinct Sr concentrations that represents two different periods in the skeleton
growth. The distribution of the second period indicates the infilling process. As proposed by
Shirai et al. (2008), originally the framework of the skeleton is precipitated and the infilling
precipitates on the surface of the framework and connects between components of the framework
(Figures II.2, II.3). As seen on Figure II.3, the septa and the theca are thickened and the infilling
connects between parts of the thin and fragile framework.
Differences in growth between different temperatures
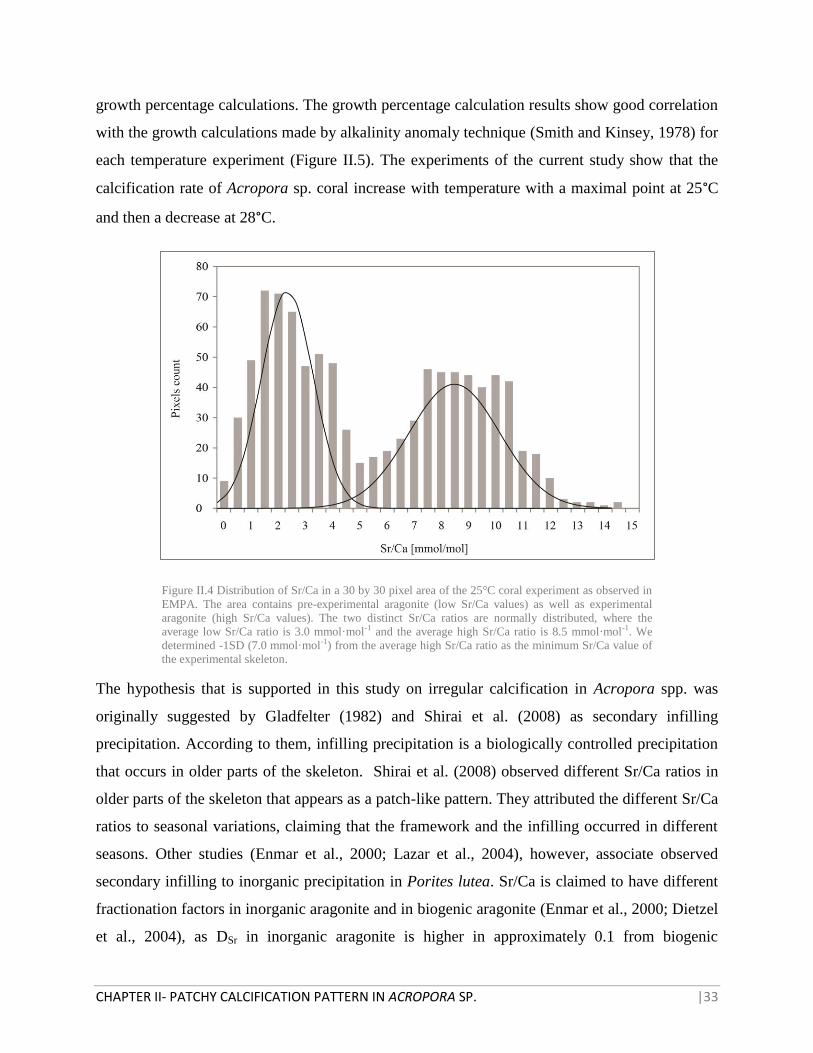
The percentage of skeleton growth during the experiment was calculated from the EMPA
results, as the amount of pixels with high Sr/Ca ratio (higher than 7 mmol·mol-1
) compared to the
total amount of pixels with Sr/Ca larger than 1 mmol·mol-1
(Figure II.1). Small mapped skeleton
areas of approximately 30 by 30 pixels that contained pre-experimental and experimental
skeleton were selected to determine the range of Sr/Ca in the experimental skeleton. The Sr/Ca
ratios are normally distributed, where -1SD of the experimental Sr/Ca ratio is at 7 mmol·mol-1
(Figure II.4). This value was determined as the minimum experimental Sr/Ca in the skeleton
Figure II.3 Sr/Ca ratio results of 9
layers (From top left to bottom right) in
the 25°C experiment as measured on μ-
SXRF. Pre-experiment skeleton growth
with low Sr concentration is marked in
blue and the experiment growth is
marked in the yellow to red colors. The
pictures demonstrate a longitudinal
cross section view of a polyp. New
growth is observed in the entire sample
(length of 2.7 mm) at all depth layers
that were measured.
CHAPTER II- PATCHY CALCIFICATION PATTERN IN ACROPORA SP. |33
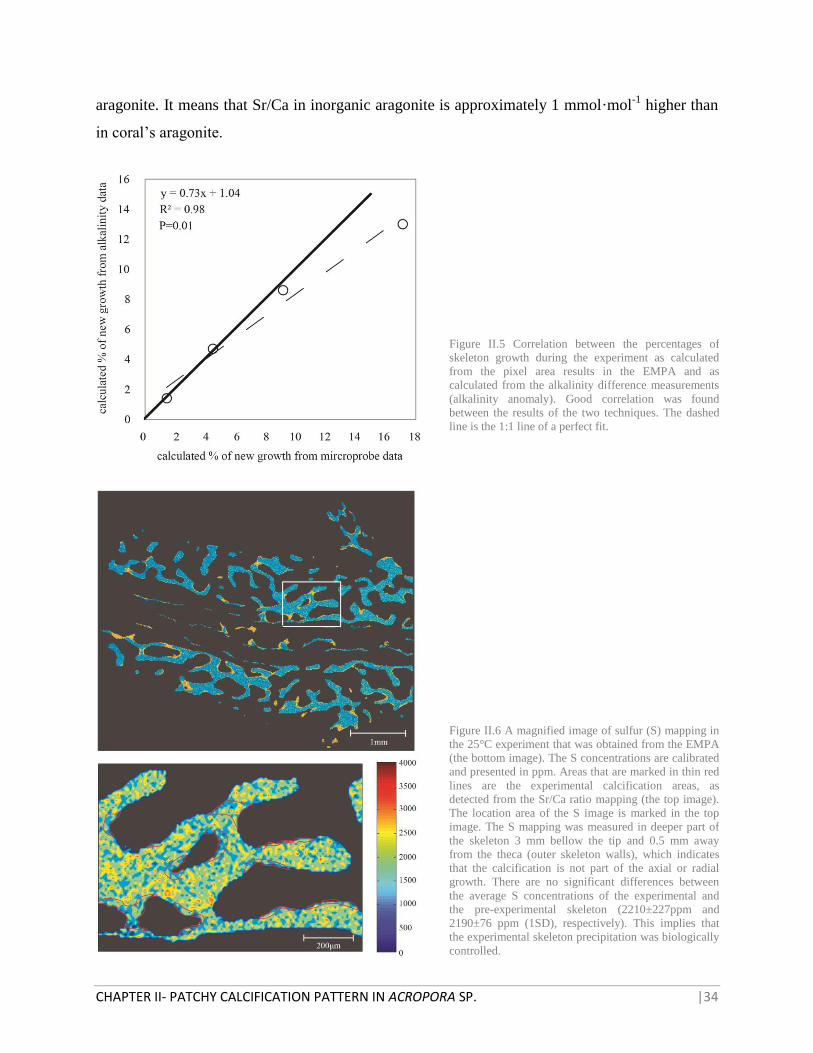
growth percentage calculations. The growth percentage calculation results show good correlation
with the growth calculations made by alkalinity anomaly technique (Smith and Kinsey, 1978) for
each temperature experiment (Figure II.5). The experiments of the current study show that the
calcification rate of Acropora sp. coral increase with temperature with a maximal point at 25°C
and then a decrease at 28°C.
Figure II.4 Distribution of Sr/Ca in a 30 by 30 pixel area of the 25°C coral experiment as observed in
EMPA. The area contains pre-experimental aragonite (low Sr/Ca values) as well as experimental
aragonite (high Sr/Ca values). The two distinct Sr/Ca ratios are normally distributed, where the
average low Sr/Ca ratio is 3.0 mmol·mol-1 and the average high Sr/Ca ratio is 8.5 mmol·mol-1. We
determined -1SD (7.0 mmol·mol-1) from the average high Sr/Ca ratio as the minimum Sr/Ca value of
the experimental skeleton.
The hypothesis that is supported in this study on irregular calcification in Acropora spp. was
originally suggested by Gladfelter (1982) and Shirai et al. (2008) as secondary infilling
precipitation. According to them, infilling precipitation is a biologically controlled precipitation
that occurs in older parts of the skeleton. Shirai et al. (2008) observed different Sr/Ca ratios in
older parts of the skeleton that appears as a patch-like pattern. They attributed the different Sr/Ca
ratios to seasonal variations, claiming that the framework and the infilling occurred in different
seasons. Other studies (Enmar et al., 2000; Lazar et al., 2004), however, associate observed
secondary infilling to inorganic precipitation in Porites lutea. Sr/Ca is claimed to have different
fractionation factors in inorganic aragonite and in biogenic aragonite (Enmar et al., 2000; Dietzel
et al., 2004), as DSr in inorganic aragonite is higher in approximately 0.1 from biogenic
CHAPTER II- PATCHY CALCIFICATION PATTERN IN ACROPORA SP. |34
aragonite. It means that Sr/Ca in inorganic aragonite is approximately 1 mmol·mol-1
higher than
in coral’s aragonite.
Figure II.5 Correlation between the percentages of
skeleton growth during the experiment as calculated
from the pixel area results in the EMPA and as
calculated from the alkalinity difference measurements
(alkalinity anomaly). Good correlation was found
between the results of the two techniques. The dashed
line is the 1:1 line of a perfect fit.
Figure II.6 A magnified image of sulfur (S) mapping in
the 25°C experiment that was obtained from the EMPA
(the bottom image). The S concentrations are calibrated
and presented in ppm. Areas that are marked in thin red
lines are the experimental calcification areas, as
detected from the Sr/Ca ratio mapping (the top image).
The location area of the S image is marked in the top
image. The S mapping was measured in deeper part of
the skeleton 3 mm bellow the tip and 0.5 mm away
from the theca (outer skeleton walls), which indicates
that the calcification is not part of the axial or radial
growth. There are no significant differences between
the average S concentrations of the experimental and
the pre-experimental skeleton (2210±227ppm and
2190±76 ppm (1SD), respectively). This implies that
the experimental skeleton precipitation was biologically
controlled.
CHAPTER II- PATCHY CALCIFICATION PATTERN IN ACROPORA SP. |35
Due to the large variability in the Sr/Ca ratio mapping (2σ=~1 mmol·mol-1
), we could not
calculate the Sr/Ca-temperature relation in the difference specimens nor to detect whether the
infilling Sr/Ca ratio is inorganic or biogenically controlled. Nonetheless, the sulfate distribution
in the samples reveals that the infilling has similar concentration to the remaining skeleton
(Figure II.6). Sulfate is considered to be related to organic matrices. The concentration in corals’
aragonite is 1250 to 3500 ppm of Sulfur in the skeleton’s fibers and centers of calcification,
respectively (Cuif and Dauphin, 1998), while in inorganic aragonite smaller concentrations of
less than 100 ppm of sulfur are found (Pingitore et al., 1995). This implies that the infilling
precipitation in Acropora sp. is biogenically controlled.
Appendix: Correction of heterogeneous samples measured in the μ-SXRF
The porous nature of corals’ skeleton is not ideal for element measurements in the μ-
SXRF. As the x-ray beam penetrate deeper parts of the sample, the intensity of the element
signal decreases as a function of the depth and the density of the substance. When dealing with a
homogenous substance, the signal attenuation can be easily calculated and then can be corrected
to non-attenuated signal. However, when the substance is heterogeneous and contains many
pores, the correction is not straightforward. There are two factors that can cause a Ca
concentration signal reduction (that is supposed to be constant in CaCO3): The first factor is
‘partial pixel’; where the measured pixel is not fully composed of CaCO3. The second factor is
the attenuation caused by CaCO3 on covering layers in the path of the secondary beam. In order
to correct the data, these two factors need to be separated. The first layer at the sample’s surface
is free of covering layers. It means that every deviation from a maximal Ca signal (maxCa) is
caused by the ‘partial pixel’ (pp) factor.
Eq. II.1
‘Partial pixels’ factor of the first layer is converted to attenuation factor for the underlying layers
by multiplying it by the secondary beam distance (i.e. pixel’s diagonal) this is the distance that
the secondary beam needs to pass from the second layer to the detector (D).
Eq. II.2
CHAPTER II- PATCHY CALCIFICATION PATTERN IN ACROPORA SP. |36
In this manner a signal in the second layer that is smaller than the expected signal is interpreted
as ‘partial pixel’ and then added to the first layer as the attenuation factor of the third layer.
Eventually, we can correct any trace element that was measured (E’) in addition to the major Ca
element in order to get the true, non-attenuated value of this element. The true element value (E)
is corrected to a full non-attenuated pixel value based on its depth below CaCO3 cover and the
emission energy of the element (SrTransmission).
Eq. II.3
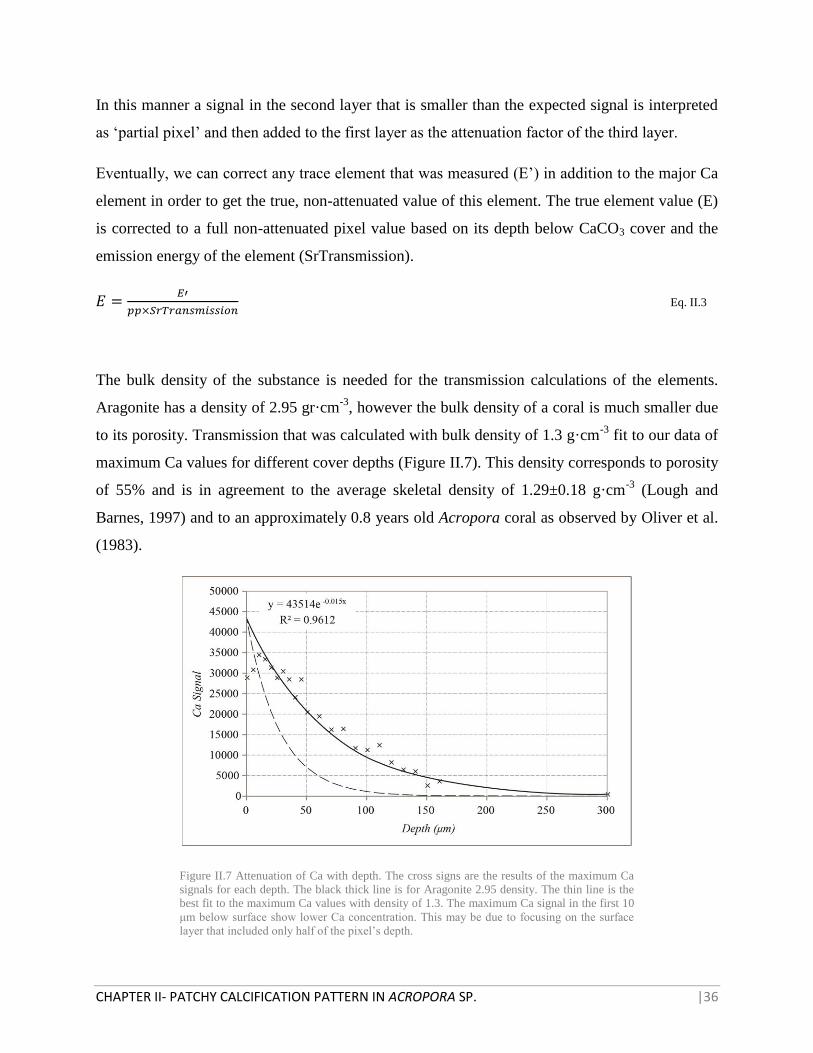
The bulk density of the substance is needed for the transmission calculations of the elements.
Aragonite has a density of 2.95 gr·cm-3
, however the bulk density of a coral is much smaller due
to its porosity. Transmission that was calculated with bulk density of 1.3 g·cm-3
fit to our data of
maximum Ca values for different cover depths (Figure II.7). This density corresponds to porosity
of 55% and is in agreement to the average skeletal density of 1.29±0.18 g·cm-3
(Lough and
Barnes, 1997) and to an approximately 0.8 years old Acropora coral as observed by Oliver et al.
(1983).
Figure II.7 Attenuation of Ca with depth. The cross signs are the results of the maximum Ca
signals for each depth. The black thick line is for Aragonite 2.95 density. The thin line is the
best fit to the maximum Ca values with density of 1.3. The maximum Ca signal in the first 10
μm below surface show lower Ca concentration. This may be due to focusing on the surface
layer that included only half of the pixel’s depth.
CHAPTER II- PATCHY CALCIFICATION PATTERN IN ACROPORA SP. |37
Acknowledgments
We would like to thank Mario Thöner from the EMPA laboratory for his help in the
analyses. Funding support was provided through the European Marie Curie Initial Training
Network "Calcification by Marine Organisms" (CalMarO) and the European Community's
Seventh Framework Programme (FP7/2007-2013).
References
Allison N, Finch AA, Sutton S, Newville M (2001) Strontium heterogeneity and speciation in
coral aragonite: implications for the strontium paleothermometer. Geochim. Cosmochim.
Acta 65:2669–2676
Chisholm JRM, Gattuso JP (1991) Validation of the alkalinity anomaly technique for
investigating calcification and photosynthesis in coral reef communities. Limnol. Oceanogr.
36:1232–1239
Cuif J-P, Dauphin Y (1998) Microstructural and physico-chemical characterization of “centers of
calcification” in septa of some Recent scleractinian corals. Paläontologische Zeitschrift
72:257–270
Dietzel M, Gussone N, Eisenhauer A (2004) Co-precipitation of Sr2+
and Ba2+
with aragonite by
membrane diffusion of CO2 between 10 and 50°C. Chem. Geol. 203:139–151
Enmar R, Stein M, Bar-Matthews M, Sass E, Katz A, Lazar B (2000) Diagenesis in live corals
from the Gulf of Aqaba. I. The effect on paleo-oceanography tracers. Geochim.
Cosmochim. Acta 64:3123–3132
Gladfelter EH (1982) Skeletal development in Acropora cervicornis: I. Patterns of calcium
carbonate accretion in the axial corallite. Coral Reefs 1:45–51
Huston M (1985) Variation in coral growth rates with depth at Discovery Bay, Jamaica. Coral
Reefs 4:19–25
Janssens K, Proost K, Falkenberg G (2004) Confocal microscopic X-ray fluorescence at the
HASYLAB microfocus beamline: characteristics and possibilities. Spectrochim. Acta Part
B At. Spectrosc. 59:1637–1645
Jarosewich E, MacIntyre IG (1983) Carbonate reference samples for electron microprobe and
scanning electron microscope analyses. J. Sediment. Res. 53:677–678
Jarosewich E, Nelen JA, Norbers JA (1980) Referaxe Samples for Electron Microprobe Analysis
. Department of Mineral Sciences. Geostand. Newsl. 68–72
CHAPTER II- PATCHY CALCIFICATION PATTERN IN ACROPORA SP. |38
Jarosewich E, White JS (1987) Strontianite reference sample for electron microprobe and SEM
analyses. J. Sediment. Res. 5:1986–1987
Lazar B, Enmar R, Schossberger M, Bar-Matthews M, Halicz L, Stein M (2004) Diagenetic
effects on the distribution of uranium in live and Holocene corals from the Gulf of Aqaba.
Geochim. Cosmochim. Acta 68:4583–4593
Lough JM, Barnes DJ (1997) Several centuries of variation in skeletal extension , density and
calcification in massive Porites colonies from the Great Barrier Reef : A proxy for seawater
temperature and a background of variability against which to identify unnatural change. J.
Exp. Mar. Bio. Ecol. 211:29–67
Oliver JK, Chalker BE, Dunlap WC (1983) Bathymetric adaptations of reef-building corals at
Davies Reef, Great Barrier Reef, Australia. I. Long-term growth responses of Acropora
formosa (Dana 1846). J. Exp. Mar. Bio. Ecol. 73:11–35
Pingitore NE, Meitzner G, Love KM (1995) Identification of sulfate in natural carbonates by x-
ray absorption spectroscopy. Geochim. Cosmochim. Acta 59:2477–2483
Reay A, Johnstone RD, Kawachi Y (1993) Anorthoclase, a second microprobe standard from
Kakanui, New Zealand. Geostand. Newsl. 17:135–136
Roche RC, Abel RL, Johnson KG, Perry CT (2011) Spatial variation in porosity and skeletal
element characteristics in apical tips of the branching coral Acropora pulchra (Brook 1891).
Coral Reefs 30:195–201
Shirai K, Kawashima T, Sowa K, Watanabe T, Nakamori T, Takahata N, Amakawa H, Sano Y
(2008) Minor and trace element incorporation into branching coral Acropora nobilis
skeleton. Geochim. Cosmochim. Acta 72:5386–5400
Smith SV, Kinsey DW (1978) Calcification and organic carbon metabolism as indicated by
carbon dioxide. Coral reefs Res. methods 469–484
De Villiers S, Nelson BK, Chivas AR (1995) Biological Controls on Coral Sr/Ca and d18O
Reconstructions of Sea Surface Temperatures. Science 269:1247–9
CHAPTER III. 88
Sr/86
Sr FRACTIONATION IN INORGANIC
ARAGONITE AND IN CORALS
Noa Fruchter1*
, Anton Eisenhauer1, Martin Dietzel
2, Jan Fietzke
1, Florian Böhm
1, Paolo
Montagna3, Moti Stein
4, Boaz Lazar
5, Jonathan Erez
5
1 GEOMAR, Helmholtz-Zentrum für Ozeanforschung Kiel, Wischhofstr. 1-3, 24148 Kiel, Germany
2 Institute of Applied Geosciences. Graz University of Technology. 8010 Graz, Austria
3 CNR - ISMAR - U.O.S. di Bologna –, Via Gobetti, 101 – 40129 Bologna, Italy
4,*Geological Survey of Israel, Malkhei Israel 30 Jerusalem, Israel
5The Hebrew University, The Edmond J. safra Campus Givat Ram Jerusalem, Israel
In preparation, to be submitted to Geochimica et Cosmochimica Acta
CHAPTER III- 88Sr/86Sr IN INORGANIC ARAGONITE AND IN CORALS |40
Abstract
Major 88
Sr/86
Sr fractionation from bulk solution is observed in inorganic aragonite that was
precipitated from natural seawater in the CO2 diffusion technique. Similar fractionation is
observed in several different coral species (Cladocora caespitosa, Porites sp. and Acropora sp.).
Despite the large fractionation from bulk solution (~0.2‰), we found no temperature or CO3-2
ion concentrations dependency on the fractionation (within 2SD). Our results implies that the
Rayleigh based multi element model (Gaetani et al., 2011) cannot explain the process of corals’
calcification.
Introduction
Tropical coral aragonites skeletons are one of the main archives for proxy information about
past climate change. Temperature dependency was found in several elemental ratios such as
Mg/Ca (e.g. Mitsuguchi et al., 1996), Sr/Ca (e.g. Beck et al., 1992) and B/Ca (e.g. Fallon et al.,
1999), and recently also Li/Mg (Montagna et al., 2009). The isotope fractionation of oxygen,
δ18
O (e.g. Weber & Woodhead, 1972) is also being used for SST reconstruction from corals’
skeletons. Among all proxies, Sr/Ca and δ18
O are the most widely used and are the most
established past sea surface temperature (SST) proxies (Corrège, 2006). However, temperature
may not be the only controlling factor for trace element partitioning and isotope fractionation
(c.f. Gagnon et al., 2007). For Sr/Ca ratios, for example, was shown to be significantly different
in colonies from the same species growing side by side to each other (Marshall and McCulloch,
2002). Mg is incorporated together with the organic component of the skeleton (Watanabe et al.,
2001), and in addition to temperature δ18
O is known to be influenced by seawater salinity
changes ( c.f. Schmidt, 1999).
Fietzke and Eisenhauer (2006) determined for the first time that 88
Sr/86
Sr shows a measurable
fractionation in corals and in inorganic aragonites. In their study they used the bracketing
standard method on an MC-ICP-MS. They showed a significant positive temperature
dependency on the 88
Sr/86
Sr fractionation of the tropical coral Pavona clavus. In a following up
study Rüggeberg et al. (2008) found similar trend for temperature and δ88/86
Sr in the cold water
coral, Lophilia pertusa. Evidences of significantly different δ88/86
Sr of mineral and the bulk
solution were also found in terrestrial environments by Halicz et al. (2008).
CHAPTER III- 88Sr/86Sr IN INORGANIC ARAGONITE AND IN CORALS |41
While the earlier work on δ88/86
Sr used the bracketing standard method in MC-ICP-MS (Fietzke
and Eisenhauer, 2006; Halicz et al., 2008; Rüggeberg et al., 2008), later work used the 87
Sr/84
Sr
double spike method that was developed and applied on a TIMS by Krabbenhöft et al. (2009).
Later measurements using the TIMS method could not confirm the significant positive δ88/86
Sr-
temperature trend in the tropical coral Acropora sp. (Krabbenhöft et al., 2010) and in the cold
water coral Lophilia pertusa that was previously shown with temperature correlation to δ88/86
Sr
(Raddatz et al., 2013). The discrepancies between the different studies may be due to either
species-related temperature dependence of δ88/86
Sr or due to methodological bias of the two
measurement techniques.
A possible model to extract the climate factor in geochemical proxies is proposed in a Rayleigh
based mechanism (Gaetani and Cohen, 2006; Gaetani et al., 2011). The model defines
calcification in corals as precipitation process from a renewable finite solution. Elements are
depleted from the solution during precipitation according to their inorganic partitioning
coefficient. Since the solution is finite, coral’s apparent fractionation factor is influenced by the
Rayleigh effect. Temperature is strongly correlated to the Rayleigh based mechanism (Gaetani et
al., 2011), as the depletion of elements rises with the increasing precipitation rates and as a
consequence also with the increasing temperatures. By combining two element ratios Gaetani et
al. (2011) were able to reconstruct the remaining fraction in the bulk solution and the
temperature in Acropora sp. samples.
In the current study we measured δ88/86
Sr using the double spike method in natural Porites sp.,
cultured Acropora sp. and Cladocora caespitosa as well as aragonite of inorganic precipitation
experiments. We found a range of δ88/86
Sr values, which indicate a significant fractionation from
the bulk solution, but did not find any significant correlation of temperature as previously
claimed by Fietzke and Eisenhauer (2006) or carbonate ion concentration to Sr isotope
fractionation.
Methods
Inorganic aragonite precipitation experiments
Inorganic aragonite precipitation experiments were conducted at the University of
Technology in Graz, Austria using the CO2 diffusion technique as described in detail earlier in
CHAPTER III- 88Sr/86Sr IN INORGANIC ARAGONITE AND IN CORALS |42
Dietzel et al. (2004). In this technique, CO2 diffuses from an inner solution to an outer solution
via poly-ethylene (PE) membrane (we used two different membranes thickness, 0.02 mm or 2
mm thick). The inner solution consists of 35 grams of NaHCO3 in a 0.5 l solution at pH 7.5, and
has a higher pCO2 than the outer solution. In order to increase the pCO2 in few experiments we
added 10 ml of 1N HCl to the inner solution (Table III.1). The outer solution (or bulk solution),
from which the precipitation occurs, is 5 l of filtered natural seawater collected from the Gulf of
Aqaba (Red-Sea 19.09°N 39.49E°, salinity of 40.7 g∙kg-1
, from 1000 m water depth using CTD
device). Filtration was done with Sartobram P. sterile MidiCap double filter of 0.45 μm and
0.2μm. The pH of the outer solution was kept constant at 8.30±0.03 using 0.5N NaOH titration
and was controlled using a Schott Blueline 28 pH meter combined with automatic titration
burette. The pCO2 gradient between the inner and the outer solutions control the CO2 diffusion
rate and the saturation state for CaCO3 in the outer solution.
The nine different experiments (Table III.1) varied in temperature (15°C, 25°C and 30°C) and
CO2 diffusion rates (using different PE membranes of 0.02 mm or 2 mm thick, and different
PCO2 in the inner solution). The diffusion rates regulate the saturation state for CaCO3,
specifically the aragonite saturation state.
Table III.1 Inorganic aragonite experiments setup conditions and elemental ratio results in the solid. Standard deviation from the
mean (2SD) are presented in parentheses
Sample
Label
Temp.
(°C)
Diffusion membrane
thickness (mm)
f b ∆
88/86Sr
c
(‰ A-aq)
Sr/Ca
(mmol/mol
)
Mg/Ca
(mmol/mol)
logR
(mol/h)
IA-1 25 0.02 0.83 -0.172 9.80(0.48) 5.44(0.37) 3.29
IA-2 25 0.02 0.67 -0.178 9.54(0.31) 105.47(4.79) 2.95
IA-3 30 2 0.79 -0.193 9.48(0.31) 2.91(0.17) 1.84
IA-4 30 0.02 0.58 -0.205 9.10(0.13) 47.57(0.47) 3.01
IA-5 30 0.02 a 0.71 -0.179 9.37(0.40) 63.13(0.35) 3.20
IA-6 30 2 a 0.81 -0.156 9.57(0.34) 4.10(0.28) 2.55
IA-7 15 2 0.86 -0.161 10.82(0.41) 6.54(0.14) 2.33
IA-9 15 2 a 0.85 -0.125 11.06(0.13) 4.96(0.07) 1.71
IA-10 15 0.02 a 0.81 -0.174 10.72(0.40) 4.75(0.14) 2.51
a Addition of 10ml 1N HCl to the inner solution to increase pCO2
b Remaining fraction of Sr in the solution, calculated using Eq. III.2
c reproducibility of 0.020‰ (2SD) according to JCP-1 measurements (n=10)
Water samples from the outer solution were collected at the beginning and at the end of the
experiment for analyses of Sr/Ca and 88
Sr/86
Sr. The precipitated solid was collected and dried at
CHAPTER III- 88Sr/86Sr IN INORGANIC ARAGONITE AND IN CORALS |43
80°C for 24 hours, and then analyzed with XRD and FTRI (PerkinElmer spectrum 100 FTIR) to
determine its mineralogy and detect the poorly crystalized brucite.
Rate of precipitation is reported in μmol·h-1
. The precipitation rate (R) was determined according
to Eq. III.1 where [Ca]i and [Ca]f are the Ca concentration in the initial and the final solutions,
respectively, V is the volume of the solution and Δt is the duration of the precipitation. Even
though precipitation rates are influenced by the surface area and surface reactions (Wiechers et
al., 1975), we could not include the surface area measurements in the calculation since in some
cases brucite (Mg(OH)2) precipitated in an amount of up to 7%. Brucite has a surface area of 38
m2∙g
-1 (Kaspar et al., 1991), which is much larger than the surface area of aragonite (0.81 to 2.41
m2∙g
-1). Even a small amount of brucite in the precipitated solid will result in a large excursion of
the surface area measurements and a significant reduction of the calculated rate.
([ ] [ ] ) ⁄ Eq. III.1
Since Ca and Sr concentrations changed by up to ~28% between the initial and the final solution,
the results for Sr isotopes had to be corrected for the Rayleigh effect. The calculation for the true
∆88/86
Sr in the aragonite samples was done using the Rayleigh process equation combined with of
the measured ∆ approximation described in equations 3.1.17 and page 146 from Zeebe and Wolf-
Gladrow (2001).
([ ]
[ ] ) Eq. III.2
(
⁄
⁄ )
Eq. III.3
Eq. III.4
Where α is the fractionation factor, f is the remaining fraction in the fluid and [Sr]fs and [Sr]is are
the Sr concentration in the final and initial solution, respectively.
CHAPTER III- 88Sr/86Sr IN INORGANIC ARAGONITE AND IN CORALS |44
Cultured corals
Acropora sp. mini colonies were cultured in the department of Earth Sciences at the Hebrew
University of Jerusalem, Israel. The specimens were collected from one mother colony several
weeks prior to the beginning of the experiments. They were attached to an epoxy base and were
placed back in the main laboratory aquarium (i.e. holding aquarium) for recovery. Before the
beginning of the experiments the specimens were stained in 15 ppm solution of Alizarin-Red S
(Dodge et al., 1984) for seven hours. During the experiment each coral specimen was placed for
seven weeks in a 220 ml clear chamber supplied with 19 ml of diluted Red-Sea water per hour.
The experimental seawater was collected from the pier at the Interuniversity Institute for Marine
Sciences in Eilat (IUI) and diluted, for the experiment, to 37g∙kg-1
. The flow-through system had
residence time of 12 hours while constantly stirred in the chamber using a magnetic stirrer. Light
was supplied at illumination of 200±10 μmol photons·m-2
·s-1
through metal-halide lamps in 12
hours dark/light cycles. Temperature was kept constant in all tanks using heaters or a
refrigerating system connected to electronic controllers with a precision of ±0.3°C. The seven
different experiments varied in temperatures (19.0±0.3°C, 22.0±0.3°C, 25.0±0.3°C and
28.0±0.3°C) and CO32-
concentrations (171±13, 212±12, 279±15 and 352±28 μmole∙kg-1
). CO32-
concentrations were calculated from pH and alkalinity measurements using the CO2Sys (Lewis
and Wallace, 1998).
The physiology of the coral was monitored on a weekly basis through pH, alkalinity (TA) and
oxygen measurements of the water source solutions (reservoirs), the reaction vessels (both at
light and dark conditions) and the outflow solutions. In addition 50 ml of water samples of the
reservoirs and the outflow solutions (representing the total duration of the experiments) were
collected for geochemical analyses. ∆TA measurements of the reservoirs and the outflow
solution were used to estimate the calcification of the specimens. Calcification rates were
normalized to the buoyant weight of the micro colonies at the end of the experiment. Once in 10
days, during the experiments, the corals specimens were fed with Artemia sp. in an external 5 l
vessel for 1 hour. While feeding, algae growth was removed from the experiment chambers.
The experiments were terminated after seven weeks. The corals skeletons were separated from
their tissue using an air-brush followed by bleach in 1% NaClO and wash in double deionized
water (DDW).
CHAPTER III- 88Sr/86Sr IN INORGANIC ARAGONITE AND IN CORALS |45
Cladocora caespitosa was cultured at the Scientific Centre of Monaco (CSM) at 15.00±0.05°C,
18.00±0.05°C, 21.00±0.05°C and 23.00±0.05°C in temperature experiments, and in 390±48 and
701±78 ppm pCO2 during an atmospheric CO2 partial pressure experiment (at temperature of
16.4±2.6°C). The corals were collected in the Gulf of La Spezia (Ligurian Sea, 44°03' N, 9°55'
E) at ~25 m depth in June 2006. The corals were divided to 34 nubbins (five for each
temperature experiment and seven for each pCO2 experiment) and were acclimatized for several
weeks to adapt to the new environment and to the experiment conditions. Before the initiation of
the experiment, the corals were stained for 24h with a solution of 10 mg·L-1
of Alizarin Red S
(Dodge et al., 1984). Alizarin Red S is incorporated into a thin layer of skeleton and provides a
marker for measuring skeletal growth. Light was provided by hydrargyrum quartz iodide lamps
(60 µmol photon m-2
·s-1
; photoperiod: 12h dark/12h light). Temperature was kept constant in all
tanks using heaters or a refrigerating system connected to electronic controllers with a precision
of ±0.05°C. Fresh seawater (38.5g∙kg-1
from 50 meters water depth) was constantly added to the
experiment tanks from the local seawater in front of Monaco Scientific Center. CO2 - free air and
CO2 - enriched air were pumped continuously to the experiment seawater of the 390 and 701
ppm pCO2 experiments, respectively. This resulted in two different pH (8.09±0.02, 7.87±0.02)
and carbonate system composition (CO32-
is 219±17, 145±15 μmol∙mol-1
), while alkalinity is
similar in both experiments (Trotter et al., 2011). Corals were incubated for 87 days, during
which no artificial food was supplied to the tanks, but corals were considered naturally fed since
seawater supplied to the aquaria was not filtered. The linear extension rate was measured for
each specimen from the Alizarin Red S marking line to the skeleton tip. The specimens in each
temperature were then divided into three samples powders according to three statistical groups;
average extension rates (Average±1SE), low extension rates (<Average-1SE) and high extension
rates (>Average+1SE) groups. This statistic separation was not done in the pCO2 experiments
specimens.
Coral cores
Two cores from living colonies of Porites sp. were collected from different locations. Each core
was cut to 2-3 mm thick slab, which was subsampled using a micro-drill of 0.5 mm in diameter
along the growth axis of the coral for geochemical analyses. The powders were split for δ18
O
analyses and for trace element and isotope measurements. The powders that were not designated
CHAPTER III- 88Sr/86Sr IN INORGANIC ARAGONITE AND IN CORALS |46
for δ18
O analysis were bleached with 1% NaClO and washed with alkaline water (at pH 9
achieved by DDW with the addition of ammonium hydroxide) prior to dissolution.
TH1: This Porites sp. coral core was drilled in July 1995 from a massive coral colony (TH1)
located in the south-eastern part of the lagoon in Teahupoo, Tahiti French Polynesia at water
depth of 2.40 meters (c.f. Cahyarini et al. (2008)). The totals of 36 samples (ca. 1 mg each)
(Table III.2) were drilled along the growth axis of the slab as a 9.6 cm long transect. Similar
transect was sampled on an adjacent slab from the same core by Cahyarini et al. (2008) and the
δ18
O results from this study were compared to the current study transect results. Sampling in the
current study followed the sampled transect in Cahyarini et al. (2008) by comparing the
radiograph pictures of both slabs. Sea surface temperature records in Tahiti show variations
between 26°C (minimum in the dry season) and 29°C (maximum in the wet season) (Cahyarini
et al., 2009). The temperature record was used by Cahyarini et al. (2009) to calibrate the δ18
O
results of the studied slab.
SOT-1: This Porites lutea coral core was drilled in July 2007 from the Gulf of Aqaba 29.50°N
34.92°E (coral colony SOT-1). The coral grew at 5 meters depth near the underwater
observatory, south of the Nature Reserve Reef, Eilat Israel. The seawater temperature was
recorded at 29.47°N 34.92°E at depths of 20 to 40 m to avoid the diurnal thermocline.
Temperature measurements at these depths can be up to 2°C lower than the sea surface in the
high temperature season from June to September. The total of 18 powder samples (ca. 2 mg
each) (Table III.2) were drilled from SOT-1 core slab from a 3 cm long transect along the main
growth axis of the coral. The clear density variations on the slab were used to estimate the period
of time that is covered by the transect samples. By counting the total bands from the upper part
of the core to the sampled bands, we estimate that the sampled bands cover the years 1996 to
2000.
Table III.2 Δ88/86Sr results of Porites sp. corals. Porites lutea from the Gulf of
Eilat and Porites sp. from French Polynesia
Sample
Label
Sr/Ca
(mmol/mol)
δ18
O
(‰ vPDB)
Correlateda
SST (°C)
Δ88/86
Srb
(‰ A-aq)
Porites lutea – SOT-1
P07L00A 9.00 -2.977 24.1 -0.216
P07L00B 9.26 -2.716 21.0 -0.227
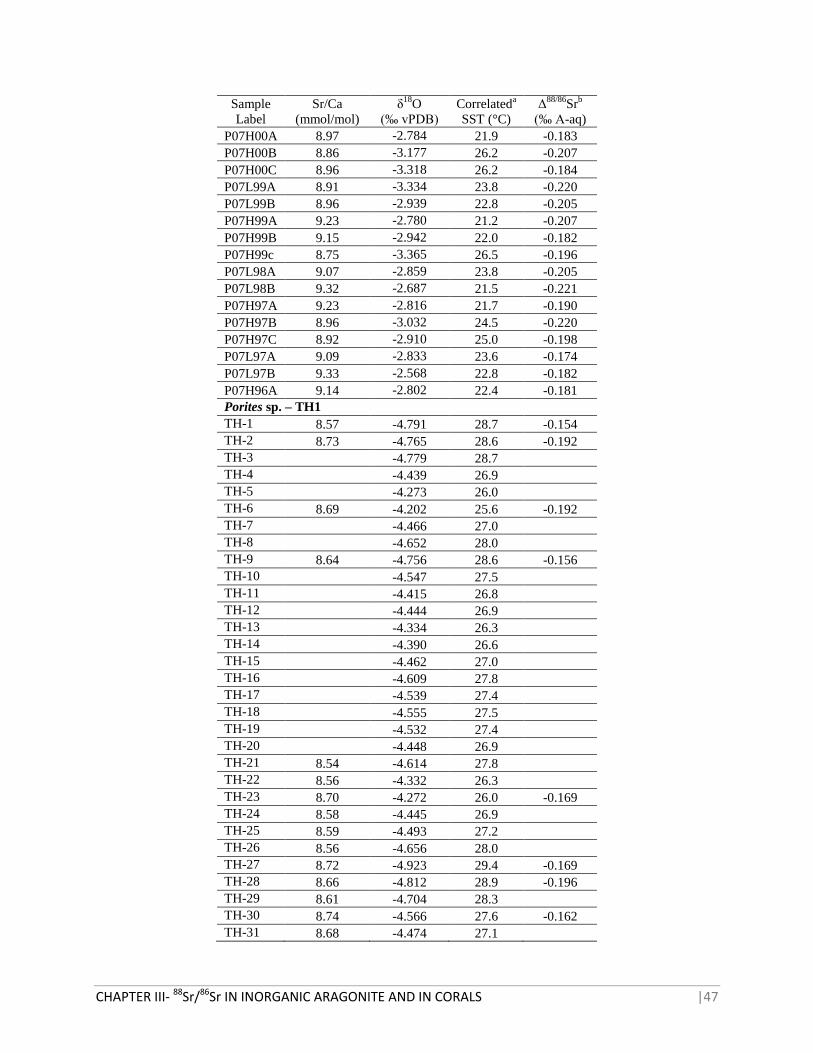
CHAPTER III- 88Sr/86Sr IN INORGANIC ARAGONITE AND IN CORALS |47
Sample
Label
Sr/Ca
(mmol/mol)
δ18
O
(‰ vPDB)
Correlateda
SST (°C)
Δ88/86
Srb
(‰ A-aq)
P07H00A 8.97 -2.784 21.9 -0.183
P07H00B 8.86 -3.177 26.2 -0.207
P07H00C 8.96 -3.318 26.2 -0.184
P07L99A 8.91 -3.334 23.8 -0.220
P07L99B 8.96 -2.939 22.8 -0.205
P07H99A 9.23 -2.780 21.2 -0.207
P07H99B 9.15 -2.942 22.0 -0.182
P07H99c 8.75 -3.365 26.5 -0.196
P07L98A 9.07 -2.859 23.8 -0.205
P07L98B 9.32 -2.687 21.5 -0.221
P07H97A 9.23 -2.816 21.7 -0.190
P07H97B 8.96 -3.032 24.5 -0.220
P07H97C 8.92 -2.910 25.0 -0.198
P07L97A 9.09 -2.833 23.6 -0.174
P07L97B 9.33 -2.568 22.8 -0.182
P07H96A 9.14 -2.802 22.4 -0.181
Porites sp. – TH1
TH-1 8.57 -4.791 28.7 -0.154
TH-2 8.73 -4.765 28.6 -0.192
TH-3 -4.779 28.7
TH-4 -4.439 26.9
TH-5 -4.273 26.0
TH-6 8.69 -4.202 25.6 -0.192
TH-7 -4.466 27.0
TH-8 -4.652 28.0
TH-9 8.64 -4.756 28.6 -0.156
TH-10 -4.547 27.5
TH-11 -4.415 26.8
TH-12 -4.444 26.9
TH-13 -4.334 26.3
TH-14 -4.390 26.6
TH-15 -4.462 27.0
TH-16 -4.609 27.8
TH-17 -4.539 27.4
TH-18 -4.555 27.5
TH-19 -4.532 27.4
TH-20 -4.448 26.9
TH-21 8.54 -4.614 27.8
TH-22 8.56 -4.332 26.3
TH-23 8.70 -4.272 26.0 -0.169
TH-24 8.58 -4.445 26.9
TH-25 8.59 -4.493 27.2
TH-26 8.56 -4.656 28.0
TH-27 8.72 -4.923 29.4 -0.169
TH-28 8.66 -4.812 28.9 -0.196
TH-29 8.61 -4.704 28.3
TH-30 8.74 -4.566 27.6 -0.162
TH-31 8.68 -4.474 27.1
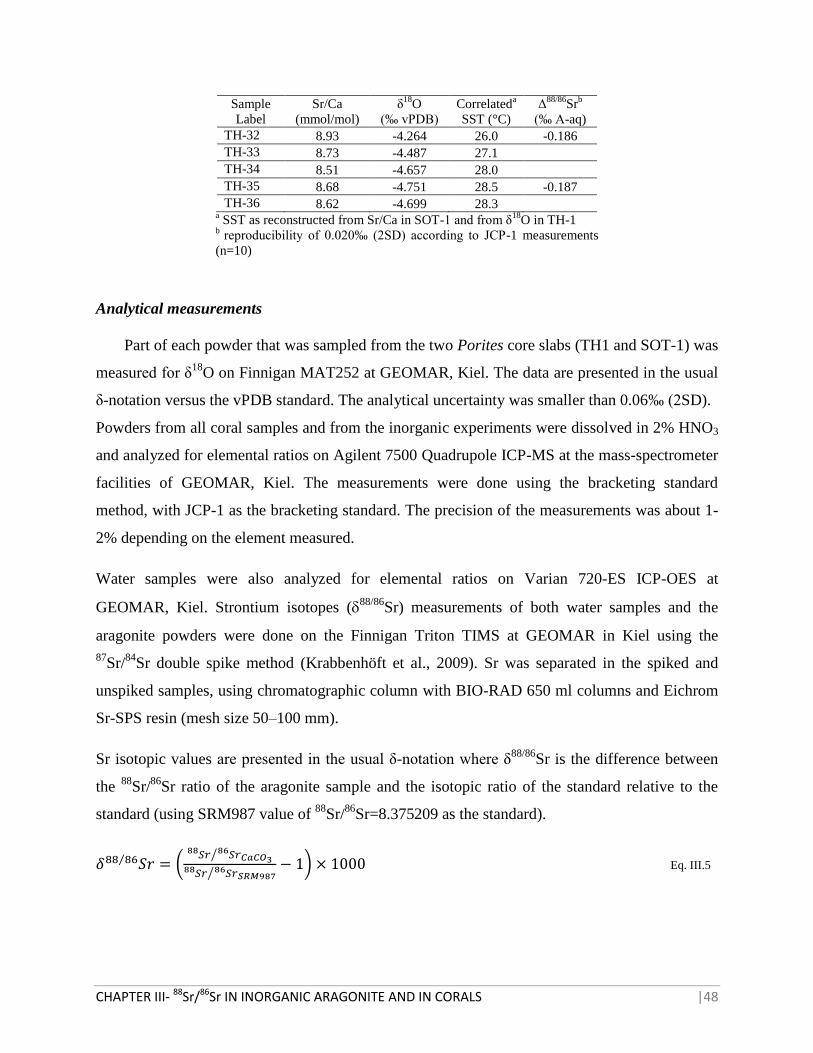
CHAPTER III- 88Sr/86Sr IN INORGANIC ARAGONITE AND IN CORALS |48
Sample
Label
Sr/Ca
(mmol/mol)
δ18
O
(‰ vPDB)
Correlateda
SST (°C)
Δ88/86
Srb
(‰ A-aq)
TH-32 8.93 -4.264 26.0 -0.186
TH-33 8.73 -4.487 27.1
TH-34 8.51 -4.657 28.0
TH-35 8.68 -4.751 28.5 -0.187
TH-36 8.62 -4.699 28.3 a SST as reconstructed from Sr/Ca in SOT-1 and from δ
18O in TH-1
b reproducibility of 0.020‰ (2SD) according to JCP-1 measurements
(n=10)
Analytical measurements
Part of each powder that was sampled from the two Porites core slabs (TH1 and SOT-1) was
measured for δ18
O on Finnigan MAT252 at GEOMAR, Kiel. The data are presented in the usual
δ-notation versus the vPDB standard. The analytical uncertainty was smaller than 0.06‰ (2SD).
Powders from all coral samples and from the inorganic experiments were dissolved in 2% HNO3
and analyzed for elemental ratios on Agilent 7500 Quadrupole ICP-MS at the mass-spectrometer
facilities of GEOMAR, Kiel. The measurements were done using the bracketing standard
method, with JCP-1 as the bracketing standard. The precision of the measurements was about 1-
2% depending on the element measured.
Water samples were also analyzed for elemental ratios on Varian 720-ES ICP-OES at
GEOMAR, Kiel. Strontium isotopes (88/86
Sr) measurements of both water samples and the
aragonite powders were done on the Finnigan Triton TIMS at GEOMAR in Kiel using the
87Sr/
84Sr double spike method (Krabbenhöft et al., 2009). Sr was separated in the spiked and
unspiked samples, using chromatographic column with BIO-RAD 650 ml columns and Eichrom
Sr-SPS resin (mesh size 50–100 mm).
Sr isotopic values are presented in the usual δ-notation where δ88/86
Sr is the difference between
the 88
Sr/86
Sr ratio of the aragonite sample and the isotopic ratio of the standard relative to the
standard (using SRM987 value of 88
Sr/86
Sr=8.375209 as the standard).
⁄ (
⁄
⁄
) Eq. III.5
CHAPTER III- 88Sr/86Sr IN INORGANIC ARAGONITE AND IN CORALS |49
In each batch of carbonate samples measurements, JCP-1 standard (0.20±0.02‰) was also
measured. IAPSO standard was measured in batches of seawater sample measurements
(0.39±0.02‰). No blank correction was needed since the total procedural Sr blanks were about
0.04 ng, which is insignificant compared to the amount of Sr in the measured samples (300–700
ng).
For comparison, the data is presented as the δ88/86
Sr-difference between the sample and the
solution from which it precipitated.
⁄ ⁄ ⁄ Eq. III.6
Data of all the analytical measurements are presented together with the statistical measurement
uncertainty as two standard deviations (2SD), determined from the repeated JCP-1 measurements
and not specifically for each sample. δ88/86Sr in JCP-1 is 0.20±0.02‰ (2SD) and was measured
in 10 different measurements.
Rayleigh based model calculations
The predicted ∆88/86
Sr values in corals that derives from the Rayleigh based model were
calculated using the combined equations of Rayleigh process equation and the equation for δ
notation (equations 3.1.17 from Zeebe and Wolf-gladrow, (2001) and equation 5 from the current
study).
( (
)
)
⁄ ⁄ Eq. III.7
Where ∆88/86
SrRayleigh is the predicted isotopic signal in corals’ aragonite for a certain seawater
temperature. The temperature is a variable in the remaining fraction parameter (f), which was
determined by the Rayleigh based model (Gaetani et al., 2011). The fractionation factor α
describes the isotopic difference between the bulk solution and the mineral. The model is using
inorganic fractionation factors assuming that the calcification is inorganic precipitation from a
finite reservoir. Ri (88
Sr/86
Sr: 8.37850±0.00002) and RSTD (88
Sr/86
Sr: 8.37520±0.00002) are the
88Sr/
86Sr ratios in the initial bulk solution (we used seawater as the initial value) and in the
CHAPTER III- 88Sr/86Sr IN INORGANIC ARAGONITE AND IN CORALS |50
SRM987 standard, respectively. The initial value δ88/86
Sri corresponds to 0.39±0.02 being the
isotopic signal in the initial bulk solution.
The remaining fraction (f) is the resulting parameter in the Rayleigh based model polynomial
equation, which is a function of temperature (T in kelvins) (Gaetani et al., 2011).
Eq. III.8
The model manipulates f using c1, c2, c3 and c4 variables so that at each temperature the
difference between the calculated elemental ratios (M/CaRayleigh) and the measured elemental
ratios (M/Cameasured) in the coral will be the smallest possible (Eq. III.9), where M is a measured
trace element. Since the model assumes that seawater is modified in the calcifying space, the
multi-variables model (c1, c2, c3, c4, Cai and Mi) necessitate the use of several temperatures and
multi element ratios.
∑( (
)
) Eq. III.9
We used f values obtained by modeling Sr/Ca and Mg/Ca of Acropora sp. specimens from
Reynaud et al. (2007), and calculations based on Gaetani et al. (2011). We calculated
∆88/86
SrRayleigh with the minimum and maximum inorganic aragonite α values (0.9997875 and
0.9998685) that were measured in our study.
Results
Temperature calibrations of the cores and correlation to ∆88/86
Sr
Core TH1
We obtained good correlation of δ18
O between the current study results and the results of the
adjacent slab that was measured by Cahyarini et al. (2008). Radiography of the slab did not show
distinct density bands. Therefore, we determined the duration covered by the transect from the
seasonal variations of the measured δ18
O. However, since the definite period of the transect
could not be reconstructed, we used the δ18
O-temperature calibration that was obtained by
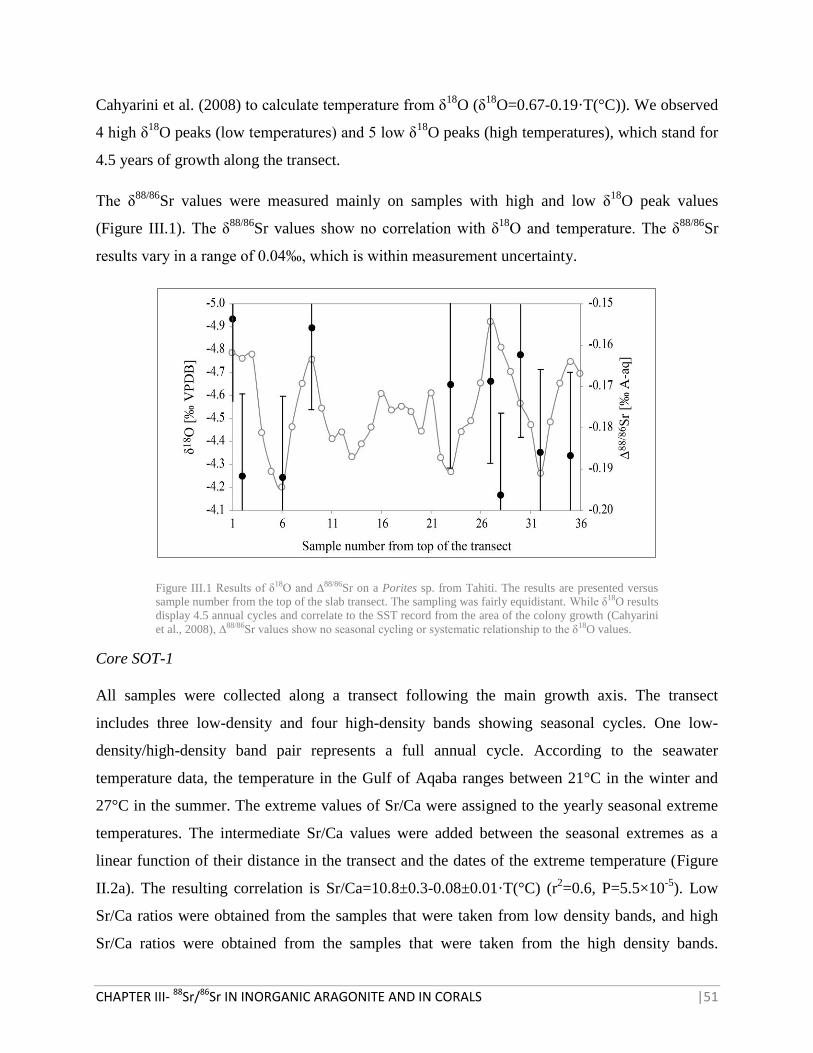
CHAPTER III- 88Sr/86Sr IN INORGANIC ARAGONITE AND IN CORALS |51
Cahyarini et al. (2008) to calculate temperature from δ18
O (δ18
O=0.67-0.19·T(°C)). We observed
4 high δ18
O peaks (low temperatures) and 5 low δ18
O peaks (high temperatures), which stand for
4.5 years of growth along the transect.
The δ88/86
Sr values were measured mainly on samples with high and low δ18
O peak values
(Figure III.1). The δ88/86
Sr values show no correlation with δ18
O and temperature. The δ88/86
Sr
results vary in a range of 0.04‰, which is within measurement uncertainty.
Figure III.1 Results of δ18O and ∆88/86Sr on a Porites sp. from Tahiti. The results are presented versus
sample number from the top of the slab transect. The sampling was fairly equidistant. While δ18O results
display 4.5 annual cycles and correlate to the SST record from the area of the colony growth (Cahyarini
et al., 2008), ∆88/86Sr values show no seasonal cycling or systematic relationship to the δ18O values.
Core SOT-1
All samples were collected along a transect following the main growth axis. The transect
includes three low-density and four high-density bands showing seasonal cycles. One low-
density/high-density band pair represents a full annual cycle. According to the seawater
temperature data, the temperature in the Gulf of Aqaba ranges between 21°C in the winter and
27°C in the summer. The extreme values of Sr/Ca were assigned to the yearly seasonal extreme
temperatures. The intermediate Sr/Ca values were added between the seasonal extremes as a
linear function of their distance in the transect and the dates of the extreme temperature (Figure
II.2a). The resulting correlation is Sr/Ca=10.8±0.3-0.08±0.01·T(°C) (r2=0.6, P=5.5×10
-5). Low
Sr/Ca ratios were obtained from the samples that were taken from low density bands, and high
Sr/Ca ratios were obtained from the samples that were taken from the high density bands.
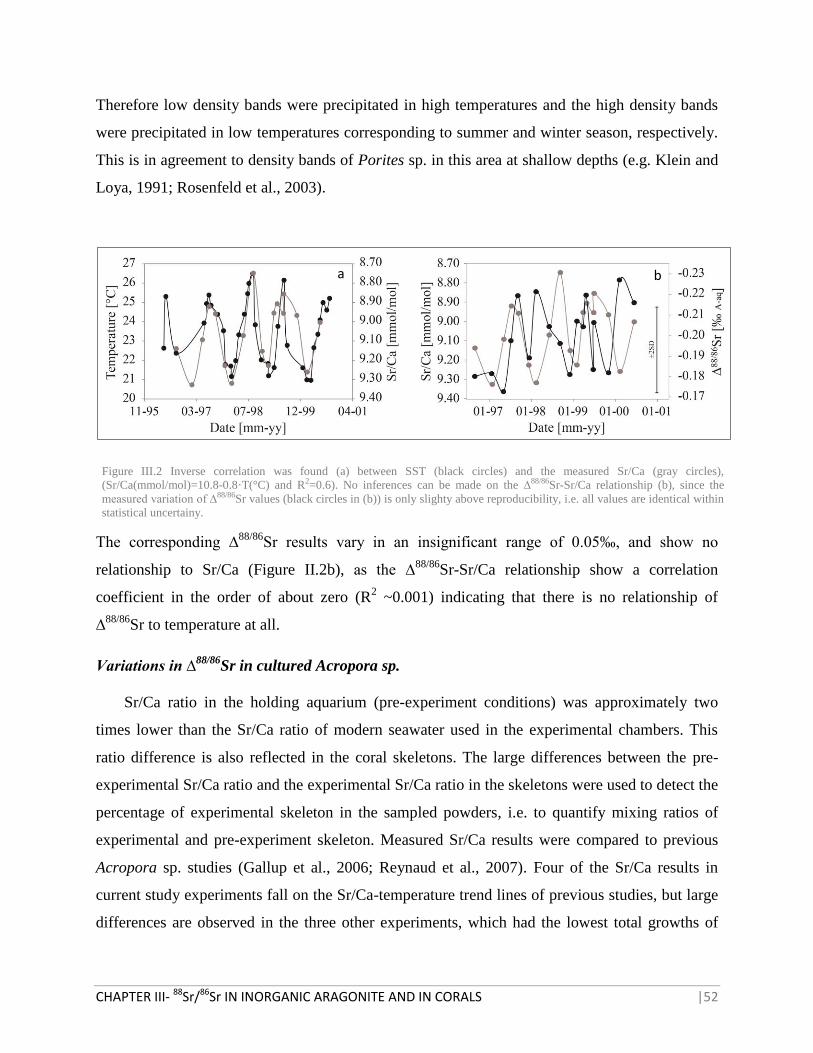
CHAPTER III- 88Sr/86Sr IN INORGANIC ARAGONITE AND IN CORALS |52
Therefore low density bands were precipitated in high temperatures and the high density bands
were precipitated in low temperatures corresponding to summer and winter season, respectively.
This is in agreement to density bands of Porites sp. in this area at shallow depths (e.g. Klein and
Loya, 1991; Rosenfeld et al., 2003).
Figure III.2 Inverse correlation was found (a) between SST (black circles) and the measured Sr/Ca (gray circles),
(Sr/Ca(mmol/mol)=10.8-0.8·T(°C) and R2=0.6). No inferences can be made on the ∆88/86Sr-Sr/Ca relationship (b), since the
measured variation of ∆88/86Sr values (black circles in (b)) is only slighty above reproducibility, i.e. all values are identical within
statistical uncertainy.
The corresponding ∆88/86
Sr results vary in an insignificant range of 0.05‰, and show no
relationship to Sr/Ca (Figure II.2b), as the ∆88/86
Sr-Sr/Ca relationship show a correlation
coefficient in the order of about zero (R2 ~0.001) indicating that there is no relationship of
∆88/86
Sr to temperature at all.
Variations in ∆88/86
Sr in cultured Acropora sp.
Sr/Ca ratio in the holding aquarium (pre-experiment conditions) was approximately two
times lower than the Sr/Ca ratio of modern seawater used in the experimental chambers. This
ratio difference is also reflected in the coral skeletons. The large differences between the pre-
experimental Sr/Ca ratio and the experimental Sr/Ca ratio in the skeletons were used to detect the
percentage of experimental skeleton in the sampled powders, i.e. to quantify mixing ratios of
experimental and pre-experiment skeleton. Measured Sr/Ca results were compared to previous
Acropora sp. studies (Gallup et al., 2006; Reynaud et al., 2007). Four of the Sr/Ca results in
current study experiments fall on the Sr/Ca-temperature trend lines of previous studies, but large
differences are observed in the three other experiments, which had the lowest total growths of
a b
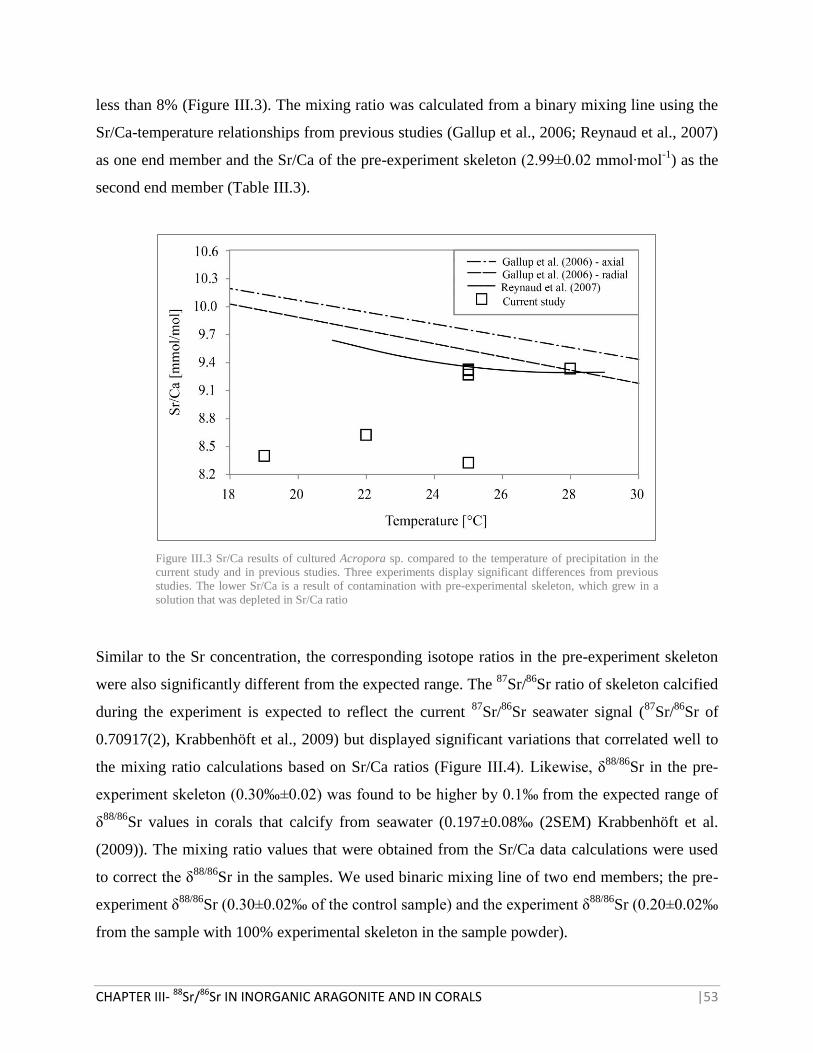
CHAPTER III- 88Sr/86Sr IN INORGANIC ARAGONITE AND IN CORALS |53
less than 8% (Figure III.3). The mixing ratio was calculated from a binary mixing line using the
Sr/Ca-temperature relationships from previous studies (Gallup et al., 2006; Reynaud et al., 2007)
as one end member and the Sr/Ca of the pre-experiment skeleton (2.99±0.02 mmol∙mol-1
) as the
second end member (Table III.3).
Figure III.3 Sr/Ca results of cultured Acropora sp. compared to the temperature of precipitation in the
current study and in previous studies. Three experiments display significant differences from previous
studies. The lower Sr/Ca is a result of contamination with pre-experimental skeleton, which grew in a
solution that was depleted in Sr/Ca ratio
Similar to the Sr concentration, the corresponding isotope ratios in the pre-experiment skeleton
were also significantly different from the expected range. The 87
Sr/86
Sr ratio of skeleton calcified
during the experiment is expected to reflect the current 87
Sr/86
Sr seawater signal (87
Sr/86
Sr of
0.70917(2), Krabbenhöft et al., 2009) but displayed significant variations that correlated well to
the mixing ratio calculations based on Sr/Ca ratios (Figure III.4). Likewise, δ88/86
Sr in the pre-
experiment skeleton (0.30‰±0.02) was found to be higher by 0.1‰ from the expected range of
δ88/86
Sr values in corals that calcify from seawater (0.197±0.08‰ (2SEM) Krabbenhöft et al.
(2009)). The mixing ratio values that were obtained from the Sr/Ca data calculations were used
to correct the δ88/86
Sr in the samples. We used binaric mixing line of two end members; the pre-
experiment δ88/86
Sr (0.30±0.02‰ of the control sample) and the experiment δ88/86
Sr (0.20±0.02‰
from the sample with 100% experimental skeleton in the sample powder).
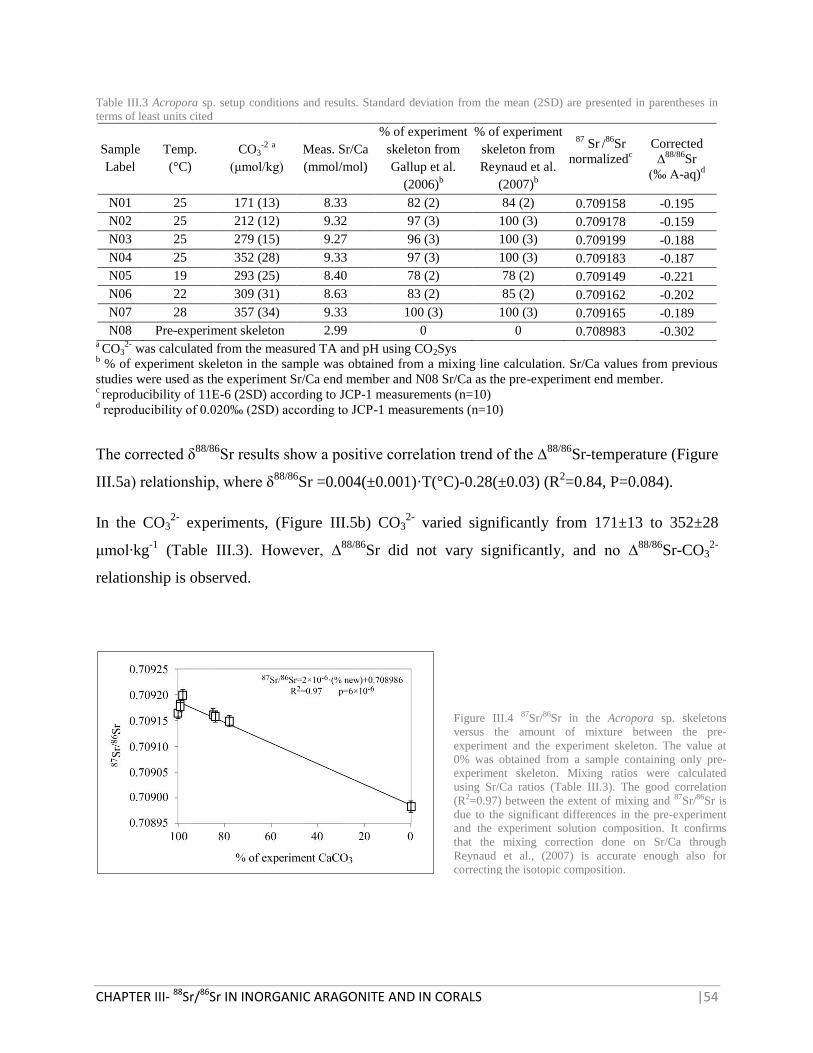
CHAPTER III- 88Sr/86Sr IN INORGANIC ARAGONITE AND IN CORALS |54
Table III.3 Acropora sp. setup conditions and results. Standard deviation from the mean (2SD) are presented in parentheses in
terms of least units cited
Sample
Label
Temp.
(°C)
CO3-2
a
(μmol/kg)
Meas. Sr/Ca
(mmol/mol)
% of experiment
skeleton from
Gallup et al.
(2006)b
% of experiment
skeleton from
Reynaud et al.
(2007)b
87 Sr
/86
Sr
normalizedc
Corrected
∆88/86
Sr
(‰ A-aq)d
N01 25 171 (13) 8.33 82 (2) 84 (2) 0.709158 -0.195
N02 25 212 (12) 9.32 97 (3) 100 (3) 0.709178 -0.159
N03 25 279 (15) 9.27 96 (3) 100 (3) 0.709199 -0.188
N04 25 352 (28) 9.33 97 (3) 100 (3) 0.709183 -0.187
N05 19 293 (25) 8.40 78 (2) 78 (2) 0.709149 -0.221
N06 22 309 (31) 8.63 83 (2) 85 (2) 0.709162 -0.202
N07 28 357 (34) 9.33 100 (3) 100 (3) 0.709165 -0.189
N08 Pre-experiment skeleton 2.99 0 0 0.708983 -0.302 a CO3
2- was calculated from the measured TA and pH using CO2Sys
b % of experiment skeleton in the sample was obtained from a mixing line calculation. Sr/Ca values from previous
studies were used as the experiment Sr/Ca end member and N08 Sr/Ca as the pre-experiment end member. c reproducibility of 11E-6 (2SD) according to JCP-1 measurements (n=10)
d reproducibility of 0.020‰ (2SD) according to JCP-1 measurements (n=10)
The corrected δ88/86
Sr results show a positive correlation trend of the ∆88/86
Sr-temperature (Figure
III.5a) relationship, where δ88/86
Sr =0.004(±0.001)·T(°C)-0.28(±0.03) (R2=0.84, P=0.084).
In the CO32-
experiments, (Figure III.5b) CO32-
varied significantly from 171±13 to 352±28
μmol∙kg-1
(Table III.3). However, ∆88/86
Sr did not vary significantly, and no ∆88/86
Sr-CO32-
relationship is observed.
Figure III.4 87Sr/86Sr in the Acropora sp. skeletons
versus the amount of mixture between the pre-
experiment and the experiment skeleton. The value at
0% was obtained from a sample containing only pre-
experiment skeleton. Mixing ratios were calculated
using Sr/Ca ratios (Table III.3). The good correlation
(R2=0.97) between the extent of mixing and 87Sr/86Sr is
due to the significant differences in the pre-experiment
and the experiment solution composition. It confirms
that the mixing correction done on Sr/Ca through
Reynaud et al., (2007) is accurate enough also for
correcting the isotopic composition.
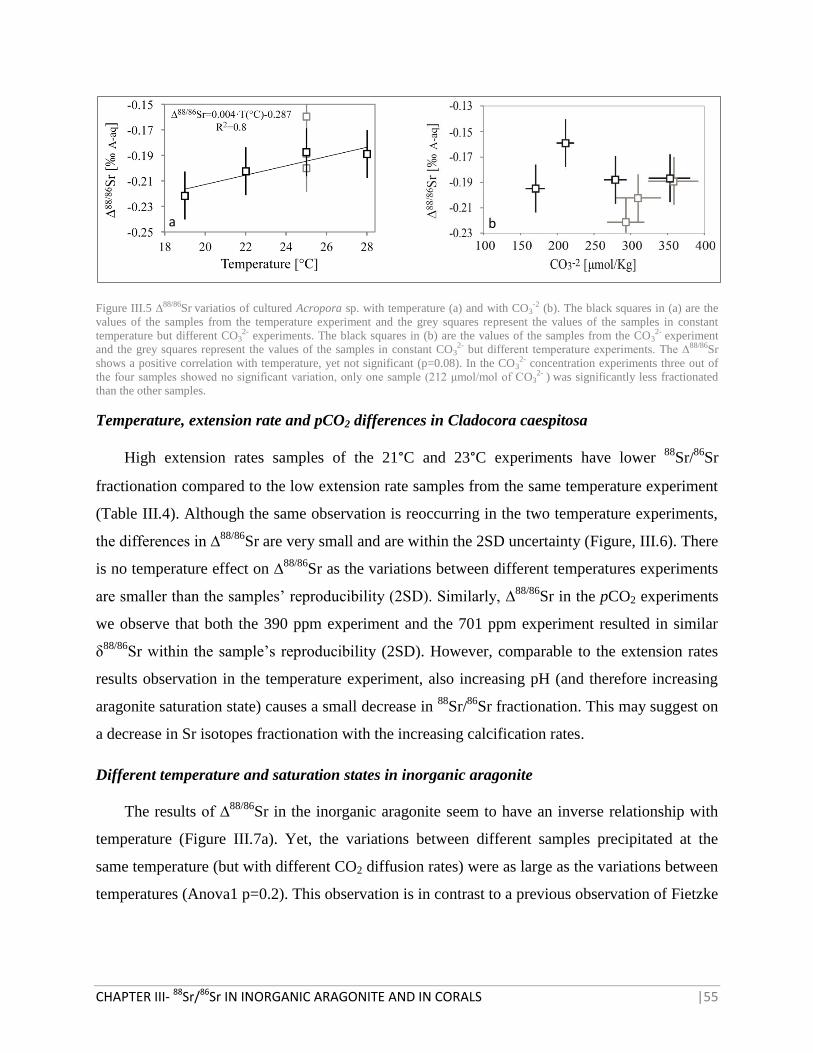
CHAPTER III- 88Sr/86Sr IN INORGANIC ARAGONITE AND IN CORALS |55
Figure III.5 ∆88/86Sr variatios of cultured Acropora sp. with temperature (a) and with CO3-2 (b). The black squares in (a) are the
values of the samples from the temperature experiment and the grey squares represent the values of the samples in constant
temperature but different CO32- experiments. The black squares in (b) are the values of the samples from the CO3
2- experiment
and the grey squares represent the values of the samples in constant CO32- but different temperature experiments. The ∆88/86Sr
shows a positive correlation with temperature, yet not significant (p=0.08). In the CO32- concentration experiments three out of
the four samples showed no significant variation, only one sample (212 μmol/mol of CO32- ) was significantly less fractionated
than the other samples.
Temperature, extension rate and pCO2 differences in Cladocora caespitosa
High extension rates samples of the 21°C and 23°C experiments have lower 88
Sr/86
Sr
fractionation compared to the low extension rate samples from the same temperature experiment
(Table III.4). Although the same observation is reoccurring in the two temperature experiments,
the differences in ∆88/86
Sr are very small and are within the 2SD uncertainty (Figure, III.6). There
is no temperature effect on ∆88/86
Sr as the variations between different temperatures experiments
are smaller than the samples’ reproducibility (2SD). Similarly, ∆88/86
Sr in the pCO2 experiments
we observe that both the 390 ppm experiment and the 701 ppm experiment resulted in similar
δ88/86
Sr within the sample’s reproducibility (2SD). However, comparable to the extension rates
results observation in the temperature experiment, also increasing pH (and therefore increasing
aragonite saturation state) causes a small decrease in 88
Sr/86
Sr fractionation. This may suggest on
a decrease in Sr isotopes fractionation with the increasing calcification rates.
Different temperature and saturation states in inorganic aragonite
The results of ∆88/86
Sr in the inorganic aragonite seem to have an inverse relationship with
temperature (Figure III.7a). Yet, the variations between different samples precipitated at the
same temperature (but with different CO2 diffusion rates) were as large as the variations between
temperatures (Anova1 p=0.2). This observation is in contrast to a previous observation of Fietzke
a b
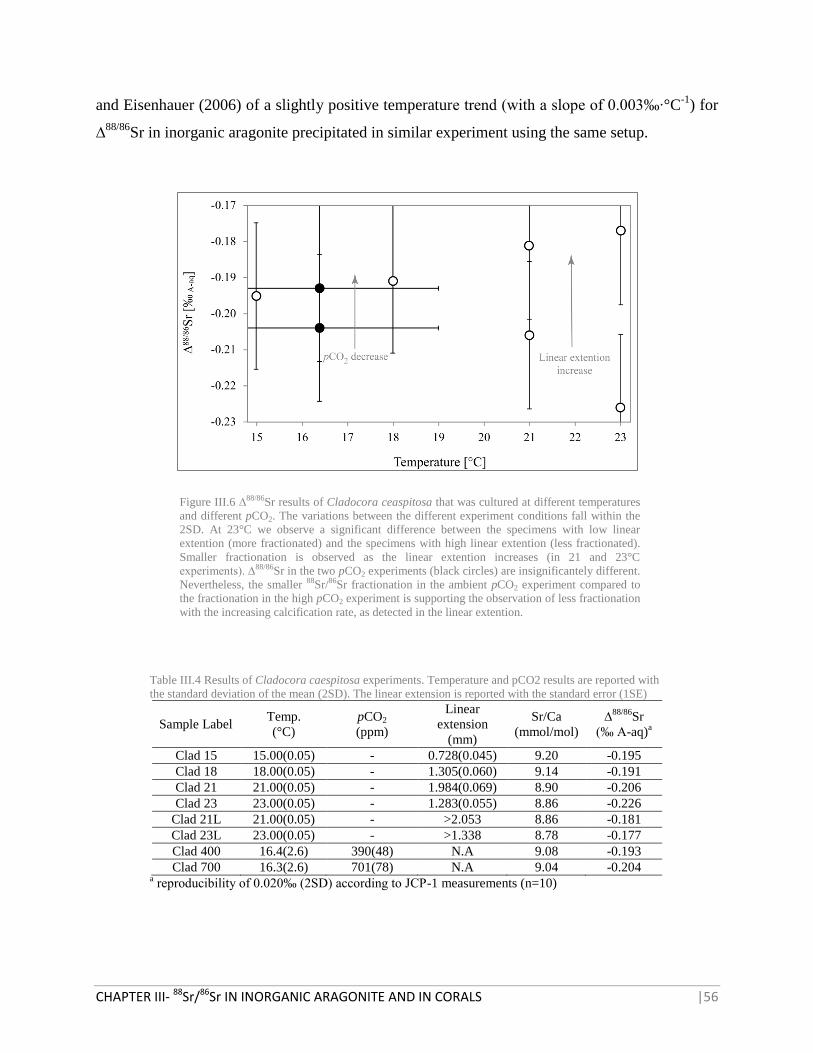
CHAPTER III- 88Sr/86Sr IN INORGANIC ARAGONITE AND IN CORALS |56
and Eisenhauer (2006) of a slightly positive temperature trend (with a slope of 0.003‰∙°C-1
) for
∆88/86
Sr in inorganic aragonite precipitated in similar experiment using the same setup.
Figure III.6 ∆88/86Sr results of Cladocora ceaspitosa that was cultured at different temperatures
and different pCO2. The variations between the different experiment conditions fall within the
2SD. At 23°C we observe a significant difference between the specimens with low linear
extention (more fractionated) and the specimens with high linear extention (less fractionated).
Smaller fractionation is observed as the linear extention increases (in 21 and 23°C
experiments). ∆88/86Sr in the two pCO2 experiments (black circles) are insignificantely different.
Nevertheless, the smaller 88Sr/86Sr fractionation in the ambient pCO2 experiment compared to
the fractionation in the high pCO2 experiment is supporting the observation of less fractionation
with the increasing calcification rate, as detected in the linear extention.
Table III.4 Results of Cladocora caespitosa experiments. Temperature and pCO2 results are reported with
the standard deviation of the mean (2SD). The linear extension is reported with the standard error (1SE)
Sample Label Temp.
(°C)
pCO2
(ppm)
Linear
extension
(mm)
Sr/Ca
(mmol/mol)
∆88/86
Sr
(‰ A-aq)a
Clad 15 15.00(0.05) - 0.728(0.045) 9.20 -0.195
Clad 18 18.00(0.05) - 1.305(0.060) 9.14 -0.191
Clad 21 21.00(0.05) - 1.984(0.069) 8.90 -0.206
Clad 23 23.00(0.05) - 1.283(0.055) 8.86 -0.226
Clad 21L 21.00(0.05) - >2.053 8.86 -0.181
Clad 23L 23.00(0.05) - >1.338 8.78 -0.177
Clad 400 16.4(2.6) 390(48) N.A 9.08 -0.193
Clad 700 16.3(2.6) 701(78) N.A 9.04 -0.204 a reproducibility of 0.020‰ (2SD) according to JCP-1 measurements (n=10)
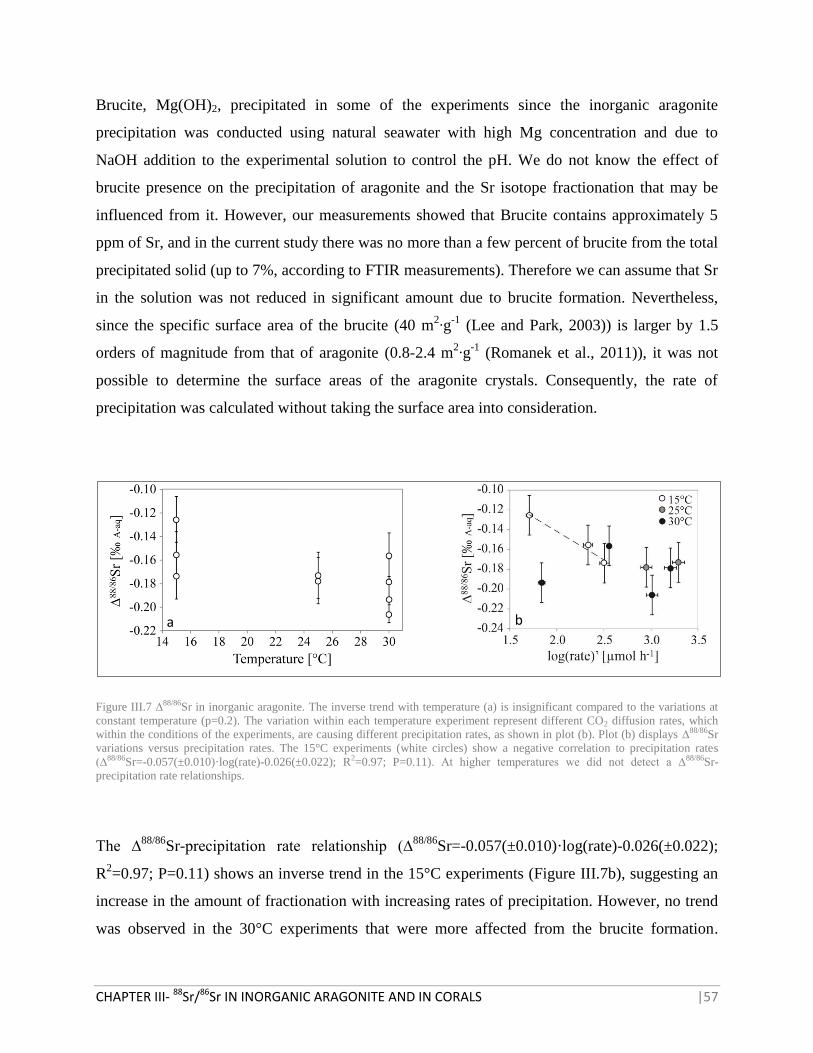
CHAPTER III- 88Sr/86Sr IN INORGANIC ARAGONITE AND IN CORALS |57
Brucite, Mg(OH)2, precipitated in some of the experiments since the inorganic aragonite
precipitation was conducted using natural seawater with high Mg concentration and due to
NaOH addition to the experimental solution to control the pH. We do not know the effect of
brucite presence on the precipitation of aragonite and the Sr isotope fractionation that may be
influenced from it. However, our measurements showed that Brucite contains approximately 5
ppm of Sr, and in the current study there was no more than a few percent of brucite from the total
precipitated solid (up to 7%, according to FTIR measurements). Therefore we can assume that Sr
in the solution was not reduced in significant amount due to brucite formation. Nevertheless,
since the specific surface area of the brucite (40 m2∙g
-1 (Lee and Park, 2003)) is larger by 1.5
orders of magnitude from that of aragonite (0.8-2.4 m2∙g
-1 (Romanek et al., 2011)), it was not
possible to determine the surface areas of the aragonite crystals. Consequently, the rate of
precipitation was calculated without taking the surface area into consideration.
Figure III.7 ∆88/86Sr in inorganic aragonite. The inverse trend with temperature (a) is insignificant compared to the variations at
constant temperature (p=0.2). The variation within each temperature experiment represent different CO2 diffusion rates, which
within the conditions of the experiments, are causing different precipitation rates, as shown in plot (b). Plot (b) displays ∆88/86Sr
variations versus precipitation rates. The 15°C experiments (white circles) show a negative correlation to precipitation rates
(∆88/86Sr=-0.057(±0.010)·log(rate)-0.026(±0.022); R2=0.97; P=0.11). At higher temperatures we did not detect a ∆88/86Sr-
precipitation rate relationships.
The ∆88/86
Sr-precipitation rate relationship (∆88/86
Sr=-0.057(±0.010)·log(rate)-0.026(±0.022);
R2=0.97; P=0.11) shows an inverse trend in the 15°C experiments (Figure III.7b), suggesting an
increase in the amount of fractionation with increasing rates of precipitation. However, no trend
was observed in the 30°C experiments that were more affected from the brucite formation.
a b
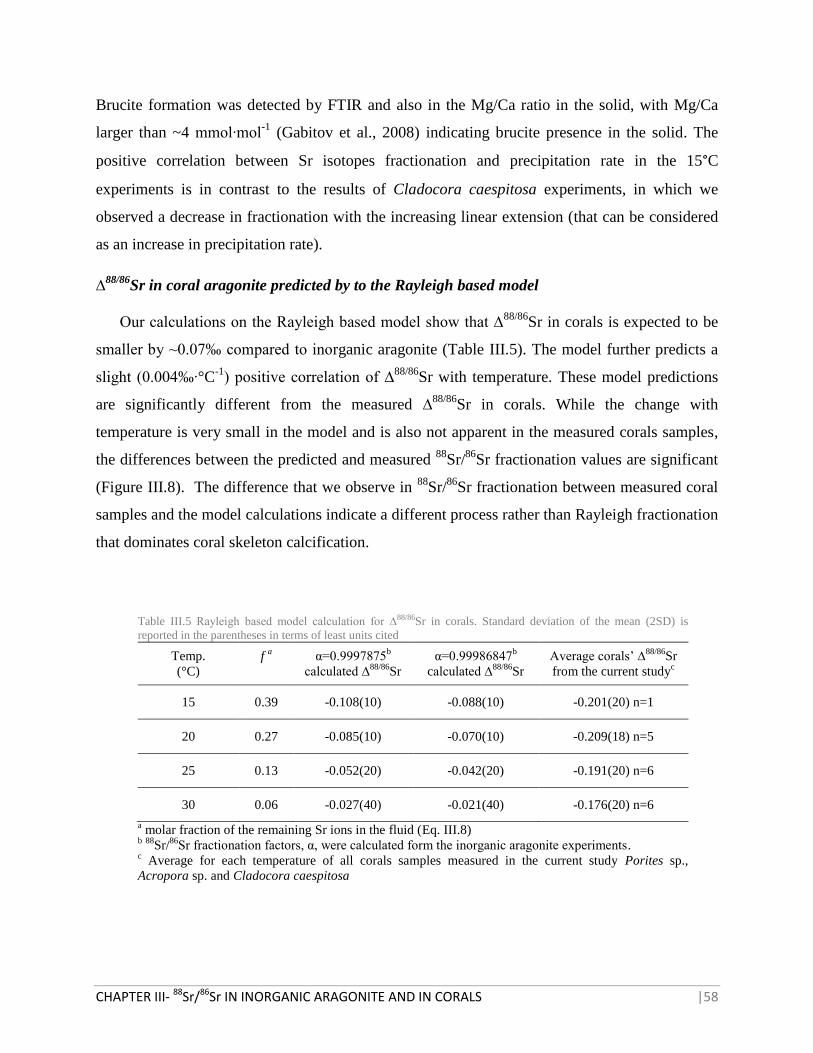
CHAPTER III- 88Sr/86Sr IN INORGANIC ARAGONITE AND IN CORALS |58
Brucite formation was detected by FTIR and also in the Mg/Ca ratio in the solid, with Mg/Ca
larger than ~4 mmol∙mol-1
(Gabitov et al., 2008) indicating brucite presence in the solid. The
positive correlation between Sr isotopes fractionation and precipitation rate in the 15°C
experiments is in contrast to the results of Cladocora caespitosa experiments, in which we
observed a decrease in fractionation with the increasing linear extension (that can be considered
as an increase in precipitation rate).
∆88/86
Sr in coral aragonite predicted by to the Rayleigh based model
Our calculations on the Rayleigh based model show that ∆88/86
Sr in corals is expected to be
smaller by ~0.07‰ compared to inorganic aragonite (Table III.5). The model further predicts a
slight (0.004‰∙°C-1
) positive correlation of ∆88/86
Sr with temperature. These model predictions
are significantly different from the measured ∆88/86
Sr in corals. While the change with
temperature is very small in the model and is also not apparent in the measured corals samples,
the differences between the predicted and measured 88
Sr/86
Sr fractionation values are significant
(Figure III.8). The difference that we observe in 88
Sr/86
Sr fractionation between measured coral
samples and the model calculations indicate a different process rather than Rayleigh fractionation
that dominates coral skeleton calcification.
Table III.5 Rayleigh based model calculation for ∆88/86Sr in corals. Standard deviation of the mean (2SD) is
reported in the parentheses in terms of least units cited
Temp.
(°C)
f a
α=0.9997875b
calculated ∆88/86
Sr
α=0.99986847b
calculated ∆88/86
Sr
Average corals’ ∆88/86
Sr
from the current studyc
15 0.39 -0.108(10) -0.088(10) -0.201(20) n=1
20 0.27 -0.085(10) -0.070(10) -0.209(18) n=5
25 0.13 -0.052(20) -0.042(20) -0.191(20) n=6
30 0.06 -0.027(40) -0.021(40) -0.176(20) n=6
a molar fraction of the remaining Sr ions in the fluid (Eq. III.8)
b 88
Sr/86
Sr fractionation factors, α, were calculated form the inorganic aragonite experiments. c Average for each temperature of all corals samples measured in the current study Porites sp.,
Acropora sp. and Cladocora caespitosa
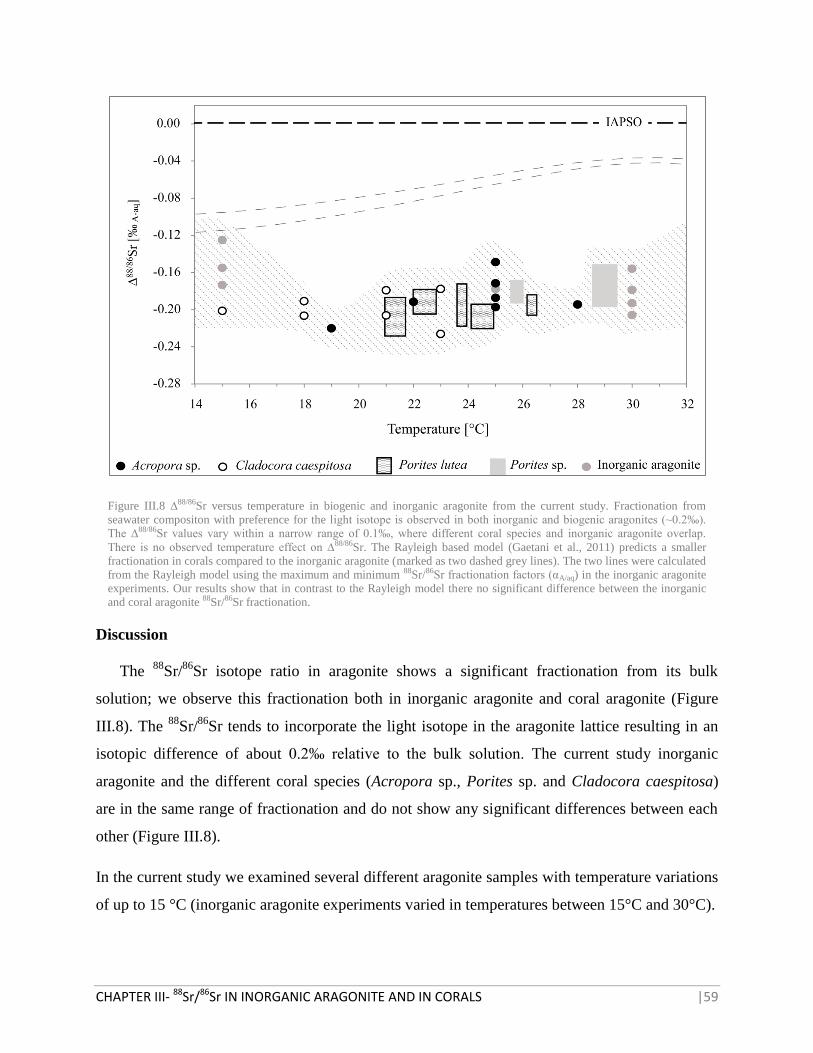
CHAPTER III- 88Sr/86Sr IN INORGANIC ARAGONITE AND IN CORALS |59
Figure III.8 ∆88/86Sr versus temperature in biogenic and inorganic aragonite from the current study. Fractionation from
seawater compositon with preference for the light isotope is observed in both inorganic and biogenic aragonites (~0.2‰).
The ∆88/86Sr values vary within a narrow range of 0.1‰, where different coral species and inorganic aragonite overlap.
There is no observed temperature effect on ∆88/86Sr. The Rayleigh based model (Gaetani et al., 2011) predicts a smaller
fractionation in corals compared to the inorganic aragonite (marked as two dashed grey lines). The two lines were calculated
from the Rayleigh model using the maximum and minimum 88Sr/86Sr fractionation factors (αA/aq) in the inorganic aragonite
experiments. Our results show that in contrast to the Rayleigh model there no significant difference between the inorganic
and coral aragonite 88Sr/86Sr fractionation.
Discussion
The 88
Sr/86
Sr isotope ratio in aragonite shows a significant fractionation from its bulk
solution; we observe this fractionation both in inorganic aragonite and coral aragonite (Figure
III.8). The 88
Sr/86
Sr tends to incorporate the light isotope in the aragonite lattice resulting in an
isotopic difference of about 0.2‰ relative to the bulk solution. The current study inorganic
aragonite and the different coral species (Acropora sp., Porites sp. and Cladocora caespitosa)
are in the same range of fractionation and do not show any significant differences between each
other (Figure III.8).
In the current study we examined several different aragonite samples with temperature variations
of up to 15 °C (inorganic aragonite experiments varied in temperatures between 15°C and 30°C).
CHAPTER III- 88Sr/86Sr IN INORGANIC ARAGONITE AND IN CORALS |60
The total δ88/86
Sr variation in the inorganic aragonite samples is 0.08‰, and shows a weak
inverse correlation with temperature. The δ88/86
Sr variations within each temperature, which
correspond to different precipitation rates, are almost as large as the variation in the 15°C range,
resulting in obscuring the possible temperature correlation. We found a slight positive correlation
between temperature and δ88/86
Sr in Acropora sp. experiments. Nevertheless, the variations are
very small (0.004‰∙°C-1) and comparable in magnitude to the analytical uncertainty (2SD of
±0.02) for the temperature range of 9°C in our experiments. The temperature trend was also not
observed in the other coral samples. Fietzke & Eisenhauer (2006) found a positive correlation in
both inorganic aragonite and in Pavona clavus corals. The change in δ88/86
Sr with temperature in
the corals was observed as 0.033‰∙°C-1
, whereas in inorganic aragonite the slope was
0.005‰∙°C-1
similar to our Acropora results. Large positive δ88/86
Sr-temperature correlation was
also observed by Rüggeberg et al. (2008) for a cold water coral, Lophelia pertusa. The current
study as well as Krabbenhöft et al. (2010) and Raddatz et al. (2013) could not reproduce the
large variations in δ88/86
Sr in coral aragonite, nor their temperature correlation. Within the
analytical uncertainty of ±0.02‰ (2SD) in δ88/86
Sr in carbonates, a 0.005‰∙°C-1 change over a
40°C temperature range that was observed in inorganic aragonite by Fietzke & Eisenhauer
(2006), and an average 0.003‰∙°C-1 change over 15°C from the current study are too small to
detect changes in temperature within the narrow temperature range of corals’ living environment
(typically <10°C).
The results from the Rayleigh based model suggest that δ88/86Sr in corals’ aragonite should be up
to 0.15‰ less fractionated than open system inorganic aragonite (Figure III.8). ∆88/86
Sr of the
Pavona clavus (Fietzke and Eisenhauer, 2006) shows an increasing divergence from the
fractionation values that are observed in the current study as the temperature increases. 88
Sr/86
Sr
fractionation is significantly reduced in Pavona clavus with the increasing temperature, where in
27°C the observed ∆88/86
Sr is -0.06‰ (Fietzke and Eisenhauer, 2006). Generally, the positive
∆88/86
Sr – temperature correlation and the significant difference between inorganic aragonite
results and the Pavona clavus may suggest that Rayleigh process dominates the coral’s
calcification process. However, the observed Pavona clavus ∆88/86
Sr – temperature slope is much
larger (0.033±0.005‰∙°C-1) than the moderate slope predicted by the Rayleigh model
(approximately 0.004‰∙°C-1). Our data show that inorganic aragonite and corals’ aragonite have
CHAPTER III- 88Sr/86Sr IN INORGANIC ARAGONITE AND IN CORALS |61
similar ∆88/86
Sr. In our calculations we considered that the initial δ88/86
Sr is similar to seawater
composition (0.39±0.02‰). Gaetani et al. (2011), however, suggested that the initial
composition of the bulk solution is slightly modified from seawater composition. In order to test
the possibility that the corals’ initial δ88/86Sr is modified from the normal seawater value, we
calculated the initial δ88/86
Sr in the bulk solution that will result in corals’ aragonite with similar
δ88/86
Sr to inorganic aragonite. We obtained a range of δ88/86
Sr in the bulk solution depending on
temperature. The range between 0.317‰ in 15°C and 0.232‰ in 30°C is significant and implies
that the 88
Sr/86
Sr fractionation in corals contradicts the Rayleigh based model.
A similar observation was discussed by Rollion-Bard et al. (2009) who found similar
fractionation in Li isotopes between inorganic aragonite and corals’ aragonite. While Li/Ca ratio
follows Rayleigh based model, Li isotopes is unaffected by the Rayleigh fractionation. They
explained Li isotopes disagreement with the Rayleigh fractionation model by the large reservoir
of Li compared to its small incorporation in corals’ skeleton. Case et al. (2010) proposed that Ca
concentration variations in the calcifying fluid dominate the Rayleigh fractionation effect. For
this reason, highly discriminated elements such as Mg and Li vary according to the Rayleigh
fractionation of Mg/Ca and Li/Ca, but Li isotopes are not affected (Case et al., 2010). Sr, in
contrast to Li, is not highly discriminated as the inorganic discrimination fractionation factor of
Sr/Ca is close to unity. While Sr/Ca was shown to be strongly affected by the Rayleigh
fractionation effect (Gaetani et al., 2011), Sr isotopes show similar behavior to Li isotopes and
are in disagreement with the Rayleigh based model.
Conclusions
As was previously shown, both inorganic aragonite and coralline aragonite incorporate
preferentially the light isotope (86
Sr) over the heavy isotope (88
Sr). We found that the
fractionation of 88
Sr/86
Sr in inorganic aragonite is similar within statistical uncertainty to the
fractionation in corals’ aragonites. The fractionation from the bulk solution in both inorganic and
corals’ aragonite is 0.2‰.
Our data shows a total range of 0.08‰ in aragonite ∆88/86
Sr values. Generally, the total range has
significant variability. However, it appears that neither temperature nor precipitation rates
CHAPTER III- 88Sr/86Sr IN INORGANIC ARAGONITE AND IN CORALS |62
dominantly control these variations. This is in contrast to previous observations for temperature
dependency in δ88/86
Sr in corals (Fietzke and Eisenhauer, 2006; Rüggeberg et al., 2008).
The δ88/86
Sr values from corals contradict the Rayleigh based model. The model predicts smaller
88Sr/
86Sr fractionation in corals compared to open system inorganic aragonite due to the finite
solution conditions. However, our data shows that inorganic aragonite precipitated in an open
system conditions has similar ∆88/86
Sr as corals’ aragonite.
Acknowledgments
We wish to thank Ana Kolevica, Regina Surberg, Andrea Wolf and Maria Hierz for
supporting the lab work of this study. Funding support was provided through the European Marie
Curie Initial Training Network "Calcification by Marine Organisms" (CalMarO) and the
European Community's Seventh Framework Programme (FP7/2007-2013).
References
Beck J. W., Edwards R. L., Ito E., Taylor F. W., Recy J., Rougerie F., Joannot P. and Henin C.
(1992) Sea-surface temperature from coral skeletal strontium/calcium ratios. Science (80-. ).
257, 644–7.
Cahyarini S. Y., Pfeiffer M. and Dullo W. C. (2009) Improving SST reconstructions from coral
Sr/Ca records : multiple corals from Tahiti ( French Polynesia ). Int. J. Earth Sci. 31–40.
Cahyarini S. Y., Pfeiffer M., Timm O., Dullo W. C. and Schoenberg D. G. (2008)
Reconstructing seawater δ18O from paired coral δ18O and Sr/Ca ratios: Methods , error
analysis and problems , with examples from Tahiti ( French Polynesia ) and Timor
(Indonesia). Geochim. Cosmochim. Acta 72, 2841–2853.
Case D. H., Robinson L. F., Auro M. E. and Gagnon A. C. (2010) Environmental and biological
controls on Mg and Li in deep-sea scleractinian corals. Earth Planet. Sci. Lett. 300, 215–
225.
Corrège T. (2006) Sea surface temperature and salinity reconstruction from coral geochemical
tracers. Palaeogeogr. Palaeoclimatol. Palaeoecol. 232, 408 – 428.
Dietzel M., Gussone N. and Eisenhauer A. (2004) Co-precipitation of Sr2+
and Ba2+
with
aragonite by membrane diffusion of CO2 between 10 and 50°C. Chem. Geol. 203, 139–151.
CHAPTER III- 88Sr/86Sr IN INORGANIC ARAGONITE AND IN CORALS |63
Dodge R. E., Wyers S. C., Frith H. R., Knap A. H., Smith S. R., Cook C. B. and Sleeter T. D.
(1984) Corals calcification rates by the buoyant weight technique: effect of alizarin staining.
J. Exp. Mar. Biol. Ecol. 15, 217–232.
Fallon S. J., McCulloch M. T., van Woesik R. and Sinclair D. J. (1999) Corals at their latitudinal
limits: laser ablation trace element systematics in Porites from Shirigai Bay, Japan. Earth
Planet. Sci. Lett. 172, 221–238.
Fietzke J. and Eisenhauer A. (2006) Determination of temperature-dependent stable strontium
isotope (88
Sr/86
Sr) fractionation via bracketing standard MC-ICP-MS. Geochemistry
Geophys. Geosystems 7.
Gabitov R. I., Gaetani G. A., Watson E. B., Cohen A. L. and Ehrlich H. L. (2008) Experimental
determination of growth rate effect on U6+ and Mg2+ partitioning between aragonite and
fluid at elevated U6+ concentration. Geochim. Cosmochim. Acta 72, 4058–4068.
Gaetani G. A. and Cohen A. L. (2006) Element partitioning during precipitation of aragonite
from seawater: A framework for understanding paleoproxies. Geochim. Cosmochim. Acta
70, 4617–4634.
Gaetani G. A., Cohen A. L., Wang Z. and Crusius J. (2011) Rayleigh-based, multi-element coral
thermometry: A biomineralization approach to developing climate proxies. Geochim.
Cosmochim. Acta 75, 1920–1932.
Gagnon A. C., Adkins J. F., Fernandez D. and Robinson L. (2007) Sr/Ca and Mg/Ca vital effects
correlated with skeletal architecture in a scleractinian deep-sea coral and the role of
Rayleigh fractionation. Earth Planet. Sci. Lett. 261, 280–295.
Gallup C. D., Olson D. M., Edwards R. L., Gruhn L. M., Winter A. and Taylor F. W. (2006)
Sr/Ca-Sea surface temperature calibration in the branching Caribbean coral Acropora
palmata. Geophys. Res. Lett. 33, 2–5.
Halicz L., Segal I., Fruchter N., Stein M. and Lazar B. (2008) Strontium stable isotopes
fractionate in the soil environments? Earth Planet. Sci. Lett. 272, 406–411.
Kaspar J., Trovarelli A., Zamoner F., Farnetti E. and Graziani M. (1991) Chemoselective
Reduction of Enones to Allylic Alcohols, in: Studies in Surface Science and Catalysis
Volume 59. p. 257.
Klein R. and Loya Y. (1991) Skeletal growth and density patterns of two Porites corals from the
Gulf of Eilat , Red Sea. Mar. Ecol. Prog. Ser. 77, 253–259.
Krabbenhöft A., Eisenhauer A., Böhm F., Vollstaedt H., Fietzke J., Liebetrau V., Augustin N.,
Peucker-Ehrenbrink B., Müller M. N., Horn C., Hansen B. T., Nolte N. and Wallmann K.
(2010) Constraining the marine strontium budget with natural strontium isotope
CHAPTER III- 88Sr/86Sr IN INORGANIC ARAGONITE AND IN CORALS |64
fractionations (87
Sr/86
Sr*, δ88/86
Sr) of carbonates, hydrothermal solutions and river waters.
Geochim. Cosmochim. Acta 74, 4097–4109.
Krabbenhöft A., Fietzke J., Eisenhauer A., Liebetrau V., Böhm F. and Vollstaedt H. (2009)
Determination of radiogenic and stable strontium isotope ratios (87
Sr/86
Sr; δ88/86
Sr) by
thermal ionization mass spectrometry applying an 87
Sr/84
Sr double spike. J. Anal. At.
Spectrom. 24, 1267.
Lee M. H. and Park D. G. (2003) Preparation of MgO with high surface area, and modification
of its pore characteristics. Bull. Korean Chem. Soc. 24, 1437–1443.
Lewis E. and Wallace D. W. R. (1998) Program Developed for CO2 System Calculations.
Marshall J. F. and McCulloch M. T. (2002) An assessment of the Sr/Ca ratio in shallow water
hermatypic corals as a proxy for sea surface temperature. Geochim. Cosmochim. Acta 66,
3263–3280.
Mitsuguchi T., Matsumoto E., Abe O., Uchida T. and Isdale P. J. (1996) Mg/Ca Thermometry in
Coral Skeletons. Science (80-. ). 274, 962–963.
Montagna P., Correa López M., Rüggeberg A., McCulloch M. T., Rodolfo-Metalpa R., Ferrier-
Pagès C., Freiwald A., Goldstein S. L., Henderson G. M., Mazzoli C., Russo S., Silenzi S.,
Taviani M. and Trotter J. (2009) Li/Mg ratios in shallow and deep-sea coral exoskeleton as
a new temperature proxy. AGU Fall Meet. 14-18 December, 2009, San Fr. USA.
Raddatz J., Liebetrau V., Rüggeberg A., Hathorne E. C., Krabbenhöft A., Eisenhauer A., Böhm
F., Vollstaedt H., Fietzke J., López Correa M., Freiwald A. and Dullo W.-C. (2013) Stable
Sr-isotope, Sr/Ca, Mg/Ca, Li/Ca and Mg/Li ratios in the scleractinian cold-water coral
Lophelia pertusa. Chem. Geol. 352, 143–152.
Reynaud S., Ferrier-Pagès C., Meibom A., Mostefaoui S., Mortlock R., Fairbanks R. and
Allemand D. (2007) Light and temperature effects on Sr/Ca and Mg/Ca ratios in the
scleractinian coral Acropora sp. Geochim. Cosmochim. Acta 71, 354–362.
Rollion-Bard C., Vigier N., Meibom A., Blamart D., Reynaud S., Rodolfo-Metalpa R., Martin S.
and Gattuso J.-P. (2009) Effect of environmental conditions and skeletal ultrastructure on
the Li isotopic composition of scleractinian corals. Earth Planet. Sci. Lett. 286, 63–70.
Romanek C. S., Morse J. W. and Grossman E. L. (2011) Aragonite Kinetics in Dilute Solutions.
Aquat. Geochemistry 17, 339–356.
Rosenfeld M., Yam R., Shemesh A. and Loya Y. (2003) Implication of water depth on stable
isotope composition and skeletal density banding patterns in a Porites lutea colony: results
from a long-term translocation experiment. Coral Reefs 22, 337–345.
CHAPTER III- 88Sr/86Sr IN INORGANIC ARAGONITE AND IN CORALS |65
Rüggeberg A., Fietzke J., Liebetrau V., Eisenhauer A., Dullo W. C. and Freiwald A. (2008)
Stable strontium isotopes (δ88/86Sr) in cold-water corals — A new proxy for reconstruction
of intermediate ocean water temperatures. Earth Planet. Sci. Lett. 269, 570–575.
Schmidt G. A. (1999) Error analysis of paleosalinity calculations. Paleoceanography 14, 422–
429.
Trotter J., Montagna P., McCulloch M. T., Silenzi S., Reynaud S., Mortimer G., Martin S.,
Ferrier-Pagès C., Gattuso J.-P. and Rodolfo-Metalpa R. (2011) Quantifying the pH “vital
effect” in the temperate zooxanthellate coral Cladocora caespitosa: Validation of the boron
seawater pH proxy. Earth Planet. Sci. Lett. 303, 163–173.
Watanabe T., Minagawa M., Oba T. and Winter A. (2001) Pretreatment of coral aragonite for
Mg and Sr analysis: Implications for coral thermometers. Geochem. J. 35, 265–270.
Weber J. N. and Woodhead P. M. J. (1972) Temperature dependence of oxygen-18 concentration
in reef coral carbonates. J. Geophys. Res. 77, 463.
Wiechers H. N. S., Sturrock P. and Marais G. V. R. (1975) Calcium carbonate crystallization
kinetics. Water Res. 9, 835–845.
Zeebe R. E. and Wolf-Gladrow D. A. (2001) CO2 in seawater: equilibrium, kinetics, isotopes.
Elsevier Oceanography Series, Elsevier.
CHAPTER IV. KINETIC CONTROL ON 44
Ca/40
Ca
INCORPORATION IN CORALS ARAGONITE
Noa Fruchter1*
, Anton Eisenhauer1, Martin Dietzel
2, Jan Fietzke
1, Florian Böhm
1, Andrea
Niedermayr3, and Jonathan Erez
4
1 GEOMAR, Helmholtz-Zentrum für Ozeanforschung Kiel, Wischhofstr. 1-3, 24148 Kiel, Germany
2 TU Graz Institute of Applied Geosciences. Graz University of Technology. 8010 Graz, Austria
3 Ruhr University Bochum, Universitätsstraße 150, 44801 Bochum, Germany
4The Hebrew University, The Edmond J. safra Campus Givat Ram Jerusalem, Israel
*Current address: Geological Survey of Israel, Malkhei Israel 30 Jerusalem, Israel
In preparation, to be submitted to Geochimica et Cosmochimica Acta
CHAPTER IV- KINETIC CONTROL ON 44Ca/40Ca INCORPORATION IN CORALS ARAGONITE |67
Abstract
We observe a strong kinetic effect on Ca incorporation in aragonite. This effect is observed
in both inorganic aragonite and in corals. As the rate of precipitation increases the isotope
fractionation decreases (44
Ca/40
Ca). At high precipitation rates above ~104.0
μmol·m-2
·h-1
the
fractionation becomes constant in a minimum fractionation point. Since corals calcify at high
rates of 103.9
μmol·m-2
·h-1
and above, no rate effect on Ca isotopes fractionation is expected.
Ionic strength appears to have insignificant effect on Ca incorporation of inorganic aragonite. We
hypothesize that Ca isotope fractionation in corals is controlled by the saturation state in the
extracellular fluid and the rate of calcification.
Introduction
Scleractinian corals are major marine calcifiers. Their aragonite skeleton calcifies from the
marine solution while incorporating trace elements and isotopes to the skeleton. The elemental
ratios and isotopes incorporation differences between coral and inorganic aragonite is termed
“vital effect”, and is attributed to the biological control of the organism on the skeleton
precipitation. However, not much is known on the pathways and processes of elements and
isotopes incorporation into the skeletons and the deviation of the measured ratios from the
expected thermodynamic equilibrium. Several studies proposed that a significant Ca contribution
to the calcification fluid in corals occurs through an active transport via the so called
“transcellular pathway” (Krishnaveni et al., 1989; Tambutté et al., 1996; Clode and Marshall,
2002b). In this mechanism, ions are being transported through the cytoplasm of the calicoblastic
cells to the extracellular calcifying fluid (ECF), which is located in the transition zone between
cell layer and forming skeleton. This transport is active and is aided by designated enzymes that
transport specific ions, such as Ca2+
ATPase for Ca2+
transport, through the cells. An additional
transport mechanism called “paracellular transport” is proposed in other studies (Erez and Braun,
2007; Gagnon et al., 2012; Tambutté et al., 2012). This mechanism suggests a passive seawater
transport to the ECF via diffusion that occurs due to chemical gradient between the calicoblatic
cells. Although many studies have discussed the mechanisms of transport to the ECF, the role
and importance of transcellular and paracellular mechanisms is still unclear. In particular, the
process of Ca incorporation in the skeleton is unresolved, as it is not yet certain whether Ca
CHAPTER IV- KINETIC CONTROL ON 44Ca/40Ca INCORPORATION IN CORALS ARAGONITE |68
reaches the ECF through Ca+2
ATPase transport or by a passive transport of seawater, or rather by
a combination of both possible mechanisms.
Recently, as analytical improvements were made, it became possible to detect small variations in
natural fractionation processes of non-traditional stable isotopes, including the isotopes of Ca.
The fractionation of Ca isotopes in coral is reported to be significantly different from
fractionation in inorganic marine carbonate and aragonite specifically (Böhm et al., 2006). Ca
isotope fractionation values in corals range from ∆44/40
Cacoral-sw=-0.7‰ (Halicz et al., 1999) to
∆44/40
Cacoral-sw=-1.2‰ (Böhm et al., 2006). The range of Ca isotope fractionation in inorganic
marine carbonates is distinctively larger, as calcite is averagely ∆44/40
Cacalcite-sw=-0.84‰ (Tang et
al., 2008), and aragonite has higher fractionation of approximately ∆44/40
Caaragonite-sw=-1.5‰
(Gussone et al., 2003). Hence, there is a significant difference in Ca isotope values between
corals and inorganic aragonite, which is commonly attributed to the so called “vital effect”. A
previous study suggested a positive temperature dependency on Ca isotope fractionation in corals
(Böhm et al., 2006). They found a 0.020±0.015‰·°C-1 dependency which is very small
compared to the reported uncertainty (0.1‰ 2σ), and corresponding to a temperature resolution
in the order of 5°C. To our knowledge no other systematic study on the temperature dependency
of ∆44/40
Ca in corals with a sufficiently large temperature range has been published so far. The
observed variation of ∆44/40
Ca in natural and cultured corals is approximately 0.3 to 0.6‰
(Chang et al., 2004; Böhm et al., 2006; Pretet et al., 2013), which would correspond to an
unreasonable temperature variation of 15 to 30°C when using the suggested temperature
dependency. This clearly shows that additional factors other than temperature contribute
significantly to calcium isotope variability in corals (Pretet et al., 2013). Since temperature
variations cause variations in precipitation rates, it can be assumed that other factors that control
the precipitation rate may control the Ca isotopes incorporation in aragonite.
Only one study was published on the relationship between Ca isotopes fractionation and
precipitation rate in aragonite (Gussone et al., 2005). In calcite, however, several studies
described the dependency of Ca isotopes on precipitation rates (Lemarchand et al., 2004; Tang et
al., 2008; DePaolo, 2011). Lemarchand et al. (2004) observed decreasing isotope fractionation as
a function of increasing precipitation rate, whereas Tang et al. (2008) demonstrate an increasing
Ca isotope fractionation as a function of increasing precipitation rates. These two observations of
CHAPTER IV- KINETIC CONTROL ON 44Ca/40Ca INCORPORATION IN CORALS ARAGONITE |69
Lemarchand et al. (2004) and Tang et al. (2008) are discrepant and still pending an explanation.
Similar to the calcite observation of Lemarchand et al. (2004), Gussone et al. (2005) observed a
decrease in Ca isotopes fractionation with the increasing precipitation rate in aragonite. Böhm et
al. (2006) combined the inorganic calcite data of Lemarchand et al. (2004) and inorganic
aragonite data of Gussone et al. (2005) in order to explain the observed offset in ∆44/40
Ca
between corals and inorganic aragonite. Using the available data sets, they excluded precipitation
rate as a significant factor controlling Ca isotope incorporation in the zooxanthellae corals
Porites, Acropora and Pavona. Moreover, Böhm et al. (2006) and Pretet et al. (2013) compared
Ca isotopes from layers of Porites skeletons grown with different extension rates (varying by a
factor of 5) and found no significant differences.
Recent study (Niedermayr et al., in preparation) performed inorganic aragonite precipitation
experiments using the CO2 diffusion technique (Dietzel et al., 2004), similar to the method used
by Tang et al., (2008) for calcite precipitation. The results show an inverse relationship between
precipitation rates and Ca isotopes fractionation, similar to the observations of the earlier
aragonite study (Gussone et al., 2005). The sufficiently large data set of Ca isotopes in inorganic
aragonite may be helpful to understand the differences of Ca isotopes incorporation in corals
compared to inorganic precipitation. In the current study we compare ∆44/40
Ca data of natural
seawater aragonite precipitation experiments with artificial solution aragonite precipitation
experiments from previous, published and unpublished, studies. We compare this data with
∆44/40
Ca of cultured Acropora sp. corals in order to better understand the factors controlling Ca
isotopes incorporation in inorganic and biogenic aragonite.
Methods
Experimental setup
Inorganic aragonite
Inorganic aragonite precipitation experiments were conducted at the University of
Technology in Graz, Austria from natural seawater using the CO2 diffusion technique as
described in detail in Dietzel et al. (2004). In this technique CO2 diffuses from an inner solution
to an outer solution via poly-ethylene (PE) membrane (we used two different membranes
CHAPTER IV- KINETIC CONTROL ON 44Ca/40Ca INCORPORATION IN CORALS ARAGONITE |70
thickness, 0.02 mm or 2 mm thick). The inner solution consists of 35 grams of NaHCO3 in a 0.5 l
solution at pH 7.5, and has a higher pCO2 than the outer solution. In order to increase the pCO2 in
some experiments we added 10 ml of 1N HCl to the inner solution. We applied three different
temperatures (15°C, 25°C and 30°C) and several precipitation rates (40-1260 μmol·h-1
·m-2
) in 6
experiments. Each experiment was conducted in 5 l of seawater as the outer solution, from which
the CaCO3 precipitates. The seawater with salinity of 40.7g∙kg-1
was collected during cruise
P408 in the Red Sea (19.09°N 39.49°E, 1000m) with Niskin bottles mounted onto a CTD-rosette
device in February 2011. The seawater solution was filtered in Sartobram P. sterile MidiCap
double filter of 0.45 μm and 0.2μm. A ‘Pt 1000’ temperature sensor was used to monitor the
temperature of the external water bath, which was kept constant using thermostatic water bath
(Julabo HC E07 F18 or Huber ministat 230 CCC2). A constant pH level of 8.30±0.03 was
maintained during the experiment using 0.5 N NaOH titration (Schott Titroline alpha plus
titrators), and an attached pH electrode (Blueline 28 pH) to monitor the experimental water pH.
Rate of precipitation is reported in μmol·m-2
·h-1
.
([ ] [ ] ) Eq. IV.1
Where [Ca]i and [Ca]f are the Ca concentration in the initial and the final solutions, respectively,
V is the volume of the solution, Δt is the duration of the precipitation and A is the measured
surface area of the solid. The specific surface area of the precipitates (A) was measured using
Brunauer Emmett Teller (BET) gas adsorption method at the University of Bochum. Helium-
nitrogen gas mixture was used in Micromeritics Flowsorb II 2300, which is designated for
surface area measurements.
Since Ca concentrations decreased during the experiments by up to ~28% compared to its
concentration in the initial solution, the Ca isotope fractionation values had to be corrected for
this depletion. The depletion is causing a Rayleigh distillation effect of the precipitating ions.
The calculation for the true ∆44/40
Ca in the aragonite samples was done using the Rayleigh
process equation combined with of the measured ∆ approximation as described in equation
3.1.17 and page 146 from Zeebe and Wolf-Gladrow (2001)
CHAPTER IV- KINETIC CONTROL ON 44Ca/40Ca INCORPORATION IN CORALS ARAGONITE |71
([ ]
[ ] ) Eq. IV.2
(
⁄
⁄ )
Eq. IV.3
Eq. IV.4
f is the remaining fraction in the fluid and [Ca]fs and [Ca]is are the Ca concentration in the final
and initial solution, respectively. α is the fractionation factor.
Corals experiments
Acropora sp. mini colonies were cultured in the department of Earth Sciences at the
Hebrew University of Jerusalem, Israel. The specimens were collected from one mother colony
several weeks prior to the beginning of the experiments. They were attached to an epoxy base
and were placed back in the main laboratory aquarium for recovery. Before the beginning of the
experiments the specimens were stained in 15 ppm solution of Alizarin-Red S (Dodge et al.,
1984) for seven hours. During the experiment each coral specimen was placed for seven weeks
in a 220 ml clear chamber supplied with 19 ml seawater per hour. Red Sea seawater was
collected from the pier at the Interuniversity Institute for Marine Sciences in Eilat (IUI) and
diluted, for the experiment, to 37g∙kg-1
. The flow-through system had residence time of 12 hours
while constantly stirred in the chamber using a magnetic stirrer. Light was supplied at
illumination of 200±10 μmol photons·m-2
·s-1
through metal-halide lamps in 12 hours dark/light
cycles. Temperature was kept constant in all tanks using heaters or a refrigerating system
connected to electronic controllers with a precision of ±0.3°C. The seven different experiments
varied in temperatures (19.0±0.3°C, 22.0±0.3°C, 25.0±0.3°C and 28.0±0.3°C) and aragonite
saturation states, Ω (2.45±0.38, 2.99±0.33, 3.92±0.43 and 4.89±0.67). The saturation state
experiments were carried out at 25±0.3°C. Different saturation states were set by adding
different amounts of 1N HCl to each of the saturation experimental reservoir water. Using the pH
and alkalinity measurements of the reservoir solution the saturation states of the initial condition
were determined (Table IV.1) in CO2Sys (Lewis and Wallace, 1998).
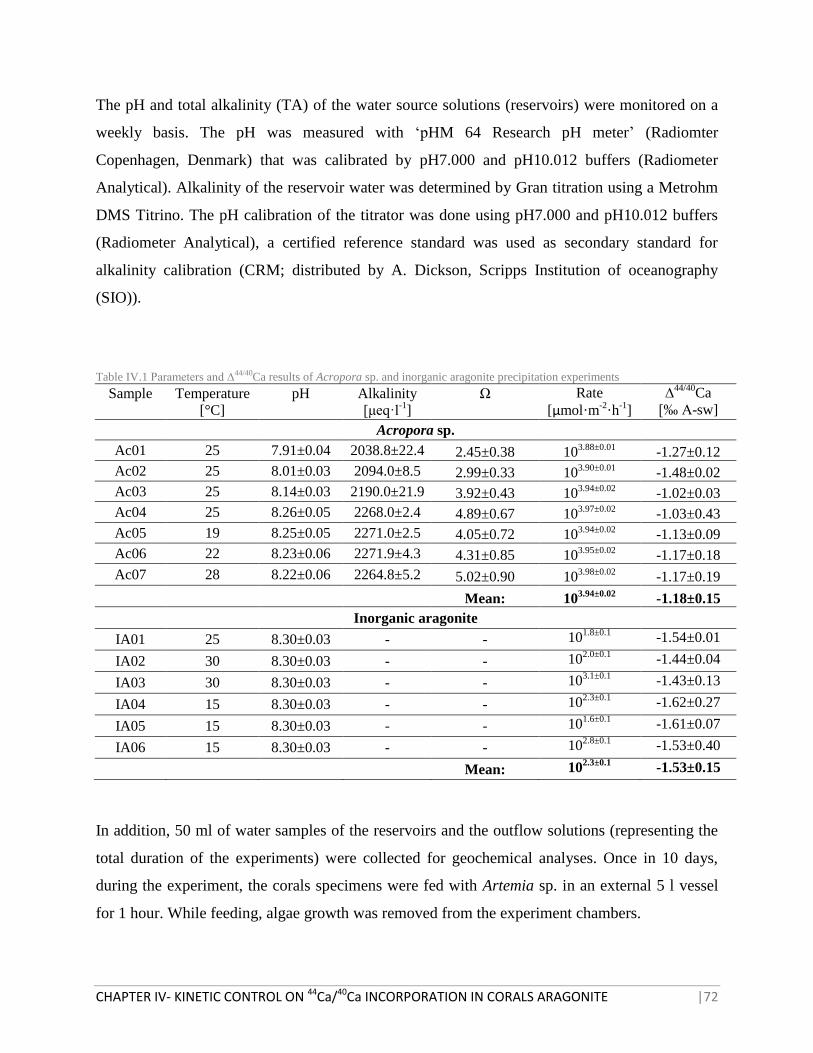
CHAPTER IV- KINETIC CONTROL ON 44Ca/40Ca INCORPORATION IN CORALS ARAGONITE |72
The pH and total alkalinity (TA) of the water source solutions (reservoirs) were monitored on a
weekly basis. The pH was measured with ‘pHM 64 Research pH meter’ (Radiomter
Copenhagen, Denmark) that was calibrated by pH7.000 and pH10.012 buffers (Radiometer
Analytical). Alkalinity of the reservoir water was determined by Gran titration using a Metrohm
DMS Titrino. The pH calibration of the titrator was done using pH7.000 and pH10.012 buffers
(Radiometer Analytical), a certified reference standard was used as secondary standard for
alkalinity calibration (CRM; distributed by A. Dickson, Scripps Institution of oceanography
(SIO)).
Table IV.1 Parameters and ∆44/40Ca results of Acropora sp. and inorganic aragonite precipitation experiments
Sample
Temperature
[°C]
pH
Alkalinity
[μeq·l-1
]
Ω
Rate
[μmol·m-2
·h-1
]
∆44/40
Ca
[‰ A-sw]
Acropora sp.
Ac01 25 7.91±0.04 2038.8±22.4 2.45±0.38 103.88±0.01
-1.27±0.12
Ac02 25 8.01±0.03 2094.0±8.5 2.99±0.33 103.90±0.01
-1.48±0.02
Ac03 25 8.14±0.03 2190.0±21.9 3.92±0.43 103.94±0.02
-1.02±0.03
Ac04 25 8.26±0.05 2268.0±2.4 4.89±0.67 103.97±0.02
-1.03±0.43
Ac05 19 8.25±0.05 2271.0±2.5 4.05±0.72 103.94±0.02
-1.13±0.09
Ac06 22 8.23±0.06 2271.9±4.3 4.31±0.85 103.95±0.02
-1.17±0.18
Ac07 28 8.22±0.06 2264.8±5.2 5.02±0.90 103.98±0.02
-1.17±0.19
Mean: 103.94±0.02
-1.18±0.15
Inorganic aragonite
IA01 25 8.30±0.03 - - 101.8±0.1
-1.54±0.01
IA02 30 8.30±0.03 - - 102.0±0.1
-1.44±0.04
IA03 30 8.30±0.03 - - 103.1±0.1
-1.43±0.13
IA04 15 8.30±0.03 - - 102.3±0.1
-1.62±0.27
IA05 15 8.30±0.03 - - 101.6±0.1
-1.61±0.07
IA06 15 8.30±0.03 - - 102.8±0.1
-1.53±0.40
Mean: 102.3±0.1
-1.53±0.15
In addition, 50 ml of water samples of the reservoirs and the outflow solutions (representing the
total duration of the experiments) were collected for geochemical analyses. Once in 10 days,
during the experiment, the corals specimens were fed with Artemia sp. in an external 5 l vessel
for 1 hour. While feeding, algae growth was removed from the experiment chambers.
CHAPTER IV- KINETIC CONTROL ON 44Ca/40Ca INCORPORATION IN CORALS ARAGONITE |73
The experiments were terminated after seven weeks. The corals skeletons were separated from
their tissue using an air-brush followed by bleach in 1% NaClO and wash in double deionized
water (DDW). Powder for isotopic analyses was collected from the specimens epoxy’s surface,
that contained only new skeleton that calcified during the experiments.
No Rayleigh effect corrections were needed for the Acropora sp. experiments since less than 5%
of the Ca in the water was used.
Analytical measurement
Aragonite samples were dissolved in 2.25N HCl for 44
Ca/40
Ca measurements. A 43
Ca/48
Ca
double spike was added to the solution of both dissolved aragonite samples and seawater
samples. Seawater samples were purified with a cation-exchange- chromatography column prior
the analyses following the protocol described in Heuser et al. (2002), whereas the carbonate
samples were measured without the chromatograph treatment, since Böhm et al. (2007) found
the chromatograph treatment unnecessary in case of carbonate samples.
The 44
Ca/40
Ca ratios were measured in a TRITON thermal ionization mass spectrometer (TIMS,
Thermo-Fisher) at GEOMAR using the 43
Ca/48
Ca double spike technique (Heuser et al., 2002).
The results are reported relative to the calcium carbonate reference material NIST SRM 915a.
The analytical uncertainty for δ44/40
Ca is expressed as two standard deviations (±2σ) determined
by measurements repeat from the same sample solution.
⁄ [ ] ( ⁄
⁄
) Eq. IV.5
⁄ [ ] ⁄ ⁄ Eq. IV.6
Acropora sp. δ44/40
Ca are reported relative to the Gulf of Eilat seawater (δ44/40
Caseawater=
1.84±0.08‰) reported in Kısakürek et al. (2011), and are similar within 2σ to our IAPSO
measurements (1.82±0.15‰). The δ44/40
Ca value in the inorganic aragonite samples are reported
relative to the measured initial Red-Sea value (2.07±0.17‰), which is slightly higher than the
reported IAPSO value but still within the reported 2σ standard deviation.
CHAPTER IV- KINETIC CONTROL ON 44Ca/40Ca INCORPORATION IN CORALS ARAGONITE |74
Results
We observe a general positive temperature - ∆44/40
Ca correlation (R2=0.78, p=0.02) in
inorganic aragonite. In contrast, the coral aragonite ∆44/40
Ca data do not show any correlation to
temperature. In particular, at the same temperature the coral´s Ca isotope values tend to be higher
when compared to the inorganic aragonite (Anova p=5×10⁻⁴
; Table IV.1). From the values in
Table IV.1 we can calculate a mean ∆44/40
Ca difference of 0.4±0.2‰ between inorganic and
coral aragonite. This follows the earlier general observation that Ca isotopes in corals are
apparently less fractionated by about 0.4 to 0.5‰ than in inorganic aragonite at the same
temperature (Böhm et al., 2006). The rates of coral aragonite precipitation are another varying
parameter in the inorganic aragonite experiments. Corals calcification rates in this study (103.9
-
104.0
μmol·m-2
·h-1
) were estimated using the correlation between saturation state and calcification
rate (Leclercq et al., 2000). The estimated calcification rates of the corals are ~100 times higher
than the inorganic aragonite experiments (Table IV.1). From observing these two precipitation
rates groups (corals and inorganic aragonite), it appears that higher precipitation rates correspond
to lower Ca isotope fractionation.
Discussion
Temperature - ∆44/40
Ca correlation in aragonite
In the current study, inorganic aragonite precipitated from seawater falls within the ∆44/40
Ca
– temperature trend line of Gussone et al. (2003) (Figure IV.1) who found a positive correlation
with a slope of 0.01‰·°C-1. However, temperature is not the exclusive varying parameter in the
experiments (Gussone et al., 2005). Their temperature experiments also varied in CO3-2
concentration and saturation states. The CO32-
variations are reported to be independent of the
temperature - CO32-
concentration relationship (Gussone et al., 2005). Therefore, ∆44/40
Ca
variation in Gussone et al. (2005) are caused by temperature and precipitation rates variations. A
later study observed large ∆44/40
Ca variations in inorganic aragonite of the same temperature
(Niedermayr, 2011). The variations at constant temperature but different precipitation rates are
clearly larger than the total temperature trend by Gussone et al. (2003) (Anova1 p=0.08). In
addition to weakening the ∆44/40
Ca – temperature trend in inorganic aragonite, these results
(Niedermayr, 2011) overlap with ∆44/40
Ca data of corals aragonite at the same temperature. It
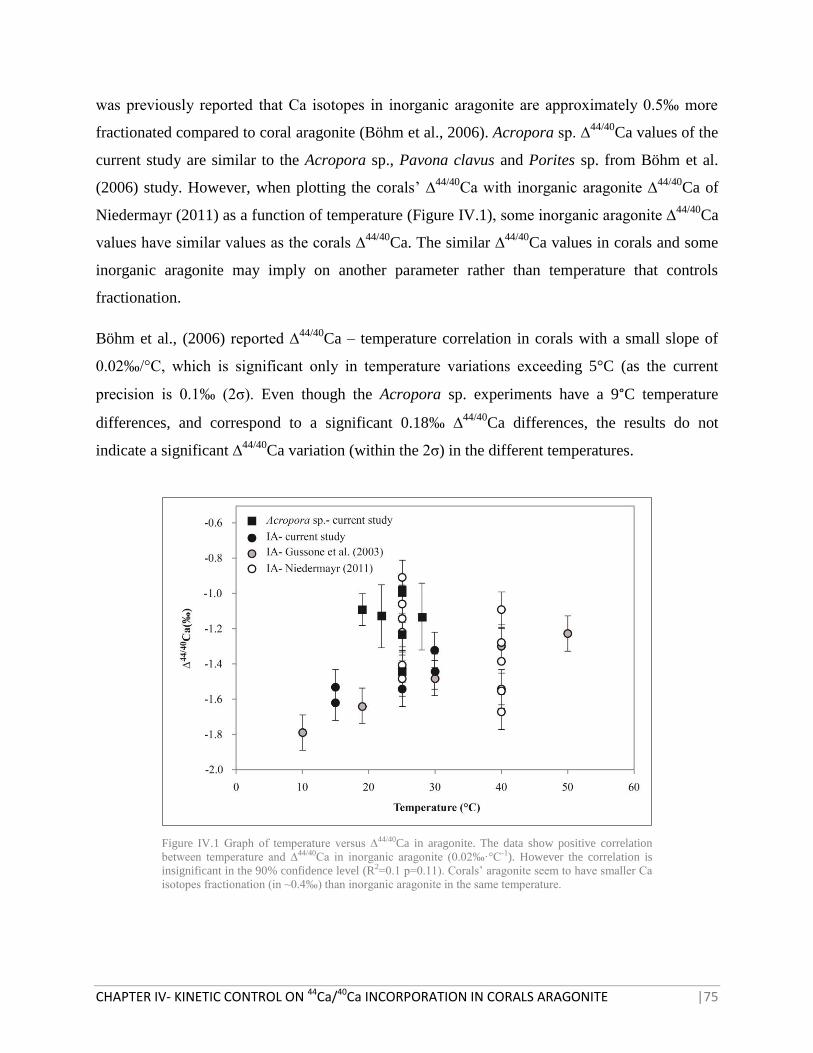
CHAPTER IV- KINETIC CONTROL ON 44Ca/40Ca INCORPORATION IN CORALS ARAGONITE |75
was previously reported that Ca isotopes in inorganic aragonite are approximately 0.5‰ more
fractionated compared to coral aragonite (Böhm et al., 2006). Acropora sp. ∆44/40
Ca values of the
current study are similar to the Acropora sp., Pavona clavus and Porites sp. from Böhm et al.
(2006) study. However, when plotting the corals’ ∆44/40
Ca with inorganic aragonite ∆44/40
Ca of
Niedermayr (2011) as a function of temperature (Figure IV.1), some inorganic aragonite ∆44/40
Ca
values have similar values as the corals ∆44/40
Ca. The similar ∆44/40
Ca values in corals and some
inorganic aragonite may imply on another parameter rather than temperature that controls
fractionation.
Böhm et al., (2006) reported ∆44/40
Ca – temperature correlation in corals with a small slope of
0.02‰/°C, which is significant only in temperature variations exceeding 5°C (as the current
precision is 0.1‰ (2σ). Even though the Acropora sp. experiments have a 9°C temperature
differences, and correspond to a significant 0.18‰ ∆44/40
Ca differences, the results do not
indicate a significant ∆44/40
Ca variation (within the 2σ) in the different temperatures.
Figure IV.1 Graph of temperature versus ∆44/40Ca in aragonite. The data show positive correlation
between temperature and ∆44/40Ca in inorganic aragonite (0.02‰·°C-1). However the correlation is
insignificant in the 90% confidence level (R2=0.1 p=0.11). Corals’ aragonite seem to have smaller Ca
isotopes fractionation (in ~0.4‰) than inorganic aragonite in the same temperature.
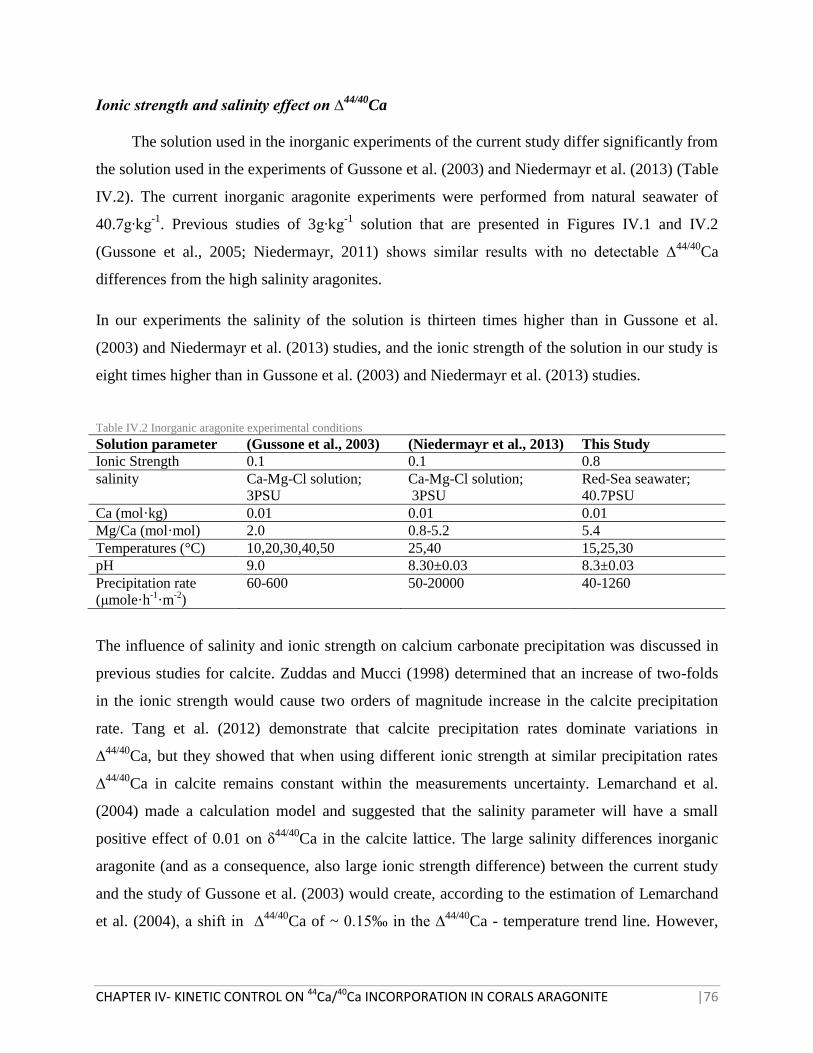
CHAPTER IV- KINETIC CONTROL ON 44Ca/40Ca INCORPORATION IN CORALS ARAGONITE |76
Ionic strength and salinity effect on ∆44/40
Ca
The solution used in the inorganic experiments of the current study differ significantly from
the solution used in the experiments of Gussone et al. (2003) and Niedermayr et al. (2013) (Table
IV.2). The current inorganic aragonite experiments were performed from natural seawater of
40.7g∙kg-1
. Previous studies of 3g∙kg-1
solution that are presented in Figures IV.1 and IV.2
(Gussone et al., 2005; Niedermayr, 2011) shows similar results with no detectable ∆44/40
Ca
differences from the high salinity aragonites.
In our experiments the salinity of the solution is thirteen times higher than in Gussone et al.
(2003) and Niedermayr et al. (2013) studies, and the ionic strength of the solution in our study is
eight times higher than in Gussone et al. (2003) and Niedermayr et al. (2013) studies.
Table IV.2 Inorganic aragonite experimental conditions
Solution parameter (Gussone et al., 2003) (Niedermayr et al., 2013) This Study
Ionic Strength 0.1 0.1 0.8
salinity Ca-Mg-Cl solution;
3PSU
Ca-Mg-Cl solution;
3PSU
Red-Sea seawater;
40.7PSU
Ca (mol·kg) 0.01 0.01 0.01
Mg/Ca (mol·mol) 2.0 0.8-5.2 5.4
Temperatures (°C) 10,20,30,40,50 25,40 15,25,30
pH 9.0 8.30±0.03 8.3±0.03
Precipitation rate
(μmole·h-1
·m-2
)
60-600 50-20000 40-1260
The influence of salinity and ionic strength on calcium carbonate precipitation was discussed in
previous studies for calcite. Zuddas and Mucci (1998) determined that an increase of two-folds
in the ionic strength would cause two orders of magnitude increase in the calcite precipitation
rate. Tang et al. (2012) demonstrate that calcite precipitation rates dominate variations in
∆44/40
Ca, but they showed that when using different ionic strength at similar precipitation rates
∆44/40
Ca in calcite remains constant within the measurements uncertainty. Lemarchand et al.
(2004) made a calculation model and suggested that the salinity parameter will have a small
positive effect of 0.01 on δ44/40
Ca in the calcite lattice. The large salinity differences inorganic
aragonite (and as a consequence, also large ionic strength difference) between the current study
and the study of Gussone et al. (2003) would create, according to the estimation of Lemarchand
et al. (2004), a shift in ∆44/40
Ca of ~ 0.15‰ in the ∆44/40
Ca - temperature trend line. However,
CHAPTER IV- KINETIC CONTROL ON 44Ca/40Ca INCORPORATION IN CORALS ARAGONITE |77
this shift is rather close to the uncertainty of ∆44/40
Ca measurement (± 0.1‰), and hence
insignificant (Figure IV.1). This may imply that the ∆44/40
Ca differences observed between
inorganic aragonite and corals’ aragonite (Figure IV.1) are not caused due to increasing ionic
strength of the solution in the ECF. Thus, we observe a significant difference in ∆44/40
Ca between
corals’ aragonite and inorganic aragonite, which is not caused by ionic strength differences.
Besides ionic strength, the different experiments varied in saturation states for aragonite, which
may be another factor for the ∆44/40
Ca variations between inorganic aragonite and corals’
aragonite.
Rate Effect on ∆44/40
Ca Incorporation in Inorganic and Coral Aragonite
The inorganic aragonite data showed here varied in precipitation rates that were controlled
through diffusion of CO2 into the bulk solution while keeping a constant pH. Therefore the
changes in precipitation rate are related to changes in the carbonate ion concentration and
saturation states in the bulk solution. The inorganic aragonite data from the current study
supported by data of previous studies (Gussone et al., 2005; Niedermayr et al., 2013) show a
positive relationship (∆44/40
Ca=logR·0.28±0.04-2.14±0.11, R2=0.7, P=3×10
-7) between the rates
of precipitation and their corresponding ∆44/40
Ca (Figure IV.2a). This means that as the saturation
state increases, and causes higher precipitation rate, the fractionation of Ca isotopes decreases.
As already mentioned above, it was pointed out that large ∆44/40
Ca variations are observed in
inorganic aragonite of the same temperature (Figure IV.1). The precipitation rate in the 25°C
experiments, for example, varies from 101.8
to 103.7
μmol·m-2
·h-1
and ∆44/40
Ca varies between -
1.54 to 0.91‰, respectively. This can be explained by the effect of aragonite saturation state on
Ca incorporation (Figure IV.2a), causing large fractionation during low saturation state and a
small fractionation during high saturation state of the bulk solution. Tang et al. (2008) found
slope variations in the ∆44/40
Ca -precipitation rate relationship in inorganic calcite. They found
that as the temperature grows the slope of ∆44/40
Ca vs. rate decreases. This observation is
supported by the theoretical prediction of the SEMO model (Watson, 2004). However, in
inorganic aragonite we did not find a temperature control on the ∆44/40
Ca- precipitation rates
slope (Figure IV.2b).
CHAPTER IV- KINETIC CONTROL ON 44Ca/40Ca INCORPORATION IN CORALS ARAGONITE |78
Figure IV.2 Precipitation rate in aragonite is positively correlated to ∆44/40Ca. (a) Inorganic aragonite precipitated in different
salinities (40.7 PSU in the current study and 3 PSU in Gossone et al. (2005) and Niedermayr (2011)) do not show any
difference in ∆44/40Ca. DePaolo (2011) model for rate dependency on Ca isotope incorporation fits the inorganic aragonite data
(solid lines) as the equilibrium fractionation is between -1.8 and -1.3‰, and as the fractionation is the smallest (-0.6 to -1.1‰)
at high precipitation rates (above 104 μmol·m-2·h-1). Corals fit the high precipitation rate zone, where the fractionation is
expected to remain constant. Rate dependency on ∆44/40Ca in inorganic aragonite is opposite to the dependency in inorganic
calcite (dashed line from De Paolo (2011)) (b) When plotting ∆44/40Ca in inorganic aragonite versus precipitation rates at
different temperatures we do not observe temperature dependent slopes. This is in contrast to the different slopes observed in
calcite at different temperatures (Tang et al., 2008).
According to previous studies the precipitation rate of corals is higher than the precipitation rate
of inorganic aragonite (Cohen and McConnaughey, 2003). Calcification rates determination in
corals has been a subject of several studies, and is subjected to a lot of uncertainty due to the
difficulty to estimate the active surface area of the coral (e.g. Hoegh-guldberg, 1988; Laforsch et
al., 2008; Veal et al., 2010). The corals calcification rates in this study (103.9
-104.0
μmol·m-2
·h-1
)
were estimated using the correlation between saturation state and calcification rate (Leclercq et
al., 2000). Whereas other studies reported corals calcification rates in Porites sp. of
approximately 104.3±0.2
μmol·m-2
·h-1
(Lough and Barnes, 1997). While the precipitation rates of
the inorganic aragonite experiments show large range of values, the corals estimated calcification
rates have very small range of variation (Figure IV.3). Latter observation may indicate the strong
control of the corals’ physiology onto the calcification process. The corals’ calcification rates are
very close to the highest precipitation rates obtained by Niedermayr et al. (2013). Respectively,
the ∆44/40
Ca of these highest precipitation rates is similar to the corals’ ∆44/40
Ca values.
According to the model proposed by DePaolo (2011) for the relationship between ∆44/40
Ca and
precipitation rate in calcite, Ca isotope fractionation is increasing as the precipitation rate
increases. At high precipitation rates, however, Ca isotope fractionation becomes constant, and
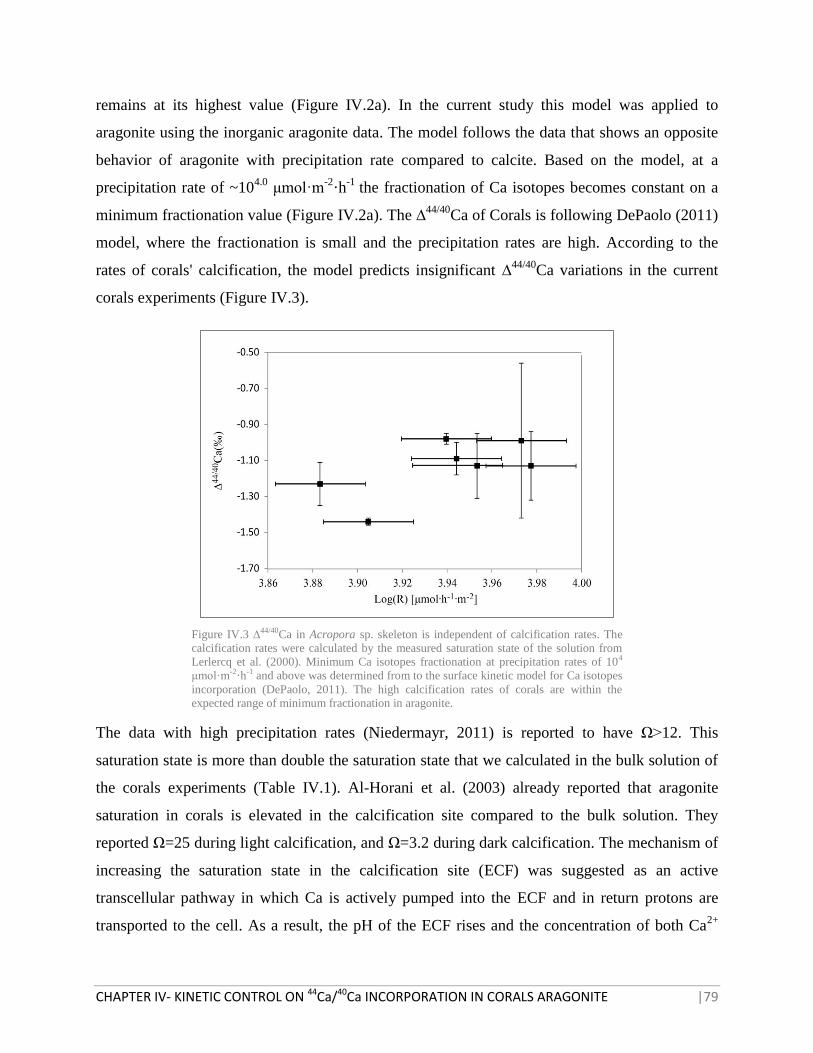
CHAPTER IV- KINETIC CONTROL ON 44Ca/40Ca INCORPORATION IN CORALS ARAGONITE |79
remains at its highest value (Figure IV.2a). In the current study this model was applied to
aragonite using the inorganic aragonite data. The model follows the data that shows an opposite
behavior of aragonite with precipitation rate compared to calcite. Based on the model, at a
precipitation rate of ~104.0
μmol·m-2
·h-1
the fractionation of Ca isotopes becomes constant on a
minimum fractionation value (Figure IV.2a). The ∆44/40
Ca of Corals is following DePaolo (2011)
model, where the fractionation is small and the precipitation rates are high. According to the
rates of corals' calcification, the model predicts insignificant ∆44/40
Ca variations in the current
corals experiments (Figure IV.3).
Figure IV.3 ∆44/40Ca in Acropora sp. skeleton is independent of calcification rates. The
calcification rates were calculated by the measured saturation state of the solution from
Lerlercq et al. (2000). Minimum Ca isotopes fractionation at precipitation rates of 104
μmol·m-2·h-1 and above was determined from to the surface kinetic model for Ca isotopes
incorporation (DePaolo, 2011). The high calcification rates of corals are within the
expected range of minimum fractionation in aragonite.
The data with high precipitation rates (Niedermayr, 2011) is reported to have Ω>12. This
saturation state is more than double the saturation state that we calculated in the bulk solution of
the corals experiments (Table IV.1). Al-Horani et al. (2003) already reported that aragonite
saturation in corals is elevated in the calcification site compared to the bulk solution. They
reported Ω=25 during light calcification, and Ω=3.2 during dark calcification. The mechanism of
increasing the saturation state in the calcification site (ECF) was suggested as an active
transcellular pathway in which Ca is actively pumped into the ECF and in return protons are
transported to the cell. As a result, the pH of the ECF rises and the concentration of both Ca2+
CHAPTER IV- KINETIC CONTROL ON 44Ca/40Ca INCORPORATION IN CORALS ARAGONITE |80
and CO32-
ions rise. An elevated saturation state in the ECF can explain the high calcification
rates in corals. Given that the physiologically raised calcification rate of corals are larger than the
usual experimental inorganic precipitation rates, the less fractionated Ca isotope values observed
in the corals' skeleton reflect the increased pH, saturation state and precipitation rate.
Conclusions
Corals and inorganic aragonite show different Ca isotope fractionation. ∆44/40
Ca in corals is
~0.4‰ less fractionated than inorganic aragonite that precipitated at same temperature. Low
ionic strength that is usually used in inorganic experiments cannot explain the Ca
fractionation difference between inorganic aragonite and corals aragonite, since our inorganic
aragonite experiments were done from natural seawater that is similar to the corals'
experiments solutions.
Precipitation rates and Ca isotopes fractionation are strongly related. High precipitation rates
correspond to a relative small fractionation, and low precipitation rates corresponds to a
relative large isotope fractionation value.
We found that at precipitation rates above ~104.0
μmol·m-2
·h-1
∆44/40
Ca in aragonite is
constant at a minimum fractionation value. This finding is in accordance with the ∆44/40
Ca of
corals in the current study; Corals, which have estimated calcification rates of ~104 μmol·m
-
2·h
-1, show in the current study relatively constant ∆
44/40Ca.
Ca incorporation in corals aragonite is kinetically controlled and reflects a direct control of
the corals physiology. Corals enhance the calcification causing higher precipitation rates
which corresponds to low Ca isotope fractionation.
Acknowledgments
We wish to thank Ana Kolevica, Regina Surberg, Andrea Wolf and Maria Hierz for
supporting the lab work of this study. Funding support was provided through the European Marie
Curie Initial Training Network "Calcification by Marine Organisms" (CalMarO) and the
European Community's Seventh Framework Programme (FP7/2007-2013).
CHAPTER IV- KINETIC CONTROL ON 44Ca/40Ca INCORPORATION IN CORALS ARAGONITE |81
References
Al-Horani, F.A., Al-Moghrabi, S.M., De Beer, D., 2003. The mechanism of calcification and its
relation to photosynthesis and respiration in the scleractinian coral Galaxea fascicularis.
Mar. Biol. 142, 419–426.
Böhm, F., Gussone, N., Eisenhauer, A., Dullo, W.C., Reynaud, S., Paytan, A., 2006. Calcium
isotope fractionation in modern scleractinian corals. Geochim. Cosmochim. Acta 70, 4452–
4462.
Chang, V.T.-C., Williams, R.J.P., Makishima, A., Belshawl, N.S., O’Nions, R.K., 2004. Mg and
Ca isotope fractionation during CaCO3 biomineralisation. Biochem. Biophys. Res.
Commun. 323, 79–85.
Clode, P.L., Marshall, A.T., 2002. Low temperature X-ray microanalysis of calcium in a
scleractinian coral: evidence of active transport mechanisms. J. Exp. Biol. 3552, 3543–
3552.
Cohen, A.L., McConnaughey, T.A., 2003. Geochemical perspectives on coral mineralization.
Rev. Mineral. Geochemistry 54, 151–187.
DePaolo, D.J., 2011. Surface kinetic model for isotopic and trace element fractionation during
precipitation of calcite from aqueous solutions. Geochim. Cosmochim. Acta 75, 1039–1056.
Dietzel, M., Gussone, N., Eisenhauer, A., 2004. Co-precipitation of Sr2+
and Ba2+
with aragonite
by membrane diffusion of CO2 between 10 and 50°C. Chem. Geol. 203, 139–151.
Dodge, R.E., Wyers, S.C., Frith, H.R., Knap, A.H., Smith, S.R., Cook, C.B., Sleeter, T.D., 1984.
Corals calcification rates by the buoyant weight technique: effect of alizarin staining. J.
Exp. Mar. Biol. Ecol. 15, 217–232.
Erez, J., Braun, A., 2007. Calcification in hermatypic corals is based on direct seawater supply to
the biomineralization site. Geochim. Cosmochim. Acta 71, SA260.
Farkaš, J., Böhm, F., Wallmann, K., Blenkinsop, J., Eisenhauer, A., Geldern, R. Van, Munnecke,
A., Voigt, S., Veizer, J., 2007. Calcium isotope record of Phanerozoic oceans: Implications
for chemical evolution of seawater and its causative mechanisms. Geochim. Cosmochim.
Acta 71, 5117–5134.
Gagnon, A.C., Adkins, J.F., Erez, J., 2012. Seawater transport during coral biomineralization.
Earth Planet. Sci. Lett. 329-330, 150–161.
Gussone, N., Böhm, F., Eisenhauer, A., Dietzel, M., Heuser, A., Teichert, B.M.A., Reitner, J.,
Dullo, W.C., 2005. Calcium isotope fractionation in calcite and aragonite. Geochim.
Cosmochim. Acta 69, 4485– 4494.
CHAPTER IV- KINETIC CONTROL ON 44Ca/40Ca INCORPORATION IN CORALS ARAGONITE |82
Gussone, N., Eisenhauer, A., Heuser, A., Dietzel, M., Bock, B., Böhm, F., Spero, H.J., Lea,
D.W., Bijma, J., Nägler, T.F., 2003. Model for kineticeffects on calciumisotopefractionation
(δ44
Ca) in inorganic aragonite and cultured planktonic foraminifera. Geochim. Cosmochim.
Acta 67, 1375–1382.
Halicz, L., Galy, A., Belshaw, N.S., O’Nions, R.K., 1999. High-precision measurement of
calcium isotopes in carbonates and related materials by multiple collector inductively
coupled plasma mass spectrometry (MC-ICP-MS. J. Anal. At. Spectrom. 14, 1835–1838.
Heuser, A., Eisenhauer, A., Gussone, N., Bock, B., Hansen, B.T., Nägler, T.F., 2002.
Measurement of calcium isotopes (δ44
Ca) using a multicollector TIMS technique. Int. J.
Mass Spectrom. 220, 385–397.
Hoegh-guldberg, O., 1988. A method for determining the surface area of corals. Coral Reefs
113–116.
Kısakürek, B., Eisenhauer, A., Böhm, F., Hathorne, E.C., Erez, J., 2011. Controls on calcium
isotope fractionation in cultured planktic foraminifera, Globigerinoides ruber and
Globigerinella siphonifera. Geochim. Cosmochim. Acta 75, 427–443.
Krishnaveni, P., Chou, L., Ip, Y.K., 1989. Deposition of calcium (45
Ca2+
) in the coral, Galaxea
fascicularis. Comp. Biochem. Physiol. Part A Physiol. 94, 509–513.
Laforsch, C., Christoph, E., Glaser, C., Naumann, M., Wild, C., Niggl, W., 2008. A precise and
non-destructive method to calculate the surface area in living scleractinian corals using X-
ray computed tomography and 3D modeling. Coral Reefs 27, 811–820.
Leclercq, N., Gattuso, J.-P., Jaubert, J., 2000. CO2 partial pressure controls the calcification rate
of a coral community. Glob. Chang. Biol. 6, 329–334.
Lemarchand, D., Wasserburg, G.J., Papanastassiou, D.A., 2004. Rate-controlled calcium isotope
fractionation in synthetic calcite. Geochim. Cosmochim. Acta 68, 4665–4678.
Lewis, E., Wallace, D.W.R., 1998. Program Developed for CO2 System Calculations.
Lough, J.M., Barnes, D.J., 1997. Several centuries of variation in skeletal extension , density and
calcification in massive Porites colonies from the Great Barrier Reef : A proxy for seawater
temperature and a background of variability against which to identify unnatural change. J.
Exp. Mar. Bio. Ecol. 211, 29–67.
Niedermayr, A., 2011. Effects of magnesium , polyaspartic acid , carbonate accumulation rate
and temperature on the crystallization , morphology , elemental incorporation and isotopic
fractionation of calcium carbonate phases.
CHAPTER IV- KINETIC CONTROL ON 44Ca/40Ca INCORPORATION IN CORALS ARAGONITE |83
Niedermayr, A., Köhler, S.J., Dietzel, M., 2013. Impacts of aqueous carbonate accumulation
rate, magnesium and polyaspartic acid on calcium carbonate formation (6–40°C). Chem.
Geol. 340, 105–120.
Pretet, C., Samankassou, E., Felis, T., Reynaud, S., Böhm, F., Eisenhauer, A., Ferrier-Pagès, C.,
Gattuso, J.-P., Camoin, G., 2013. Constraining calcium isotope fractionation (δ44/40
Ca) in
modern and fossil scleractinian coral skeleton. Chem. Geol. 340, 49–58.
Tambutté, É., Allemand, D., Müller, E., Juabert, J., 1996. A compartmental approach to the
mechanism of calcification in hermatypic corals. J. Exp. Biol. 1041, 1029–1041.
Tambutté, É., Tambutté, S., Segonds, N., Zoccola, D., Venn, A., Erez, J., Allemand, D., 2012.
Calcein labelling and electrophysiology: insights on coral tissue permeability and
calcification. Proc. R. Soc. B Biol. Sci. 279, 19–27.
Tang, J., Dietzel, M., Böhm, F., Köhler, S.J., Eisenhauer, A., 2008. Sr2+
/Ca2+
and 44
Ca/40
Ca
fractionation during inorganic calcite formation: II. Ca isotopes. Geochim. Cosmochim.
Acta 72, 3733–3745.
Tang, J., Niedermayr, A., Köhler, S.J., Böhm, F., Kısakürek, B., Eisenhauer, A., Dietzel, M.,
2012. Sr2+
/Ca2+
and 44
Ca/40
Ca fractionation during inorganic calcite formation : III . Impact
of salinity/ionic strength. Geochim. Cosmochim. Acta 77, 432–443.
Veal, C.J., Carmi, M., Fine, M., Hoegh-guldberg, O., 2010. Increasing the accuracy of surface
area estimation using single wax dipping of coral fragments. Coral Reefs 29, 893–897.
Watson, E.B., 2004. A conceptual model for near-surface kinetic controls on the trace-element
and stable isotope composition of abiogenic calcite crystals1. Geochim. Cosmochim. Acta
68, 1473–1488.
Zeebe, R.E., Wolf-Gladrow, D.A., 2001. CO2 in seawater: equilibrium, kinetics, isotopes.
Elsevier Oceanography Series, Elsevier.
Zuddas, P., Mucci, A., 1998. Kinetics of calcite precipitation from seawater : II . The influence
of the ionic strength. Geochim. Cosmochim. Acta 62, 757–766.
SUMMARY |84
SUMMARY
This study focused on the incorporation of Sr/Ca and their isotopes in corals’ skeletons. Both
88Sr/
86Sr and
44Ca/
40Ca in aragonite have significant large fractionation from the bulk solution.
However, while similar ∆88/86
Sr values are observed in all samples, corals and inorganic
aragonite, ∆44/40
Ca values display significant variations between inorganic and corals aragonite.
A kinetic model that was suggested to explain Ca incorporation in inorganic calcite (DePaolo,
2011) can explain also the behavior of Ca isotopes fractionation in inorganic aragonite.
According to the aragonite model, as the rate of precipitation increases Ca isotopes are less
fractionated. Ca isotope data of corals from the current study corresponds to the inorganic
aragonite model curve. At the high calcification rate of corals (~103.9
μmol·m-2
·h-1
in this work)
the 'S curve' shaped model (sigmoid curve) is at the minimum fractionation value. Provided that
this model predicts the behavior of Ca in corals as well as inorganic aragonite, no change in
∆44/40
Ca in corals at different calcification rates of ~104 μmol·m
-2·h
-1 and above is expected.
As opposed to Ca, Sr does not show any significant variation in aragonite. Inorganic aragonite
and corals aragonite are 0.2‰ more depleted in the light 86
Sr isotope than their bulk solution.
The observed variations in ∆88/86
Sr between different samples are not controlled by saturation
state or by temperature. The similarity in 88
Sr/86
Sr fractionation between inorganic and corals’
aragonite challenges the Rayleigh Based Multi Element model (Gaetani and Cohen, 2006;
Gaetani et al., 2011) that predicts significant differences between inorganic and corals’ aragonite.
The Rayleigh based model that was previously suggested to explain the trace elements
incorporation in corals cannot explain the 88
Sr/86
Sr isotope incorporation in terms of Rayleigh
distillation effect.
The experiments that were conducted on Acropora sp. corals revealed an irregular pattern of
calcification. Since the Sr concentration in the pre-experimental solution differed significantly
from the concentration in experimental solutions, mixing between pre-experimental and
experimental skeleton were detectable through Sr concentration measurements. Using these two
different Sr concentrations, it was possible to sample experimental skeleton for isotopes
geochemical analyses and correct for possible mixing with pre-experimental skeleton. In
addition, it was possible to use the skeleton for Sr element mapping and distinguish between pre-
experimental and experimental skeleton regions. The mapping results showed a patchy pattern of
SUMMARY |85
calcification, where the experimental skeleton appeared not only as axial and radial growth but
also in patches within the pre-experimental skeleton. This observation confirms a previous
assumption of secondary infilling in Acropora sp. skeleton that was based on the increasing
density of the skeleton with the increasing distance from the skeleton tip (Gladfelter, 1982;
Roche et al., 2011). Due to the irregular calcification pattern shown in this study, Acropora sp.
skeleton may not be a suitable coral for paleo-proxy reconstruction. Nevertheless, this
calcification pattern is an important observation for the study of calcification mechanisms.
References
DePaolo D. J. (2011) Surface kinetic model for isotopic and trace element fractionation during
precipitation of calcite from aqueous solutions. Geochim. Cosmochim. Acta 75, 1039–1056.
Gaetani G. A. and Cohen A. L. (2006) Element partitioning during precipitation of aragonite
from seawater: A framework for understanding paleoproxies. Geochim. Cosmochim. Acta
70, 4617–4634.
Gaetani G. A., Cohen A. L., Wang Z. and Crusius J. (2011) Rayleigh-based, multi-element coral
thermometry: A biomineralization approach to developing climate proxies. Geochim.
Cosmochim. Acta 75, 1920–1932.
Gladfelter E. H. (1982) Skeletal development in Acropora cervicornis: I. Patterns of calcium
carbonate accretion in the axial corallite. Coral Reefs 1, 45–51.
Roche R. C., Abel R. L., Johnson K. G. and Perry C. T. (2011) Spatial variation in porosity and
skeletal element characteristics in apical tips of the branching coral Acropora pulchra
(Brook 1891). Coral Reefs 30, 195–201.
ACKNOWLEDGMENTS |86
ACKNOWLEDGMENTS
This thesis is the result of few years of research and hard work that could not have been
accomplished without the help of many people.
I would like to express my special appreciation and thanks to my advisor, Prof. Dr. Anton
Eisenhauer, for his guidance, support, trust and for the fruitful discussions we had. I would also
like to thank Dr. Florian Böhm and Dr. Jan Fietzke for mentoring me and helping me whenever I
needed and for the good discussions and ideas that came up during our many conversations. I
owe a special thanks to Prof. Dr. Jonathan Erez who taught me with enthusiasm the fascinating
nature of corals and for helping me with my corals experiments in his laboratory. My sincere
thanks also go to Prof. Dr. Martin Diezel who guided me and hosted me in his laboratory during
the inorganic experiments and to Dr. Andrea Niedermayr for her helpful suggestions and
assistance. Sincere thanks to Prof. Dr. Thor Hansteen who had always an open door for me, and
helped me with the SynXRF analyses and data processing, I thank also Dr. Karen Appel from the
Deutsches Electronen Synchrotron for allowing me to work and operate DORIS. I am grateful to
Prof. Dr. Boaz Lazar, Prof. Dr. Moti Stein and Dr. Paolo Montagna for their support and advices.
I would also like to thank the people who helped me with the laboratory work: Ana Kolovica,
Andrea Wolf, Dr. Folkmar Hauf, Franziska Wilsky, Maria Hierz, Mario Thöner and Regina
Surberg.
I am obliged to my colleagues and friends in GEOMAR and HUJI: Dr. Andre Krabbenhöft, Dr.
Basak Kisakurek, Dr. Christian Hörn, Dr. Ed Hathhorn, Eyal Wurgaft, Dr. Federica Ragazzola,
Dr. Hauke Vollstaedt, Dr. Isabelle Taubner, Dr. Jacek Raddaz, Dr. Marlene Wall, Dr. Nicolaas
Glock, Stephanie Schurigt, Rashid Rashid, Dr. Volker Liebetrau, Yael Levinson and Yona
Geller. I also greatly appreciate the help of the secretaries in GEOMAR and in HUJI: Anne
Völsch, Batya Moshe, Christine Utecht, Isabel Patzwald and Magi Perkin.
Lastly I want to thank to my family and especially to Adi for his endless love and patience.
This work was funded through the European Marie Curie ITN386 "Calcification by Marine Organisms"
project (CalMarO SP7/2008-2012) and through Sonderforschungsbereich 754 (SFB754/ B7).
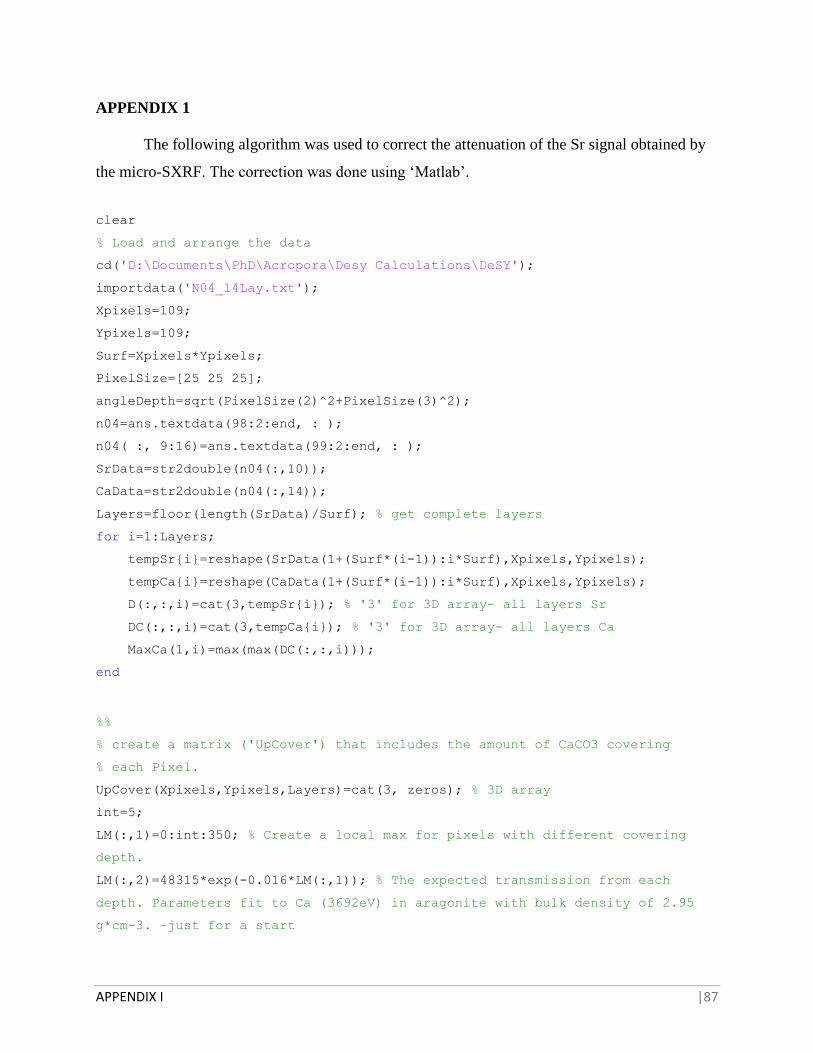
APPENDIX I |87
APPENDIX 1
The following algorithm was used to correct the attenuation of the Sr signal obtained by
the micro-SXRF. The correction was done using ‘Matlab’.
clear
% Load and arrange the data
cd('D:\Documents\PhD\Acropora\Desy Calculations\DeSY');
importdata('N04_14Lay.txt');
Xpixels=109;
Ypixels=109;
Surf=Xpixels*Ypixels;
PixelSize=[25 25 25];
angleDepth=sqrt(PixelSize(2)^2+PixelSize(3)^2);
n04=ans.textdata(98:2:end, : );
n04( :, 9:16)=ans.textdata(99:2:end, : );
SrData=str2double(n04(:,10));
CaData=str2double(n04(:,14));
Layers=floor(length(SrData)/Surf); % get complete layers
for i=1:Layers;
tempSr{i}=reshape(SrData(1+(Surf*(i-1)):i*Surf),Xpixels,Ypixels);
tempCa{i}=reshape(CaData(1+(Surf*(i-1)):i*Surf),Xpixels,Ypixels);
D(:,:,i)=cat(3,tempSr{i}); % '3' for 3D array- all layers Sr
DC(:,:,i)=cat(3,tempCa{i}); % '3' for 3D array- all layers Ca
MaxCa(1,i)=max(max(DC(:,:,i)));
end
%%
% create a matrix ('UpCover') that includes the amount of CaCO3 covering
% each Pixel.
UpCover(Xpixels,Ypixels,Layers)=cat(3, zeros); % 3D array
int=5;
LM(:,1)=0:int:350; % Create a local max for pixels with different covering
depth.
LM(:,2)=48315*exp(-0.016*LM(:,1)); % The expected transmission from each
depth. Parameters fit to Ca (3692eV) in aragonite with bulk density of 2.95
g*cm-3. –just for a start
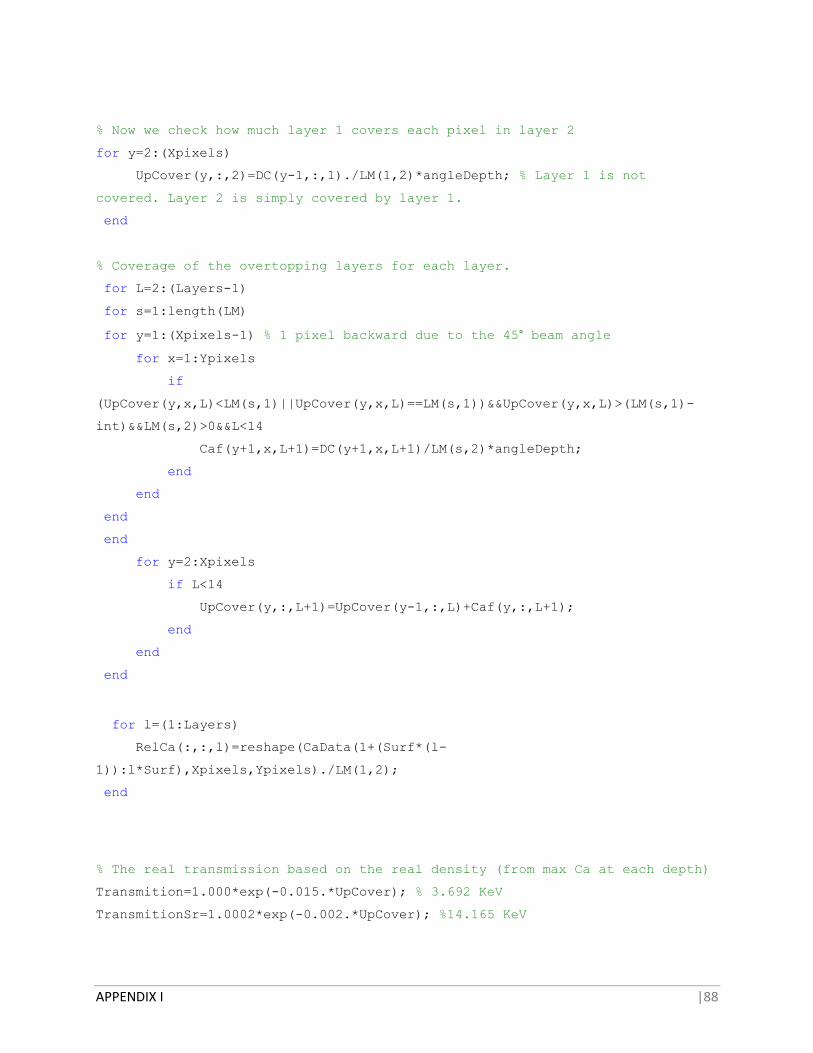
APPENDIX I |88
% Now we check how much layer 1 covers each pixel in layer 2
for y=2:(Xpixels)
UpCover(y,:,2)=DC(y-1,:,1)./LM(1,2)*angleDepth; % Layer 1 is not
covered. Layer 2 is simply covered by layer 1.
end
% Coverage of the overtopping layers for each layer.
for L=2:(Layers-1)
for s=1:length(LM)
for y=1:(Xpixels-1) % 1 pixel backward due to the 45° beam angle
for x=1:Ypixels
if
(UpCover(y,x,L)<LM(s,1)||UpCover(y,x,L)==LM(s,1))&&UpCover(y,x,L)>(LM(s,1)-
int)&&LM(s,2)>0&&L<14
Caf(y+1,x,L+1)=DC(y+1,x,L+1)/LM(s,2)*angleDepth;
end
end
end
end
for y=2:Xpixels
if L<14
UpCover(y,:,L+1)=UpCover(y-1,:,L)+Caf(y,:,L+1);
end
end
end
for l=(1:Layers)
RelCa(:,:,l)=reshape(CaData(1+(Surf*(l-
1)):l*Surf),Xpixels,Ypixels)./LM(1,2);
end
% The real transmission based on the real density (from max Ca at each depth)
Transmition=1.000*exp(-0.015.*UpCover); % 3.692 KeV
TransmitionSr=1.0002*exp(-0.002.*UpCover); %14.165 KeV
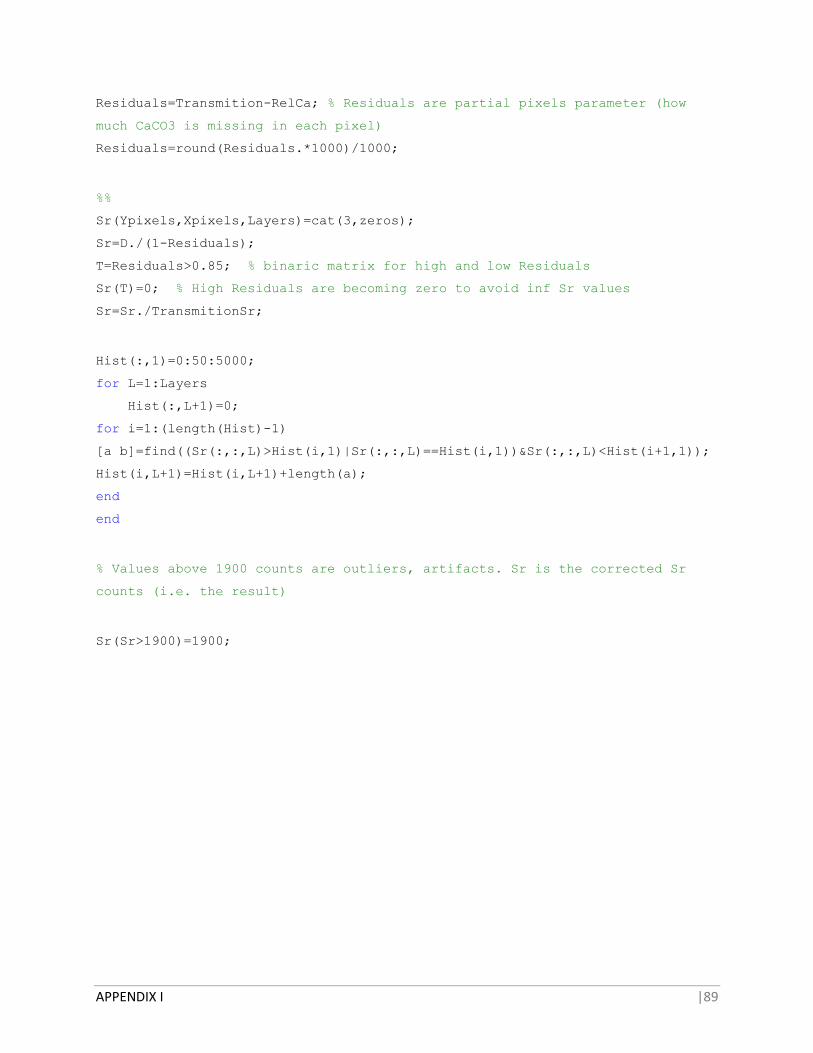
APPENDIX I |89
Residuals=Transmition-RelCa; % Residuals are partial pixels parameter (how
much CaCO3 is missing in each pixel)
Residuals=round(Residuals.*1000)/1000;
%%
Sr(Ypixels,Xpixels,Layers)=cat(3,zeros);
Sr=D./(1-Residuals);
T=Residuals>0.85; % binaric matrix for high and low Residuals
Sr(T)=0; % High Residuals are becoming zero to avoid inf Sr values
Sr=Sr./TransmitionSr;
Hist(:,1)=0:50:5000;
for L=1:Layers
Hist(:,L+1)=0;
for i=1:(length(Hist)-1)
[a b]=find((Sr(:,:,L)>Hist(i,1)|Sr(:,:,L)==Hist(i,1))&Sr(:,:,L)<Hist(i+1,1));
Hist(i,L+1)=Hist(i,L+1)+length(a);
end
end
% Values above 1900 counts are outliers, artifacts. Sr is the corrected Sr
counts (i.e. the result)
Sr(Sr>1900)=1900;
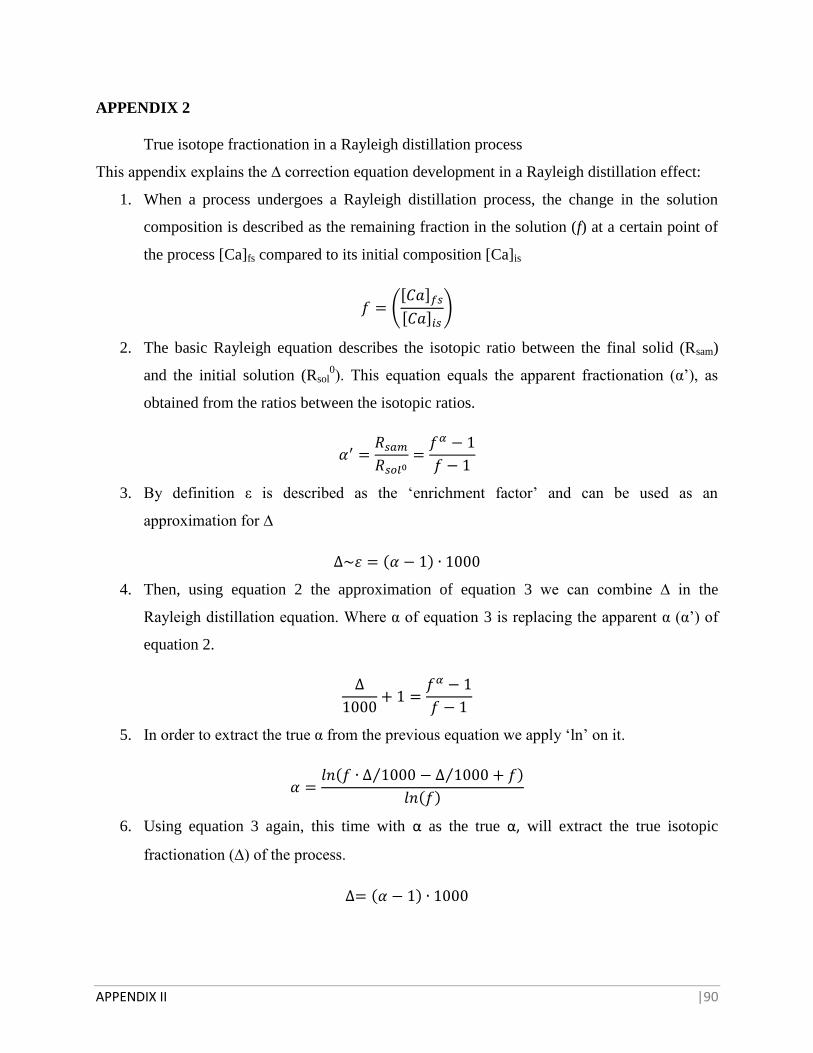
APPENDIX II |90
APPENDIX 2
True isotope fractionation in a Rayleigh distillation process
This appendix explains the ∆ correction equation development in a Rayleigh distillation effect:
1. When a process undergoes a Rayleigh distillation process, the change in the solution
composition is described as the remaining fraction in the solution (f) at a certain point of
the process [Ca]fs compared to its initial composition [Ca]is
([ ] [ ]
)
2. The basic Rayleigh equation describes the isotopic ratio between the final solid (Rsam)
and the initial solution (Rsol0). This equation equals the apparent fractionation (α’), as
obtained from the ratios between the isotopic ratios.
3. By definition ε is described as the ‘enrichment factor’ and can be used as an
approximation for ∆
4. Then, using equation 2 the approximation of equation 3 we can combine ∆ in the
Rayleigh distillation equation. Where α of equation 3 is replacing the apparent α (α’) of
equation 2.
5. In order to extract the true α from the previous equation we apply ‘ln’ on it.
⁄ ⁄
6. Using equation 3 again, this time with α as the true α, will extract the true isotopic
fractionation (∆) of the process.