spores of Bacillus anthracis (Sterne) from...
15
4277 J. Dairy Sci. 94:4277–4291 doi:10.3168/jds.2010-3879 © American Dairy Science Association ® , 2011. ABSTRACT High-temperature, short-time pasteurization of milk is ineffective against spore-forming bacteria such as Bacillus anthracis (BA), but is lethal to its vegetative cells. Crossflow microfiltration (MF) using ceramic membranes with a pore size of 1.4 μm has been shown to reject most microorganisms from skim milk; and, in combination with pasteurization, has been shown to extend its shelf life. The objectives of this study were to evaluate MF for its efficiency in removing spores of the attenuated Sterne strain of BA from milk; to evaluate the combined efficiency of MF using a 0.8-μm ceramic membrane, followed by pasteurization (72°C, 18.6 s); and to monitor any residual BA in the perme- ates when stored at temperatures of 4, 10, and 25°C for up to 28 d. In each trial, 95 L of raw skim milk was inoculated with about 6.5 log 10 BA spores/mL of milk. It was then microfiltered in total recycle mode at 50°C using ceramic membranes with pore sizes of either 0.8 μm or 1.4 μm, at crossflow velocity of 6.2 m/s and transmembrane pressure of 127.6 kPa, conditions selected to exploit the selectivity of the membrane. Microfiltration using the 0.8-μm membrane removed 5.91 ± 0.05 log 10 BA spores/mL of milk and the 1.4- μm membrane removed 4.50 ± 0.35 log 10 BA spores/ mL of milk. The 0.8-μm membrane showed efficient removal of the native microflora and both membranes showed near complete transmission of the casein pro- teins. Spore germination was evident in the permeates obtained at 10, 30, and 120 min of MF time (0.8-μm membrane) but when stored at 4 or 10°C, spore levels were decreased to below detection levels (≤0.3 log 10 spores/mL) by d 7 or 3 of storage, respectively. Per- meates stored at 25°C showed coagulation and were not evaluated further. Pasteurization of the permeate samples immediately after MF resulted in additional spore germination that was related to the length of MF time. Pasteurized permeates obtained at 10 min of MF and stored at 4 or 10°C showed no growth of BA by d 7 and 3, respectively. Pasteurization of permeates obtained at 30 and 120 min of MF resulted in spore germination of up to 2.42 log 10 BA spores/mL. Spore levels decreased over the length of the storage period at 4 or 10°C for the samples obtained at 30 min of MF but not for the samples obtained at 120 min of MF. This study confirms that MF using a 0.8-μm membrane before high-temperature, short-time pasteurization may improve the safety and quality of the fluid milk supply; however, the duration of MF should be limited to prevent spore germination following pasteurization. Key words: microfiltration, ceramic membrane, spore removal, Bacillus anthracis INTRODUCTION The effects of food processing operations on the fate of pathogens or threat agents in foods are of concern to industry, regulatory authorities, and consumers alike. Milk is of particular concern because of the possibility of intentional addition of threat agents to milk at the farm bulk tank, during transport, or at the processing plant. One threat agent of concern is anthrax, Bacil- lus anthracis (BA). Bacillus anthracis is a ubiquitous gram-positive, rod-shaped, spore-forming soil bacte- rium and the causative agent of anthrax via the follow- ing 3 routes: inhalation, cutaneous absorption, and oral ingestion (Dixon et al., 1999; Swartz, 2001; Erickson and Kornacki, 2003). Controlling a spore-forming bac- terium such as BA in foods requires either elimination Pilot-scale crossflow-microfiltration and pasteurization to remove spores of Bacillus anthracis (Sterne) from milk 1 P. M. Tomasula,* 2 S. Mukhopadhyay,† N. Datta,‡ A. Porto-Fett,§ J. E. Call,§ J. B. Luchansky ,§ J. Renye,* and M. Tunick* *Dairy and Functional Foods Research Unit and †Residue Chemistry and Predictive Microbiology Research Unit, USDA, ARS, Eastern Regional Research Center, 600 E. Mermaid Lane, Wyndmoor, PA 19038 ‡School of Biomedical and Health Sciences, Victoria University, Werribee Campus, PO Box 14428, Melbourne, Victoria 8001, Australia §Food Safety and Intervention Technologies Research Unit, USDA, ARS, Eastern Regional Research Center, 600 E. Mermaid Lane, Wyndmoor, PA 19038 Received September 30, 2010. Accepted April 18, 2011. 1 Mention of trade names or commercial products in this publication is solely for the purpose of providing specific information and does not imply recommendation or endorsement by the US Department of Agriculture. The USDA is an equal opportunity provider and employer. 2 Corresponding author: [email protected]
Transcript of spores of Bacillus anthracis (Sterne) from...

4277
J. Dairy Sci. 94 :4277–4291doi: 10.3168/jds.2010-3879 © American Dairy Science Association®, 2011 .
ABSTRACT
High-temperature, short-time pasteurization of milk is ineffective against spore-forming bacteria such as Bacillus anthracis (BA), but is lethal to its vegetative cells. Crossflow microfiltration (MF) using ceramic membranes with a pore size of 1.4 μm has been shown to reject most microorganisms from skim milk; and, in combination with pasteurization, has been shown to extend its shelf life. The objectives of this study were to evaluate MF for its efficiency in removing spores of the attenuated Sterne strain of BA from milk; to evaluate the combined efficiency of MF using a 0.8-μm ceramic membrane, followed by pasteurization (72°C, 18.6 s); and to monitor any residual BA in the perme-ates when stored at temperatures of 4, 10, and 25°C for up to 28 d. In each trial, 95 L of raw skim milk was inoculated with about 6.5 log10 BA spores/mL of milk. It was then microfiltered in total recycle mode at 50°C using ceramic membranes with pore sizes of either 0.8 μm or 1.4 μm, at crossflow velocity of 6.2 m/s and transmembrane pressure of 127.6 kPa, conditions selected to exploit the selectivity of the membrane. Microfiltration using the 0.8-μm membrane removed 5.91 ± 0.05 log10 BA spores/mL of milk and the 1.4-μm membrane removed 4.50 ± 0.35 log10 BA spores/mL of milk. The 0.8-μm membrane showed efficient removal of the native microflora and both membranes showed near complete transmission of the casein pro-teins. Spore germination was evident in the permeates obtained at 10, 30, and 120 min of MF time (0.8-μm
membrane) but when stored at 4 or 10°C, spore levels were decreased to below detection levels (≤0.3 log10spores/mL) by d 7 or 3 of storage, respectively. Per-meates stored at 25°C showed coagulation and were not evaluated further. Pasteurization of the permeate samples immediately after MF resulted in additional spore germination that was related to the length of MF time. Pasteurized permeates obtained at 10 min of MF and stored at 4 or 10°C showed no growth of BA by d 7 and 3, respectively. Pasteurization of permeates obtained at 30 and 120 min of MF resulted in spore germination of up to 2.42 log10 BA spores/mL. Spore levels decreased over the length of the storage period at 4 or 10°C for the samples obtained at 30 min of MF but not for the samples obtained at 120 min of MF. This study confirms that MF using a 0.8-μm membrane before high-temperature, short-time pasteurization may improve the safety and quality of the fluid milk supply; however, the duration of MF should be limited to prevent spore germination following pasteurization. Key words: microfiltration , ceramic membrane , spore removal , Bacillus anthracis
INTRODUCTION
The effects of food processing operations on the fate of pathogens or threat agents in foods are of concern to industry, regulatory authorities, and consumers alike. Milk is of particular concern because of the possibility of intentional addition of threat agents to milk at the farm bulk tank, during transport, or at the processing plant. One threat agent of concern is anthrax, Bacil-lus anthracis (BA). Bacillus anthracis is a ubiquitous gram-positive, rod-shaped, spore-forming soil bacte-rium and the causative agent of anthrax via the follow-ing 3 routes: inhalation, cutaneous absorption, and oral ingestion (Dixon et al., 1999; Swartz, 2001; Erickson and Kornacki, 2003). Controlling a spore-forming bac-terium such as BA in foods requires either elimination
Pilot-scale crossflow-microfiltration and pasteurization to remove spores of Bacillus anthracis (Sterne) from milk1 P. M. Tomasula ,*2 S. Mukhopadhyay ,† N. Datta ,‡ A. Porto-Fett ,§ J. E. Call ,§ J. B. Luchansky ,§ J. Renye ,* and M. Tunick * * Dairy and Functional Foods Research Unit and † Residue Chemistry and Predictive Microbiology Research Unit, USDA, ARS, Eastern Regional Research Center, 600 E. Mermaid Lane, Wyndmoor, PA 19038 ‡ School of Biomedical and Health Sciences, Victoria University, Werribee Campus, PO Box 14428, Melbourne, Victoria 8001, Australia § Food Safety and Intervention Technologies Research Unit, USDA, ARS, Eastern Regional Research Center, 600 E. Mermaid Lane, Wyndmoor, PA 19038
Received September 30, 2010. Accepted April 18, 2011. 1 Mention of trade names or commercial products in this publication
is solely for the purpose of providing specific information and does not imply recommendation or endorsement by the US Department of Agriculture. The USDA is an equal opportunity provider and employer.
2 Corresponding author: [email protected]
4278 TOMASULA ET AL.
Journal of Dairy Science Vol. 94 No. 9, 2011
of the spore or promotion of spore germination followed by destruction of the resulting vegetative cells (Man-sour et al., 1999).
The fluid milk processing industry uses HTST pas-teurization of milk at 72°C for 15 s, which is ineffec-tive against bacterial spores of BA but is lethal to its vegetative cells (Perdue et al., 2003; Novak et al., 2005; Xu et al., 2006). Novak et al. (2005) reported log reduc-tions in viable spores of BA inoculated into milk (8 log10) of 7.74 log10 after 2 min at 130°C and 7.43 log10 after 0.5 min at 150°C, conditions exceeding that used in ultrapasteurization (UP) of milk conducted at tem-peratures ≥137.8°C for ≥2 s (FDA, 2009). Spores of BA survive pasteurization but are considered metabolically dormant in refrigerated milk. However, germination at ambient temperatures to 37°C occurs because of the heat shock of pasteurization (Novak et al., 2005). Bacil-lus anthracis vegetative cells die at 5 to 22°C, decreas-ing after 24 h (Bowen and Turnbull, 1992).
Crossflow microfiltration (MF; Zeman and Zydney, 1996; Cheryan, 1998) has been shown to be effective in removing bacteria, spores, somatic cells, and other microflora from skim milk before pasteurization (Merin and Daufin, 1990; Van Der Horst and Hanemaaijer, 1990; Pedersen, 1991) and to extend the shelf life of milk when followed by HTST pasteurization (Elwell and Barbano, 2006). In skim milk MF, the permeate flux (J) controls mass transfer of the milk components to the membrane by convection and the crossflow veloc-ity (CFV) controls mass transfer away from the mem-brane wall back to the bulk of the milk by erosion and hydrodynamic diffusion (Field et al., 1995; Le Berre and Daufin, 1996). Microfiltration is a pressure-driven process performed using a constant transmembrane pressure (TMP) or under conditions of constant J and predominantly relies on size exclusion phenomena for removal of milk microflora.
Microfiltration performance is subject to concentra-tion polarization and fouling effects at the membrane that act as a secondary membrane, decreasing the per-meation of the milk components through the membrane (Merin and Daufin, 1990; James et al., 2003) but at the same time helping to restrict spores, bacteria, and other microflora from entering the permeate. Concentration polarization, a concentrated layer of milk proteins that forms along the surface of the membrane, is the pre-dominate resistance in milk MF, causing J to decrease soon after initiation of operation (Cheryan, 1998). It is also referred to as the gel or cake layer. The layer is dynamic and reversible through proper selection of operating conditions such as the TMP and CFV (Field et al., 1995; Le Berre and Daufin, 1996; Gésan-Guiziou et al., 1999), whereas fouling is irreversible. Fouling ef-fects at the membrane are attributed to adsorption of
proteins and factors such as pore blocking (Velasco et al., 2003; Brans et al., 2004).
For MF of milk using a 1.4-μm membrane, CFV of 6 m/s, and TMP <30 kPa (Cheryan, 1998) have been shown to minimize compaction of the polarized layer that prevents rejection of the milk proteins; however, increasing flow rates are accompanied by higher pres-sure drops along the membrane, which promote fouling. The Bactocatch, or uniform transmembrane pressure (UTP) process (Sandblom, 1978; Malmberg and Holm, 1988; van der Horst and Hanemaaijer, 1990), was intro-duced to circumvent the problems associated with high CFV by recirculating the permeate but is accompanied by high operating costs because it requires the use of an additional permeate recycle pump. Graded permeabil-ity (GP) ceramic membranes have been developed to mimic UTP operation without the need for a permeate recycle pump. These membranes include a longitudinal permeability gradient to correct for the TMP drop of conventional membranes to ensure a stable MF opera-tion, with uniform J and TMP along the length of the membrane. Because the ceramic membranes are also hydrophilic, lower protein adhesion to the membrane is expected compared with that of the polymeric hydro-phobic membranes (Baruah et al., 2006).
Microfiltration operation to obtain the optimal J and spore removal depends on the proper selection of oper-ating conditions that control concentration polarization and fouling. As hypothesized by Field et al. (1995), a critical J (Jcrit) exists below which a decrease in J does not occur and above which fouling is observed. Two forms of Jcrit have been proposed: a strong form and a weak form. For the strong form, plots of J as a function of TMP are linear and equal to the clean water J. In the weak form, the relationship between J and TMP is linear but is less than that of the clean water J due to various membrane interactions.
Brans et al. (2004) distinguished 3 regimes for the dependence of J on TMP. In the first, regime I, TMP is below a critical value (TMPcrit) and the filtration is cake-free. The selectivity of the membrane is optimal. In regime II, TMP > TMPcrit and J > Jcrit and is inde-pendent of TMP and membrane pore size. This regime is recommended to remove bacteria and spores from milk and for CN micelle concentration with high CFV in the UTP process. However, selectivity is not optimal. In regime III, TMP > TMPcrit and J decreases below Jcrit as a function of time, resulting in cake compaction.
Most reports of milk MF using either the UTP or non-UTP methods were accomplished at 50°C using 1.4-μm membranes and focused on removal of vegeta-tive bacteria and somatic cells. This average pore size is much greater than the size of the milk protein com-ponents, CN (0.02 to 0.3 μm), and whey (0.006 to 0.1
Journal of Dairy Science Vol. 94 No. 9, 2011
MICROFILTRATION OF MILK TO REMOVE SPORES 4279
μm), but is larger than the mean size of many of the bacterial spores that may be found in milk and that range from under 0.2 to 6 μm (Saboya and Maubois, 2000). Average log reductions of bacteria in milk by MF using a 1.4-μm membrane ranged from 2.6 to 5 for bacteria with complete removal of somatic cells (Trouvé et al., 1991; Pafylias et al., 1996; Elwell and Barbano, 2006). Few experiments have been performed to specifically examine the retention of bacterial spores. Guerra et al. (1997) reported average log reductions of 4 and 5 for spores of Clostridium tyrobutyricum and Bacillus cereus, respectively, inoculated into milk using a reversed polymeric asymmetric membrane with pore size of 0.87 μm.
Microfiltration has the potential to serve as a step in fluid milk processing to remove bacterial spores such as BA that may have been intentionally added to milk be-fore it is pasteurized. In this application, the operating characteristics of the membrane to ensure long-term J are important but the selectivity of the membrane for the spores is critical. In addition, little attention has been focused on the size distribution of microbial spores, which is a consideration in choosing membranes with the appropriate pore-size distribution for spore retention.
The objectives of this study were to determine the efficiency of a 0.8-μm GP ceramic membrane for decreasing or removing spores of BA (Sterne) added to skim milk in comparison to a 1.4-μm GP ceramic membrane; to determine the effects of pasteurization at 72°C with a holding time of 18.6 s on the survival of BA in permeates and retentates sampled at 3 separate MF processing times using the 0.8-μm membrane; and to determine the persistence of BA in the pasteurized permeates and retentates during storage at 4, 10, and 25°C, respectively, for up to 28 d.
MATERIALS AND METHODS
Microfiltration Operations
Experiments were conducted using a Pall Corpo-ration Membralox Ceramic pilot skid system (Pall Trincor, Exton, PA) designed for batch or continuous pilot plant use (Figure 1). The system has a 113.6-L cleaning-in-place (CIP) feed tank and is designed to meet 3A USDA standards, with sanitary 316L stain-less steel feed and retentate piping and retentate pump (Tri-Clover C-216, 7.5 HP; Tri-Clover Inc., Kenosha, WI) with a Stirling Model DBY752FHA variable speed drive (Irvine, CA). The pump provides a maximum flow rate of about 245 L/min. The system is also equipped with an automated backpulse system that may be set to clear the membrane of fouling deposits. The back-
pulse system was used in these experiments only during the membrane cleaning cycle.
Membranes of 2 different sizes were used in the ex-periments: a 0.8-μm GP multi-channel ceramic mem-brane (Membralox P37–30GL, GP5020, part number S700–01247; Pall Trincor) with 37 channels, channel diameter of 3 mm, filtration area of 0.35 m2, and length of 1.020 m, and a 1.4-μm GP multi-channel ceramic membrane (Membralox P19–40 GL, GP5020, part number S700–01245; Pall Trincor) with 19 channels, channel diameter of 4 mm, filtration area of 0.24 m2, and length of 1.020 m.
Circulating hot water maintained to within ± 1°C was fed to the heat exchanger to control temperature at 50°C used in all MF experiments (Figure 1). Crossflow velocity was obtained by adjusting the flow rate of the recirculation pump. The unit (Figure 1) was equipped with gauges to monitor pressures at the feed inlet (P1), retentate outlet (P2), and the permeate (P3). The tem-perature of the feed was monitored at the pump. Trans-membrane pressure was calculated from the following equation, where TMP = [(P1 + P2)/2] – P3. Samples of the permeate and retentate streams were removed through valves 2 and 3, respectively.
Prior to experiments with milk, the clean water flux (CWF) of the membrane was determined to ensure that it was approximately the same from run to run, by performing a MF trial using deionized (DI) water at 20°C and CFV of 6.2 m/s. The DI water was prefiltered with a 0.2-μm filter and recycled through the mem-brane with the permeate valve closed for 5 min and then opened to rinse the shell side of the membrane. The permeate flow rate was measured using a flow-
Figure 1. Schematic diagram of the pilot-scale microfiltration sys-tem. P1, P2, and P3 are pressure gauges; (1), (2), and (3) are valves; T is a temperature thermocouple; F is a flowmeter.
4280 TOMASULA ET AL.
Journal of Dairy Science Vol. 94 No. 9, 2011
meter, Foxboro 4700S-010PPA magnetic flowtube, and 47-AAA1A magnetic flow transmitter (Invensys Inc., Plano, TX).
The CWF was then calculated from the following equation: CWF = Qf × μ/(TMP × A), where Qf is the permeate water flow rate in L/h, μ is the water viscos-ity (1.0 cP at 20°C), and A is the membrane filtration area (0.35 m2 for the 0.8-μm membrane and 0.24 m2 for the 1.4-μm membrane). The TMP was 1.276 bar. The CWF trial was performed in duplicate or until the original CWF was obtained. If not, the cleaning proce-dure reported below was repeated.
After each run, the milk was drained from the feed tank and DI water was added at 50°C to initiate a water rinse cycle for about 20 min. Forty liters of a so-lution of 0.5% (wt/wt) NaOH and 0.5% (wt/wt) bleach at 70°C were then circulated through the retentate and permeate side of the membrane for 30 min with the backpulse on at a 1 to 2 min frequency. The system was then rinsed with DI water at 90°C until the pH of the retentate and permeate streams was equal to that of DI water. If the CWF was less than 10% of the CWF be-fore experiments with milk, the membrane was washed with 0.5% (wt/wt) nitric acid solution at 60°C. The water rinse cycle was then repeated, and the CWF and pH of the permeate and retentate streams were deter-mined again. Upon completion of the process, the water rinse cycle was continued with the temperature lowered gradually from 50 to 25°C to cool the membrane to room temperature. If the experiment involved MF of milk with added BA spores, the first rinse cycle was conducted at 70°C using a solution with 0.5% (wt/wt) NaOH and 1.0% (wt/wt) bleach. All subsequent water rinse cycles were conducted at a temperature of 90°C to eliminate microorganisms. The apparatus was also checked for residual BA after each cleaning if spores were used using the procedure detailed below. Prior to experiments, the membrane was rinsed with DI water at 90°C to kill any microorganisms in the system.
Microfiltration Experiments
Determination of the Optimal TMP and CFV. In the first series of experiments, raw milk purchased from a local farm and skimmed before use was micro-filtered to identify the optimal operating conditions of TMP and CFV for later experiments involving spores. To begin the experiments, DI water was circulated at 20°C in the MF system to determine the CWF and then heated to 50°C to warm the system before the MF of skim milk. Ninety-seven liters of the skim milk kept refrigerated at 4°C was heated to 50°C using the heat exchanger of the MF apparatus and then allowed to equilibrate for 15 min in the feed tank to preserve the
quality of the milk proteins and to ensure that the milk mineral balance was not disturbed (Pedersen, 1991). To determine the optimal operating conditions for spore removal, TMPcrit and Jcrit were determined for the 0.8-μm membrane at a CFV of 3.2, 4.6, 5.3, 6.2, and 7.2 m/s using the stepwise procedure of Chen et al. (1997). The TMP was adjusted in the range from 40 to 160 kPa by adjusting valves 1 and 3 (Figure 1) to control the retentate outlet pressure, P2. The permeate side, P3, was open to the atmosphere. At each CFV and starting with the lowest TMP setting possible within the limits of the equipment, the TMP was adjusted upward in the smallest increments possible, about 25 kPa. The perme-ate flow rate, Pf (L/h), was determined using the flow meter on the permeate side and converted to J (L/m2·h) using the equation J = Pf/A, where A is the surface area of the membrane. The TMP was increased again and J recorded until a shift in the data to nonlinearity was noted, where J = Jcrit, or if an abrupt decrease in J was noted, indicating that J ≤ Jcrit. The TMP was then decreased by about 25 kPa and J was recorded again. The experiment continued until the initial value of the TMP was reached. These experiments were performed in duplicate. The experiments were also performed for the 1.4-μm membrane at a CFV of 5.3, 6.5, 7.7, and 9.0 m/s over a range of TMP from 65 to 314 kPa.
Determination of MF Transient Flux Charac-teristics. In the second series of experiments, skim milk was microfiltered using the optimal TMP and CFV determined from the first series of experiments to determine the transient J characteristics of the 0.8- and 1.4-μm membranes. The J, as a function of time for MF of skim milk, was determined by selecting one of the CFV-TMP combinations from a plot of Jcrit versus TMPcrit (Chen et al., 1997) that were judged to give op-timal J. A CFV of 6.2 m/s and TMP of 127.6 kPa were chosen for the 0.8-μm membrane. For the 1.4-μm mem-brane, a CFV of 6.2 m/s and TMP of 127.6 kPa were chosen for comparison experiments. These experiments were run in total recycle mode, which is equivalent to a volume reduction ratio of 1, with both permeate and retentate returned to the tank to maintain the feed concentration and in subsequent experiments, spore concentration. The J was determined every 20 min from the beginning of the run. Each run lasted up to 5 h (spore-free runs only) and was conducted 3 times.
For comparison purposes, J as a function of time was also determined for MF of DI water using the 0.8-μm membrane at the same CFV and TMP used for skim milk. This experiment was performed in duplicate.
Analysis of variance using Proc GLM (SAS, version 9.22; SAS Institute Inc., Cary, NC) was used to deter-mine if J for the various trials varied from run to run over the length of the run. The model was J = time +
Journal of Dairy Science Vol. 94 No. 9, 2011
MICROFILTRATION OF MILK TO REMOVE SPORES 4281
replicate + time × replicate + error. Proc GLM was also used to determine if J changed with processing after 40 min of operation and 100 min of operation for the 0.8-μm membrane and after 100 and 200 min of operation for the 1.4-μm membrane.
Chemical Analyses. The skim milk, the permeates, and the retentates from the MF trials for the 0.8-μm and the 1.4-μm membranes, at sampling times of 10, 90, and 200 min of operation, were analyzed for total N (TN; AOAC, 2010a; method 991.20) and non-CN-N contents (AOAC, 2010b; method 998.05). Crude protein content was determined as TN × 6.38. Casein was calculated as the difference between TN and CN-N multiplied by 6.38. These analyses were performed in triplicate. Casein as a percentage of CP was also calcu-lated and reported as CN%CP.
Evaluation of Indigenous Microflora and Spores. To enumerate the microflora in raw milk, skim milk, and the permeates from the MF trials for the 0.8-μm membrane at sampling times of 10, 90, and 200 min, serial dilutions of 10 mL of each were prepared in 0.1% peptone (Difco, Detroit, MI) and 100 μL were spread onto plate count agar (Difco). Plates were incu-bated aerobically at 37 and 30°C. Approximately 1-mL samples of skim milk were heated to 85°C for 12 min, then immediately placed in an ice bath to cool and then plated to estimate the number of indigenous spores. Isolated colonies were counted and reported as colony-forming units per milliliter, with the limit of detection at 1 log10 cfu/mL. The analyses were performed in trip-licate and reported counts are the average number of colonies from duplicate plates.
Resistance Analysis. Darcy’s Law is used to de-scribe flow through microporous membranes and was used to estimate the various resistances to permeate flow for water and milk as a function of CFV for the second series of experiments:
J = TMP/(μR), [1]
where J is the average permeate flux (m/s), TMP is the transmembrane pressure (Pa), μ is either the viscosity of the milk permeate (0.000800 Pa·s) at 50°C or water (0.000547 Pa·s) at 20°C and R is the hydraulic resis-tance (m−1). In this study, Rtotal, the total resistance to flow across the membrane, was assumed to be the sum of 2 resistances:
Rtotal = Rm + Rf,cp, [2]
where Rtotal was calculated from the final average value of J for skim milk obtained at the end of a run for the particular membrane, Rm is the resistance of the clean membrane and was determined using the value of the
CWF in Equation 1, and Rf,cp is the resistance due to both reversible and irreversible fouling and concentra-tion polarization effects and was calculated from the difference between Rtotal and Rm. To determine if ir-reversible membrane fouling occurred, the membrane was rinsed with DI water after skim milk MF for 20 min to remove reversible fouling; Jf was measured from the CWF of the fouled membrane.
Microfiltration Experiments to Remove BA Spores From Milk
Spore Preparation. The Sterne strain of BA, ob-tained from Jeffrey S. Karns and Michael L. Perdue (ARS, USDA, Beltsville Area Research Center, Belts-ville, MD), was prepared as described in Novak et al. (2005). Sporulation levels were checked daily with an Olympus model BH-2 microscope equipped with phase contrast optics (Olympus, Melville, NY) until 90% sporulation was achieved. Spore titers were determined by plating serial dilutions of spore stocks, with and without prior heat shock at 75°C for 20 min, in distilled H2O onto brain heart infusion (BHI) agar plates fol-lowing incubation at 37°C. The colony-forming units per milliliter data were determined the next day.
Inoculation and Sampling of Skim Milk. For each MF trial in this third series of the experiments, about 120 mL of the BA spore suspension (ca. 109 BA spores/mL for 6 log10 BA spores/mL of milk) was asep-tically added to the feed vessel of the MF unit contain-ing about 97 L of milk, which was preheated to 50°C and held for 15 min in the feed tank (Pedersen, 1991). Two MF trials to determine J as a function of time, as described for the second series of experiments, were conducted for the 0.8-μm and the 1.4-μm membranes using separate inoculations for each trial, with run times up to 2 h. The same TMP and CFV from the second series of experiments were used. Samples of the permeate (ca. 80 mL) were drawn from the MF unit at various times during the experiments in sterile speci-men cups in periods up to 2 h, diluted in 0.1% (wt/vol) peptone (Difco) as appropriate, and 250 μL was sub-sequently spread plated onto a BHI (Difco) agar plate with the aid of a cell spreader. Plates were incubated aerobically at 37°C for 16 to 20 h. The colonies on each BHI plate were counted by hand and levels were reported as spores per milliliter. The detection limit was <0.3 log10 BA spores/mL. To confirm that only BA were counted, several colonies from each trial were randomly selected and plated onto Anthracis Chromo-genic (R & F Laboratories, Downers Grove, IL) selec-tive/differential agar. The BA colonies are teal blue colored after 36 to 48 h of incubation at 37°C. These experiments were also conducted in the total recycle
4282 TOMASULA ET AL.
Journal of Dairy Science Vol. 94 No. 9, 2011
mode to maintain the level of spores in the feed tank, and due to the large processing volumes used in this study, to minimize handling of additional streams and storage tanks containing spores. Experiments involving spores were performed in the Center of Excellence for Process Validation, Eastern Regional Research Center, ARS, USDA, Wyndmoor, PA. The results for the MF runs are reported as log reduction of BA spores, which is the difference between the number of spores in the feed and the number of spores in the permeate. Log reduction of BA spores and the log of the number of BA spores in the permeate at each MF time sampled were calculated. If the log of the number of spores was below the limit of detection of the spores, a value of zero was used.
The results for the 2 MF trials were analyzed by ANOVA to determine the significance (P < 0.05) of any treatment effects (SAS, version 9.22; SAS Institute Inc.).
Pasteurization of Microfiltered Milk for Shelf-Life Studies
In the fourth series of experiments, milk was microfil-tered with added BA spores as described for the third series, but approximately 1-L samples of the permeate and retentate were withdrawn at 3 MF times—10, 30, and 120 min—chilled to 4°C, and then pasteurized as described below.
HTST Pasteurizer. An Armfield Model FT74P/T HTST/UHT (Armfield Inc., Denison, IA) plate and frame continuous pasteurizer described previously was used in these studies (Tomasula and Kozempel, 2004). All samples were heated to 72°C using hot water on the opposing side of the heat exchanger. One holding tube assembly was used with a nominal holding time of 21.5 s and corrected holding time of 18.6 s (Tomasula and Kozempel, 2004). The temperature was monitored using thermocouples at the inlet to the pasteurizer, the holding tube exit, and the heating section of the pasteurizer. The pasteurization temperature was auto-matically controlled at the holding tube exit.
Sanitation of the Pasteurizer. The pasteurizer was sanitized before use, between runs, and after use. Prior to use, hot water at the temperature of the experi-ment was pumped through each section of the pasteur-izer to equilibrate it. The pasteurizer was then rinsed with a 10% bleach-water solution for approximately 10 min and then flushed with hot water again for 20 min. All rinse solutions were collected in a carboy filled with a 10% bleach solution. The cabinet of the pasteurizer was sanitized using a 10% bleach solution followed by a 70% ethanol solution.
HTST Pasteurization Experiments. Water was fed to the pasteurizer before each trial to eliminate tem-perature fluctuations caused by heating of the equip-ment itself when bringing it from room temperature to the experimental conditions. For each run, the feed vessel was removed from the pasteurizer, filled with up to 1 L of raw milk used as a control, or retentate or permeate samples, then mounted over the pump lead-ing to the pasteurizer. Pasteurization was conducted at 72°C at a holding time of 18.6 s. The milk was allowed to flow into the pasteurizer when it was noted that the level of the hot water in the pump just disappeared. The cooled, pasteurized milk was collected into sterile containers and kept on ice. Samples were then stored at 4°C for analysis the same day and also at 10 and 25°C for shelf-life studies. The effectiveness of pasteuriza-tion at 72°C was tested using the Charm LUMinator-T (Charm Sciences Inc., Lawrence, MA), which detects the presence of alkaline phosphatase, with sensitivity to 0.005% raw milk. In separate trials, 1-L quantities of the permeate and the retentate were obtained during MF at times of 10, 30, and 120 min, cooled to 4°C, and then pasteurized at 72°C with a holding time of 18.6 s. The pasteurized controls, skim milk permeate, and skim milk retentate samples were held at storage times of 4, 10, and 25°C. They were sampled weekly at 4°C, every 3 d at 10°C, and daily at 25°C, until the samples showed evidence of flocculation or gelation. The pH of the pasteurized and unpasteurized samples was de-termined for all of the pasteurized and unpasteurized samples on each sampling day using a model 6000P pH/temperature electrode and a model 5500 pH meter (A. Daigger & Co. Inc., Vernon Hills, IL).
The data were analyzed using the mixed procedure of SAS (SAS, version 9.22; SAS Institute Inc.). Analysis of covariance was performed for each temperature to determine the effects of time of storage and duration of filtration on the growth of spores in the unpasteur-ized and pasteurized permeate and retentate samples (4 treatments). Values recorded as zero counts were replaced with random numbers between 0 and 1.
RESULTS AND DISCUSSION
Determination of TMPcrit and Jcrit
To identify the critical hydrodynamic conditions, TMPcrit and Jcrit (Field et al., 1995; Bacchin et al., 2006), for long-term stable permeate flux, MF trials in the first series of experiments were conducted at fixed CFV of 3.2, 4.6, 5.8, 6.2, and 8.0 m/s for the 0.8-μm membrane (Chen et al., 1997). The J as a function of TMP was plotted for each CFV.
Journal of Dairy Science Vol. 94 No. 9, 2011
MICROFILTRATION OF MILK TO REMOVE SPORES 4283
The relationship between J and TMP, as shown in Figure 2 for a CFV of 6.2 m/s and for the other CFV (not shown), was linear as TMP was increased from 124 to 141 kPa. In this case, the weak form of the Jcrit (Field et al., 1995; Gésan-Guiziou et al., 1999; James et al., 2003) can be assumed, which is typically char-acterized by adsorption between the membrane surface and CN and concentration polarization effects. This region has also been termed regime I, which represents subcritical MF operation without J-dependent fouling (Brans et al., 2004). The characteristic shift to the pressure-independent region or limiting J (regime II) is indicated by a plateau on a plot of J versus TMP, with J first increasing more slowly with TMP and eventually approaching a constant value. This region is typically recommended for removal of spores and bacteria by MF. A change in slope (Figure 2) was observed as J increased in the TMP range from 141 to 186 kPa but a limiting J or plateau was not observed upon further in-creases in TMP. Instead of a plateau, with an increase in TMP from 186 kPa, J suddenly decreased from a J of 335 to 19.5 L/m2·h, which is evidence of severe cake formation and fouling (regime III) as described by Brans et al. (2004). Further increases in TMP were not possible because of limitations of the equipment. The absence of a clear pressure-independent region or plateau was similarly observed by Guerra et al. (1997) using a 1.0-μm ceramic membrane for MF of skim milk and was interpreted according to the osmotic pressure model of Jonsson (1984) for limiting J. In this model, it is assumed that an osmotic pressure develops because of a decrease in the water activity and CN gel forma-tion due to the proximity of the CN molecules covering the membrane surface. When TMP is adjusted to a value greater than TMPcrit, CN gel formation and com-paction result, leading to fouling. The osmotic pressure exceeds the TMP, which causes a sharp decrease in J. Upon stepwise decreases in TMP from 186 kPa back to the initial value of 141 kPa (Figure 2, arrows in the reverse direction), hysteresis was apparent, indicat-ing a partial recovery of J in this region, and that the membrane is not irreversibly fouled. Complete recovery of J was achieved when TMP was returned to its initial value, indicating that fouling effects were reversible at the lowest operating pressure.
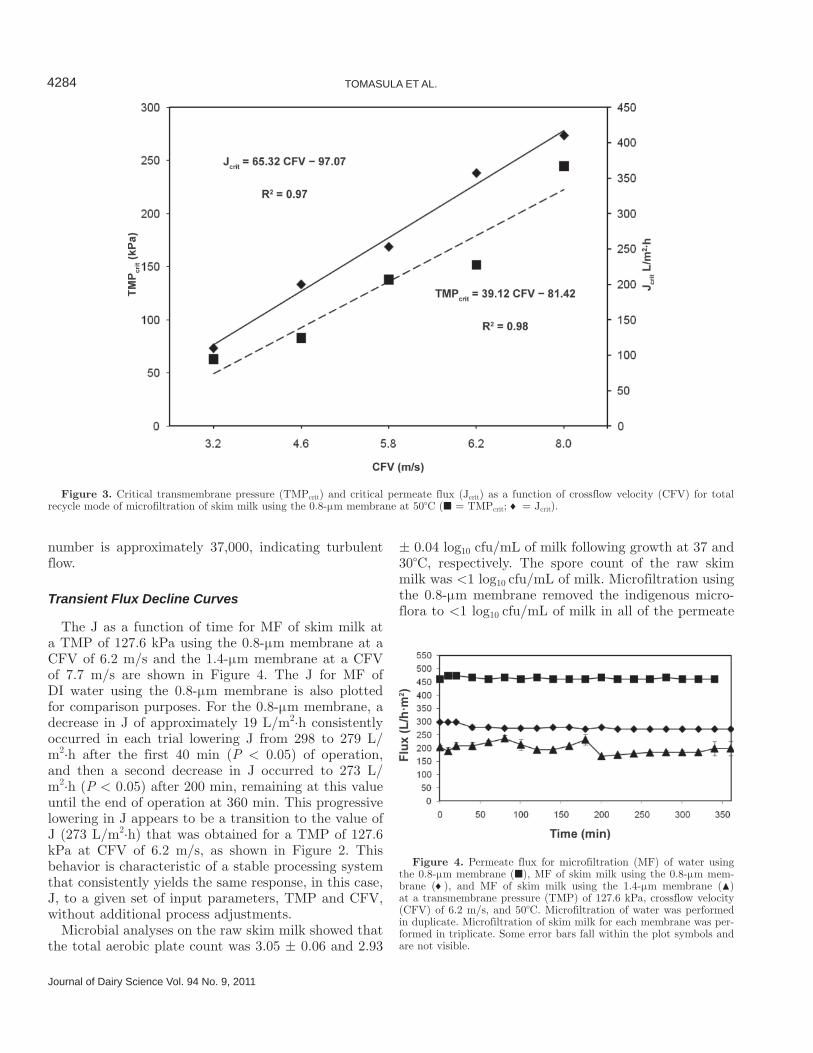
As determined from the plots of TMP as a function of J at each CFV, such as in Figure 2, MF operating conditions above TMPcrit and Jcrit for a particular CFV will result in fouling. To help select the TMP and J at a particular CFV, operating lines of TMPcrit (TMPcrit = 39.12 CFV – 81.42; R2 = 0.98) and Jcrit (Jcrit = 65.32 CFV – 97.07; R2 = 0.97) as a function of CFV were constructed as shown in Figure 3. The figure applies
only to the 0.8-μm membrane and the equipment used in this study.
The TMP of 127.6 kPa and CFV of 6.2 m/s, which corresponds to the lowest end of regime I or subcritical operation, as described by Brans et al. (2004), were chosen as the MF operating conditions in this study for the 0.8-μm membrane. The corresponding Reynolds number of approximately 22,200 indicates that opera-tion was in the turbulent flow regime. The value of J for the corresponding TMP at these conditions from Figure 2 is 298 L/m2·h. As shown in Figure 3, at a CFV of 6.2 m/s, values of TMP up to 151 kPa with an increased value of J could have also been chosen to operate in regime I.
An analysis similar to the one described above was also conducted for the 1.4-μm membrane. The operating line for TMPcrit is TMPcrit = 39.3372 CFV – 101.4, R2 = 0.9981, and for Jcrit is Jcrit = 76.4213 CFV – 193.4633. It was not possible to choose both a TMP and CFV for the 1.4-μm membrane that agreed with the values chosen for the 0.8-μm membrane so that MF of skim milk was operated under subcritical conditions for both membranes. For example, at TMP of 127.6 kPa and a CFV of 6.2 m/s, the operating conditions chosen for the 0.8-μm membrane, MF operation with the 1.4-μm membrane would have approached regime III (Brans et al., 2004) and short-term operation would be expected. A TMP of 127.6 kPa, which agrees with the TMP used for the 0.8-μm membrane and a CFV of 7.7 m/s were chosen, with an equilibrium value of J of 220 L/m2·h, which ensured that both membranes were operated un-der subcritical conditions. The corresponding Reynolds
Figure 2. Permeate flux (J) as a function of stepwise increases and decreases in transmembrane pressure (TMP) for the 0.8-μm mem-brane at a crossflow velocity (CFV) of 6.2 m/s of skim milk and tem-perature of 50°C to determine the critical J (Jcrit) and critical TMP (TMPcrit). The arrows show the path for changes in TMP, with the solid line showing the change in TMP in the forward direction and the broken line showing the change in TMP in the reverse direction. These experiments were performed in duplicate. Error bars fall within the plot symbols and are not visible.
4284 TOMASULA ET AL.
Journal of Dairy Science Vol. 94 No. 9, 2011
number is approximately 37,000, indicating turbulent flow.
Transient Flux Decline Curves
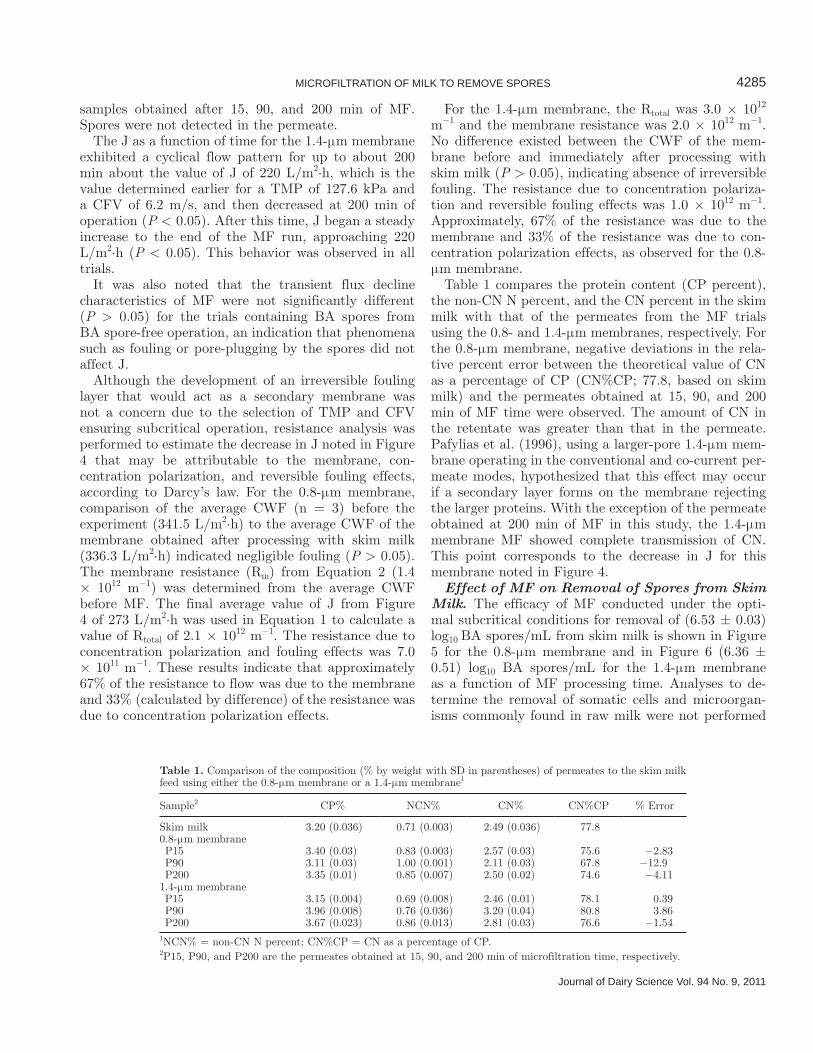
The J as a function of time for MF of skim milk at a TMP of 127.6 kPa using the 0.8-μm membrane at a CFV of 6.2 m/s and the 1.4-μm membrane at a CFV of 7.7 m/s are shown in Figure 4. The J for MF of DI water using the 0.8-μm membrane is also plotted for comparison purposes. For the 0.8-μm membrane, a decrease in J of approximately 19 L/m2·h consistently occurred in each trial lowering J from 298 to 279 L/m2·h after the first 40 min (P < 0.05) of operation, and then a second decrease in J occurred to 273 L/m2·h (P < 0.05) after 200 min, remaining at this value until the end of operation at 360 min. This progressive lowering in J appears to be a transition to the value of J (273 L/m2·h) that was obtained for a TMP of 127.6 kPa at CFV of 6.2 m/s, as shown in Figure 2. This behavior is characteristic of a stable processing system that consistently yields the same response, in this case, J, to a given set of input parameters, TMP and CFV, without additional process adjustments.
Microbial analyses on the raw skim milk showed that the total aerobic plate count was 3.05 ± 0.06 and 2.93
± 0.04 log10 cfu/mL of milk following growth at 37 and 30°C, respectively. The spore count of the raw skim milk was <1 log10 cfu/mL of milk. Microfiltration using the 0.8-μm membrane removed the indigenous micro-flora to <1 log10 cfu/mL of milk in all of the permeate
Figure 3. Critical transmembrane pressure (TMPcrit) and critical permeate flux (Jcrit) as a function of crossflow velocity (CFV) for total recycle mode of microfiltration of skim milk using the 0.8-μm membrane at 50°C (� = TMPcrit; = Jcrit).
Figure 4. Permeate flux for microfiltration (MF) of water using the 0.8-μm membrane (�), MF of skim milk using the 0.8-μm mem-brane ( ), and MF of skim milk using the 1.4-μm membrane (�) at a transmembrane pressure (TMP) of 127.6 kPa, crossflow velocity (CFV) of 6.2 m/s, and 50°C. Microfiltration of water was performed in duplicate. Microfiltration of skim milk for each membrane was per-formed in triplicate. Some error bars fall within the plot symbols and are not visible.
Journal of Dairy Science Vol. 94 No. 9, 2011
MICROFILTRATION OF MILK TO REMOVE SPORES 4285
samples obtained after 15, 90, and 200 min of MF. Spores were not detected in the permeate.
The J as a function of time for the 1.4-μm membrane exhibited a cyclical flow pattern for up to about 200 min about the value of J of 220 L/m2·h, which is the value determined earlier for a TMP of 127.6 kPa and a CFV of 6.2 m/s, and then decreased at 200 min of operation (P < 0.05). After this time, J began a steady increase to the end of the MF run, approaching 220 L/m2·h (P < 0.05). This behavior was observed in all trials.
It was also noted that the transient flux decline characteristics of MF were not significantly different (P > 0.05) for the trials containing BA spores from BA spore-free operation, an indication that phenomena such as fouling or pore-plugging by the spores did not affect J.
Although the development of an irreversible fouling layer that would act as a secondary membrane was not a concern due to the selection of TMP and CFV ensuring subcritical operation, resistance analysis was performed to estimate the decrease in J noted in Figure 4 that may be attributable to the membrane, con-centration polarization, and reversible fouling effects, according to Darcy’s law. For the 0.8-μm membrane, comparison of the average CWF (n = 3) before the experiment (341.5 L/m2·h) to the average CWF of the membrane obtained after processing with skim milk (336.3 L/m2·h) indicated negligible fouling (P > 0.05). The membrane resistance (Rm) from Equation 2 (1.4 × 10¹² m−1) was determined from the average CWF before MF. The final average value of J from Figure 4 of 273 L/m2·h was used in Equation 1 to calculate a value of Rtotal of 2.1 × 10¹² m−1. The resistance due to concentration polarization and fouling effects was 7.0 × 10¹¹ m−1. These results indicate that approximately 67% of the resistance to flow was due to the membrane and 33% (calculated by difference) of the resistance was due to concentration polarization effects.
For the 1.4-μm membrane, the Rtotal was 3.0 × 10¹² m−1 and the membrane resistance was 2.0 × 10¹² m−1. No difference existed between the CWF of the mem-brane before and immediately after processing with skim milk (P > 0.05), indicating absence of irreversible fouling. The resistance due to concentration polariza-tion and reversible fouling effects was 1.0 × 10¹² m−1. Approximately, 67% of the resistance was due to the membrane and 33% of the resistance was due to con-centration polarization effects, as observed for the 0.8-μm membrane.
Table 1 compares the protein content (CP percent), the non-CN N percent, and the CN percent in the skim milk with that of the permeates from the MF trials using the 0.8- and 1.4-μm membranes, respectively. For the 0.8-μm membrane, negative deviations in the rela-tive percent error between the theoretical value of CN as a percentage of CP (CN%CP; 77.8, based on skim milk) and the permeates obtained at 15, 90, and 200 min of MF time were observed. The amount of CN in the retentate was greater than that in the permeate. Pafylias et al. (1996), using a larger-pore 1.4-μm mem-brane operating in the conventional and co-current per-meate modes, hypothesized that this effect may occur if a secondary layer forms on the membrane rejecting the larger proteins. With the exception of the permeate obtained at 200 min of MF in this study, the 1.4-μm membrane MF showed complete transmission of CN. This point corresponds to the decrease in J for this membrane noted in Figure 4.
Effect of MF on Removal of Spores from Skim Milk. The efficacy of MF conducted under the opti-mal subcritical conditions for removal of (6.53 ± 0.03) log10 BA spores/mL from skim milk is shown in Figure 5 for the 0.8-μm membrane and in Figure 6 (6.36 ± 0.51) log10 BA spores/mL for the 1.4-μm membrane as a function of MF processing time. Analyses to de-termine the removal of somatic cells and microorgan-isms commonly found in raw milk were not performed
Table 1. Comparison of the composition (% by weight with SD in parentheses) of permeates to the skim milk feed using either the 0.8-μm membrane or a 1.4-μm membrane1
Sample2 CP% NCN% CN% CN%CP % Error
Skim milk 3.20 (0.036) 0.71 (0.003) 2.49 (0.036) 77.80.8-μm membrane P15 3.40 (0.03) 0.83 (0.003) 2.57 (0.03) 75.6 −2.83 P90 3.11 (0.03) 1.00 (0.001) 2.11 (0.03) 67.8 −12.9 P200 3.35 (0.01) 0.85 (0.007) 2.50 (0.02) 74.6 −4.111.4-μm membrane P15 3.15 (0.004) 0.69 (0.008) 2.46 (0.01) 78.1 0.39 P90 3.96 (0.008) 0.76 (0.036) 3.20 (0.04) 80.8 3.86 P200 3.67 (0.023) 0.86 (0.013) 2.81 (0.03) 76.6 −1.541NCN% = non-CN N percent; CN%CP = CN as a percentage of CP.2P15, P90, and P200 are the permeates obtained at 15, 90, and 200 min of microfiltration time, respectively.
4286 TOMASULA ET AL.
Journal of Dairy Science Vol. 94 No. 9, 2011
in this study because previous studies have confirmed their removal from skim milk by MF using a 1.4-μm membrane (Pafylias et al., 1996; Elwell and Barbano, 2006; Fritsch and Moraru, 2008), although Elwell and Barbano (2006) noted the possibility of destruction of some somatic cells by the shear forces generated during MF.
Log reduction of spores averaged 5.91 ± 0.05 using the 0.8-μm membrane (Figure 5) over the total process-ing time of 120 min. For the first 30 min of processing during the start-up period, log reductions in the num-ber of spores significantly decreased (P < 0.05) from
the initial value of 6.53 ± 0.03 to 5.88 ± 0.03 log 10 BA spores/mL, as the number of spores in the permeate began to increase. After 40 min, the number of spores in the permeate stabilized to an average value of 0.93 log10 BA spores/mL (P < 0.05), with a range from 0.65 to 1.10 log10 BA spores/mL, which is also the same time that the first decrease in J was noted for MF of spore-free milk as shown in Figure 4 until 120 min of operation, at which time spores were not detected in the permeate. The values of J (279 L/m2·h) at 40 and 120 min of operation are the same, indicating that it is unlikely that changes in the total hydraulic resistance of the MF system contributed to the spore-free per-meate observed at 120 min. Additional MF trials are needed to establish the performance of the membrane at times >120 min.
For MF of skim milk using the 1.4-μm membrane (Figure 6), the log reduction of spores averaged 4.50 ± 0.35 over the total processing time of 210 min. After 15 min of operation, the log reduction of BA spores was 5.17 ± 0.36. The performance of this membrane is similar to that of the 0.8-μm membrane at start-up with lower amounts of spores in the permeate during the transition from water to milk. After 90 and 210 min of operation, respectively, the log reduction of BA spores was 4.19 ± 0.32 and 4.15 ± 0.36, respectively, corresponding to 2.53 ± 0.32 log10 BA spores/mL and 2.57 ± 0.38 log10 BA spores/mL in the permeate (P < 0.05), respectively, and did not appear to be affected by the cyclical variation of J with time during the start-up process.
As further confirmation that MF of skim milk was conducted under subcritical processing conditions, with spore retention primarily due to size exclusion of the spores by the membrane and not concentration polar-ization effects that would help prevent spores smaller than the membrane pore size from entering the perme-ate, DI water containing 6.62 ± 0.18 log10 BA spores/mL was processed using the 0.8-μm membrane (Figure 7). Over the 210 min of processing, the overall log re-duction of spores averaged 6.02 ± 0.42 log10 BA spores/mL and an average of 0.80 ± 0.17 log10 BA spores/mL in the permeate, which is in good agreement (P < 0.05) with the overall log reduction in spores noted for MF of skim milk 5.91 ± 0.05 (Figure 5) and the overall aver-age value of spores in the permeate of 0.74 ± 0.03 log10 BA spores/mL. The concentration polarization effects are responsible for the lower J of skim milk compared with water (Figure 4; Cheryan, 1998).
In this study, the operating conditions were intention-ally chosen to minimize the buildup of a gel layer which would lead to a decline in J (Brans et al., 2004) and to emphasize the selectivity of the membranes. Trouvé et al. (1991) demonstrated that the retention of bacteria
Figure 5. Log reduction of spores and number of spores in the permeate after microfiltration of skim milk inoculated with Bacillus anthracis (BA; Sterne) spores [0.8-μm ceramic membrane, crossflow velocity (CFV) = 6.2 m/s, transmembrane pressure (TMP) = 127.6 kPa]. Results are for duplicate trials. For log reduction of spores data, means with different lowercase letters are significantly different (P < 0.05). For the permeate samples, means with different uppercase let-ters are significantly different (P < 0.05).
Figure 6. Log reduction of spores and number of spores in the permeate after microfiltration of skim milk inoculated with Bacillus anthracis (BA; Sterne) spores [1.4-μm ceramic membrane, crossflow velocity (CFV) = 6.2 m/s, transmembrane pressure (TMP) = 127.6 kPa]. Results are for duplicate trials. For log reduction of spores data, means with different lowercase letters are significantly different (P < 0.05). For the permeate samples, means with different uppercase let-ters are significantly different (P < 0.05).
Journal of Dairy Science Vol. 94 No. 9, 2011
MICROFILTRATION OF MILK TO REMOVE SPORES 4287
in MF processing may also be related to their average cellular volume (volumes >0.7 μm3), even though the interactions of soluble milk components was found to interact preferentially with the alumina particles of the membrane (1.4-μm membrane) using the Bactocatch process. Spores of BA Sterne have a spherical volume of 0.569 ± 0.140 μm3 with a mean length of 1.49 ± 0.17 μm and a size range of 1.09 to 2.13 μm and a mean diameter of 0.85 ± 0.08 μm with a size range of 0.66 to 1.09 μm. The aspect ratio is 1.75 ± 0.20 (Carrera et al., 2007). Understanding the hydrodynamic pore wall-bacteria interaction for rejection of rod-shaped bacteria in water by MF membranes is currently an area of in-vestigation (Baltus et al., 2009). In experiments using a stirred-cell apparatus with various MF membranes having mostly cylindrical pores, it was shown that the rod diameter of a spore should be used when selecting the appropriate-sized membrane. This would imply, of course, that, given the size range of the BA spores and spores such as Bacillus cereus (Chada et al., 2003; Carrera et al., 2007), which are more commonly found in milk, the complete removal of spores would require a membrane with a smaller pore size. However, the authors cautioned against extrapolating this result to MF filters with random and tortuous pores used com-mercially.
Pasteurization of Milk and Milk Permeates and Retentates. To determine if MF permeates and retentates would support the growth of BA spores after pasteurization and through storage at various tempera-tures, 1-L quantities of the permeates and the retentates were removed from the MF unit at times of 10, 30, and 120 min and were immediately pasteurized at 72°C at a holding time of 18.6 s in separate, duplicate trials. Raw
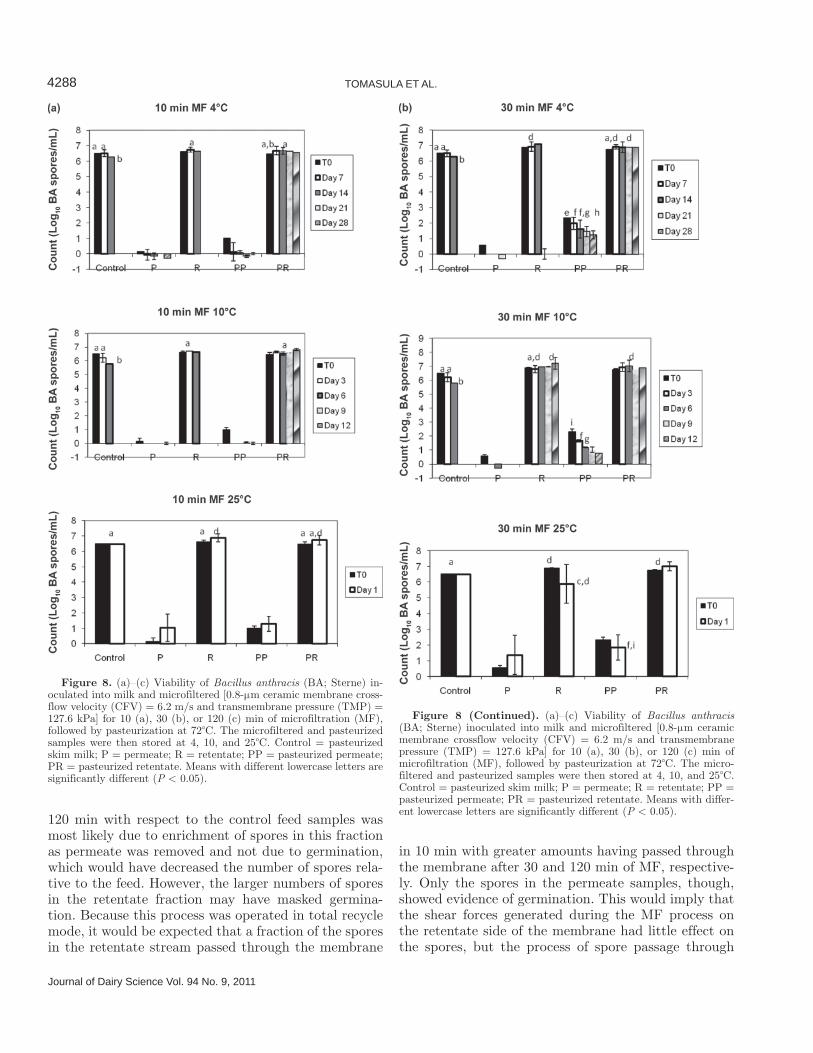
skim milk that was inoculated with 6.51 ± 0.00 log10 BA spores/mL and then pasteurized was a control for the pasteurized samples. All of the unpasteurized and pasteurized samples were then held at storage times of 4, 10, and 25°C, with 4°C representing refrigeration conditions, 10°C representing moderate abuse condi-tions, and 25°C representing abuse conditions. All of the samples stored at 25°C showed evidence of milk flocculation or gelation after 1 d and are not discussed further. The results for the 3 MF times as a function of storage temperature are shown in Figures 8a–8c.
As expected for the pasteurized controls (Novak et al., 2005) shown in Figures 8a–8c, pasteurization at 72°C at d 0 had no effect on decreasing the spore load of the samples. A small decrease (P < 0.05) in the number of spores occurred with up to 14 d of storage at 4°C, whereas storage at 10°C resulted in a decrease (P < 0.05) in the number of spores, an indication that some germination occurred. Bowen and Turnbull (1992) noted that germination of up to 1 log of BA spores may occur in pasteurized milk but not in unpasteurized milk and attributed this to factors that may induce germina-tion, such as raised levels of adenosine in pasteurized milk. No decrease in the number of spores of BA was noted in the sample stored at 25°C after 1 d of storage. The shelf life of the pasteurized controls at 4°C was be-tween 7 and 14 d, as determined by pH measurement. The pH decreased from 6.72 at d 7 to 5.91 at d 14 of storage. The shelf life of the pasteurized controls stored at 10°C was between 3 and 6 d. The pH decreased from 6.72 at d 3 of storage to 5.90 at d 6. The sample stored at 25°C had a shelf-life of <1 d.
An average of 0.15 ± 0.21 log10 BA spores/mL, be-low the detection limit of ≤0.3 log10 BA spores/mL, was found in the permeate samples (unpasteurized) obtained after 10 min of MF (Figure 8a). The perme-ate samples, as well as those obtained after 30 and 120 min of MF, respectively, persisted for 28 d when stored at 4°C and 12 d when stored at 10°C with a pH of 6.72, indicating an increase in storage stability relative to the pasteurized controls. Even though spores were presumably present in the samples as shown for d 0, it is apparent that germination occurred at least by d 7 for the samples stored at 4°C and d 3 for the samples stored at 10°C because neither spores nor vegetative cells were detected in the samples over the full storage period.
The loss of spore viability may be attributed to the MF process with MF serving as a sublethal stress trig-ger of germination. However, this mechanism is unclear. The unpasteurized retentate samples drawn at 10 min and stored at 4, 10, or 25°C showed little evidence of spore germination (P > 0.05). The small increase in the number of spores in the retentates drawn at 30 and
Figure 7. Log reduction of spores and the number of spores in the permeate after microfiltration of deionized water inoculated with Bacillus anthracis (BA; Sterne) spores [0.8-μm membrane, crossflow velocity (CFV) = 6.2 m/s, transmembrane pressure (TMP) = 127.6 kPa]. Results are for duplicate trials. For log reduction of spores data, means with different lowercase letters are significantly different (P < 0.05). For the permeate samples, means with different uppercase let-ters are significantly different (P < 0.05).
4288 TOMASULA ET AL.
Journal of Dairy Science Vol. 94 No. 9, 2011
120 min with respect to the control feed samples was most likely due to enrichment of spores in this fraction as permeate was removed and not due to germination, which would have decreased the number of spores rela-tive to the feed. However, the larger numbers of spores in the retentate fraction may have masked germina-tion. Because this process was operated in total recycle mode, it would be expected that a fraction of the spores in the retentate stream passed through the membrane
in 10 min with greater amounts having passed through the membrane after 30 and 120 min of MF, respective-ly. Only the spores in the permeate samples, though, showed evidence of germination. This would imply that the shear forces generated during the MF process on the retentate side of the membrane had little effect on the spores, but the process of spore passage through
Figure 8. (a)–(c) Viability of Bacillus anthracis (BA; Sterne) in-oculated into milk and microfiltered [0.8-μm ceramic membrane cross-flow velocity (CFV) = 6.2 m/s and transmembrane pressure (TMP) = 127.6 kPa] for 10 (a), 30 (b), or 120 (c) min of microfiltration (MF), followed by pasteurization at 72°C. The microfiltered and pasteurized samples were then stored at 4, 10, and 25°C. Control = pasteurized skim milk; P = permeate; R = retentate; PP = pasteurized permeate; PR = pasteurized retentate. Means with different lowercase letters are significantly different (P < 0.05).
Figure 8 (Continued). (a)–(c) Viability of Bacillus anthracis (BA; Sterne) inoculated into milk and microfiltered [0.8-μm ceramic membrane crossflow velocity (CFV) = 6.2 m/s and transmembrane pressure (TMP) = 127.6 kPa] for 10 (a), 30 (b), or 120 (c) min of microfiltration (MF), followed by pasteurization at 72°C. The micro-filtered and pasteurized samples were then stored at 4, 10, and 25°C. Control = pasteurized skim milk; P = permeate; R = retentate; PP = pasteurized permeate; PR = pasteurized retentate. Means with differ-ent lowercase letters are significantly different (P < 0.05).
Journal of Dairy Science Vol. 94 No. 9, 2011
MICROFILTRATION OF MILK TO REMOVE SPORES 4289
the membrane may have induced germination through damage to the spore itself.
Bacillus anthracis is protected by an outer coat, known as the exosporium, which is composed of glyco-proteins, in addition to the protective layer called the spore coat which protects many Bacillus species. The role of the exosporium in regulating the interactions of the spore with the environment is just becoming understood (Chada et al., 2003; Steichen et al., 2007;
Severson et al., 2009). Possibly, MF damaged the exo-sporium, triggering the germination process detailed in Indest et al. (2009). A lack of information on non-nutrient stimulation of spore germination exists, such as that encountered in food processing, although a combination of high pressure and temperature has been shown to inactivate Bacillus cereus spores in milk (Van Opstal et al., 2004). Fritsch and Moraru (2008) inferred that germination of thermophilic spores was a possibil-ity during MF conducted at 50 to 55°C from research demonstrating that thermophilic spore-forming bacilli were found to grow in the regeneration section of heat exchangers and in evaporators (Murphy et al., 1999; Scott et al., 2007) at temperatures ranging from 45 to 75°C. It is a possibility that the combination of heat and MF shear were contributing factors to the spore germination noted in this study.
Pasteurization of the permeates obtained after 10 min of MF (Figure 8a) resulted in increased germination of BA, relative to that of the unpasteurized permeate at d 0 to 1.00 ± 0.14 log10 BA spores/mL. This increase may be due to heat shock, a lethal stress, of all of the spores in the permeate that were presumably damaged by MF. No evidence existed of BA spores or vegetative cells by d 7 and to d 28 when stored at 4°C or to d 12 when stored at 10°C. Pasteurization of the skim milk controls did not result in germination, indicating that heat shock effects only occurred to samples that were microfiltered.
An average of 0.57 ± 0.12 log10 BA spores/mL were found in the permeate samples obtained after 30 min of MF (Figure 8b) and an average of 0.50 ± 0.27 log10 BA spores/mL were found in the permeate samples obtained after 120 min of MF (Figure 8c). As noted for the 10-min MF permeate samples (Figure 8a), germina-tion followed by inactivation of the spores occurred by at least d 7 for the 30 min and 120 min MF permeate samples, respectively, stored at 4°C and by d 12 for the permeate samples stored at 10°C (Figures 8b and 8c). Pasteurization resulted in germination of BA spores to 2.32 ± 0.18 log10 BA spores/mL (30 min of MF; Figure 8b) and 2.42 ± 0.42 log10 BA spores/mL (120 min of MF; Figure 8c), respectively. However, unlike the pasteurized permeates obtained after 10 min of MF, BA persisted in the pasteurized permeate samples obtained after 30 and 120 min of MF throughout the entire storage periods. For the pasteurized permeates stored at 4°C, a gradual decrease in BA spores occurred (P < 0.05) over the 28-d storage period to 1.24 ± 0.27 log10 BA spores/mL (30 min of MF), an indication of spore germination followed by death over the length of the storage period. Storage at 10°C led to a decrease in spores to 0.77 ± 0.10 log10 BA spores/mL (30 min of MF) by d 12 (Figure 8b), but a decrease in spore
Figure 8 (Continued). (a)–(c) Viability of Bacillus anthracis (BA; Sterne) inoculated into milk and microfiltered [0.8-μm ceramic membrane crossflow velocity (CFV) = 6.2 m/s and transmembrane pressure (TMP) = 127.6 kPa] for 10 (a), 30 (b), or 120 (c) min of microfiltration (MF), followed by pasteurization at 72°C. The micro-filtered and pasteurized samples were then stored at 4, 10, and 25°C. Control = pasteurized skim milk; P = permeate; R = retentate; PP = pasteurized permeate; PR = pasteurized retentate. Means with differ-ent lowercase letters are significantly different (P < 0.05).
4290 TOMASULA ET AL.
Journal of Dairy Science Vol. 94 No. 9, 2011
count (P > 0.05) was not observed for the samples drawn after 120 min of MF after 9 d of storage (Figure 8c); 1.94 ± 0.00 log10 BA spores/mL persisted in the pasteurized permeates.
The pasteurized retentates drawn at 120 min of MF at d 0 showed an increase (P < 0.05) in spore numbers relative to the unpasteurized samples possibly due to heat shocking, but showed no outgrowth or decrease in the number of spores over the rest of the 28-d stor-age period at 4°C. The pH declined to 6.00 by 14 d of storage. The samples drawn at 10 and 30 min of MF, respectively, also remained stable up to 14 d of storage. For the retentates stored at 10°C, the samples drawn at 10, 30, and 120 min of MF showed no significant outgrowth of spores (P > 0.05) over the entire 12 d of storage. Overall, pasteurization that was shown to increase BA in the permeate samples did not increase (P > 0.05) the numbers of spores in the retentates. Also, the pasteurized retentate samples stored at 4°C exhibited a 28-d shelf life compared with the pasteur-ized controls, which were stable in storage only up to 14 d. This result was not expected but the retentate and permeate streams were returned to the feed ves-sel throughout MF. The membrane may have retained some of the smaller-sized bacteria in milk, which would serve to decrease the number of spoilage bacteria in the retentate samples. Also, destruction of somatic cells by MF is a possibility due to the shear forces acting on the cells during MF (Elwell and Barbano, 2006).
Analysis of covariance was performed at each tem-perature to determine the effects of time of storage and duration of MF on the pasteurized and unpasteurized permeate and retentate samples. The resulting linear regressions confirmed that no significant effects due to the length of storage occurred. Duration of MF exhib-ited marked differences (P < 0.05) for the pasteurized permeate responses compared with the unpasteurized permeate responses. The same effects did not appear for the retentate.
Further work is needed to conduct MF at different CFV and TMP and under various volume reduction ratios for testing the full effects of use of the 0.8-μm membrane on milk composition, quality, and spore reduction for scale-up and commercial applications, and to conduct economic studies. Studies focusing on the effect of MF on spore germination and inactivation through pasteurization and storage of other Bacillus strains such as Bacillus cereus would be of interest be-cause vegetative cells of some strains persist and grow at refrigeration temperatures.
CONCLUSIONSIn this study, crossflow MF conducted using a ce-
ramic membrane with an average pore size of 0.8 μm
was found to be more effective than a 1.4-μm ceramic membrane for removing spores of BA from milk. When conducted under subcritical operating conditions, which emphasized the size-exclusion properties of the membranes, microfiltration using a 0.8-μm membrane significantly decreased BA spores inoculated into milk by at least 5.91 ± 0.05 log10 BA spores/mL of milk, whereas the 1.4-μm membrane decreased the amount of spores by 4.50 ± 0.35 log10 BA spores/mL of milk. However, only the 1.4-μm membrane demonstrated complete transmission of CN. Our findings confirm that MF before HTST pasteurization is more effective than pasteurization alone in preserving milk. Although this study showed that MF may cause spores to germinate, an excessive number of BA spores/mL of milk were used to examine the effect of MF as an intervention to pasteurization, and long MF times were used. In practical use, this process has the potential to serve as a nonthermal intervention to HTST pasteurization to ensure the safety and quality of milk.
ACKNOWLEDGMENTS
The authors thank John Phillips, Area Statistician for the North Atlantic Area, USDA/ARS/ERRC; James Shieh for assistance with the protein analyses; and Raymond Kwoczak, John Mulherin, Matthew Toht, and Brad Shoyer for their technical assistance, all with USDA/ARS/ERRC (Wyndmoor, PA).
REFERENCES
AOAC. 2010a. Official method 991.20. Nitrogen (Total) in Milk. Of-ficial Methods of Analysis of AOAC International. 18th rev. ed. Association of Analytical Communities International, Washington, DC.
AOAC. 2010b. Official method 998.05. Noncasein Nitrogen Content of Milk. Official Methods of Analysis of AOAC International. 18th rev. ed. Association of Analytical Communities International, Washington, DC.
Bacchin, P., P. Aimar, and R. W. Field. 2006. Critical and sustain-able fluxes: Theory, experiments and applications. J. Membr. Sci. 281:42–69.
Baltus, R. E., A. R. Badireddy, W. Xu, and S. Chellam. 2009. Analysis of configurational effects on hindered convection of nonspherical bacteria and viruses across microfiltration membranes. Ind. Eng. Chem. Res. 48:2404–2413.
Baruah, G. L., A. Nayak, and G. Belfort. 2006. Scale-up from labora-tory microfiltration to a ceramic pilot plant: Design and perfor-mance. J. Membr. Sci. 274:56–63.
Bowen, J. E., and P. C. B. Turnbull. 1992. The fate of Bacillus anthra-cis in unpasteurized and pasteurized milk. Lett. Appl. Microbiol. 15:224–227.
Brans, G., C. G. P. H. Schroën, R. G. M. van der Sman, and R. M. Boom. 2004. Membrane fractionation of milk: State of the art and challenges. J. Membr. Sci. 243:262–272.
Carrera, M., R. O. Zandomeni, J. Fitzgibbon, and J.-L. Sagripanti. 2007. Difference between the spore sizes of Bacillus anthracis and other Bacillus species. J. Appl. Microbiol. 102:303–312.
Chada, V. G. R., E. A. Sanstad, R. Wang, and A. Driks. 2003. Mor-phogenesis of Bacillus spore surfaces. J. Bacteriol. 185:6255–6261.
Journal of Dairy Science Vol. 94 No. 9, 2011
MICROFILTRATION OF MILK TO REMOVE SPORES 4291
Chen, V., A. G. Fane, S. Madaeni, and I. G. Wenten. 1997. Particle deposition during membrane filtration of colloids: Transition be-tween concentration polarization and cake formation. J. Membr. Sci. 125:109–122.
Cheryan, M. 1998. Ultrafiltration and Microfiltration Handbook. Technomic Publishing Co., Lancaster, PA.
Dixon, T. C., M. Meselson, J. Guillemin, and P. C. Hanna. 1999. An-thrax. N. Engl. J. Med. 341:815–826.
Elwell, M. W., and D. M. Barbano. 2006. Use of microfiltration to improve fluid milk quality. J. Dairy Sci. 89(E Suppl.):E20–E30.
Erickson, M. C., and J. L. Kornacki. 2003. Bacillus anthracis: Current knowledge in relation to contamination of food. J. Food Prot. 66:691–699.
FDA. 2009. Grade “A” Pasteurized Milk Ordinance. 21 CFR part 131.3. Milk and cream, definitions. 2009 rev. United States De-partment of Health and Human Services. United States Food and Drug Administration, Silver Spring, MD.
Field, R. W., D. Wu, J. A. Howell, and B. B. Gupta. 1995. Critical flux concept for microfiltration fouling. J. Membr. Sci. 100:259–272.
Fritsch, J., and C. I. Moraru. 2008. Development and optimization of a carbon dioxide-aided cold microfiltration process for the physical removal of microorganisms and somatic cells from skim milk. J. Dairy Sci. 91:3744–3760.
Gésan-Guiziou, G., E. Boyaval, and G. Daufin. 1999. Critical stability conditions in crossflow microfiltration of skimmed milk: transition to irreversible deposition . J. Membr. Sci. 158:211–222.
Guerra, A., G. Jonsson, A. Rasmussen, E. Waagner Nielsen, and D. Edelsten. 1997. Low cross-flow velocity microfiltration of skim milk for removal of bacterial spores. Int. Dairy J. 7:849–861.
Indest, K. J., W. G. Buchholz, J. R. Faeder, and P. Setlow. 2009. Workshop report: Modeling the molecular mechanism of bacterial spore germination and elucidating reasons for germination hetero-geneity. J. Food Sci. 74:R73–R78.
James, B. J., Y. Jing, and X. D. Chen. 2003. Membrane fouling dur-ing filtration of milk—A microstructural study. J. Food Eng. 60:431–437.
Jonsson, G. 1984. Boundary layer phenomena during ultrafiltration of dextran and whey protein solutions. Desalination 51:61–77.
Le Berre, O., and G. Daufin. 1996. Skimmilk crossflow microfiltration performance versus permeation flux to wall shear stress ratio. J. Membr. Sci. 117:261–270.
Malmberg, R., and S. Holm. 1988. Producing low bacteria skim milk by microfiltration. North Eur. Food Dairy J. 1:75–78.
Mansour, M., D. Amri, A. Bouttefroy, M. Linder, and J. B. Milliere. 1999. Inhibition of Bacillus licheniformis spore growth in milk by nisin, monolaurin, and pH combinations. J. Appl. Microbiol. 86:311–324.
Merin, U., and G. Daufin. 1990. Crossflow microfiltration in the dairy industry: State-of-the-art. Lait 70:281–291.
Murphy, P. M., D. Lynch, and P. M. Kelly. 1999. Growth of thermo-philic spore forming bacilli in milk during the manufacture of low heat powders. Int. J. Dairy Technol. 52:45–50.
Novak, J. S., J. E. Call, P. M. Tomasula, and J. B. Luchansky. 2005. An assessment of milk pasteurization with respect to spores from Bacillus anthracis (Sterne) and Bacillus cereus ATCC 9818. J. Food Prot. 68:751–757.
Pafylias, I., M. Cheryan, M. A. Mehaia, and N. Saglam. 1996. Mi-crofiltration of milk with ceramic membranes. Food Res. Int. 29:141–146.
Pedersen, P. J. 1991. Microfiltration for the reduction of bacteria in milk and brine. Pages 33–50 in New Applications of Membrane Processes. International Dairy Federation, Brussels, Belgium.
Perdue, M. L., J. Karns, J. Higgins, and J. A. Van Kessel. 2003. De-tection and fate of Bacillus anthracis (Sterne) vegetative cells and spores added to bulk tank milk. J. Food Prot. 66:2349–2354.
Saboya, L. V., and J.-L. Maubois. 2000. Current developments of mi-crofiltration technology in the dairy industry. Lait 80:541–553.
Sandblom, R. M. 1978. Filtering process. US Patent 4,105,547.Scott, S. A., J. D. Brooks, J. Rakonjac, K. M. R. Walter, and S. H.
Flint. 2007. The formation of thermophilic spores during the man-ufacture of whole milk powder. Int. J. Dairy Technol. 60:109–117.
Severson, K. M., M. Mallozzi, J. Bozue, S. L. Welkos, C. K. Cote, K. L. Knight, and A. Driks. 2009. Roles of the Bacillus anthracis spore protein ExsK in exosporium maturation and germination. J. Bacteriol. 191:7587–7596.
Steichen, C. T., J. F. Kearney, and C. L. Turnbough Jr. 2007. Non-uniform assembly of the Bacillus anthracis exosporium and a bottle cap model for spore germination and outgrowth. Mol. Mi-crobiol. 64:359–367.
Swartz, M. N. 2001. Recognition and management of anthrax—An update. N. Engl. J. Med. 345:1621–1626.
Tomasula, P. M., and M. F. Kozempel. 2004. Flow characteristics of a pilot-scale high temperature, short time pasteurizer. J. Dairy Sci. 87:2761–2768.
Trouvé, E., J. L. Maubois, M. Piot, M. N. Madec, J. Fauquant, A. Rouault, J. Tabard, and G. Brinkman. 1991. Rétention de différen-tes espèces microbiennes lors de l’épuration du lait par microfiltra-tion en flux tangentiel. Lait 71:1–13.
van der Horst, H. C., and J. H. Hanemaaijer. 1990. Cross-flow mi-crofiltration in the food industry. State of the art. Desalination 77:235–258.
Van Opstal, I., C. F. Bagamboula, S. C. M. Vanmuysen, E. Y. Wuy-tack, and C. W. Michiels. 2004. Inactivation of Bacillus cereus spores in milk by mild pressure and heat treatments. Int. J. Food Microbiol. 92:227–234.
Velasco, C., M. Ouammou, J. I. Calvo, and A. Hernández. 2003. Pro-tein fouling in microfiltration: Deposition mechanism as a function of pressure for different pH. J. Colloid Interface Sci. 266:148–152.
Xu, S., T. P. Labuza, and F. Diez-Gonzalez. 2006. Thermal inactiva-tion of Bacillus anthracis spores in cow’s milk. Appl. Environ. Microbiol. 72:4479–4483.
Zeman, L. J., and A. L. Zydney. 1996. Microfiltration and Ultrafiltra-tion. Marcel Dekker Inc., New York, NY.


![Soluble Expression of (+)-γ-Lactamase in Bacillus subtilis for ...biocat.jiangnan.edu.cn/__local/7/B9/F1/D4E9D1AA92C53F...[3]. While (−)-γ-lactam can be applied in the synthesis](https://static.fdocument.org/doc/165x107/60d7f4c9fffa135fc614cee2/soluble-expression-of-lactamase-in-bacillus-subtilis-for-3-while.jpg)