Spectroscopic features of Ni 2+ ions in tellurite-arsenate...
44
20ZnF 2 –30As 2 O 3 –(50-x)TeO 2 : xNiO (0 ≤ x ≤ 2.0) glasses were synthesized. The glasses were characterized by X-ray diffraction, scanning electron microscopy, EDS and DSC techniques. A variety of properties, i.e. optical absorption, infrared, magnetic susceptibilities and dielectric properties (constant ε ′, loss tan δ, ac conductivity σ ac over a wide range of frequency and temperature) of these glasses have been carried out. The analysis of results of all these studies has indicated that the nickel ions occupy both octahedral and tetrahedral positions and the gradual increase of NiO content in the glass matrix causes a growing proportions of Ni 2+ ions that occupy octahedral positions. The luminescence spectra of these glasses have exhibited a broad emission band in region 1200–1450 nm identified due to 3 T 2 (3F)→ 3 A 2 (3F) octahedral transition of Ni 2+ ions. The luminescence efficiency and cross section have been found to be the highest for the glass containing highest concentration of NiO. Finally it is concluded that higher the concentration of octahedrally positioned Ni 2+ ions, higher is the luminescence efficiency and such glasses may be useful for broad band optical amplifiers in NIR region. Chapter 4 Spectroscopic features of Ni 2+ ions in tellurite-arsenate glass system
Transcript of Spectroscopic features of Ni 2+ ions in tellurite-arsenate...
20ZnF2–30As2O3–(50-x)TeO2: xNiO (0 ≤ x ≤ 2.0) glasses were synthesized. The
glasses were characterized by X-ray diffraction, scanning electron microscopy, EDS
and DSC techniques. A variety of properties, i.e. optical absorption, infrared,
magnetic susceptibilities and dielectric properties (constant ε ′, loss tan δ, ac
conductivity σac over a wide range of frequency and temperature) of these glasses
have been carried out. The analysis of results of all these studies has indicated that
the nickel ions occupy both octahedral and tetrahedral positions and the gradual
increase of NiO content in the glass matrix causes a growing proportions of Ni2+
ions
that occupy octahedral positions. The luminescence spectra of these glasses have
exhibited a broad emission band in region 1200–1450 nm identified due to
3T2(3F)→
3A2(3F) octahedral transition of Ni
2+ ions. The luminescence efficiency and
cross section have been found to be the highest for the glass containing highest
concentration of NiO. Finally it is concluded that higher the concentration of
octahedrally positioned Ni2+
ions, higher is the luminescence efficiency and such
glasses may be useful for broad band optical amplifiers in NIR region.
Chapter 4
Spectroscopic features of Ni2+ ions in
tellurite-arsenate glass system
150
Spectroscopic features of Ni2+
ions in tellurite-arsenate
glass system 4.1. Introduction
Now–a–days, intense investigations are being carried out for the
development of the materials suitable for ultra broad band optical amplifiers to
revolutionize the telecommunication systems. Though, the rare earth ions
doped glasses were considered as the suitable candidates for such applications,
the optical amplification band width in these materials is very low since the
emission bands of 4f–4f transition of the rare earth ions are very narrow. In
view of this, large number of investigations are being carried out for exploring
possibility of lasing emission by the transition metal oxides of Ti, Cr, Mn, V,
Ni, Mo etc. in various glass matrices [1–5]. Among these, Cr4+ ions containing
glasses have been used as potential candidates for high gain optical amplifiers
with larger bandwidths in glass materials; nevertheless, the chromium ions
exist in multi valent states, viz., Cr3+, Cr4+, Cr5+ and Cr6+ . The same is true in
case of other transition metal ions like Ti, Mn, V. Hence, it is too difficult to
have the strict control over the required or suitable valence state of these ions
in the glass matrix to get the luminescence. Unlike these ions, the nickel ions
mostly exist in divalent state and are extremely stable and there is no need of
any special care in experimentation in retaining nickel ions in divalent state.
Ni2+ ions exhibit several strong absorption bands in the visible and NIR regions
151
where the pumping sources are easily available. The octahedrally positioned
Ni2+ ions in glass network are expected to exhibit eye safe laser emission of
wavelength at about 1.5 µm due to 3T2→3A2 transition even at room
temperature, this transition is of great importance in telecommunications [6].
There have been considerable recent studies on lasing action of nickel ions in
various glass and glass ceramic materials [7, 8]. As described above tellurium
arsenate glass network offers a highly suitable environment for hosting the
lasing nickel ions. Thus this chapter is devoted mainly to throw some light on
the emission characteristics of nickel ions in the IR region in ZnF2–As2O3–
TeO2 glass system. The studies undertaken are, optical absorption, IR and
photoluminescence after the characterization of the glasses by X–ray
diffraction, energy dispersive spectroscopy and thermal analysis. The magnetic
and dielectric studies are also taken up to have some additional information on
the environment of the nickel ions in the glass matrix.
4.2 Brief review of the studies on glasses containing nickel ion
In this review a brief report on the glasses containing nickel ion including
some tellurite glasses has been presented.
Souri and Salehizadeh [9] have investigated the effect of NiO content on
the optical band gap, refractive index, and density of TeO2-V2O5-NiO glasses.
These results have indicated that the values of optical band gap decrease from
2.02 to 1.64 eV and the static refractive index increase from 1.309 to 1.673 as
152
the NiO content increases in the glass matrix. Moustaffa et al. [10] have
investigated ultraviolet and visible absorption of some sodium and potassium
silicate glasses containing nickel oxide, ferric oxide or both nickel and ferric
oxides. These studies have revealed no ultraviolet absorption bands but showed
characteristic visible absorption bands due to octahedral and tetrahedral
coordinations. The analysis of these results has indicated that the proportion of
tetrahedral units increases with the increase in the alkali oxide content. Kumar
et al. [11] have studied the effect of NiO on the phase formation, thermo-
physical properties and sealing behaviour of lithium zinc silicate glass-
ceramics. This study has indicated that the addition of NiO favoured inter-
diffusion of species at the interface leading to better sealing. Prasad et al. [12]
have investigated the influence of nickel ions on dielectric and other physical
properties of PbO-MoO3-B2O3 glass system. In this study it was reported that
there is an increase in the rigidity and the dielectric breakdown strength of this
glass system when the concentration of NiO is around 0.6 mol %. Bao et al.
[13] have reported luminescence properties of nickel and bismuth co-doped
barium aluminosilicate glasses. In this study the authors have observed visible
luminescence at about 425 nm and broadband infrared luminescence at about
1330 nm when excited by ultraviolet light and 808 nm laser diode,
respectively. The intensity of the two emission bands were found to decrease
with increasing NiO concentration. The mechanisms of the observed
153
phenomena were discussed in detail. Kusatsugu et al. [14] have synthesized
oxyfluoride glass ceramics with a small amount of NiO by spatially selected
crystallization by irradiations of continuous wave lasers with a wavelength of
λ=1064 or 1080 nm. From this study it was concluded that a combination of
Ni2+ dopings and laser irradiations is effective in spatially selected local
crystallizations of fluorides in oxyfluoride glasses.
Wang and Liang [15] have reported crystallization behavior and infrared
radiation property of nickel-magnesium cordierite based glass-ceramics by
means of differential thermal analysis, X-ray diffraction and scanning electron
microscopy. The infrared radiation property of this material was examined via
the measurement of the whole-band normal direction emissivity. The results
demonstrated that the adding of NiO can suppress the precipitation of µ-
cordierite and promote the crystallization of α-cordierite in MgO-Al2O3-SiO2
glasses. Sato et al. [16] have prepared some NiO-doped Bi2O3,La2O3-SrO-
BaO-Nb2O5-B2O3 glasses and SBN crystal lines have been patterned on the
glass surface by heat-assisted laser irradiation and scanning of continuous-
wave Nd:YAG laser. This study demonstrated that a combination of Nd:YAG
laser and Ni2+ ions is a novel technique for spatially selected crystallization of
SBN crystals in the glass. Wu et al. [17] have reported broadband infrared
luminescence centered at 1310 nm with full width at half maximum of about
300 nm in Ni2+- doped ZnO-Al2O3-SiO2 system glass-ceramics. The peak
154
position of the infrared luminescence showed a blue-shift with increasing heat-
treatment temperature, but a red-shift with an increase in NiO concentration.
The mechanisms of the observed phenomena were discussed and concluded
that these glass-ceramics are promising as materials for super broadband
optical amplifier and tunable laser. Mejia-Ramirez et al. [18] have investigated
the structural behavior of nickel oxide in Na2O-CaO-MgO-Fe2O3-Al2O3-SiO2
glassy and glass-ceramic materials. In this study it was shown that NiO
promoted the formation of bunsenite crystals, as nuclei for crystallization. It
was also reported that NiO promoted formation of pyroxenes even for
compositions with low MgO contents, which formed gehlenite without NiO
admixtures. Suzuki et al. [19] have investigated the crystallization processes of
Li2O-Ga2O3-SiO2-NiO glass system. In this study it was reported that
transparent glass-ceramic containing LiGa5O8:Ni2+ as the sole crystalline phase
was obtained from glass with the composition of 13Li2O-23Ga2O3-64SiO2-
0.1NiO (in mol%) by the heat treatment in the temperature range from 923 to
953 K. Optical absorption measurements on these glasses have revealed that
doped Ni2+ occupied five-folded trigonal bipyramidal sites in the as-quenched
glass matrices but six-folded octahedral sites of precipitated LiGa5O8 in the
glass-ceramics. These authors have also reported [20] broadband near-infrared
emission in the wavelength region from 1100 nm to 1600 nm, attributed to
3T2g→3A2g transition of octahedral Ni2+. The emission lifetime was measured at
155
more than 900 µsec at 5 K and 500 µsec even at 300 K. The emission quantum
efficiency was measured by using an integration sphere. It was about 9.1 %,
which is enough high as a practical gain medium.
Brendeback et al. [21] investigated the effect of NiO dopant
concentration in sodium metaphosphate glasses by means of X-ray absorption
fine structure and UV/VIS/NIR spectroscopic investigations. Schlenz et al.
[22] have carried out high energy X-ray diffraction studies on Ni doped sodium
metaphosphate glasses. From these studies they have evaluated the average Ni-
O distance as 2.03 Ao and the coordination of the nickel ion as in the glass
network as 6.0. Rao et al. [23] reported the optical absorption and
thermoluminescence properties of antimony borate glasses doped with NiO.
The results were analyzed in the light of different environments of nickel ions.
Tawati and Adlan [24] have recently reported thermoelectric power of
semiconducting cobalt phosphate glasses mixed with nickel oxide. These
investigations have provided the information on the polaron formation and the
disorder energy due to random fields in the glass matrix. Kundu and
Chakravorty [25] have investigated nickel the structural properties of titania glasses
and concluded that the glass structure is built up by cross linking of NiO3
triangular units with TiO6 octahedron. Singh and Singh [26] reported
thermodynamic activity of nickel oxide in alkali silicate glasses and found that
the activity coefficient of nickel oxide decreases with temperature. El-Desoky
156
et al. [27] have studied magnetic and electrical properties of lithium borosilicate
glasses containing nickel oxide. Rajendran et al. [28] have reported the
propagation of ultrasonic waves in nickel doped calcium aluminoborate glasses.
Shibata et al. [29] have reported studies of NiO dissolved alkali silicate glasses
based on redox potential and visible absorption spectra. From the studies they
have concluded that the Ni2+ ions exist in tetrahedral and octahedral
coordinations in these glasses. The studies also revealed that the relative ratio
of tetrahedral to octahedral species of Ni2+ depends on the concentration of
NiO. Musinu and Piccaluga [30] have investigated the environment of nickel
ions in alkali phosphate glasses by X-ray diffraction and determined the
coordination of nickel ions.
Corrias et al. [31] have studied the structure of nickel phosphate glasses by
neutron scattering with isotropic substitution for nickel. Kashif et al. [32] have
studied the structure and magnetic susceptibility of sodium borate glasses
containing nickel oxide. Khalifa et al. [33] have investigated the effect of
duration of melting on the absorption spectra, molar volume and refractive index
of nickel containing glasses. Rao et al. [34] have studied optical absorption
spectra of Ni2+ ions in lead acetate glasses and interpreted the absorption bands
in terms of ligand field theory. Baiocchi et al. [35] have studied optical and
magnetic properties of nickel ions in lead silicate glasses; they have found that
Ni2+ ions are both four fold and six fold coordinated in the glasses. They have
157
assigned the bands observed in the optical absorption spectrum to the
corresponding transitions on the basis of ligand field calculations. Paul and
Tiwari [36] from their studies on Ni2+ ions in silicate glasses have concluded
that Ni2+ can behave as network formers in the right conditions of temperature
and composition.
In spite of this literature, still there is a lot of scope to investigate the influence
of nickel ions on physical properties of ZnF2–As2O3–TeO2 glass system.
4.3 Results
For the present study, a particular composition 20ZnF2–30As2O3–(50-x)TeO2:
xNiO (with x ranging from 0 to 2.0) is chosen. The details of the composition
are:
N0:20ZnF2–30As2O3–50TeO2
N2:20ZnF2–30As2O3–49.8TeO2:0.2NiO
N4:20ZnF2–30As2O3–49.6TeO2:0.4NiO
N6:20ZnF2–30As2O3–49.4TeO2:0.6NiO
N8:20ZnF2–30As2O3–49.2TeO2:0.8NiO
N10:20ZnF2–30As2O3–49.0TeO2:1.0NiO
N15:20ZnF2–30As2O3–48.5TeO2:1.5NiO
N20:20ZnF2–30As2O3–48.0TeO2:2.0NiO
158
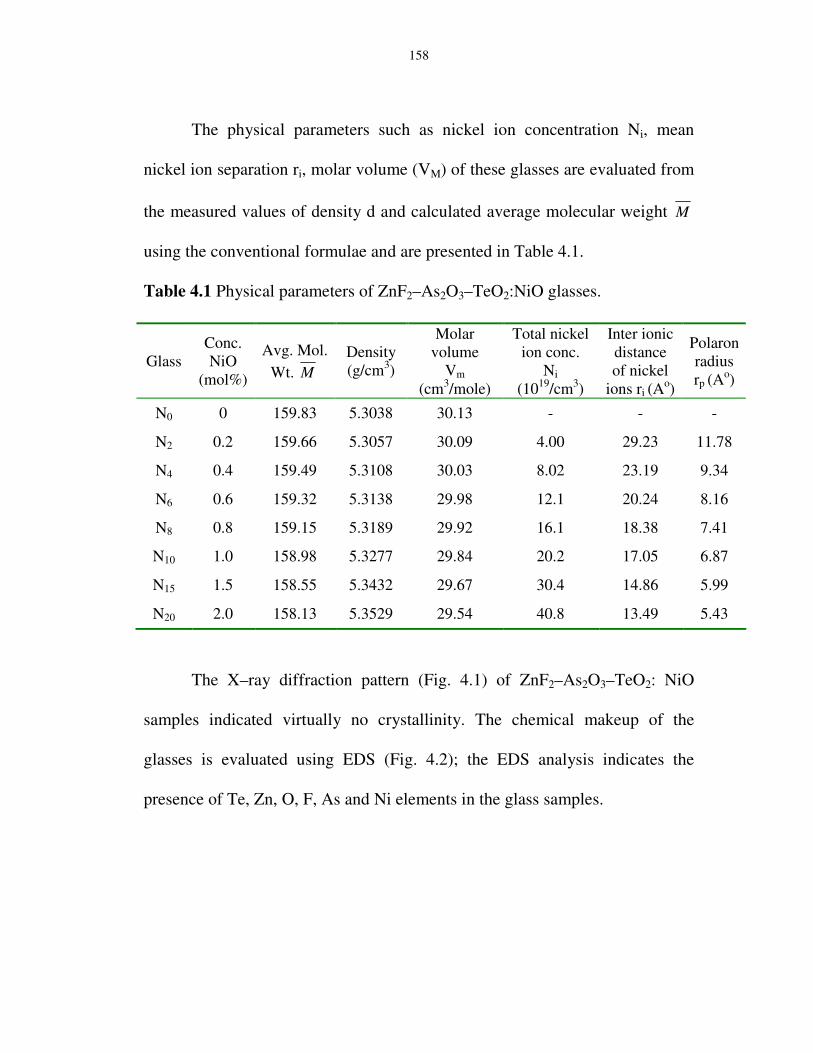
The physical parameters such as nickel ion concentration Ni, mean
nickel ion separation ri, molar volume (VM) of these glasses are evaluated from
the measured values of density d and calculated average molecular weight M
using the conventional formulae and are presented in Table 4.1.
Table 4.1 Physical parameters of ZnF2–As2O3–TeO2:NiO glasses.
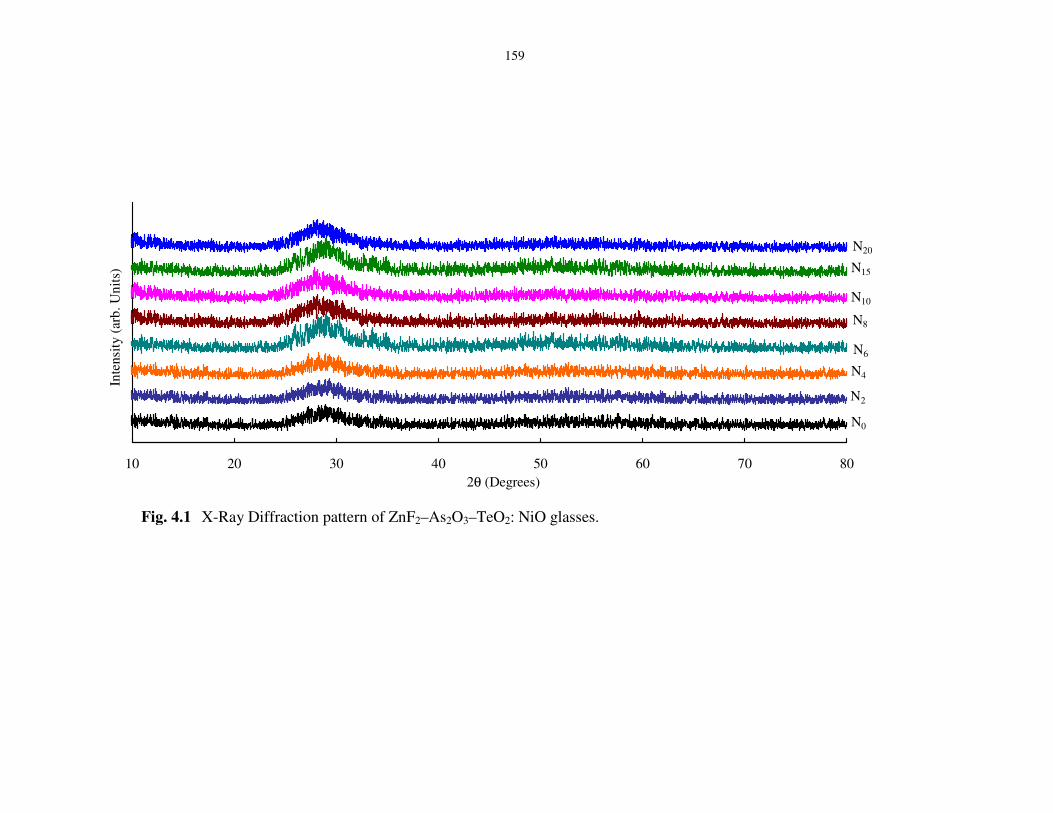
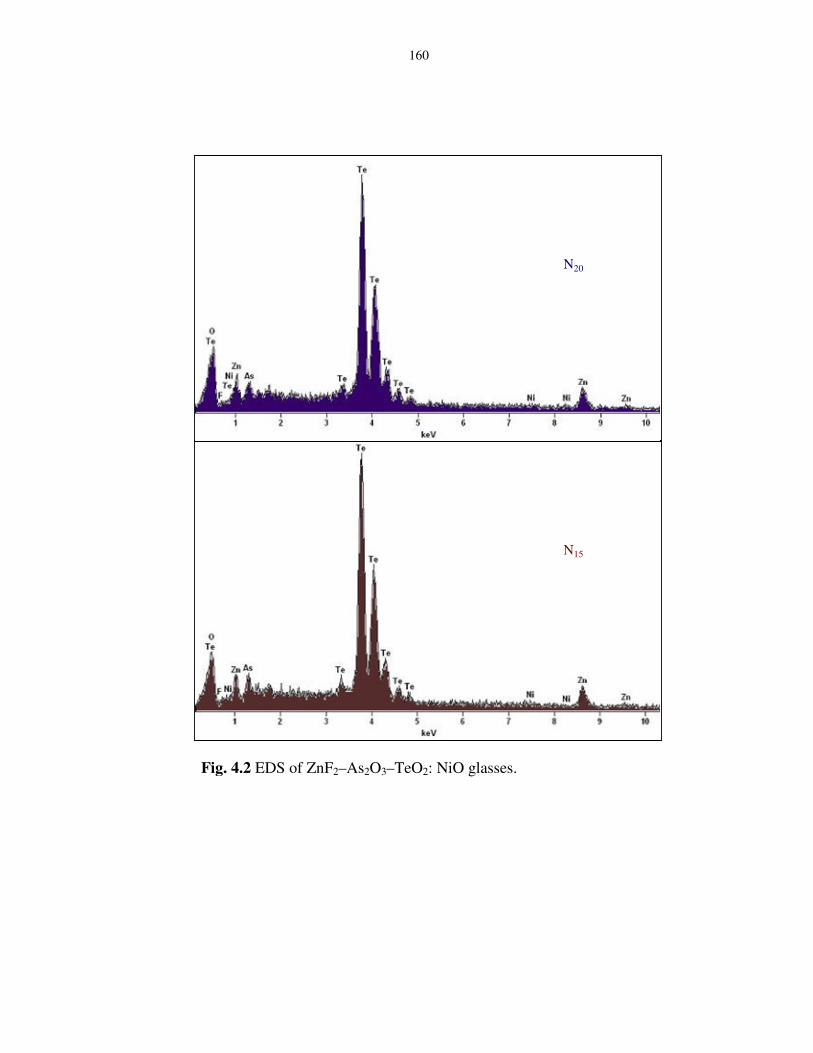
The X–ray diffraction pattern (Fig. 4.1) of ZnF2–As2O3–TeO2: NiO
samples indicated virtually no crystallinity. The chemical makeup of the
glasses is evaluated using EDS (Fig. 4.2); the EDS analysis indicates the
presence of Te, Zn, O, F, As and Ni elements in the glass samples.
Glass Conc. NiO
(mol%)
Avg. Mol. Wt. M
Density (g/cm3)
Molar volume
Vm (cm3/mole)
Total nickel ion conc.
Ni (1019/cm3)
Inter ionic distance of nickel
ions ri (Ao)
Polaron radius rp (A
o)
N0 0 159.83 5.3038 30.13 - - -
N2 0.2 159.66 5.3057 30.09 4.00 29.23 11.78
N4 0.4 159.49 5.3108 30.03 8.02 23.19 9.34
N6 0.6 159.32 5.3138 29.98 12.1 20.24 8.16
N8 0.8 159.15 5.3189 29.92 16.1 18.38 7.41
N10 1.0 158.98 5.3277 29.84 20.2 17.05 6.87
N15 1.5 158.55 5.3432 29.67 30.4 14.86 5.99
N20 2.0 158.13 5.3529 29.54 40.8 13.49 5.43
159
10 20 30 40 50 60 70 802θ (Degrees)
Inte
nsity
(ar
b. U
nits
)
N0
N20
N8
N6
N4
N2
N10
N15
Fig. 4.1 X-Ray Diffraction pattern of ZnF2–As2O3–TeO2: NiO glasses.
160
N15
N20
Fig. 4.2 EDS of ZnF2–As2O3–TeO2: NiO glasses.
161
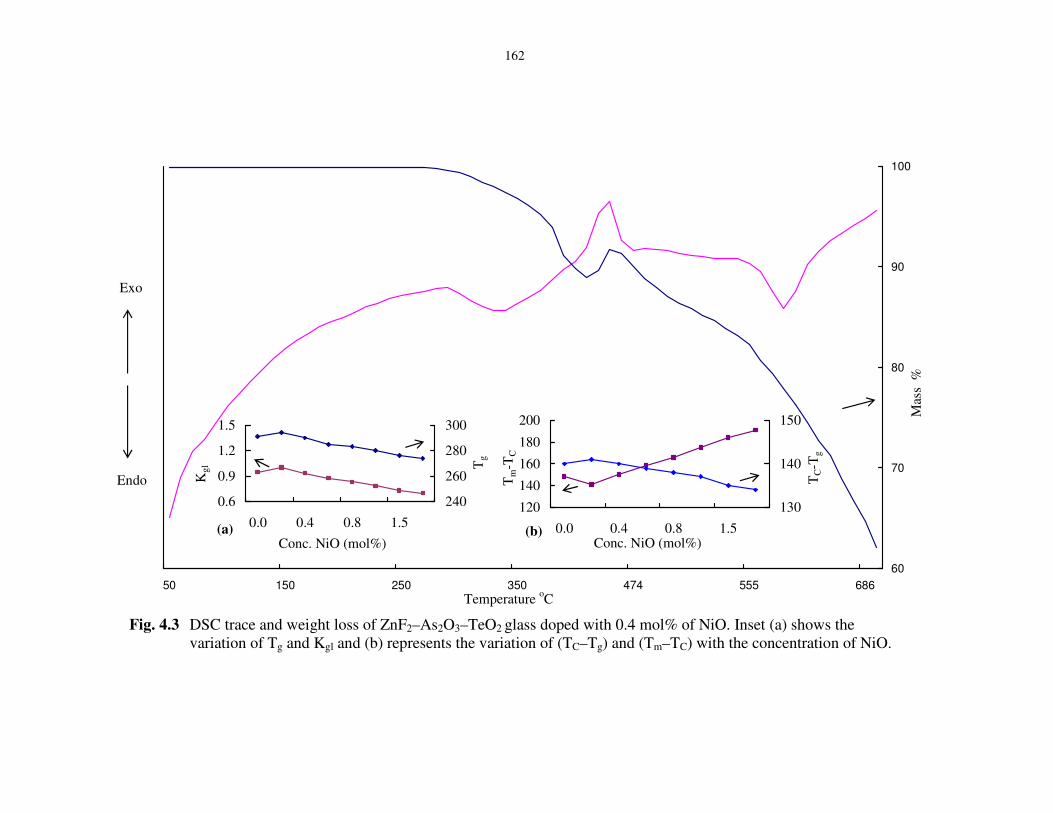
Fig. 4.3 represents differential scanning calorimetric (DSC) scan of
ZnF2–As2O3–TeO2 glass doped with 0.4 mol% NiO. The trace has exhibited an
endothermic effect due to glass transition at about 290 oC followed by a well–
defined exothermic effect due to crystallization temperature (TC). The trace
also exhibited another endothermic effect due to melting temperature at 580
oC. The DSC scans for other glasses have exhibited the similar behaviour. The
variation of glass transition temperature (Tg), (TC–Tg), (Tm–TC) and glass
forming ability parameter (Kgl) with concentration of NiO are shown as insets
of Fig. 4.3. These parameters have been observed to decrease with the
concentration of NiO (Table 4.2). To observe the mass change effects during
heating process, we have also recorded thermal gravimetric traces for all the
samples; in Fig. 4.3, TG trace for one of the glasses (N4) is shown. The trace
predicts that decomposition process involves three successive steps. First,
decreasing mass of samples (mass reduction temperature onset), second
increasing of mass up to mass increase temperature peak and rapid mass
lowering to residual mass; the mass increasing peak is well corresponding with
crystallization peak. The TGA traces for other glasses found to exhibit similar
behaviour.
162
50 150 250 350 474 555 686
60
70
80
90
100
0.6
0.9
1.2
1.5
0.0 0.4 0.8 1.5
240
260
280
300
Kgl T
g
Conc. NiO (mol%)(a)
120
140
160
180
200
0.0 0.4 0.8 1.5
130
140
150
TC-T
g
Tm
-TC
Conc. NiO (mol%)(b)
Endo
Exo
Temperature oC
Mas
s %
Fig. 4.3 DSC trace and weight loss of ZnF2–As2O3–TeO2 glass doped with 0.4 mol% of NiO. Inset (a) shows the variation of Tg and Kgl and (b) represents the variation of (TC–Tg) and (Tm–TC) with the concentration of NiO.
163
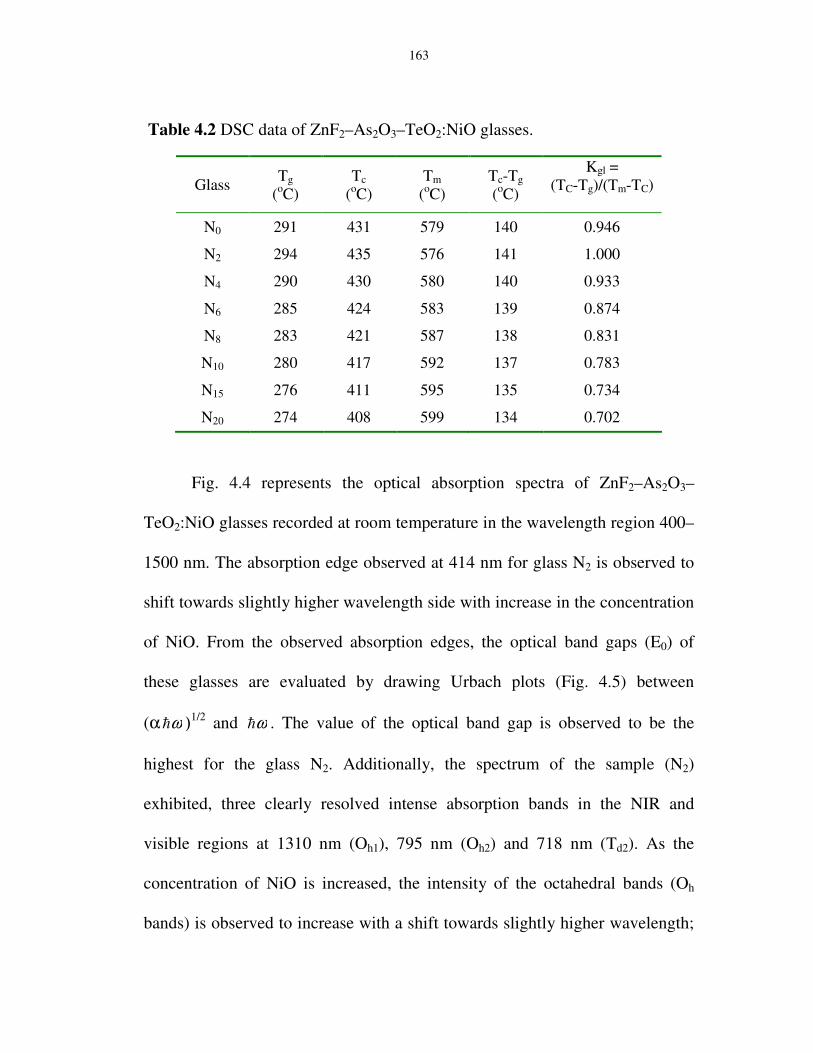
Table 4.2 DSC data of ZnF2–As2O3–TeO2:NiO glasses.
Glass Tg
(oC) Tc
(oC) Tm
(oC) Tc-Tg (oC)
Kgl = (TC-Tg)/(Tm-TC)
N0 291 431 579 140 0.946
N2 294 435 576 141 1.000
N4 290 430 580 140 0.933
N6 285 424 583 139 0.874
N8 283 421 587 138 0.831
N10 280 417 592 137 0.783
N15 276 411 595 135 0.734
N20 274 408 599 134 0.702
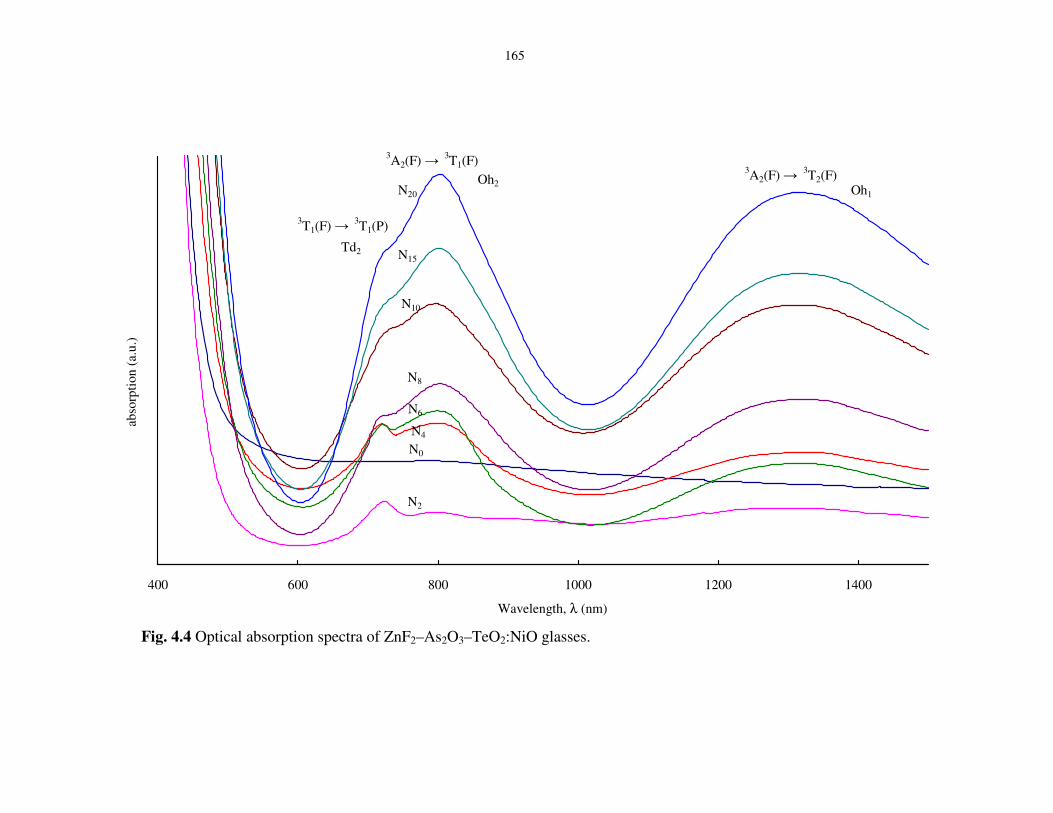
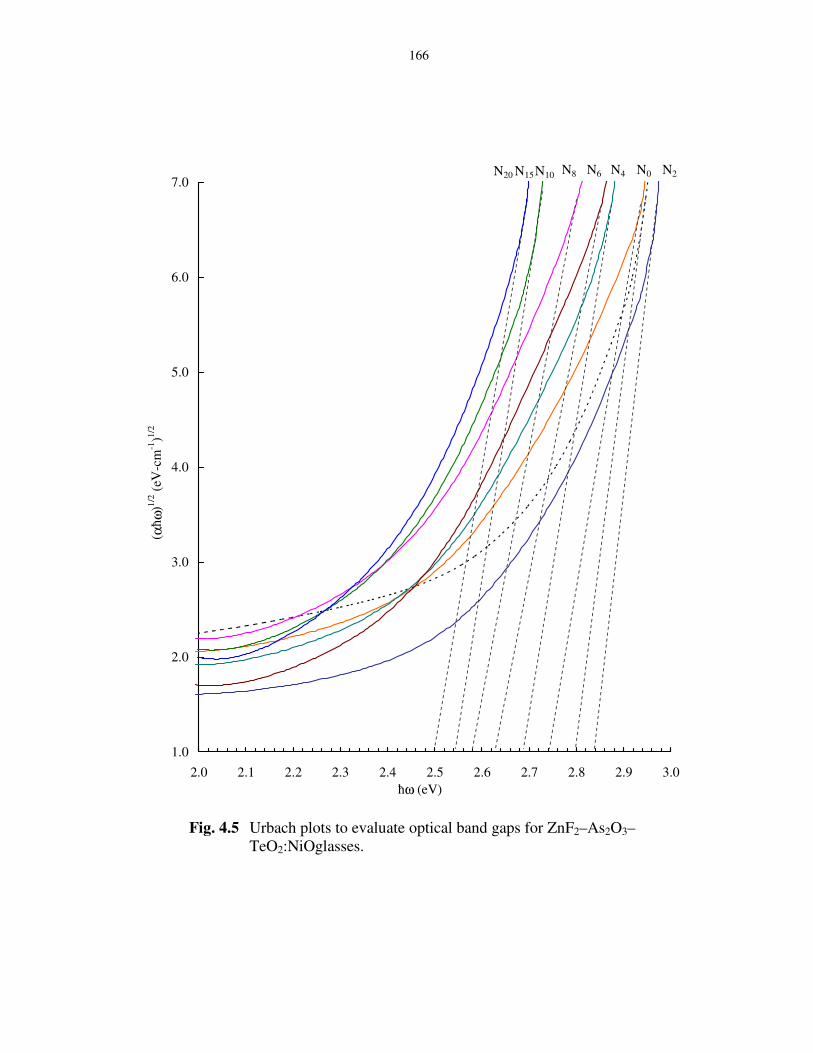
Fig. 4.4 represents the optical absorption spectra of ZnF2–As2O3–
TeO2:NiO glasses recorded at room temperature in the wavelength region 400–
1500 nm. The absorption edge observed at 414 nm for glass N2 is observed to
shift towards slightly higher wavelength side with increase in the concentration
of NiO. From the observed absorption edges, the optical band gaps (E0) of
these glasses are evaluated by drawing Urbach plots (Fig. 4.5) between
(α ωh )1/2 and ωh . The value of the optical band gap is observed to be the
highest for the glass N2. Additionally, the spectrum of the sample (N2)
exhibited, three clearly resolved intense absorption bands in the NIR and
visible regions at 1310 nm (Oh1), 795 nm (Oh2) and 718 nm (Td2). As the
concentration of NiO is increased, the intensity of the octahedral bands (Oh
bands) is observed to increase with a shift towards slightly higher wavelength;
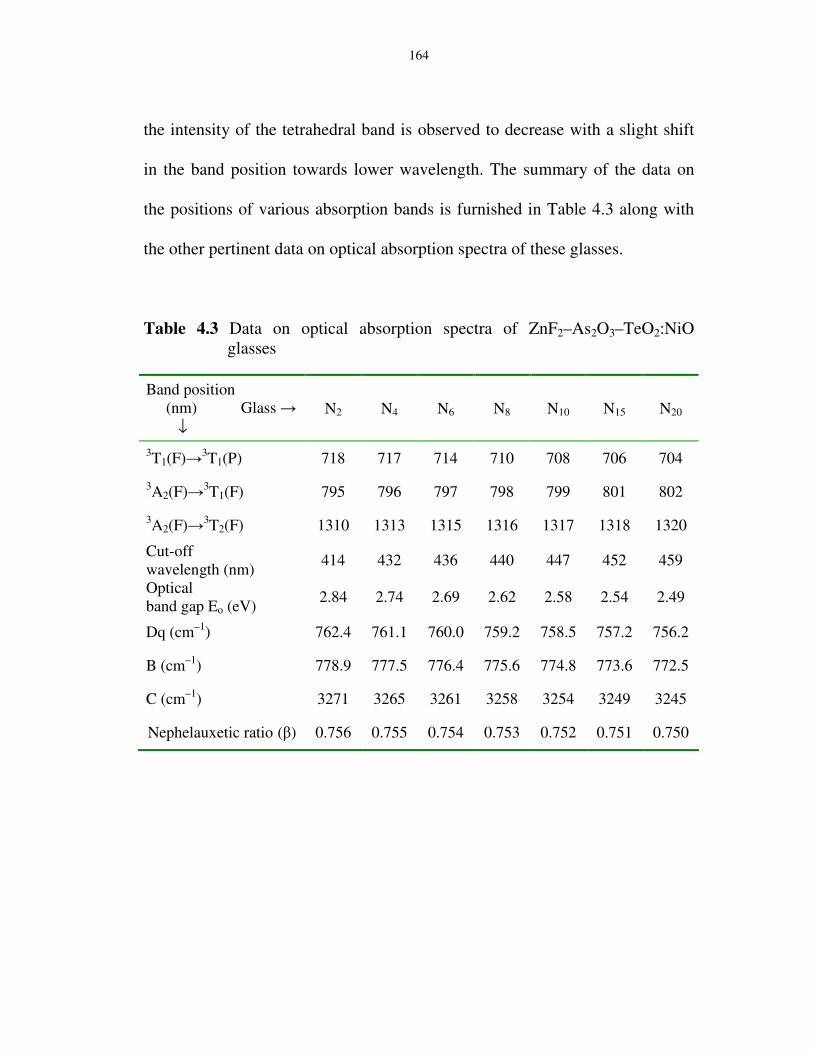
164
the intensity of the tetrahedral band is observed to decrease with a slight shift
in the band position towards lower wavelength. The summary of the data on
the positions of various absorption bands is furnished in Table 4.3 along with
the other pertinent data on optical absorption spectra of these glasses.
Table 4.3 Data on optical absorption spectra of ZnF2–As2O3–TeO2:NiO glasses
Band position (nm) Glass → ↓
N2 N4 N6 N8 N10 N15 N20
3T1(F)→3T1(P) 718 717 714 710 708 706 704
3A2(F)→3T1(F) 795 796 797 798 799 801 802
3A2(F)→3T2(F) 1310 1313 1315 1316 1317 1318 1320
Cut-off wavelength (nm)
414 432 436 440 447 452 459
Optical band gap Eo (eV)
2.84 2.74 2.69 2.62 2.58 2.54 2.49
Dq (cm–1) 762.4 761.1 760.0 759.2 758.5 757.2 756.2
B (cm–1) 778.9 777.5 776.4 775.6 774.8 773.6 772.5
C (cm–1) 3271 3265 3261 3258 3254 3249 3245
Nephelauxetic ratio (β) 0.756 0.755 0.754 0.753 0.752 0.751 0.750
165
400 600 800 1000 1200 1400
abso
rptio
n (a
.u.)
Wavelength, λ (nm)
N0
N2
N4
N6
N8
N10
Oh2
Td2
3T1(F) → 3T1(P)
3A2(F) → 3T2(F)Oh1N20
N15
3A2(F) → 3T1(F)
Fig. 4.4 Optical absorption spectra of ZnF2–As2O3–TeO2:NiO glasses.
166
1.0
2.0
3.0
4.0
5.0
6.0
7.0
2.0 2.1 2.2 2.3 2.4 2.5 2.6 2.7 2.8 2.9 3.0
N0 N2N4N6N8N10N20 N15
ħω (eV)
( αħ
ω)1/
2 (eV
-cm
-1)1/
2
Fig. 4.5 Urbach plots to evaluate optical band gaps for ZnF2–As2O3–TeO2:NiOglasses.
167
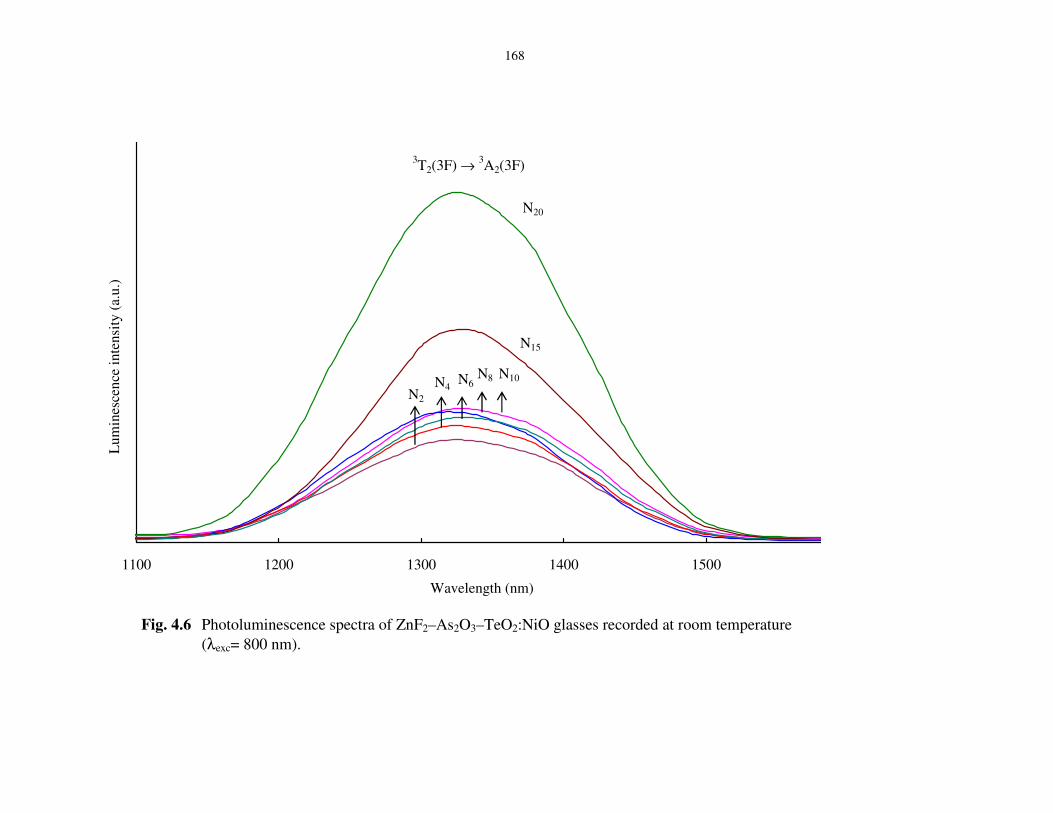
Fig. 4.6 shows the photoluminescence spectra of ZnF2–As2O3–TeO2: NiO
glasses recorded at room temperature with the excitation wavelength of 800
nm. The spectrum of each glass exhibited a broad emission band in the region
1200–1450 nm; this band is identified due to 3T2(3F)→3A2(3F) transition of
nickel ion. With the increasing content of nickel ions in the glass matrix, the
half width of the band is observed to increase with a shift of the peak position
towards slightly higher wavelength (Table 4.4).
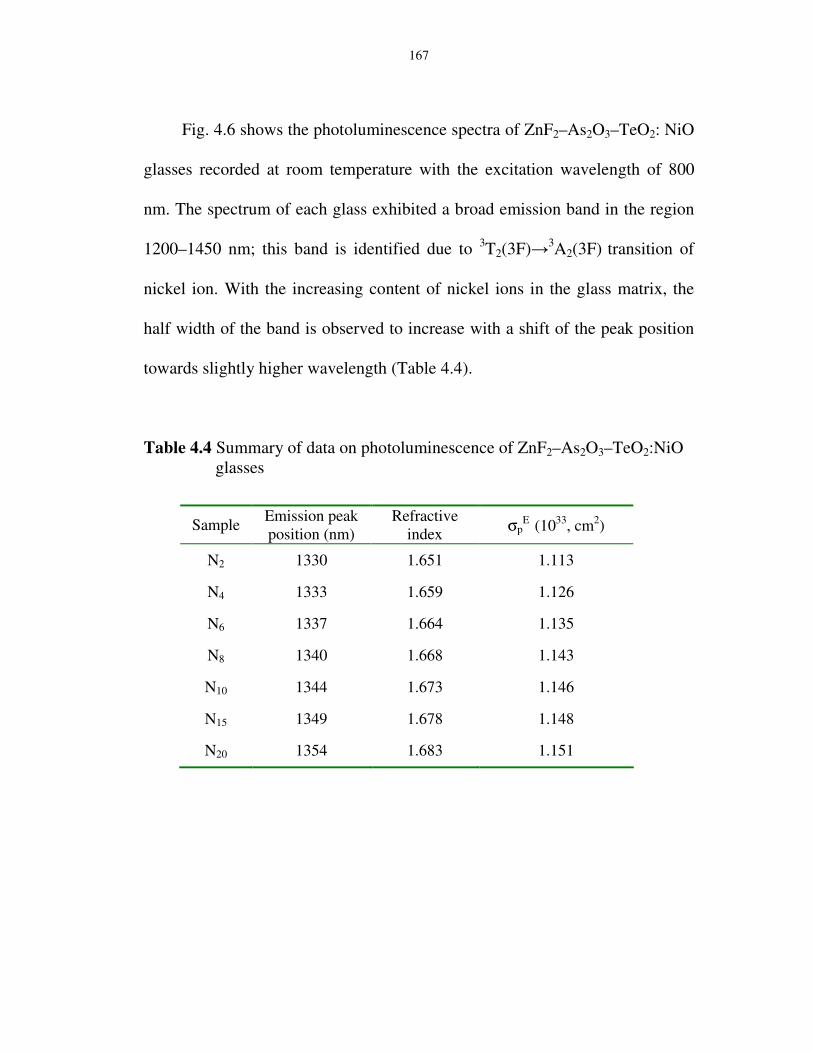
Table 4.4 Summary of data on photoluminescence of ZnF2–As2O3–TeO2:NiO glasses
Sample Emission peak position (nm)
Refractive index σp
E (1033, cm2)
N2 1330 1.651 1.113
N4 1333 1.659 1.126
N6 1337 1.664 1.135
N8 1340 1.668 1.143
N10 1344 1.673 1.146
N15 1349 1.678 1.148
N20 1354 1.683 1.151
168
1100 1200 1300 1400 1500
Wavelength (nm)
N2
N4N6
N8 N10
N20
N15
Lum
ines
cenc
e in
tens
ity (
a.u.
)
3T2(3F) → 3A2(3F)
Fig. 4.6 Photoluminescence spectra of ZnF2–As2O3–TeO2:NiO glasses recorded at room temperature (λexc= 800 nm).
169
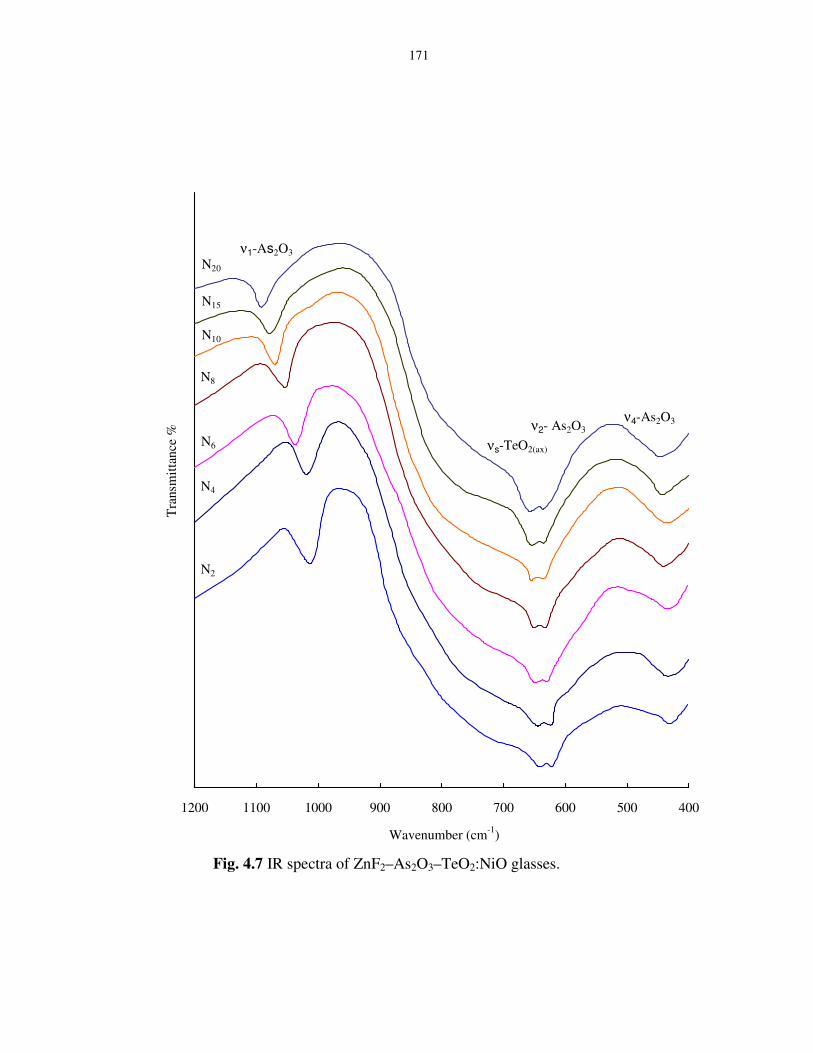
Fig. 4.7 shows infrared transmission spectra of ZnF2–As2O3–TeO2: NiO
glasses. The spectra exhibited different absorption bands due to various
structural units of TeO2 and As2O3. IR spectrum of crystalline TeO2 is expected
to exhibit two absorption bands at 772 cm-1 [ν1(Α1)] and at 650 cm-1 [ν2(Α2)]
due to νs–TeO2eq and νs–TeO2ax vibrations with C2v symmetry, respectively
[37]. Similarly four prominent bands are expected in the IR spectrum of
crystalline As2O3 due to ν1 (1050 cm-1), ν2 (625 cm-1), ν3 (812 cm-1) and ν4
(495 cm-1) vibrations of AsO3 structural units [38]. In the spectrum of glass N0
the axial band due to vibrations of νs–TeO2ax, is located at 643 cm-1 whereas
the νs–TeO2eq band is observed to be missing; the ν1 and ν2–bands of AsO3
structural groups are located at 1007 and 620 cm-1 respectively; the ν4-band of
these structural groups is also positioned at about 431 cm-1. With the
introduction of NiO, the νs–TeO2ax and ν2 of AsO3 bands are shifted gradually
towards higher frequencies with a considerable decrease in the intensity. The
summary of various band positions of the IR spectra of these glasses is
furnished in Table 4.5.
170
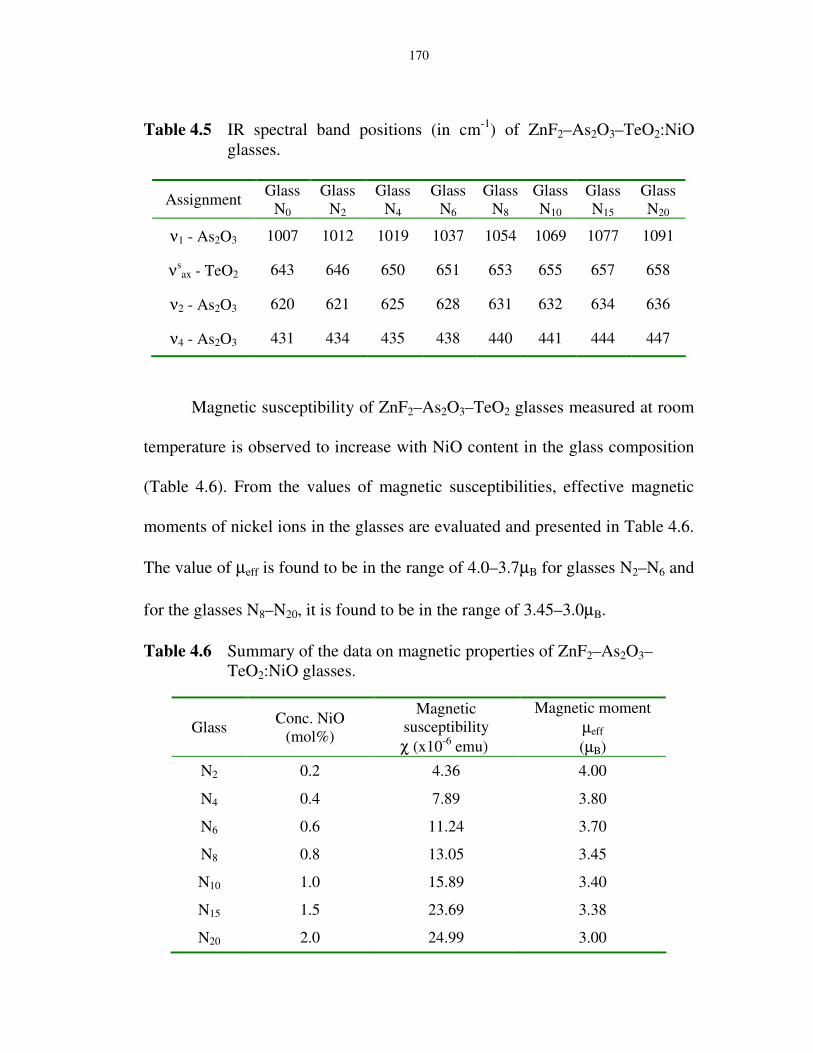
Table 4.5 IR spectral band positions (in cm-1) of ZnF2–As2O3–TeO2:NiO glasses.
Assignment Glass
N0 Glass
N2 Glass
N4 Glass
N6 Glass
N8 Glass N10
Glass N15
Glass N20
ν1 - As2O3 1007 1012 1019 1037 1054 1069 1077 1091
νsax - TeO2 643 646 650 651 653 655 657 658
ν2 - As2O3 620 621 625 628 631 632 634 636
ν4 - As2O3 431 434 435 438 440 441 444 447
Magnetic susceptibility of ZnF2–As2O3–TeO2 glasses measured at room
temperature is observed to increase with NiO content in the glass composition
(Table 4.6). From the values of magnetic susceptibilities, effective magnetic
moments of nickel ions in the glasses are evaluated and presented in Table 4.6.
The value of µeff is found to be in the range of 4.0–3.7µB for glasses N2–N6 and
for the glasses N8–N20, it is found to be in the range of 3.45–3.0µB.
Table 4.6 Summary of the data on magnetic properties of ZnF2–As2O3–TeO2:NiO glasses.
Glass Conc. NiO
(mol%)
Magnetic susceptibility χ (x10-6 emu)
Magnetic moment µeff (µB)
N2 0.2 4.36 4.00
N4 0.4 7.89 3.80
N6 0.6 11.24 3.70
N8 0.8 13.05 3.45
N10 1.0 15.89 3.40
N15 1.5 23.69 3.38
N20 2.0 24.99 3.00
171
400500600700800900100011001200
N2
N4
N6
N8
N10
N20
N15
νs-TeO2(ax)
ν2- As2O3ν4-As2O3
ν1-As2O3
Wavenumber (cm-1)
Tra
nsm
ittan
ce %
Fig. 4.7 IR spectra of ZnF2–As2O3–TeO2:NiO glasses.
172
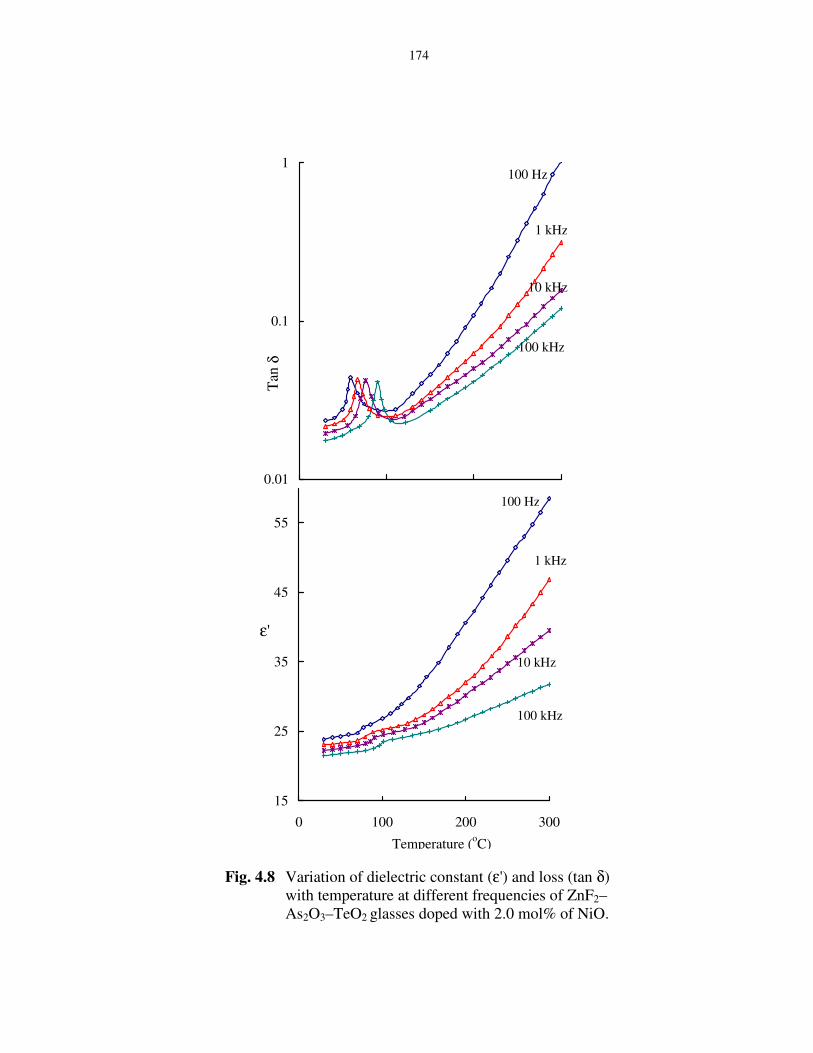
The dielectric constant ε' and loss tan δ at room temperature ( ≈ 30 oC) of
nickel free ZnF2–As2O3–TeO2 glasses at 100 kHz are measured to be 18.5 and
0.008 respectively. Fig. 4.8 represents the variation of dielectric constant (ε')
and loss (tan δ) with temperature at different frequencies of ZnF2–As2O3–TeO2
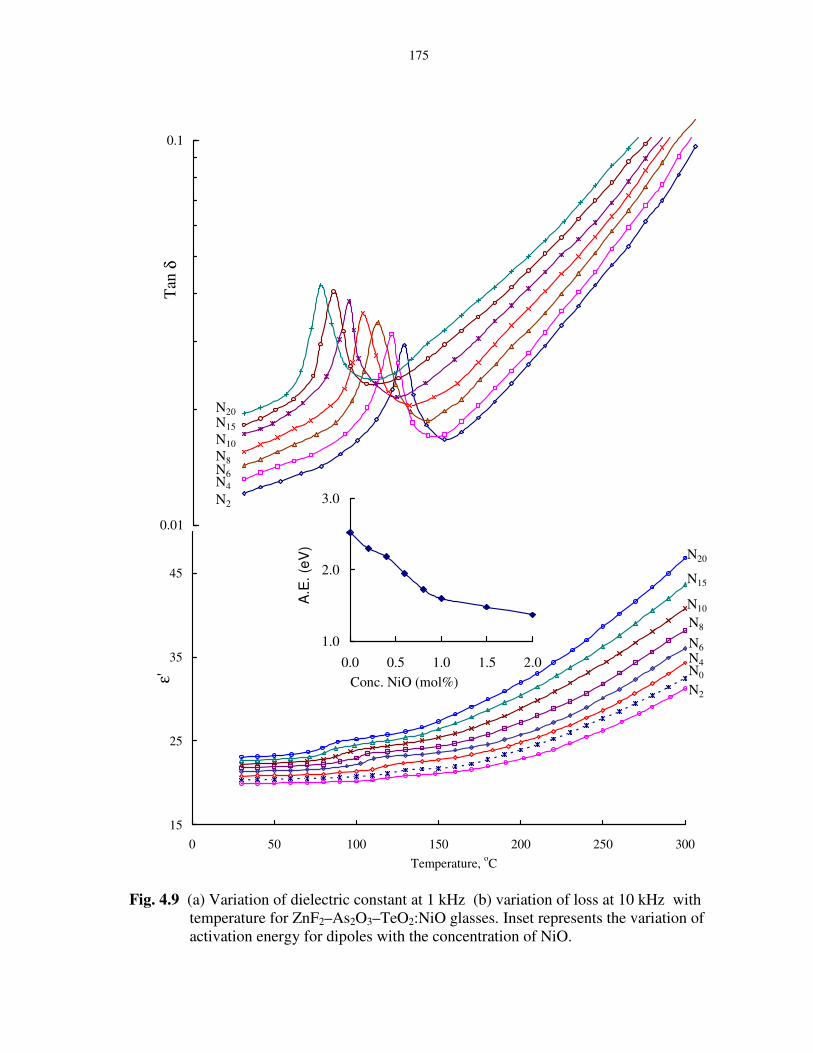
glasses doped with 2.0 mol% of NiO. The temperature dependence of ε' at 1
kHz of ZnF2–As2O3–TeO2 glasses doped with different concentrations of NiO
is shown in Fig. 4.9(a). The value of ε' is found to exhibit a considerable
increase at higher temperatures especially at lower frequencies; the rate of
increase of ε' with temperature is found to increase with increase in the
concentration of dopant.
A comparison plot of variation of tan δ with temperature, measured at a
frequency of 10 kHz for all glasses is presented in Fig. 4.9(b). The loss curves
have exhibited distinct maxima; with increase in frequency the temperature
maximum of tanδ shifts towards higher temperatures and with increase in
temperature, the frequency maximum shifts towards higher frequencies,
indicating the relaxation character of dielectric losses in these glasses. From
these curves, it is also observed that the region of relaxation shifts towards
lower temperatures with broadening of relaxation peak and increasing value of
(tan δ)max with increase in the concentration of the NiO. The effective
173
activation energy Wd for the dipoles is evaluated for all the glass samples using
the relation
kTW
odeff
/−= (4.1)
and its variation with the concentration of NiO is shown as the inset of Fig.
4.9; the activation energy is found to decrease gradually with increase in the
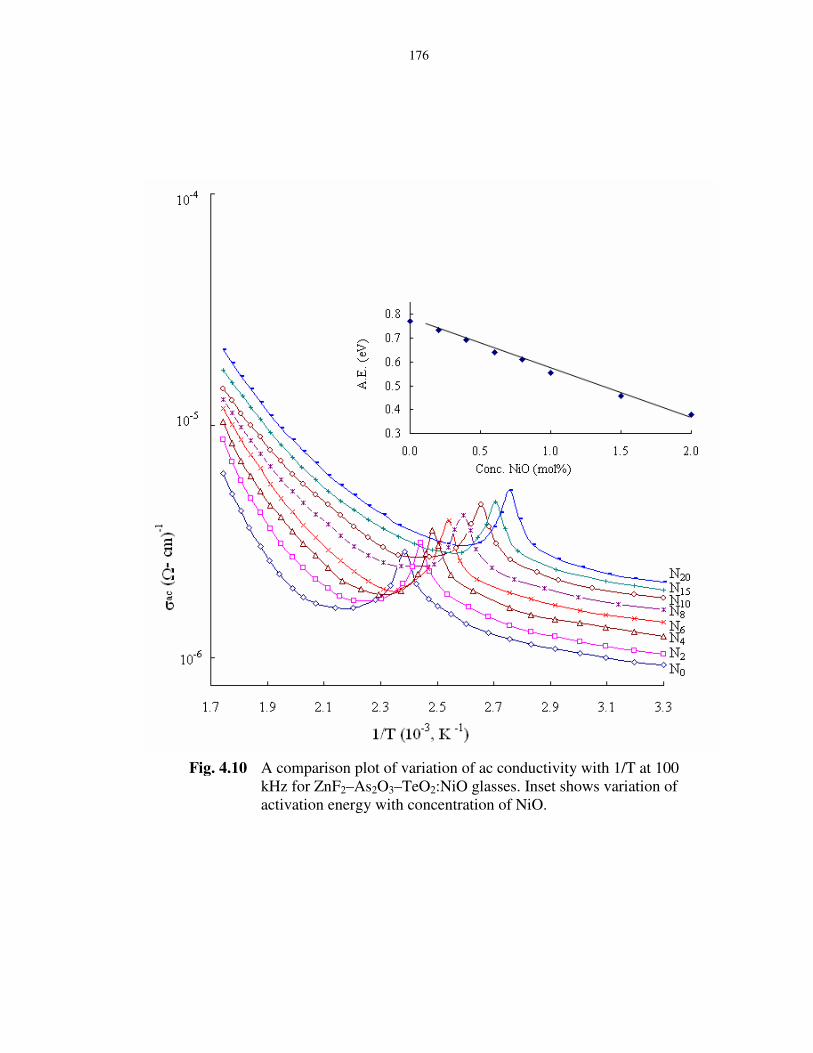
concentration of the NiO. The ac conductivity σac is calculated at different
temperatures, using (eq. 3.1) for different frequencies and the plots of log σac
against 1/T are shown in Fig. 4.10 for all the glasses at 100 kHz. From these
plots, the activation energy for conduction in the high temperature region over
which a near linear dependence of log σac with 1/T could be observed is
evaluated and its variation with the concentration of NiO is shown as the inset
of Fig. 4.10; this activation energy is also found to decrease gradually with
increase in the concentration of NiO.
174
Fig. 4.8 Variation of dielectric constant (ε') and loss (tan δ) with temperature at different frequencies of ZnF2–As2O3–TeO2 glasses doped with 2.0 mol% of NiO.
15
25
35
45
55
0 100 200 300
100 Hz
100 kHz
10 kHz
1 kHz
0.01
0.1
1100 Hz
100 kHz
10 kHz
1 kHz
Tan
δ
Temperature (oC)
ε'
175
15
25
35
45
0 50 100 150 200 250 300
Temperature, oC
ε'
N2
N10
N8
N6
N0
N4
N20
N15
0.01
0.1
N10
N8N6N4
N20N15
N2
Tan
δ
1.0
2.0
3.0
0.0 0.5 1.0 1.5 2.0Conc. NiO (mol%)
A.E
. (e
V)
Fig. 4.9 (a) Variation of dielectric constant at 1 kHz (b) variation of loss at 10 kHz with temperature for ZnF2–As2O3–TeO2:NiO glasses. Inset represents the variation of activation energy for dipoles with the concentration of NiO.
176
Fig. 4.10 A comparison plot of variation of ac conductivity with 1/T at 100 kHz for ZnF2–As2O3–TeO2:NiO glasses. Inset shows variation of activation energy with concentration of NiO.
177
4.4 Discussion
Since the v2 vibrational frequency range of AsO3 and TeO4 structural
units is very close to each other as mentioned earlier, there is a possibility for
the formation of the linkages of the type Te–O–As in the glass network. The
non-resolution of these two vibrational bands in the IR spectra especially for
the glasses doped with lower concentration of NiO supports this view point.
The oxidation of As3+ ions in to As5+ also seems to be possible during melting
and annealing processes. These As5+ ions occupy both tetrahedral and
octahedral positions in the glass network; the normal bond length of As5+–O is
∼ 1.69 Å [39]. As a participant of glass network, the local structure of As5+
cations is more symmetric and the strain energy in the glass network decreases
as a whole, thus resulting in a increase in the additional activation energy that
is necessary for glass network rearrangement. As a result we expect that less
degree of disorder in glasses containing As5+ ions rather than in the glasses
containing As3+ ions. The Ni2+ ions seem to exist in both four- and six-fold
coordination in the present glass samples. In general, tetragonally positioned
Ni2+ ions do not induce the formation of any non-bridging oxygen ions, but
octahedrally positioned ions may act as modifiers similar to any other
transition metal ions that occupy octahedral positions in the glass network [40].
This is also borne out by the fact that the symmetrical vibrational frequencies
of νsax–TeO2 bonds of TeO4 groups in the IR spectra are shifted towards higher
178
frequencies with decreasing intensity as the concentration of NiO is increased.
As modifiers, the Ni2+ ions, enter the glass network by breaking up Zn–O–Te,
As–O–Te bonds, and TeO4 bonds and may introduce: (i) the stable Te-O- and
(ii) unstable Te–O- bonds which will later be modified to Te–O- (or simply
TeO3+1) owing to the contraction of one Te-O- and the elongation of another
Te–O- bond. With increasing NiO content (up to 0.6 mol%), cleavage of
continuous network leads to an increase in the fraction of TeO3+1 polyhedra.
Further, the elongation of Te–O bond of TeO3+1 and its cleavage finally lead to
the formation of trigonal prismatic TeO3 units. Thus in addition to AsO3, Te–
O–Te, Zn–O–Te, As–O–Te linkages, the structure of the present glass network
consists of TeO4, TeO3+1 and TeO3, free Zn2+ ions, free F- ions and non
bridging oxygens. Such bonding defects may increase with increase in the
concentration of NiO.
The density of ZnF2–As2O3–TeO2:NiO glasses are observed to depend
on the content of NiO. In general, the degree of structural compactness,
modification of the geometrical configuration of the glassy network, change in
the coordination of the glass-forming ions and fluctuations in the dimensions
of the interstitial holes are some of the factors that influence the density of the
glass material. Table 4.1 shows a slight increase in density (d) and decrease in
molar volume (VM) with increase in NiO content. The increase in the density is
an expected result and can be related to the replacement of TeO2 (density 5.67
179
g/cm3) with NiO (density 6.67 g/cm3). The molar volume behavior reveals that
addition of NiO causes a slight contraction of the glass network.
Recollecting the data on DSC studies, we have observed that the values
of the glass transition temperature Tg and glass forming ability parameter Kgl,
observed to decrease with increase in the concentration of NiO in the glass
matrix. Lower values of these parameters indicate lower thermal stability of the
glasses. Normally, the decrease in bond length, cross-link density and
closeness of packing, are responsible for such a decrease of these parameters.
This observation further, points out that there is an increasing concentration of
nickel ions that act as modifier with increase in the content of NiO. The
presence of arsenic ions in As5+ state and also the nickel ions in the tetrahedral
positions in large proportions might be responsible for higher values of these
parameters for the glasses doped with low concentration of NiO.
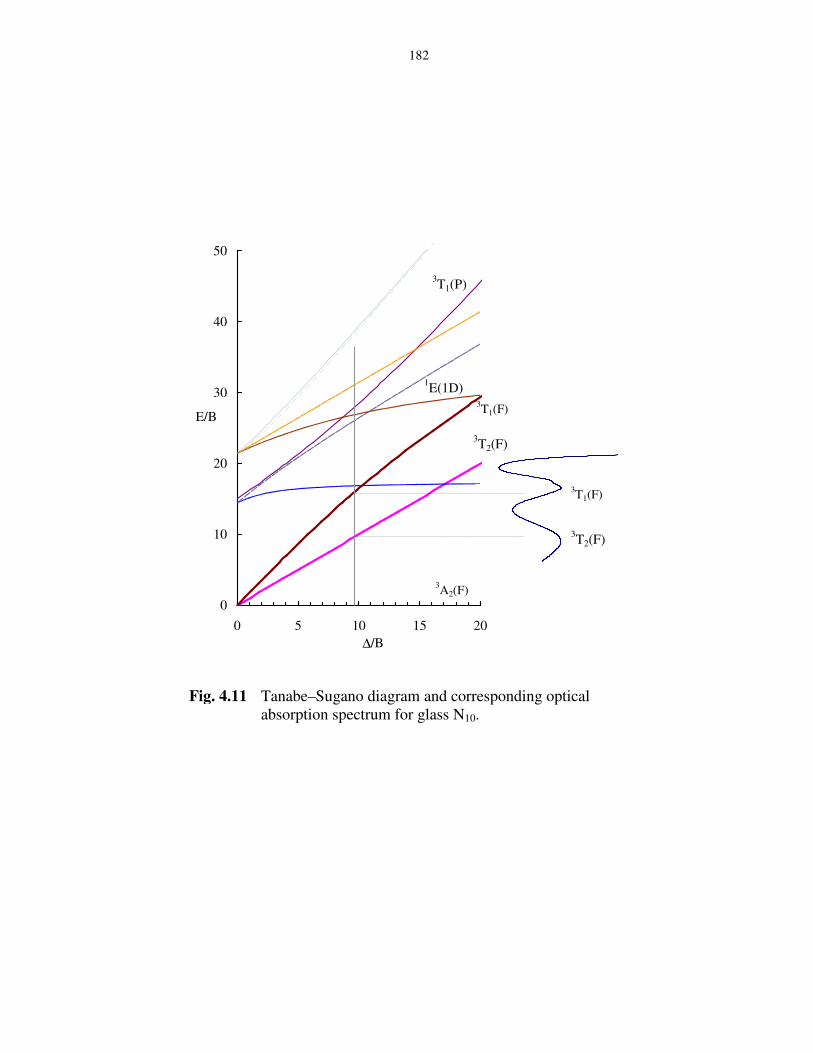
Using Tanabe–Sugano diagrams for d8 ion, the optical absorption
spectra of Ni2+ doped ZnF2–As2O3–TeO2 glass were analyzed and the bands
Oh1 and Oh2 are assigned to the transitions from the 3A2 ground state of
octahedrally positioned Ni2+ ions to 3T2(F), and 3T1(F) excited states
respectively. Fig. 4.11 represents TS diagram along with corresponding optical
absorption spectrum for the glass N10. In the region of 3A2→3T1(F) transition,
spin-forbidden transition viz., 3A2(F)→1E(D) due to distorted octahedral site of
Ni2+ ions may also present [41]. Hence the band observed at about 800 nm may
180
be considered as superposition of these two transitions. The Racah parameters
B and C and the ligand field parameter Dq (crystal field splitting energy) were
evaluated using energies of these transitions and the values obtained are given
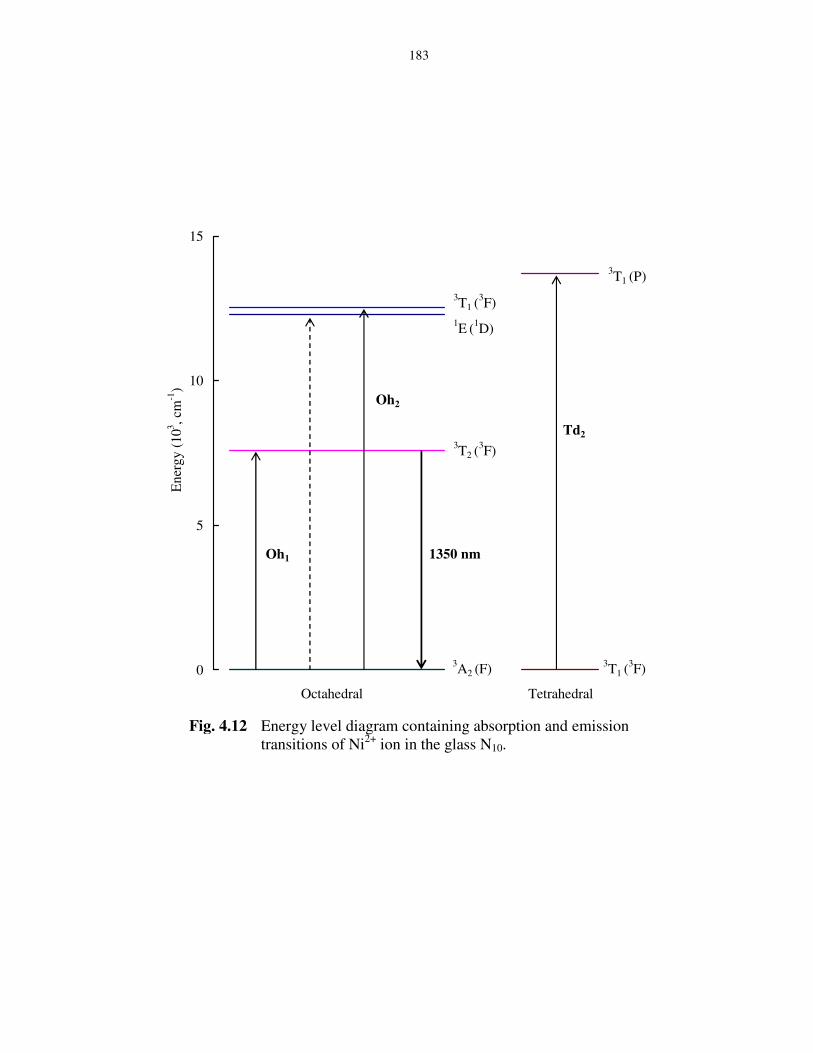
in Table 4.3. The energy level diagram for one of the glass samples (N10)
containing various observed transitions, is shown in Fig. 4.12. The kink
observed at about 715 nm is attributed to the transition,3T1(F)→3T1(P) of Ni2+
ions positioned in tetrahedral sites [42]. Thus, the optical absorption spectra of
ZnF2–As2O3–TeO2:NiO glasses indicate that Ni2+ ions exist both in octahedral
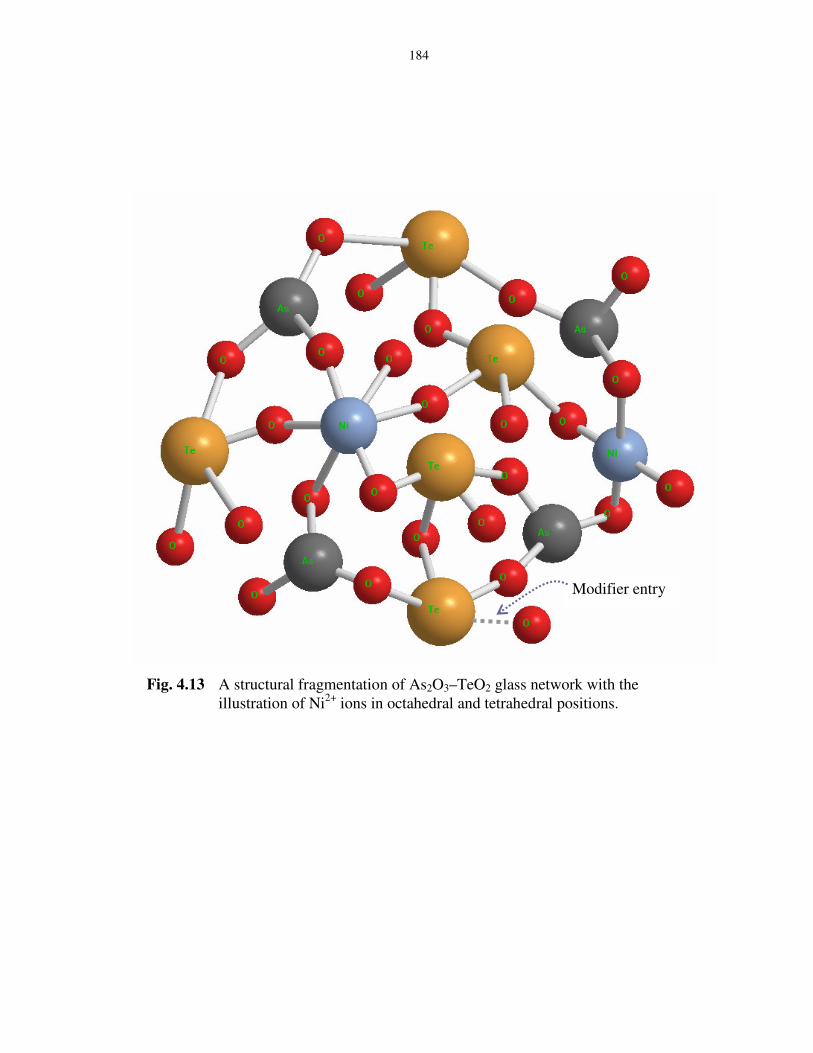
and tetrahedral sites in the network. The tetrahedrally positioned nickel ions
participate in the glass network with NiO4 structural units and alternate with
TeO4 units and strengthen the structure. A schematic illustration of the tellurite
arsenate network containing Ni2+ in octahedral and tetrahedral positions is
shown in Fig. 4.13. Further, the way the intensity of these bands varies with the
concentration of NiO suggests that in the glasses that contain smaller
concentrations of Ni2+ ions, these ions occupy tetrahedral positions and when
present in larger concentrations, these ions prefer mostly octahedral sites in the
glass network. Using the interelectronic repulsion parameter B, the
nephelauxetic ratio was also evaluated using the formula β = B (complex)/B′
(free ion), for all the samples; the value of β is observed to decrease gradually
with increase in the concentration of NiO (Table 4.3). This ratio gives
information on the delocalization of electrons from the metal ions into
181
molecular orbitals covering both the metals and ligands. The lower the value of
β the greater is the delocalization effect. The lowest value of β obtained for the
glass sample N20 indicates the maximum delocalization effect in this sample
[43].
The variation of the parameter Dq with the concentration of NiO
exhibited a decreasing trend (Table 4.3); this dependence is similar to optical
band gap. The octahedrally positioned Ni2+ ions act as modifiers similar to
Zn2+ ions and induce non-bridging oxygens in the glass network. The gradual
increase in the concentration of octahedral nickel ions in the glass network
causes a creation of large number of donor centers. The higher the
concentration of these modifier ions, the higher is the concentration of non-
bridging oxygens in the glass matrix. This leads to an increase in the degree of
localization of electrons thereby increasing the donor centres in the glass
matrix. The presence of higher concentrations of these donor centres decreases
the optical band gap and shifts the absorption edge towards lower wavelength,
as observed (Fig. 4.5).
182
0
10
20
30
40
50
0 5 10 15 20∆/B
E/B
3T2(F)
3T1(F)
3T1(P)
Fig. 11 Tanabe–Sugano diagram and corresponding optical
1E(1D)
3T2(F)
3T1(F)
3A2(F)
Fig. 4.11 Tanabe–Sugano diagram and corresponding optical absorption spectrum for glass N10.
183
0
5
10
15
Ene
rgy
(103 , c
m-1
)
3T1 (P)
1E (1D)
3T2 (3F)
3T1 (3F)
3A2 (F)
Oh2
Oh1 1350 nm
3T1 (3F)
Td2
Octahedral Tetrahedral
Fig. 4.12 Energy level diagram containing absorption and emission transitions of Ni2+ ion in the glass N10.
184
Modifier entry
Fig. 4.13 A structural fragmentation of As2O3–TeO2 glass network with the illustration of Ni2+ ions in octahedral and tetrahedral positions.
185
With the gradual increase in the concentration of NiO, the νs–TeO2ax and
ν2 of AsO3 bands in the IR spectra are shifted gradually towards higher
frequencies with decreasing intensity. Such changes indicate, decrease in the
intensity of symmetrical vibrations of above structural units due to the
increasing concentration of modifying ions.
The magnetic properties of ZnF2–As2O3–TeO2:NiO glass samples arise
from the paramagnetic Ni2+ (both tetrahedral and octahedral) ions.
Magnetically, the octahedral Ni2+ complexes have relatively simple behaviour
and their magnetic moments are expected to lie in the range 2.9 to 3.4 µB [43]
depending on the magnitude of the orbital contribution. Since, the ground state
3T1 (F) of tetrahedral Ni2+ ions possess much inherent orbital angular
momentum, the magnetic moment of perfect tetrahedral Ni2+ should be ~ 4.2
µB. Even a slight distortion reduces this value markedly because of the orbital
degeneracy. The fairly regular tetrahedral complexes of these ions are expected
to have the magnetic moment in the range 3.5 to 4.1 µB [43]. The gradual
decrease of the effective magnetic moment from 3.45 µB (for sample N8) to
3.00 µB (for sample N20) confirms that there is a gradual increase of the
positions of Ni2+ ions in the octahedral sites as the concentration of NiO is
increased.
To ascertain further, that there is an increase in the concentration of
octahedral sites/modifier positions of Ni2+ ions in the glass network, we have
186
undertaken the dielectric measurements. The dielectric constant of a material is
due to electronic, ionic, dipolar and space charge polarizations. Out of these,
the space charge contribution depends upon degree of disorder in the glass
network. The values of dielectric parameters viz., ε', tan δ and σac at any
frequency are found to increase with temperature and activation energy for a.c.
conduction is observed to decrease with increase in the content of NiO; this is
an indication of an increase in the space charge polarization. Such increase
indicates the increasing concentration of Ni2+ ions that act as modifiers (or that
occupy octahedral positions) in these samples. These modifying ions as
mentioned earlier, generate bonding defects in the glass network. The defects
thus produced create easy path ways for the migration of charges that would
build up space charge polarization and facilitate to an increase in the dielectric
parameters as observed [44, 45].
We have obtained the increase in the value of (tanδ)max and decrease of
the effective activation energy associated with the dipoles with increase in the
content of NiO in the glass (Table 4.6), these observations suggest an
increasing freedom for dipoles to orient in the field direction, obviously due to
increasing degree of disorder in glass network. Among the three constituents
viz., ZnF2, As2O3 and TeO2 of these glasses, the bonds of tellurium with
oxygen are known to be polar in nature [46] and hence it is reasonable to
attribute the observed dipolar effects in these glasses to the TeO4 structural
187
units [47, 48]. Further, the way the dielectric loss varies with the temperature
for all the samples indicate that there is a spreading of relaxation times. The
spreading of dielectric relaxation effects in ZnF2–As2O3–TeO2 glasses doped
with different concentrations of NiO may be attributed to the association of
divalent positive ions (Zn2+ and also octahedrally positioned Ni2+ ions) with a
pair of cationic vacancies as observed in a number of conventional glasses,
glass ceramics and crystals that contain divalent positive ions as reported
before [49, 50]. Thus the data on dielectric loss also point out that there is
growing concentration of octahedrally positioned Ni2+ ions with increase in the
content of NiO in the glass matrix. The increase in the magnitude of ac
conductivity and decrease in the activation energy for conduction with the
concentration of NiO also supports this view point.
Normally it is the octahedral ion that gives out luminescence emission
and so far no emission due to tetrahedral nickel ions has been observed either
in glass or crystal hosts. In general, octahedrally coordinated Ni2+ ions are
expected to give luminescence bands in the green, red and near-infrared
regions; out of these the green and red emissions were reported only at very
low temperatures [41]. For the present glass system, we have observed (with
excitation at 800 nm) a broad band extending from 1200 to 1500 nm with the
bary centre shifting towards slightly higher wavelengths with increase in the
content of NiO. This emission band is attributed to 3T2(3F)→3A2(3F)
188
octahedral transition of Ni2+ ions. The width and the shape of this transition
indicate that there is a relatively increased Stokes shift between the emission
and absorption band.
Using the conventional formulae [51], the transition probability,
( ) 2
62
'
108,
eA JJ
×=
νψψ (4.2)
and the emission cross-section
( )
λπψψλ
σ ρ∆
= 2'
4
8
,
d
JJE
cn
A (4.3)
of the observed emission peak have been evaluated and presented in Table 4.5
along with the other pertinent data. In Eq. 4.3, nd is the refractive index of the
sample, ∆λ is the half width of the emission peak. The value of σpE is found to
increase gradually from the sample N2–N20 indicating increasing luminescence
efficiency with increase in the concentration of the NiO.
189
4.5 Conclusions
ZnF2–As2O3–TeO2 glasses doped with different concentrations of NiO have
been synthesized. The optical absorption, IR spectra, magnetic susceptibility
studies and dielectric properties of these glasses have indicated that there is a
growing presence of nickel ions in octahedral positions with increase in the
concentration of NiO in the glass matrix. The photoluminescence spectra of
these glasses have exhibited a broad emission band due to 3T2(3F)→3A2(3F)
octahedral transition of Ni2+ ions in the NIR region. The highest luminescence
efficiency is observed for the glass containing 2.0 mol% of NiO. The final
analysis further indicated that higher the concentration of octahedrally
positioned Ni2+ ions, higher is the luminescence efficiency and such glasses
may be useful for broad band optical amplifiers in NIR region.
190
References
[1] G. Murali Krishna, Y. Gandhi, N. Veeraiah, J. Lumin. 128 (2008) 631
[2] A.M. Malyarevich, Yu.V. Volk, K.V. Yumashev, V.K. Pavlovskii, S.S. zapalov, O.S. Dymshits, A.A. Zhilin, J. Non-Cryst. Solids 351 (2005) 3551.
[3] M. Srinivasa Reddy, S.V.G.V.A. Prasad, N. Veeraiah, Phys. Stat. Sol. (a), 204 (2007) 816.
[4] B.V. Raghavaiah, C. Laxmikanth, N. Veeraiah, Optics Commun. 235 (2004) 341.
[5] N. Krishna Mohan, M. Rami Reddy, N. Veeraiah, J. Alloys Compd. 458 (2008) 66.
[6] H. Keppler, N. Bagdassarov, Chem. Geo. 158 (1999) 105.
[7] E. Zannoni, E. Cavalli, M. Bettinelli, J. Phys. Chem. Solids 67 (2006) 789.
[8] G. Feng, S. Zhou, J. Bao, S. Xu, J. Qiu, J. Alloys Compd. 457 (2008) 506.
[9] D. Souri, S.A. Salehizadeh, J. Mater. Sci. 44 (2009) 5800.
[10] F.A. Moustaffa, F.H. El-Batal, A.M. Fayadd, I.M. El-Kashef, Acta Phys.
Polo. A 117 (2010) 471.
[11] R. Kumar, A. Arvind, M. Goswami, S. Bhattacharya, V.K. Shrikhande, G.P. Kothiyal, J. Mater. Sci. 44 (2009) 3349.
[12] P.S. Prasad, V.R. Kumar, G.N. Raju, N. Veeraiah, Mater. Sci.-Poland 26 (2008) 527.
[13] J. Bao, S. Zhou, G. Feng, X. Wang, X. Qiao, J. Qiu, J. Alloys Compd. 456 (2008) 239.
[14] M. Kusatsugu, M. Kanno, T. Honma, T. Komatsu, J. Solid State Chem. 181 (2008) 1176
[15] S. Wang, K. Liang, J. Non-Cryst. Solids 354 (2008) 1522.
[16] M. Sato, T. Honma, Y. Benino, T. Komatsu, J. Solid State Chem. 180 (2007) 2541
191
[17] B. Wu, J. Qiu, M. Peng, J. Ren, X. Jiang, C. Zhu, Mater. Res. Bull. 42 (2007) 762.
[18] E. Mejia-Ramirez, A. Gorokhovsky, J.I. Escalante-Garcia, J. Non-Cryst.
Solids 353 (2007) 366.
[19] T. Suzuki, Y. Arai, Y. Ohishi, J. Non-Cryst. Solids 353 (2007) 36.
[20] T. Suzuki, Y. Nakatsubata, G.S. Murugan, Y. Ohishi, Ceram. Trans. 197 (2006) 13
[21] B. Brendeback, R. Glaum, M. Funke, F. Reinauer, J. Hormes and H. Modrow, Z. Naturforsch 60a (2005) 449.
[22] H. Schlenz, F. Reinauer, R. Glaum, J. Neuefeind, B. Brendebach and J. Hormes, J. Non-Cryst. Solids 351 (2005) 1014.
[23] P. Nageswara Rao, G. Naga Raju, D. Krishna Rao, N. Veeraiah, J. Lumin. 117 (2006) 53.
[24] M. Tawati Daefalla, M.J.B. Adlan, Ceram. Int. 30 (2004) 1737.
[25] T.K. Kundu, D.K. Chakravorty, J. Mater. Res. 14 (1999) 1069.
[26] R.S. Singh, S.P. Singh, Phys. Chem. Glasses 40 (1999) 235.
[27] El-Desoky, S.M. Mohamed, I. Kashif, J. Mater. Sci. Mater. Electr. 10 (1999) 279.
[28] V. Rajendran, F.A Khalifa, H.A. El-Batal, Ind. J. Pure. Appl. Phys. 35 (1997) 618.
[29] M. Shibata, M. Ookawa, T. Yokokawa, J. Non-Cryst. Solids 190 (1995) 226.
[30] A. Musinu, G. Piccaluga, P.H. Gaskell, J. Non-Cryst. Solids 192 (1995) 32.
[31] A. Corrias, A. Musinu and P.H. Gaskell, J. Non-Cryst. Solids 192 (1995) 49.
[32] I. Kashif, H. Farouk, S.A. Aly, J. Mater. Sci. Mater. Electr. 2 (1991) 216.
[33] F.A. Khalifa, Z.A. El-hadi, F.M. Ezz, J. Mater. Sci. Lett. 10 (1991) 1184.
192
[34] J.L. Rao, G.L. Narendra and S.V.J. Lakshman, Polyhedron 9 (1990)1475.
[35] E. Baiocchi, M. Bettinelli, J. Non-Cryst. Solids 46 (1981) 203.
[36] A. Paul and A.N. Tiwari, J. Mater. Sci. 9 (1974) 1057.
[37] I. Morozova, A. Yakind, Fis. Khim. Stekla 3 (1977) 197.
[38] O. Miroschnichenko, O. Klimaschevski, Neorg. Mater. 6 (1970) 1893.
[39] J.M. Charnock, D.A. Polya, A.G. Gault and R.A. Wogelius, Am.
Mineralogist 921 (2007) 856.
[40] G. Murali Krishna, B. Anila Kumari, M. Srinivasa Reddy and N. Veeraiah, J. Solid State Chem. 180 (2007) 2747.
[41] E. Zannoni, E. Cavalli, A. Toncelli, M. Tonelli, M. Bettinelli, J. Phys.
Chem. Sol. 60 (1999) 449.
[42] J.L. Rao, G. L. Narendra, and S.V.J. Laksmana, Polyhedron 9 (1990) 1475.
[43] J.D. Lee, Concise Inorganic Chemistry, 5th ed. (Blackwell Science, 1996).
[44] L. Srinivasa Rao, M. Srinivasa Reddy, D. Krishna Rao, N. Veeraiah, J.
Solid State Sci. 11 (2009) 578.
[45] T. Satyanarayana, I.V. Kityk, M. Piasecki, P. Bragiel, M.G. Brik, Y. Gandhi and N. Veeraiah, J. Phys.–Cond. Matter 21 (2009) 245104
[46] V.R. Kumar, N. Veeraiah and S. Buddudu, J. de Phys. III, 7 (1997) 951.
[47] A. Singh, V. K. Dhawan, Phil. Mag. B 48 (1983) 215.
[48] D.K. Durga, N. Veeraiah, J. Mater. Sci. 36 (2001) 5625.
[49] S.V.G.V.A. Prasad, M. Srinivasa Reddy, N. Veeraiah, J. Phys. Chem.
Solids 67 (2006) 2478.
[50] G. Murali Krishna, Y. Gandhi and N. Veeraiah, Physica Status Solidi(a) 205 (2008) 177.
[51] G. Fuxi, Optical and Spectroscopic Properties of Glass, Springer-Verlag, Shanghai Scientific Technical Pub., Shanghai, 1991.