Spectrophotometric determination of drugs with...
4
Journal of Scientific & Industrial Research Vol. 65, October 2006, pp. 808-811 Spectrophotometric determination of drugs with iodine T Karuna 1 , K Neelima 1 , G Venkateshwarlu 2 and P Yadagiri Swamy 1, * 1 Department of Chemistry, University College of Engineering, Osmania University, Hyderabad 500 007 2 Department of Chemistry, Nizam College, Hyderabad 500 001 Received 13 March 2006; accepted 12 May 2006 Spectrophotometric method is described for the determination of drugs through charge transfer complex formation with iodine acceptor. This method is based upon molecular interaction between drugs and iodine to form charge transfer complexes in which iodine acts as a sigma acceptor (σ). Iodine was found to form charge transfer complex in 1:1 stoichiometry with all the drugs selected for study. Colored products were quantified spectrophotometrically by using absorption bands. Thermodynamic parameters and spectral characteristics of these complexes have been evaluated. A complete detailed investigation of the formed complex was made with respect to its composition, formation constant and free energy change. Electronic absorption bands are found shifted towards shorter wavelengths upon complex formation with iodine along with well-known blue shift of visible iodine band. The values of formation constants and thermodynamic parameters show a strong donor-acceptor interaction, which helps to study the possible site of interaction between the donors and the acceptors and also provides a tool for the estimation of drugs at both iodine band at 512 nm and blue shift band, which are sensitive to the drugs up to the concentration of 10 -3 M. Keywords: Drugs, Iodine, Spectrophotometric determination Introduction Iodine forms molecular complexes with a variety of aromatic, aliphatic and heterocyclic compounds 1-3 containing lone pair (non bonding) of electrons on oxygen, sulphur and nitrogen atoms, respectively, which act as electron donors and iodine itself acts as a σ–acceptor 4-6 . Bonding type involved in iodine is n-σ. Complexation results in intensity decrease of iodine band with a simultaneous appearance of blue shift iodine band (BSB) and provides a significant, time saving, practical and economic method for the estimation of donors from intensities of iodine band and BSB. Formation of isosbestic point confirms that stoichiometry of drug complexes is 1:1. Origin 7-9 of BSB and charge transfer (CT) bands are explained in terms of valence band theory (VBT) and molecular orbital theory (MOT). Formation of CT complexes 10,11 is due to excitation of electrons from orbital of donor to orbital of acceptor. In present communication, UV spectrophotometric study provides an estimation method of theraupetic drugs 12 possessing antifungal, antidepressant, antihistamine, β-adregenic properties from study of their complexes with iodine. Materials and Methods Fisher certified iodine was repurified by sublimation twice under nitrogen atmosphere and was kept in a desiccator with calcium chloride and protected from the light. The solvent used was chloroform of spectro grade. The standard solution of iodine was prepared in chloroform. The pharmaceutical grade drugs were supplied by Arabindo Pharmaceuticals and Heterodrugs Pvt Ltd, Hyderabad in the form of acid salts. Spectrophotometric analysis for the study of electron spectral measurements was carried out on a SL-164 UV double beam spectrophotometer (Elico) having a fixed slit width with 1cm quartz cells, which is attatched to the computer loaded with software and equipped with a printer. Preparation of Experimental Solutions The concentration of iodine was held constant at 9x10 -4 M. The drug was neutralized with 20% ammonium hydroxide solution and made the concentration up to 10 -3 M so as to produce a distinct decrease in the intensity of iodine band and BSB with sizable change in the intensity. In volumetric flasks (10 ml each) sample solutions (1, 2, 3, 4 and 5 ml) were transferred by pipette and 5 ml of iodine solution were added in each flask. The _________________ *Author for correspondence E-mail: [email protected]
Transcript of Spectrophotometric determination of drugs with...

Journal of Scientific & Industrial Research
Vol. 65, October 2006, pp. 808-811
Spectrophotometric determination of drugs with iodine
T Karuna1, K Neelima
1, G Venkateshwarlu
2 and P Yadagiri Swamy
1,*
1Department of Chemistry, University College of Engineering, Osmania University, Hyderabad 500 007 2Department of Chemistry, Nizam College, Hyderabad 500 001
Received 13 March 2006; accepted 12 May 2006
Spectrophotometric method is described for the determination of drugs through charge transfer complex formation with
iodine acceptor. This method is based upon molecular interaction between drugs and iodine to form charge transfer
complexes in which iodine acts as a sigma acceptor (σ). Iodine was found to form charge transfer complex in 1:1
stoichiometry with all the drugs selected for study. Colored products were quantified spectrophotometrically by using
absorption bands. Thermodynamic parameters and spectral characteristics of these complexes have been evaluated. A
complete detailed investigation of the formed complex was made with respect to its composition, formation constant and
free energy change. Electronic absorption bands are found shifted towards shorter wavelengths upon complex formation
with iodine along with well-known blue shift of visible iodine band. The values of formation constants and thermodynamic
parameters show a strong donor-acceptor interaction, which helps to study the possible site of interaction between the
donors and the acceptors and also provides a tool for the estimation of drugs at both iodine band at 512 nm and blue shift
band, which are sensitive to the drugs up to the concentration of 10-3 M.
Keywords: Drugs, Iodine, Spectrophotometric determination
Introduction
Iodine forms molecular complexes with a variety
of aromatic, aliphatic and heterocyclic compounds1-3
containing lone pair (non bonding) of electrons on
oxygen, sulphur and nitrogen atoms, respectively,
which act as electron donors and iodine itself acts as a
σ–acceptor4-6
. Bonding type involved in iodine is n-σ.
Complexation results in intensity decrease of iodine
band with a simultaneous appearance of blue shift
iodine band (BSB) and provides a significant, time
saving, practical and economic method for the
estimation of donors from intensities of iodine band
and BSB. Formation of isosbestic point confirms that
stoichiometry of drug complexes is 1:1. Origin7-9
of
BSB and charge transfer (CT) bands are explained in
terms of valence band theory (VBT) and molecular
orbital theory (MOT). Formation of CT complexes10,11
is due to excitation of electrons from orbital of donor
to orbital of acceptor. In present communication, UV
spectrophotometric study provides an estimation
method of theraupetic drugs12
possessing antifungal,
antidepressant, antihistamine, β-adregenic properties
from study of their complexes with iodine.
Materials and Methods Fisher certified iodine was repurified by
sublimation twice under nitrogen atmosphere and was
kept in a desiccator with calcium chloride and
protected from the light. The solvent used was
chloroform of spectro grade. The standard solution of
iodine was prepared in chloroform. The
pharmaceutical grade drugs were supplied by
Arabindo Pharmaceuticals and Heterodrugs Pvt Ltd,
Hyderabad in the form of acid salts.
Spectrophotometric analysis for the study of
electron spectral measurements was carried out on a
SL-164 UV double beam spectrophotometer (Elico)
having a fixed slit width with 1cm quartz cells, which
is attatched to the computer loaded with software and
equipped with a printer.
Preparation of Experimental Solutions
The concentration of iodine was held constant at
9x10⁻⁴
M. The drug was neutralized with 20%
ammonium hydroxide solution and made the
concentration up to 10-3
M so as to produce a distinct
decrease in the intensity of iodine band and BSB with
sizable change in the intensity.
In volumetric flasks (10 ml each) sample solutions
(1, 2, 3, 4 and 5 ml) were transferred by pipette and
5 ml of iodine solution were added in each flask. The
_________________
*Author for correspondence
E-mail: [email protected]
KARUNA et al: SPECTROPHOTOMETRIC DETERMINATION OF DRUGS WITH IODINE
809
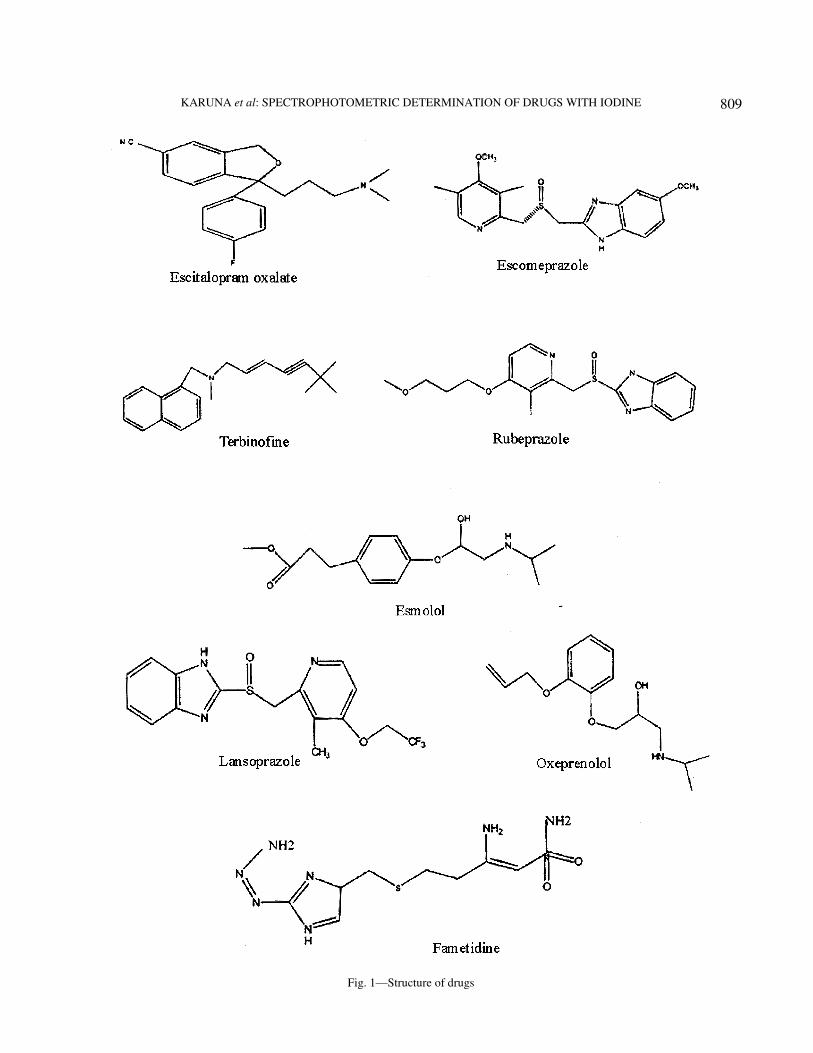
Fig. 1—Structure of drugs

J SCI IND RES VOL 65 OCTOBER 2006
810
solutions were well mixed and allowed to stand at
200C for 20 min. The solutions were diluted with
chloroform and the absorbances were measured
against blank using chloroform as solvent. Drugs used
in the study were omeprazole, lansoprazole,
rabeprazole, fametidine, terbinofine, escitalopram
oxalate, esmolol and oxeprenolol (Fig 1).
Results and Discussion
Experimental Drugs (Fig. 1) were basic nitrogen
compounds, which act as n-donors to form CT
complexes with iodine (σ acceptor). Donors
(10-3
-10-4
M) were completely transparent to visible
light while iodine absorbs at 513 nm to shorter
wavelength (hypsochromic shift). Drugs showed
negligible absorption in 300-700 nm. Mixing
chloroformic solution of iodine resulted in the change
of violet colour of iodine to different colour. As a
consequence, absorption of iodine shifted to shorter
wavelength (Fig. 2). In Fig. 2, a is the concentration
of iodine in chloroform whereas b, c, d, e and f are the
increasing concentrations of terbinofine-iodine
complex.
Formation constants (Kc) of complexes are
determined13
from iodine band using Eq. (1)
Kc = [C] / ( [I2]-[C]) ([N]-[C] ) … (1)
where, [C] = molar concentration of the complex, [N]
= molar concentration of donor, [I2] – [C] = molar
concentration of free iodine, and [N] - [C] = molar
concentration of free donor.
The Kc of the complexes is determined from iodine
and BSB using Rose-Drago method14
. Free energy
change (∆G) is obtained from Kc using Eq. (2).
∆G = -2.303 RT log Kc … (2)
Kc of the complexes of lansoprazole, omeprazole,
rabeprazole and fametidine have benzimidazole
moeity in their structure and are comparable with
literature values15
. Terbinofine and escitalopram
oxalate has tertiary amine moeity containing nitrogen
atom as a donor site and its Kc values are comparable
with that of literature16
. Kc values for escitalopram
oxalate are found to be lower than that of terbinofine,
because the presence of electron withdrawing cyanide
group in its ring structure. Esmolol and oxeprenolol
have a secondary amine moeity in common as donor
site and are expected to act as n-donors and their Kc
values are in good agreement with that of literature17
.
Experimental Kc values are also determined from BSB
using Rose-Drago method and the values agreed well
with each other. Rose-Drago equation is
K-1
= A / ε - ([A0]+[D0 ]) + [A0 D0] ε / A. … (3)
Fig. 2—Molecular complexes of iodine with terbinofine
KARUNA et al: SPECTROPHOTOMETRIC DETERMINATION OF DRUGS WITH IODINE
811
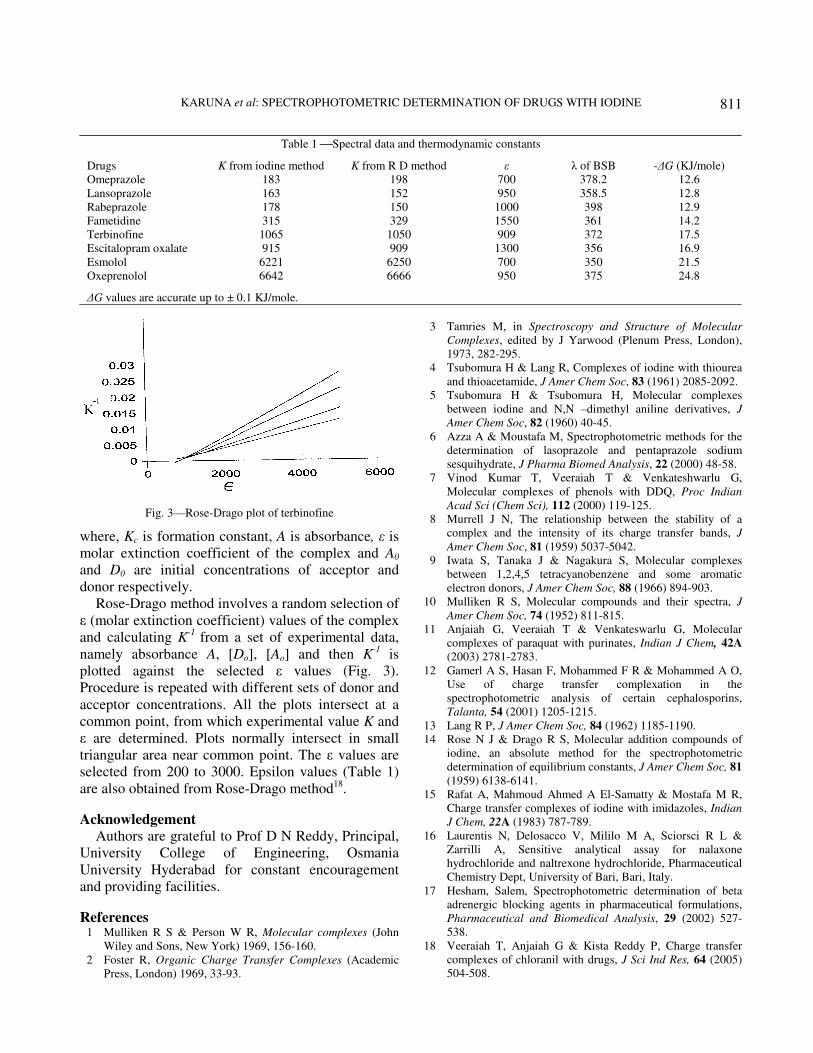
where, Kc is formation constant, A is absorbance, ε is
molar extinction coefficient of the complex and A0
and D0 are initial concentrations of acceptor and
donor respectively.
Rose-Drago method involves a random selection of
ε (molar extinction coefficient) values of the complex
and calculating K-1
from a set of experimental data,
namely absorbance A, [Do], [Ao] and then K-1
is
plotted against the selected ε values (Fig. 3).
Procedure is repeated with different sets of donor and
acceptor concentrations. All the plots intersect at a
common point, from which experimental value K and
ε are determined. Plots normally intersect in small
triangular area near common point. The ε values are
selected from 200 to 3000. Epsilon values (Table 1)
are also obtained from Rose-Drago method18
.
Acknowledgement
Authors are grateful to Prof D N Reddy, Principal,
University College of Engineering, Osmania
University Hyderabad for constant encouragement
and providing facilities.
References 1 Mulliken R S & Person W R, Molecular complexes (John
Wiley and Sons, New York) 1969, 156-160.
2 Foster R, Organic Charge Transfer Complexes (Academic
Press, London) 1969, 33-93.
3 Tamries M, in Spectroscopy and Structure of Molecular
Complexes, edited by J Yarwood (Plenum Press, London),
1973, 282-295.
4 Tsubomura H & Lang R, Complexes of iodine with thiourea
and thioacetamide, J Amer Chem Soc, 83 (1961) 2085-2092.
5 Tsubomura H & Tsubomura H, Molecular complexes
between iodine and N,N –dimethyl aniline derivatives, J
Amer Chem Soc, 82 (1960) 40-45.
6 Azza A & Moustafa M, Spectrophotometric methods for the
determination of lasoprazole and pentaprazole sodium
sesquihydrate, J Pharma Biomed Analysis, 22 (2000) 48-58.
7 Vinod Kumar T, Veeraiah T & Venkateshwarlu G,
Molecular complexes of phenols with DDQ, Proc Indian
Acad Sci (Chem Sci), 112 (2000) 119-125.
8 Murrell J N, The relationship between the stability of a
complex and the intensity of its charge transfer bands, J
Amer Chem Soc, 81 (1959) 5037-5042.
9 Iwata S, Tanaka J & Nagakura S, Molecular complexes
between 1,2,4,5 tetracyanobenzene and some aromatic
electron donors, J Amer Chem Soc, 88 (1966) 894-903.
10 Mulliken R S, Molecular compounds and their spectra, J
Amer Chem Soc, 74 (1952) 811-815.
11 Anjaiah G, Veeraiah T & Venkateswarlu G, Molecular
complexes of paraquat with purinates, Indian J Chem, 42A
(2003) 2781-2783.
12 Gamerl A S, Hasan F, Mohammed F R & Mohammed A O,
Use of charge transfer complexation in the
spectrophotometric analysis of certain cephalosporins,
Talanta, 54 (2001) 1205-1215.
13 Lang R P, J Amer Chem Soc, 84 (1962) 1185-1190.
14 Rose N J & Drago R S, Molecular addition compounds of
iodine, an absolute method for the spectrophotometric
determination of equilibrium constants, J Amer Chem Soc, 81
(1959) 6138-6141.
15 Rafat A, Mahmoud Ahmed A El-Samatty & Mostafa M R,
Charge transfer complexes of iodine with imidazoles, Indian
J Chem, 22A (1983) 787-789.
16 Laurentis N, Delosacco V, Mililo M A, Sciorsci R L &
Zarrilli A, Sensitive analytical assay for nalaxone
hydrochloride and naltrexone hydrochloride, Pharmaceutical
Chemistry Dept, University of Bari, Bari, Italy.
17 Hesham, Salem, Spectrophotometric determination of beta
adrenergic blocking agents in pharmaceutical formulations,
Pharmaceutical and Biomedical Analysis, 29 (2002) 527-
538.
18 Veeraiah T, Anjaiah G & Kista Reddy P, Charge transfer
complexes of chloranil with drugs, J Sci Ind Res, 64 (2005)
504-508.
Table 1 Spectral data and thermodynamic constants
Drugs K from iodine method K from R D method ε λ of BSB -∆G (KJ/mole)
Omeprazole 183 198 700 378.2 12.6
Lansoprazole 163 152 950 358.5 12.8
Rabeprazole 178 150 1000 398 12.9
Fametidine 315 329 1550 361 14.2
Terbinofine 1065 1050 909 372 17.5
Escitalopram oxalate 915 909 1300 356 16.9
Esmolol 6221 6250 700 350 21.5
Oxeprenolol 6642 6666 950 375 24.8
∆G values are accurate up to ± 0.1 KJ/mole.
Fig. 3—Rose-Drago plot of terbinofine


![Scanning spectrophotometry and spectrophotometric determination of concentration BCH 333 [practical]](https://static.fdocument.org/doc/165x107/56649dad5503460f94a9c8ed/scanning-spectrophotometry-and-spectrophotometric-determination-of-concentration.jpg)