SOLUTIONS: 4.1 Probability Distributions and 4.2 …SOLUTIONS: 4.1 Probability Distributions and 4.2...
6
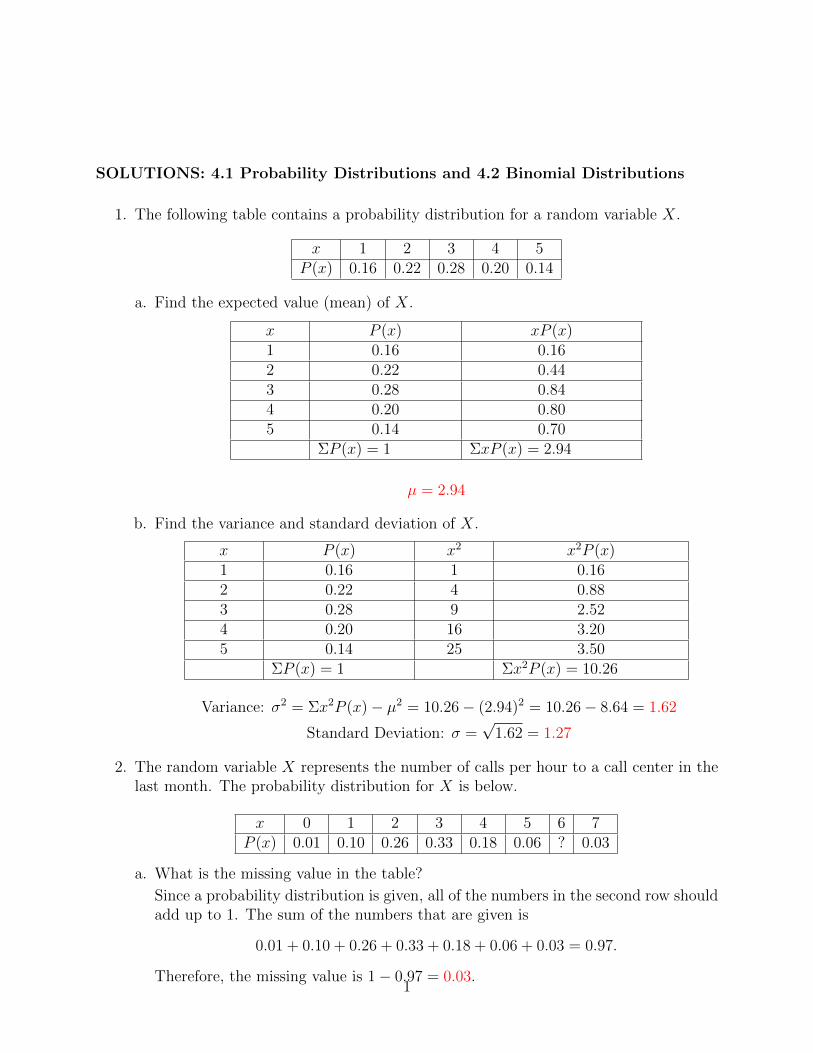
SOLUTIONS: 4.1 Probability Distributions and 4.2 Binomial Distributions 1. The following table contains a probability distribution for a random variable X . x 1 2 3 4 5 P (x) 0.16 0.22 0.28 0.20 0.14 a. Find the expected value (mean) of X . x P (x) xP (x) 1 0.16 0.16 2 0.22 0.44 3 0.28 0.84 4 0.20 0.80 5 0.14 0.70 ΣP (x)=1 ΣxP (x)=2.94 μ =2.94 b. Find the variance and standard deviation of X . x P (x) x 2 x 2 P (x) 1 0.16 1 0.16 2 0.22 4 0.88 3 0.28 9 2.52 4 0.20 16 3.20 5 0.14 25 3.50 ΣP (x)=1 Σx 2 P (x) = 10.26 Variance: σ 2 =Σx 2 P (x) - μ 2 = 10.26 - (2.94) 2 = 10.26 - 8.64 = 1.62 Standard Deviation: σ = √ 1.62 = 1.27 2. The random variable X represents the number of calls per hour to a call center in the last month. The probability distribution for X is below. x 0 1 2 3 4 5 6 7 P (x) 0.01 0.10 0.26 0.33 0.18 0.06 ? 0.03 a. What is the missing value in the table? Since a probability distribution is given, all of the numbers in the second row should add up to 1. The sum of the numbers that are given is 0.01 + 0.10 + 0.26 + 0.33 + 0.18 + 0.06 + 0.03 = 0.97. Therefore, the missing value is 1 - 0.97 = 0.03. 1
Transcript of SOLUTIONS: 4.1 Probability Distributions and 4.2 …SOLUTIONS: 4.1 Probability Distributions and 4.2...
SOLUTIONS: 4.1 Probability Distributions and 4.2 Binomial Distributions
1. The following table contains a probability distribution for a random variable X.
x 1 2 3 4 5P (x) 0.16 0.22 0.28 0.20 0.14
a. Find the expected value (mean) of X.
x P (x) xP (x)1 0.16 0.162 0.22 0.443 0.28 0.844 0.20 0.805 0.14 0.70
ΣP (x) = 1 ΣxP (x) = 2.94
µ = 2.94
b. Find the variance and standard deviation of X.
x P (x) x2 x2P (x)1 0.16 1 0.162 0.22 4 0.883 0.28 9 2.524 0.20 16 3.205 0.14 25 3.50
ΣP (x) = 1 Σx2P (x) = 10.26
Variance: σ2 = Σx2P (x)− µ2 = 10.26− (2.94)2 = 10.26− 8.64 = 1.62
Standard Deviation: σ =√
1.62 = 1.27
2. The random variable X represents the number of calls per hour to a call center in thelast month. The probability distribution for X is below.
x 0 1 2 3 4 5 6 7P (x) 0.01 0.10 0.26 0.33 0.18 0.06 ? 0.03
a. What is the missing value in the table?
Since a probability distribution is given, all of the numbers in the second row shouldadd up to 1. The sum of the numbers that are given is
0.01 + 0.10 + 0.26 + 0.33 + 0.18 + 0.06 + 0.03 = 0.97.
Therefore, the missing value is 1− 0.97 = 0.03.1
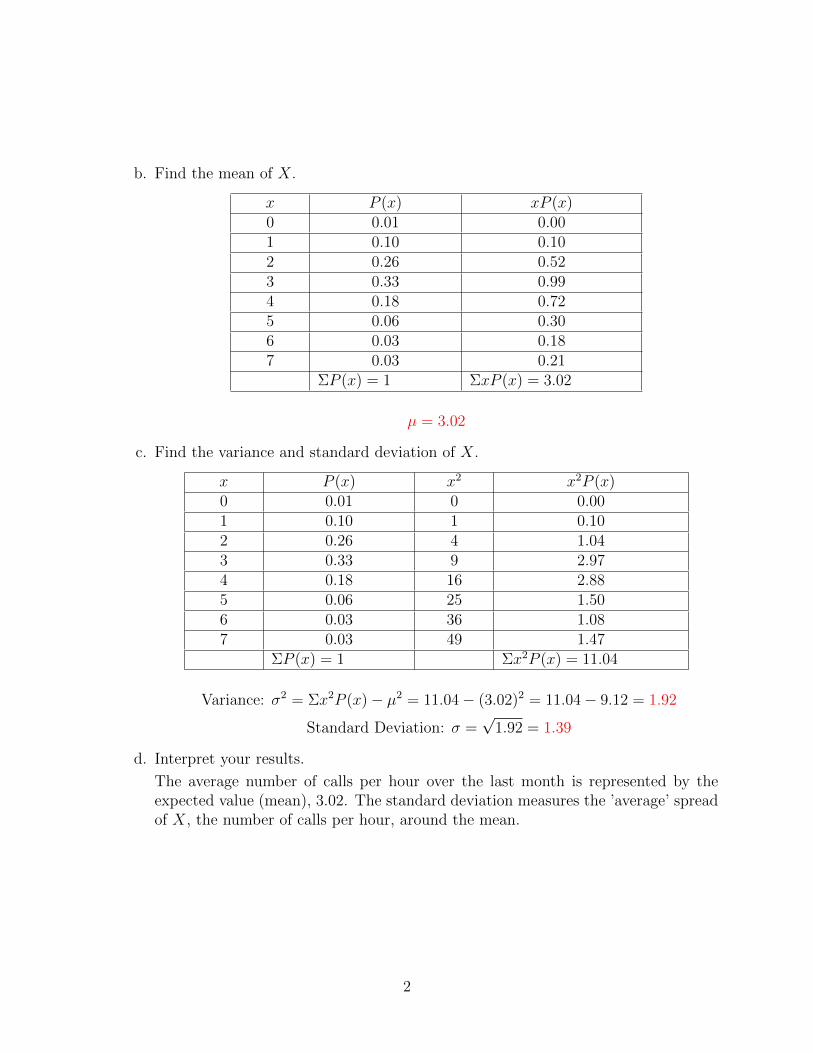
b. Find the mean of X.
x P (x) xP (x)0 0.01 0.001 0.10 0.102 0.26 0.523 0.33 0.994 0.18 0.725 0.06 0.306 0.03 0.187 0.03 0.21
ΣP (x) = 1 ΣxP (x) = 3.02
µ = 3.02
c. Find the variance and standard deviation of X.
x P (x) x2 x2P (x)0 0.01 0 0.001 0.10 1 0.102 0.26 4 1.043 0.33 9 2.974 0.18 16 2.885 0.06 25 1.506 0.03 36 1.087 0.03 49 1.47
ΣP (x) = 1 Σx2P (x) = 11.04
Variance: σ2 = Σx2P (x)− µ2 = 11.04− (3.02)2 = 11.04− 9.12 = 1.92
Standard Deviation: σ =√
1.92 = 1.39
d. Interpret your results.
The average number of calls per hour over the last month is represented by theexpected value (mean), 3.02. The standard deviation measures the ’average’ spreadof X, the number of calls per hour, around the mean.
2
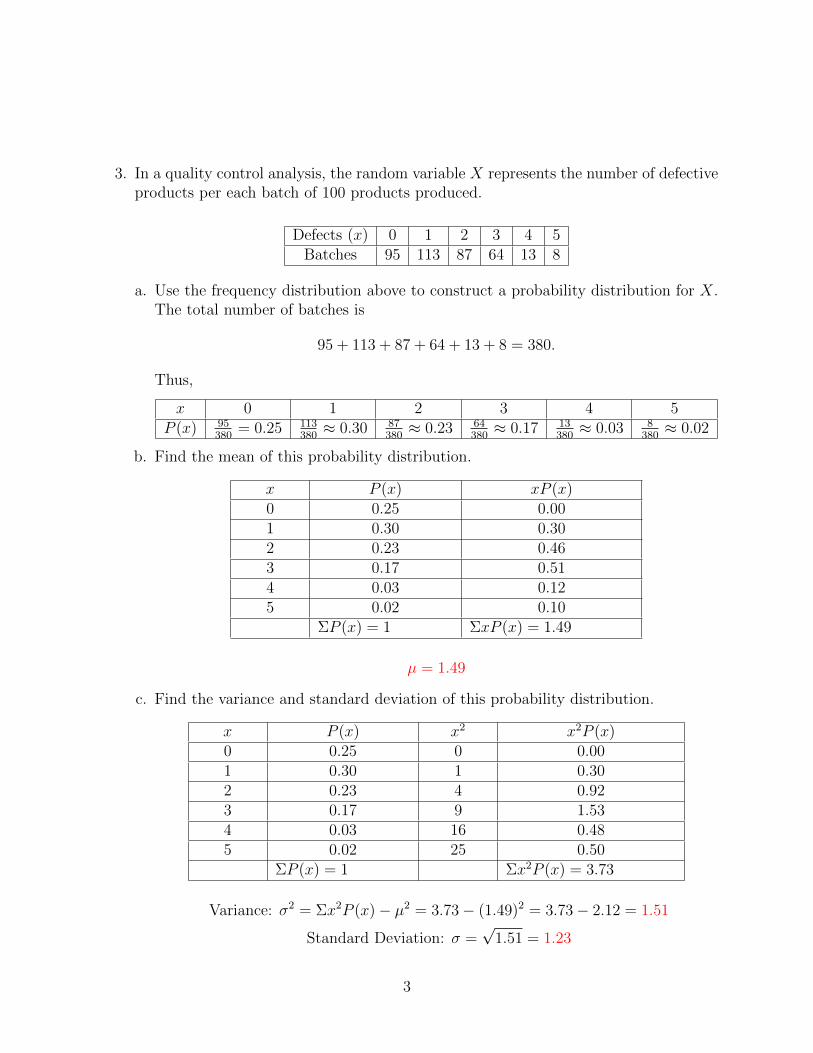
3. In a quality control analysis, the random variable X represents the number of defectiveproducts per each batch of 100 products produced.
Defects (x) 0 1 2 3 4 5Batches 95 113 87 64 13 8
a. Use the frequency distribution above to construct a probability distribution for X.The total number of batches is
95 + 113 + 87 + 64 + 13 + 8 = 380.
Thus,
x 0 1 2 3 4 5P (x) 95
380= 0.25 113
380≈ 0.30 87
380≈ 0.23 64
380≈ 0.17 13
380≈ 0.03 8
380≈ 0.02
b. Find the mean of this probability distribution.
x P (x) xP (x)0 0.25 0.001 0.30 0.302 0.23 0.463 0.17 0.514 0.03 0.125 0.02 0.10
ΣP (x) = 1 ΣxP (x) = 1.49
µ = 1.49
c. Find the variance and standard deviation of this probability distribution.
x P (x) x2 x2P (x)0 0.25 0 0.001 0.30 1 0.302 0.23 4 0.923 0.17 9 1.534 0.03 16 0.485 0.02 25 0.50
ΣP (x) = 1 Σx2P (x) = 3.73
Variance: σ2 = Σx2P (x)− µ2 = 3.73− (1.49)2 = 3.73− 2.12 = 1.51
Standard Deviation: σ =√
1.51 = 1.23
3
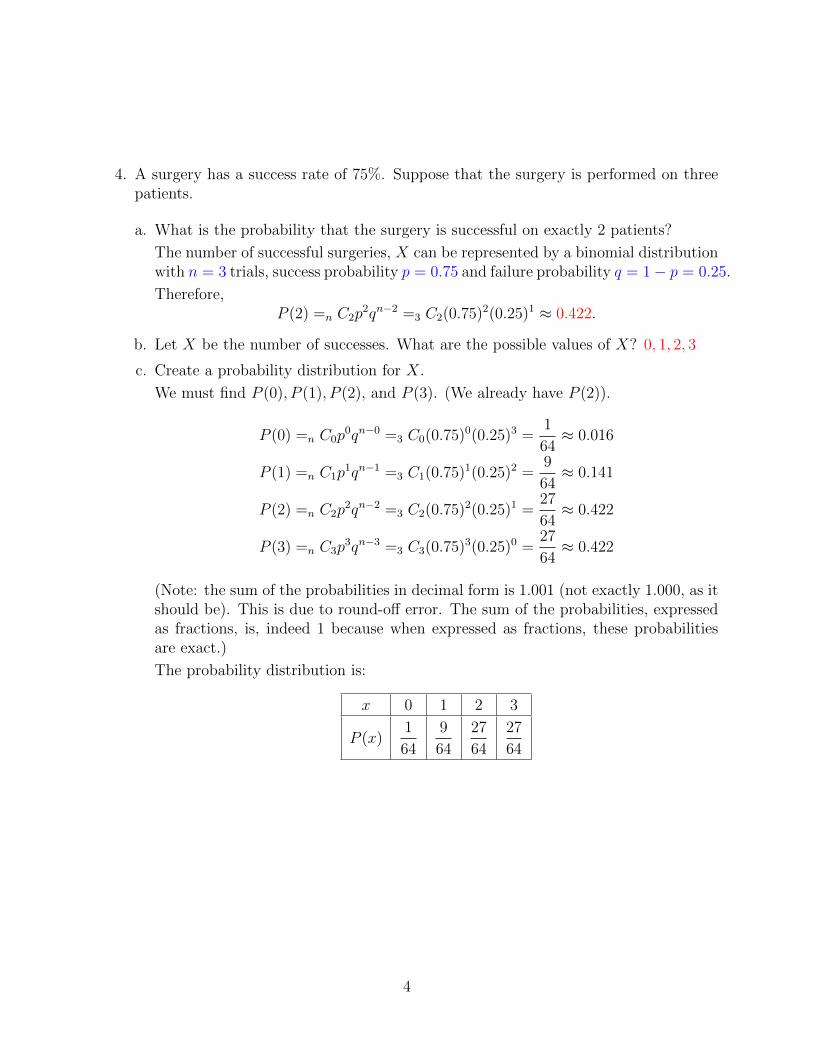
4. A surgery has a success rate of 75%. Suppose that the surgery is performed on threepatients.
a. What is the probability that the surgery is successful on exactly 2 patients?
The number of successful surgeries, X can be represented by a binomial distributionwith n = 3 trials, success probability p = 0.75 and failure probability q = 1− p = 0.25.
Therefore,P (2) =n C2p
2qn−2 =3 C2(0.75)2(0.25)1 ≈ 0.422.
b. Let X be the number of successes. What are the possible values of X? 0, 1, 2, 3
c. Create a probability distribution for X.
We must find P (0), P (1), P (2), and P (3). (We already have P (2)).
P (0) =n C0p0qn−0 =3 C0(0.75)0(0.25)3 =
1
64≈ 0.016
P (1) =n C1p1qn−1 =3 C1(0.75)1(0.25)2 =
9
64≈ 0.141
P (2) =n C2p2qn−2 =3 C2(0.75)2(0.25)1 =
27
64≈ 0.422
P (3) =n C3p3qn−3 =3 C3(0.75)3(0.25)0 =
27
64≈ 0.422
(Note: the sum of the probabilities in decimal form is 1.001 (not exactly 1.000, as itshould be). This is due to round-off error. The sum of the probabilities, expressedas fractions, is, indeed 1 because when expressed as fractions, these probabilitiesare exact.)
The probability distribution is:
x 0 1 2 3
P (x)1
64
9
64
27
64
27
64
4
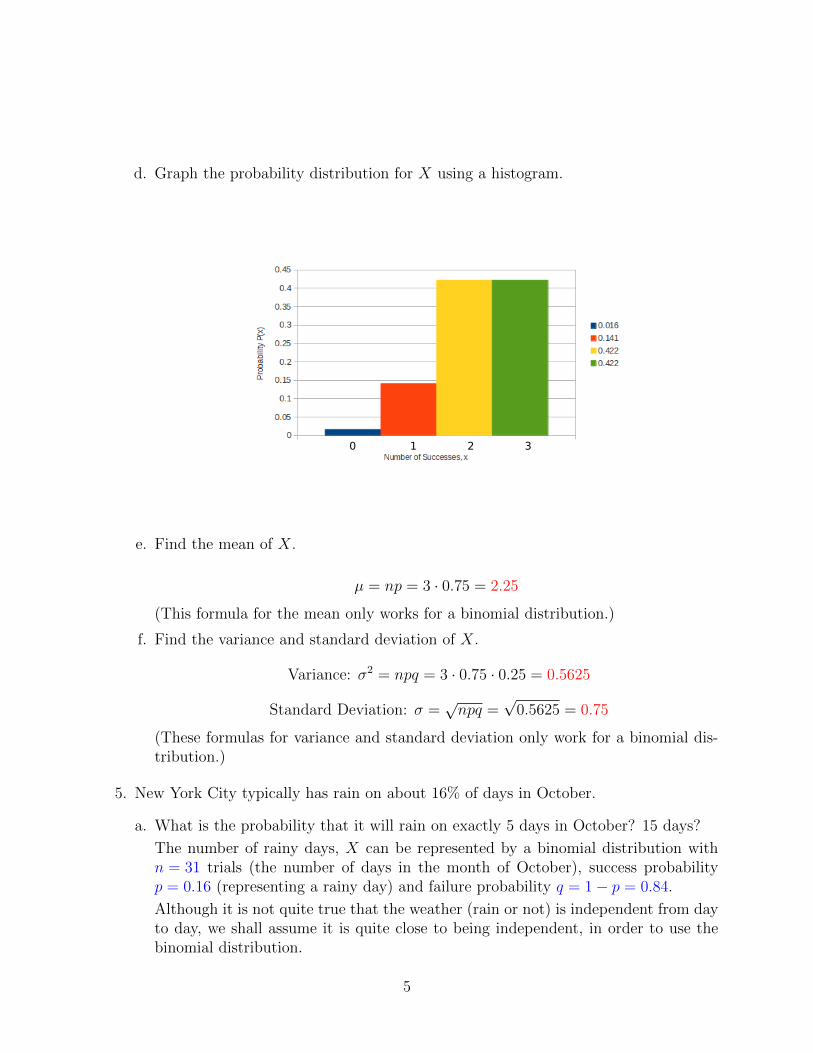
d. Graph the probability distribution for X using a histogram.
0 1 2 3
e. Find the mean of X.
µ = np = 3 · 0.75 = 2.25
(This formula for the mean only works for a binomial distribution.)
f. Find the variance and standard deviation of X.
Variance: σ2 = npq = 3 · 0.75 · 0.25 = 0.5625
Standard Deviation: σ =√npq =
√0.5625 = 0.75
(These formulas for variance and standard deviation only work for a binomial dis-tribution.)
5. New York City typically has rain on about 16% of days in October.
a. What is the probability that it will rain on exactly 5 days in October? 15 days?
The number of rainy days, X can be represented by a binomial distribution withn = 31 trials (the number of days in the month of October), success probabilityp = 0.16 (representing a rainy day) and failure probability q = 1− p = 0.84.
Although it is not quite true that the weather (rain or not) is independent from dayto day, we shall assume it is quite close to being independent, in order to use thebinomial distribution.
5
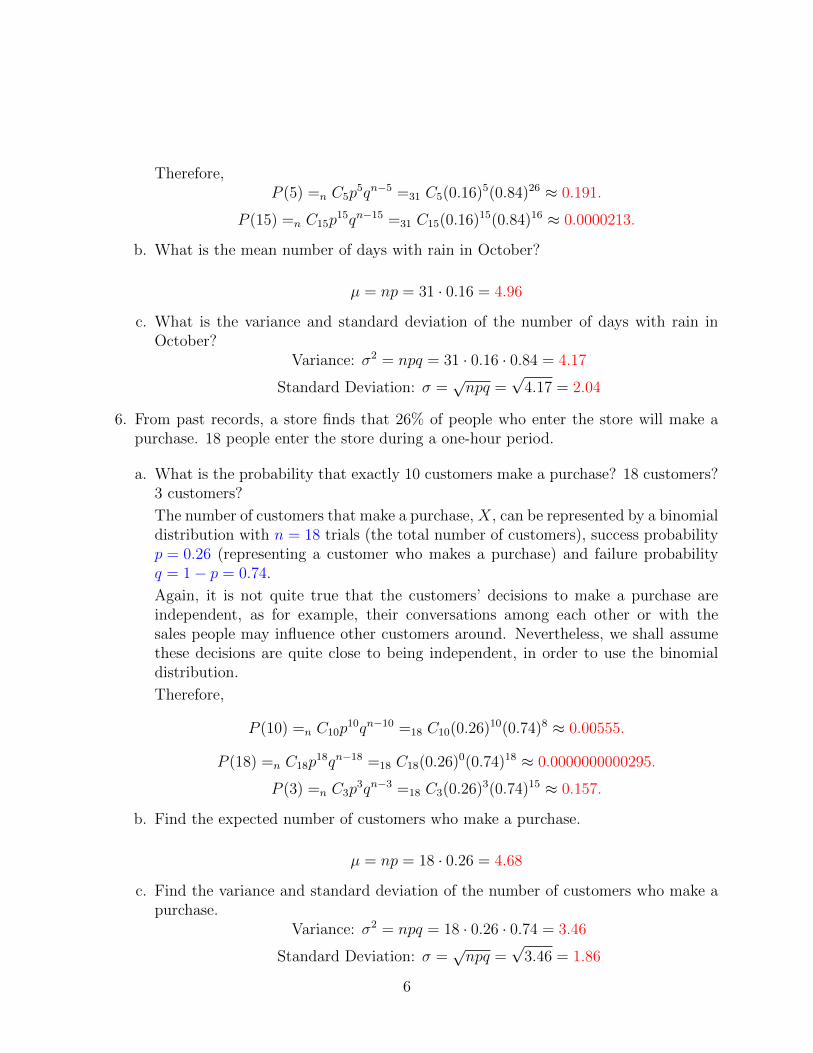
Therefore,P (5) =n C5p
5qn−5 =31 C5(0.16)5(0.84)26 ≈ 0.191.
P (15) =n C15p15qn−15 =31 C15(0.16)15(0.84)16 ≈ 0.0000213.
b. What is the mean number of days with rain in October?
µ = np = 31 · 0.16 = 4.96
c. What is the variance and standard deviation of the number of days with rain inOctober?
Variance: σ2 = npq = 31 · 0.16 · 0.84 = 4.17
Standard Deviation: σ =√npq =
√4.17 = 2.04
6. From past records, a store finds that 26% of people who enter the store will make apurchase. 18 people enter the store during a one-hour period.
a. What is the probability that exactly 10 customers make a purchase? 18 customers?3 customers?
The number of customers that make a purchase, X, can be represented by a binomialdistribution with n = 18 trials (the total number of customers), success probabilityp = 0.26 (representing a customer who makes a purchase) and failure probabilityq = 1− p = 0.74.
Again, it is not quite true that the customers’ decisions to make a purchase areindependent, as for example, their conversations among each other or with thesales people may influence other customers around. Nevertheless, we shall assumethese decisions are quite close to being independent, in order to use the binomialdistribution.
Therefore,
P (10) =n C10p10qn−10 =18 C10(0.26)10(0.74)8 ≈ 0.00555.
P (18) =n C18p18qn−18 =18 C18(0.26)0(0.74)18 ≈ 0.0000000000295.
P (3) =n C3p3qn−3 =18 C3(0.26)3(0.74)15 ≈ 0.157.
b. Find the expected number of customers who make a purchase.
µ = np = 18 · 0.26 = 4.68
c. Find the variance and standard deviation of the number of customers who make apurchase.
Variance: σ2 = npq = 18 · 0.26 · 0.74 = 3.46
Standard Deviation: σ =√npq =
√3.46 = 1.86
6