Solubility enhancement of mefenamic acid by inclusion ...
15
HAL Id: hal-03161350 https://hal.archives-ouvertes.fr/hal-03161350 Submitted on 6 Mar 2021 HAL is a multi-disciplinary open access archive for the deposit and dissemination of sci- entific research documents, whether they are pub- lished or not. The documents may come from teaching and research institutions in France or abroad, or from public or private research centers. L’archive ouverte pluridisciplinaire HAL, est destinée au dépôt et à la diffusion de documents scientifiques de niveau recherche, publiés ou non, émanant des établissements d’enseignement et de recherche français ou étrangers, des laboratoires publics ou privés. Solubility enhancement of mefenamic acid by inclusion complex with β -cyclodextrin: in silico modelling, formulation, characterisation, and in vitro studies Dounia Sid, Milad Baitiche, Zineb Elbahri, Ferhat Djerboua, Mokhtar Boutahala, Zouhair Bouaziz, Marc Le Borgne To cite this version: Dounia Sid, Milad Baitiche, Zineb Elbahri, Ferhat Djerboua, Mokhtar Boutahala, et al.. Solubility enhancement of mefenamic acid by inclusion complex with β -cyclodextrin: in silico modelling, formu- lation, characterisation, and in vitro studies. Journal of Enzyme Inhibition and Medicinal Chemistry, Informa Healthcare, 2021, 36 (1), pp.605-617. 10.1080/14756366.2020.1869225. hal-03161350
Transcript of Solubility enhancement of mefenamic acid by inclusion ...
HAL Id: hal-03161350https://hal.archives-ouvertes.fr/hal-03161350
Submitted on 6 Mar 2021
HAL is a multi-disciplinary open accessarchive for the deposit and dissemination of sci-entific research documents, whether they are pub-lished or not. The documents may come fromteaching and research institutions in France orabroad, or from public or private research centers.
L’archive ouverte pluridisciplinaire HAL, estdestinée au dépôt et à la diffusion de documentsscientifiques de niveau recherche, publiés ou non,émanant des établissements d’enseignement et derecherche français ou étrangers, des laboratoirespublics ou privés.
Solubility enhancement of mefenamic acid by inclusioncomplex with β-cyclodextrin: in silico modelling,
formulation, characterisation, and in vitro studiesDounia Sid, Milad Baitiche, Zineb Elbahri, Ferhat Djerboua, Mokhtar
Boutahala, Zouhair Bouaziz, Marc Le Borgne
To cite this version:Dounia Sid, Milad Baitiche, Zineb Elbahri, Ferhat Djerboua, Mokhtar Boutahala, et al.. Solubilityenhancement of mefenamic acid by inclusion complex with β-cyclodextrin: in silico modelling, formu-lation, characterisation, and in vitro studies. Journal of Enzyme Inhibition and Medicinal Chemistry,Informa Healthcare, 2021, 36 (1), pp.605-617. �10.1080/14756366.2020.1869225�. �hal-03161350�
Full Terms & Conditions of access and use can be found athttps://www.tandfonline.com/action/journalInformation?journalCode=ienz20
Journal of Enzyme Inhibition and Medicinal Chemistry
ISSN: (Print) (Online) Journal homepage: https://www.tandfonline.com/loi/ienz20
Solubility enhancement of mefenamic acid byinclusion complex with β-cyclodextrin: in silicomodelling, formulation, characterisation, andin vitro studies
Dounia Sid , Milad Baitiche , Zineb Elbahri , Ferhat Djerboua , MokhtarBoutahala , Zouhair Bouaziz & Marc Le Borgne
To cite this article: Dounia Sid , Milad Baitiche , Zineb Elbahri , Ferhat Djerboua , MokhtarBoutahala , Zouhair Bouaziz & Marc Le Borgne (2021) Solubility enhancement of mefenamic acidby inclusion complex with β-cyclodextrin: in�silico modelling, formulation, characterisation, andin vitro studies, Journal of Enzyme Inhibition and Medicinal Chemistry, 36:1, 605-617
To link to this article: https://doi.org/10.1080/14756366.2020.1869225
© 2021 The Author(s). Published by InformaUK Limited, trading as Taylor & FrancisGroup.
View supplementary material
Published online: 08 Feb 2021. Submit your article to this journal
View related articles View Crossmark data
ORIGINAL ARTICLE
Solubility enhancement of mefenamic acid by inclusion complex withb-cyclodextrin: in silico modelling, formulation, characterisation, andin vitro studies
Dounia Sida , Milad Baitichea , Zineb Elbahrib , Ferhat Djerbouaa, Mokhtar Boutahalac ,Zouhair Bouazizd and Marc Le Borgned,e
aD�epartement de G�enie des Proc�ed�es, Facult�e de Technologie, Laboratoire de Pr�eparation, Modification et Applications des Mat�eriauxPolym�eriques Multiphasiques, Universit�e Ferhat Abbas S�etif-1, S�etif, Alg�erie; bFaculty of Exact Sciences, Laboratory of Materials and Catalysis,Djillali Liab�es University of Sidi Bel Abb�es, Sidi Bel Abb�es, Algeria; cD�epartement de G�enie des Proc�ed�es, Facult�e de Technologie, Laboratoire deG�enie des Proc�ed�es Chimiques, Universit�e Ferhat Abbas S�etif-1, S�etif, Alg�erie; dEA 4446 Bioactive Molecules and Medicinal Chemistry, SFR Sant�eLyon-Est CNRS UMS3453 – INSERM US7, Universit�e Claude Bernard Lyon 1, Univ Lyon, Lyon, France; eCentre de Recherche en Canc�erologie deLyon, Centre L�eon B�erard, Small Molecules for Biological Targets Team, CNRS 5286, INSERM 1052, Universit�e Claude Bernard Lyon 1, Univ Lyon,Lyon, France
ABSTRACTThe aim of this study was to prepare and characterise inclusion complexes of a low water-soluble drug,mefenamic acid (MA), with b-cyclodextrin (b-CD). First, the phase solubility diagram of MA in b-CD wasdrawn from 0 to 21� 10�3 M of b-CD concentration. A job’s plot experiment was used to determine thestoichiometry of the MA:b-CD complex (2:1). The stability of this complex was confirmed by molecularmodelling simulation. Three methods, namely solvent co-evaporation (CE), kneading (KN), and physicalmixture (PM), were used to prepare the (2:1) MA:b-CD complexes. All complexes were fully characterised.The drug dissolution tests were established in simulated liquid gastric and the MA water solubility at pH1.2 from complexes was significantly improved. The mechanism of MA released from the b-CD complexeswas illustrated through a mathematical treatment. Finally, two in vitro experiments confirmed the interestto use a (2:1) MA:b-CD complex.
ARTICLE HISTORYReceived 18 November 2020Revised 21 December 2020Accepted 22 December 2020
KEYWORDSMefenamic acid;b-cyclodextrin inclusioncomplexes; solubility;characterisation;in vitro studies
Introduction
The access of drugs to biological targets is essential for producingbiological effect(s) in living organisms. Globally physicochemicalproperties and absorption, distribution, metabolism, elimination(ADME) parameters of a drug substance are essential to ensurethe accessibility to target(s)1. Moreover, only the free part of thedrug substance diffuses in tissues from the blood and then canaccess the active binding site of the desired target. Among allparameters to control for a successful treatment, an acceptablelevel of drug substance solubility is required. In the case of lowsolubility drug substances, inclusion complexes can be an interest-ing alternative to facilitate drug administration. Additionally, in sil-ico methods were also developed to optimise this approach andthen improve the use of low solubility drug substances2.
Actually, many efficiency issues caused by low solubility drugsare highlighted in recent works, for instance, according to Kalepuand Nekkanti3, more than 80% of drugs are sold as tablets, inwhich 40% have low water solubility. The same study illustratesmore serious situation concerning R&D drug candidates, in which90% could fail due to low solubility problems. However, toimprove the dissolution profile of poorly soluble drugs, various
approaches are proposed such as particle size reduction4, drugdispersion in carrier5, modification of crystal habit6, use of surfac-tant7, self-emulsifying formulations8, and complexation with cyclo-dextrins (CDs)9. This later is one of the frontier techniques that areemployed in almost 56 pharmaceutical products10, where theseoligomers obtained from enzymatic degradation of starch areexploited. These cycloamyloses are composed of D-glucopyrano-side units linked by a(1 ! 4)-glycosidic bonds. Typical native CDsinvolve six, seven, or eight glucose units, denoted a-, b- andc-CDs, respectively. CDs belong to cage molecules family due totheir hydrophobic cavity structure, and hydrophilic outer surface.Indeed, the most significant characteristic of CDs is their abilityto form inclusion complexes with various molecules throughhost–guest interactions11,12. These inclusion complexes have beenrevealed to improve the apparent stability, solubility, dissolutionrate, and bioavailability of the guest bioactive molecules13–16.Among various CDs, b-CD is the most frequently used in pharma-ceutical excipient due to its wide availability, low cost, excellentbiocompatibility, preferred cavity dimension, and wide regulatoryacceptance17. We note that two other naturally occurring CDs (a-and c-CDs) are more cost-effective compared to b-CD. Moreover, a
CONTACT Milad Baitiche [email protected] Laboratoire de Pr�eparation, Modification et Applications des Mat�eriaux Polym�eriques Multiphasiques,D�epartement de G�enie des Proc�ed�es, Facult�e de Technologie, Universit�e Ferhat Abbas S�etif-1, Boulevard du Sipion, S�etif 19000, Alg�erie; Marc Le Borgne, [email protected] Facult�e de Pharmacie – ISPB, EA 4446 Bioactive Molecules and Medicinal Chemistry, Universit�e Claude Bernard Lyon 1, 8 avenueRockefeller, Lyon cedex 8, 69373, France
Supplemental data for this article can be accessed here.
� 2021 The Author(s). Published by Informa UK Limited, trading as Taylor & Francis Group.This is an Open Access article distributed under the terms of the Creative Commons Attribution License (http://creativecommons.org/licenses/by/4.0/), which permits unrestricted use,distribution, and reproduction in any medium, provided the original work is properly cited.
JOURNAL OF ENZYME INHIBITION AND MEDICINAL CHEMISTRY2021, VOL. 36, NO. 1, 605–617https://doi.org/10.1080/14756366.2020.1869225
recent report provided that a b-CD derivative known as thehydroxypropyl-b-CD, even though it has a better solubility thanb-CD, is undesirable due to its toxicity18.
Mefenamic acid (MA), 2-[(2,3-dimethylphenyl)amino]benzoicacid, was selected as a drug model for our study. It is a potentnon-steroidal anti-inflammatory drug (NSAID) of the anthranilicacid class. Moreover, it shows preferential inhibition of cyclo-oxy-genase-2 (COX-2), inhibiting the action of prostaglandin synthe-tase19–21. Furthermore, MA is approved by the food and drugadministration (FDA) in 196522. Due to its low solubility in waterand high permeability in the gastrointestinal (GI) tract, MA is clas-sified in the biopharmaceutics classification system (BCS) as class IIdrug23,24. It is widely indicated for inflammatory diseases and alsoas an analgesic for the treatment of musculoskeletal, osteoarthritis,rheumatoid arthritis, menstrual symptoms, and headach19,25–27.Furthermore, MA has been shown to have therapeutic effects inneurodegenerative disease (e.g. Alzheimer disease)28. In addition,MA, like other anti-inflammatory drugs, is emerging as new che-mopreventive agents against cancer29. However, due to its lowwater solubility, high doses (250 or 500mg twice a day adminis-tration) and side effects, mainly related to GI adverse consequen-ces, including bleeding, ulceration or colitis lesions, andsteatorrhoea, which can be sometimes fatal, made the use of MAlimited19,30–32.
On the other hand, the study of the formation and the stabilityof guest–host complexes can be assisted by molecular modellingmethods, like docking and quantum mechanics (QM), which maymimic the behaviour of inclusion systems at the atomistic level33.These modelling methods have been playing an important role inproviding 3D simulation structures in order to understand themechanism of CDs inclusion formation systems, assist the formula-tion design and simplify the formulation screening procedures fol-lowed by the delivery studies34,35.
In this study, we investigated the complexation of MA with b-CDfor improving both solubility and dissolution rate. We were motivatedby the fact that b-CD complexation enhanced the solubility of otheracidic NSAIDs, including tolfenamic acid36, niflumic acid37, indometh-acin38, and ketoprofen39. Some (1:1) complexes’ types of MA:b-CDhave been previously developed by authors using precipitation40,41.or kneading (KN)42 methods In these studies, the molar concentrationof b-CD did not exceed 10mM, the solubility phase diagram was ALtype and so the proposed MA:b-CD complex ratio was 1:1 of MAand b-CD. In these previous works40–42, the Job’s plot method wasnot also investigated. In this work, phase solubility diagram of MAusing increasingly high b-CD concentrations (from 0 to 21� 10�3 M),job’s plot and molecular modelling simulation were associated tostudy MA:b-CD inclusion complexes. Three methods were carried outusing solvent co-evaporation (CE), KN, and physical mixture (PM) forthe preparation of these complexes. Then selective physicochemicaldeterminations based on Fourier-transform infra-red spectroscopy(FTIR), differential scanning calorimetry (DSC), X-ray powder diffraction(XRPD), and scanning electron microscopy (SEM) were performed tocharacterise all complexes. In vitro aqueous solubility and dissolutionrate profiles of the complexes were also performed. Finally, theresulting inclusion complexes were evaluated in vitro using proteindenaturation and membrane stabilisation methods.
Materials and methods
Chemicals
MA, C15H15NO2, molecular weight: 241.29 g/mol was a gift fromSALEM Laboratories El- Eulma, Algeria. b-CD (C42H70O35, molecular
weight: 1134.00 g/mol) was purchased from Sigma-Aldrich, St.Louis, MO. All other chemicals used were of analytical grades. Allreagents were used as received.
Phase solubility studies
The phase solubility investigation was performed in order to findout the apparent stability constant (K) that represents the affinityof MA to the b-CD in water. For this, studies were carried out intriplicate following the Higuchi and Connors method43. Sampleswere prepared by mixing in sealed 50ml Erlenmeyer flasks excessof MA (4.11� 10�3 g) with 30ml of aqueous solutions containingsuccessively increasing concentrations (0, 3, 6, 9, 12, 15, 18, and21)�10�3M of b-CD. Then, the solutions were kept under agita-tion for 5 d at 25 �C. The solutions were then filtered through0.45 lm filter pore size and the filtrate was assayed for drug con-centration by ultra-violet spectroscopy (SHIMADZU UV-1800) at282 nm where no absorbance due to the b-CD was observed.
Determination of complex stoichiometry
The continuous variation method otherwise known as Job’s plotwas used to ascertain the stoichiometry for MA:b-CD complex-ation16. The experiments were carried out in duplicate by mixingtwo equimolar solutions (10�3M) of b-CD (in water) and MA (inethanol) in different molar ratio from 0 to 1 without variation ofthe final volume. After 7 d of stirring at 25 �C, solutions were ana-lysed by ultra-violet spectroscopy at 282 nm. The absorbencychanges (DAbs¼Abs-Abs0) of MA in the presence (Abs) andabsence (Abs0) of b-CD were plotted versus R, where R¼ [MA]/([MA]þ [b-CD]). The Job’s plot showed a maximum at a specificmolar ratio indicating the stoichiometry of the complexes.
In silico molecular modelling studies
The molecular docking simulations were carried out in the Glide(grid-based ligand docking) application implemented in theMaestro 9.3 software (Schrodinger, LLC, New York, 2012)44,45. Thecrystal structure of b-CD was obtained from the Protein Data BankPDB (ID: 1BFN). For adding the missing hydrogen, we used theProtein Preparation Wizard. Then, b-CD crystal structure was sepa-rated from a-amylase, followed by energy minimisation at RMSDconvergence (0.30 Å with OPLS_2005 as a force field). In order toobtain possible MA conformers, the MA structure was designedusing the Maestro structure builder and optimised with LigPreptool. To get the appropriate ionisation state, LigPrep was run withthe Epik option set version 3.7 (Schr€odinger) to generate apossible state at pH 7.4. Finally, the geometrical optimisation wasperformed using the OPLS-2005 force field. The “Generate Grid”sub-application of the Glide tool allowed the generation of thegrid by selecting the entire b-CD structure as the receiving site tolocate the coordinates of the centre of the targeted receptor cav-ity. Then, the generated grid was configured as the MA dockingreceiver using the “extra-precision” (XP) flexible docking method,from the Glide tool. The binding affinity “DG” was calculated usingthe Prime MM-GBSA module version 4.5 (Schr€odinger). The samework was done for the 2:1MA:b-CD inclusion complex.
On the other hand, in order to study the MA:b-CD interactionin the 1:2 complex, the b-CD structure was extracted from thecrystallographic parameters. This last was provided by the struc-tural database system of the Cambridge Crystallographic DataCentre and optimised by minimising energy to get the most
606 D. SID ET AL.
stable state. These results were obtained using the MaterialsStudio 6.0 software44. Then, the resulting structure was simulatedin the Maestro 9.3 software45. We followed the same steps for thefirst two conjugates.
Once the docking search was completed, the conformationswere applied with the best binding energy. The complex inclusionstructures resulted from the docking calculations were computedwith Materials Studio using the Dmol3 method with the database(B3LYP/6-31g (d, p))46,47. This last allowed the computation of thedescriptor dielectric energy (solvation). We noted that this lastprovided more information on the solubility of inclusion com-plexes between MA with b-CD.
Preparation of solid complexes
Solvent co-evaporation methodMA (0.723 g, 0.003cmol) and b-CD (1.700 g, 0.0015mol) were dis-solved in ethanol (100ml), and distilled water (100ml), respect-ively. Then, these solutions were mixed in a flask and stirred at600 rpm for 2 h at 50 �C. The obtained clear solution was evapo-rated at 45 �C using a rotary evaporator (B€UCHI, rotavapor R-215)rolling at 100 rpm. The solid residue was further dried at 50 �C for24 h and stored in bottles and kept in the refrigerator.
Kneading methodThe calculated and exactly weighed amounts of b-CD (1.700 g)were wetted with a minimum water volume (1ml) and mixed in aceramic mortar to get a homogeneous paste. Then, MA (0.723 g)was progressively introduced; while KN, a small quantity of ammo-nium hydroxide (0.5ml of 35% solution), was added to assist thedissolution of MA. The mixture was then blended for 1 h. Duringthis process, a small quantity (1.5ml) of water was added to themixture in order to keep an appropriate consistency. The pastewas dried in an oven at 50 �C for 24 h then grinded into a finepowder and stored in bottles and kept in the refrigerator.
Physical mixtureThe PM was prepared by simple blending for 30min in a ceramicmortar pulverised powders (0.723 g of MA and 1.700 g of b-CD).The resulting material was sieved and stored in bottles and keptin the refrigerator.
Percentage practical yieldThe percentage practical yield helps in selecting the appropriatemethod of preparation and it gives efficiency of any method. So,these were determined to know about percent practical yield (PY)from the following equation10:
PYð%Þ ¼ Practical Mass Inclusion complexð ÞTheoretical Mass Drugþ Carrierð Þ � 100 (1)
Percentage drug extractThe percentage drug extract was determined by extraction of theMA from the complexes and its amount measured using aSHIMADZU-1800 UV–visible spectrophotometer. Therefore, aknown amount of each complex (25mg) was placed in a 25mlvolumetric flask, and ethanol was then added. The mixture wasshaken for 5 h. Hence, the MA extractable amount was obtainedthrough its UV photometric analysis (kmax¼ 282 nm) using the
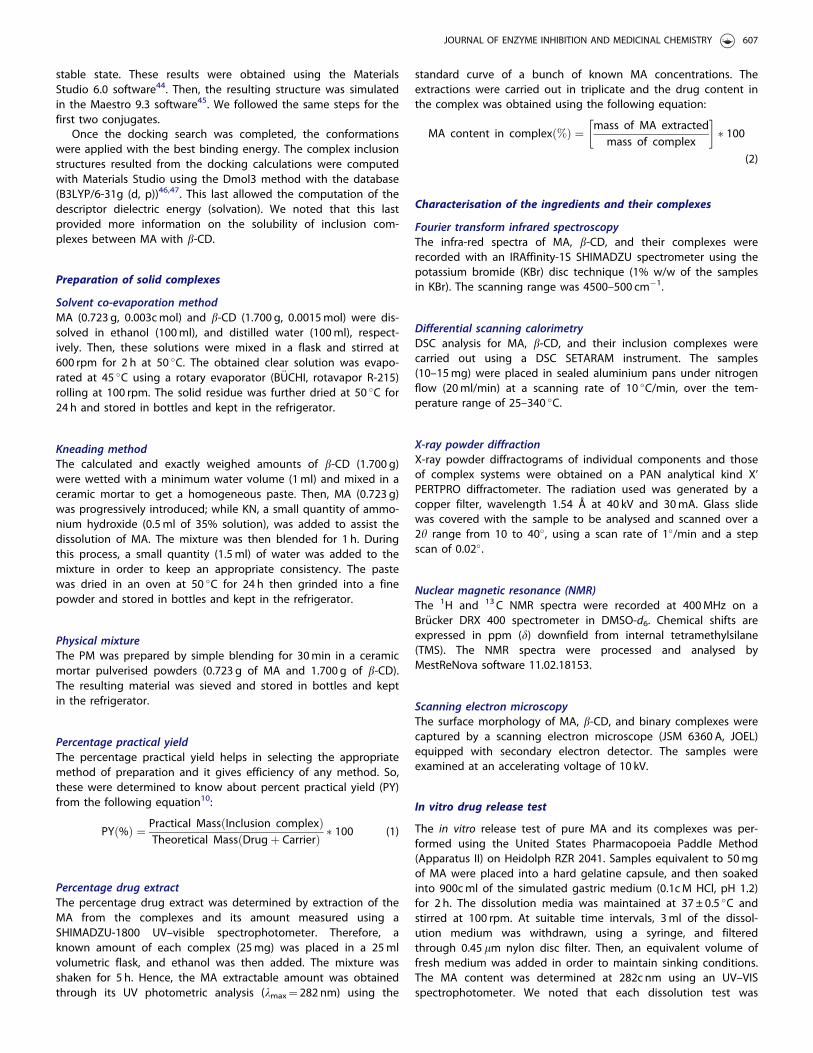
standard curve of a bunch of known MA concentrations. Theextractions were carried out in triplicate and the drug content inthe complex was obtained using the following equation:
MA content in complexð%Þ ¼ mass of MA extractedmass of complex
� �� 100
(2)
Characterisation of the ingredients and their complexes
Fourier transform infrared spectroscopyThe infra-red spectra of MA, b-CD, and their complexes wererecorded with an IRAffinity-1S SHIMADZU spectrometer using thepotassium bromide (KBr) disc technique (1% w/w of the samplesin KBr). The scanning range was 4500–500 cm�1.
Differential scanning calorimetryDSC analysis for MA, b-CD, and their inclusion complexes werecarried out using a DSC SETARAM instrument. The samples(10–15mg) were placed in sealed aluminium pans under nitrogenflow (20ml/min) at a scanning rate of 10 �C/min, over the tem-perature range of 25–340 �C.
X-ray powder diffractionX-ray powder diffractograms of individual components and thoseof complex systems were obtained on a PAN analytical kind X’PERTPRO diffractometer. The radiation used was generated by acopper filter, wavelength 1.54 Å at 40 kV and 30mA. Glass slidewas covered with the sample to be analysed and scanned over a2h range from 10 to 40�, using a scan rate of 1�/min and a stepscan of 0.02�.
Nuclear magnetic resonance (NMR)The 1H and 13C NMR spectra were recorded at 400MHz on aBr€ucker DRX 400 spectrometer in DMSO-d6. Chemical shifts areexpressed in ppm (d) downfield from internal tetramethylsilane(TMS). The NMR spectra were processed and analysed byMestReNova software 11.02.18153.
Scanning electron microscopyThe surface morphology of MA, b-CD, and binary complexes werecaptured by a scanning electron microscope (JSM 6360 A, JOEL)equipped with secondary electron detector. The samples wereexamined at an accelerating voltage of 10 kV.
In vitro drug release test
The in vitro release test of pure MA and its complexes was per-formed using the United States Pharmacopoeia Paddle Method(Apparatus II) on Heidolph RZR 2041. Samples equivalent to 50mgof MA were placed into a hard gelatine capsule, and then soakedinto 900cml of the simulated gastric medium (0.1cM HCl, pH 1.2)for 2 h. The dissolution media was maintained at 37 ± 0.5 �C andstirred at 100 rpm. At suitable time intervals, 3ml of the dissol-ution medium was withdrawn, using a syringe, and filteredthrough 0.45 lm nylon disc filter. Then, an equivalent volume offresh medium was added in order to maintain sinking conditions.The MA content was determined at 282c nm using an UV–VISspectrophotometer. We noted that each dissolution test was
JOURNAL OF ENZYME INHIBITION AND MEDICINAL CHEMISTRY 607
carried out in duplicate. The kinetics of the MA released frominclusion complexes were determined by fitting the release pro-files to the first order (3), Korsmeyer–Peppas (4) and Higuchi (5)theoretical models:
Ft ¼ 1� exp �K1 � tð Þ (3)
where Ft is the fraction of drug dissolved in time t and K1 is thefirst order release constant.
Mt
Mi¼ KKPtn (4)
where Mt/Mi is the fractional release of drug into the dissolutionmedia, Mt is the release accumulation, and Mi is the initial drugamount. KKP is the Korsmeyer–Peppas constant, and n is therelease exponent indicative of the drug release mechanism.
Ft ¼ KHt0:5 þ a (5)
where KH is the Higuchi release constant and a is a constant char-acterising the initial drug release.
Then, the selection of the best fit model is based on theregression coefficient value R2 which should be close to one48.
In vitro anti-inflammatory activities
Protein denaturation methodThe binary inclusion complexes were evaluated by using inhibitionof bovine serum albumin (BSA) denaturation technique. This assaywas done according to Mizushima and Kobayashi49 with minormodification. The MA drug and tested complexes (1ml) containing100 mg/mL of drug were mixed with 1ml of 1% w/v BSA in phos-phate buffer (pH 6.4) and incubated at 27 ± 1 �C for 15min. Thedenaturation was induced by maintaining the reaction mixture at75 ± 1 �C in a water bath for 10min. Then, after cooling, the tur-bidity was measured at 660 nm (kmax BSA). The percentage inhib-ition of denaturation can be calculated from reference where nodrug was added. We noted that each experiment was done intriplicate and an average value was taken.
Membrane stabilisation methodThe binary inclusion complexes were assayed by using human redblood cell (HRBC) membrane stabilisation method50. For this, freshwhole human blood (10ml) was collected and transferred to hep-arinised centrifuge tubes. The tubes were centrifuged for 5min at3000 rpm, and washed three times with an equal volume of nor-mal saline. The volume of the blood was measured and reconsti-tuted as a 40% v/v suspension with isotonic buffer solution(10mM sodium phosphate buffer pH 7.4). The activity of MA fromall drug-carrier systems was analysed at the concentration of100c mg/ml with the same dose of standard drug of pure MA.
Results and discussion
Phase solubility studies
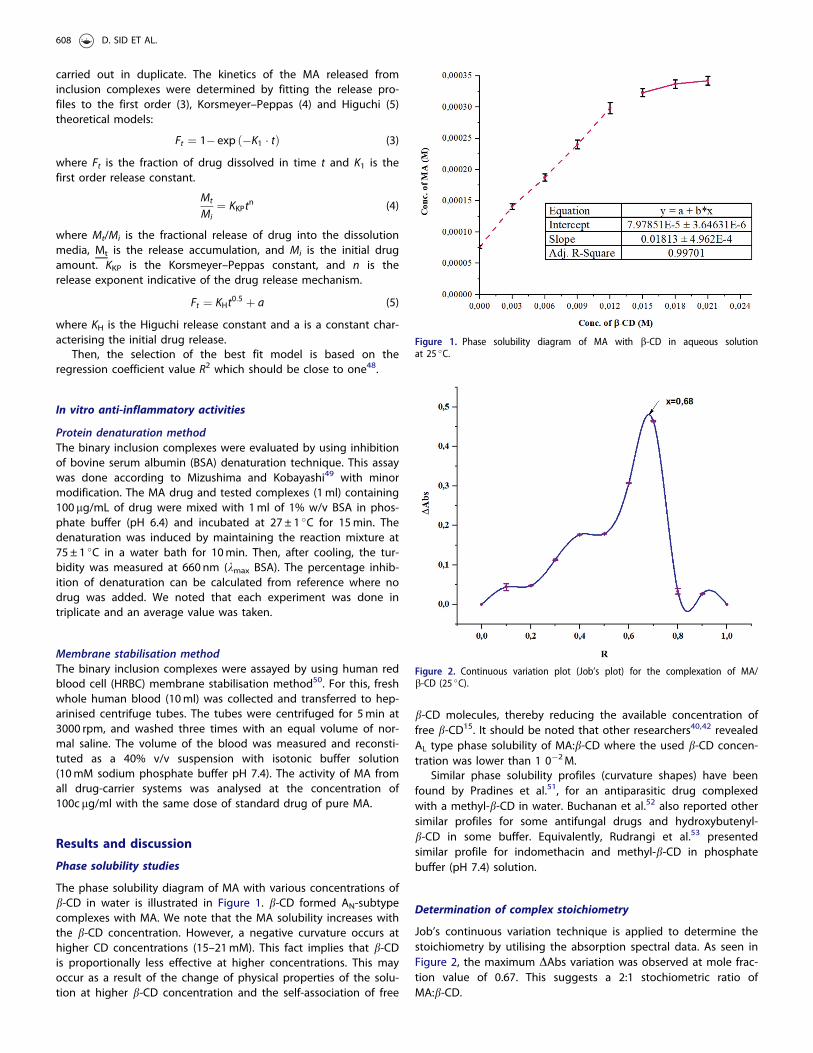
The phase solubility diagram of MA with various concentrations ofb-CD in water is illustrated in Figure 1. b-CD formed AN-subtypecomplexes with MA. We note that the MA solubility increases withthe b-CD concentration. However, a negative curvature occurs athigher CD concentrations (15–21mM). This fact implies that b-CDis proportionally less effective at higher concentrations. This mayoccur as a result of the change of physical properties of the solu-tion at higher b-CD concentration and the self-association of free
b-CD molecules, thereby reducing the available concentration offree b-CD15. It should be noted that other researchers40,42 revealedAL type phase solubility of MA:b-CD where the used b-CD concen-tration was lower than 1 0�2M.
Similar phase solubility profiles (curvature shapes) have beenfound by Pradines et al.51, for an antiparasitic drug complexedwith a methyl-b-CD in water. Buchanan et al.52 also reported othersimilar profiles for some antifungal drugs and hydroxybutenyl-b-CD in some buffer. Equivalently, Rudrangi et al.53 presentedsimilar profile for indomethacin and methyl-b-CD in phosphatebuffer (pH 7.4) solution.
Determination of complex stoichiometry
Job’s continuous variation technique is applied to determine thestoichiometry by utilising the absorption spectral data. As seen inFigure 2, the maximum DAbs variation was observed at mole frac-tion value of 0.67. This suggests a 2:1 stochiometric ratio ofMA:b-CD.
Figure 1. Phase solubility diagram of MA with b-CD in aqueous solutionat 25 �C.
Figure 2. Continuous variation plot (Job’s plot) for the complexation of MA/b-CD (25 �C).
608 D. SID ET AL.
In silico molecular modelling studies
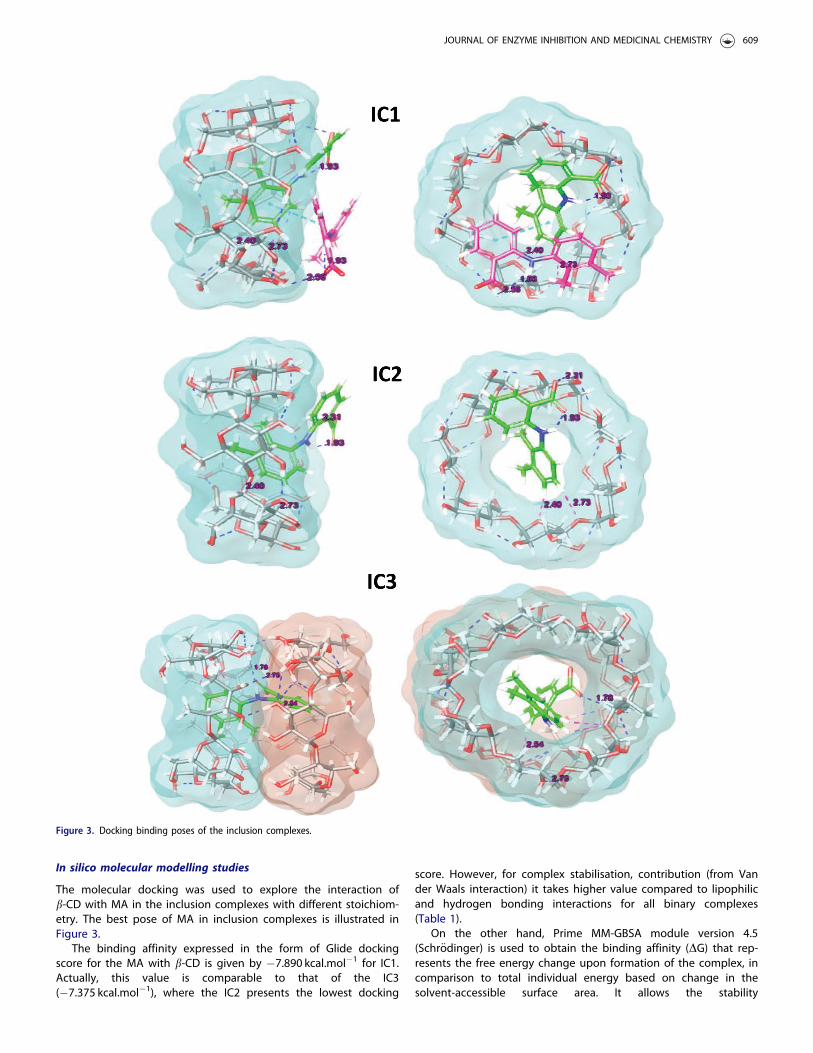
The molecular docking was used to explore the interaction ofb-CD with MA in the inclusion complexes with different stoichiom-etry. The best pose of MA in inclusion complexes is illustrated inFigure 3.
The binding affinity expressed in the form of Glide dockingscore for the MA with b-CD is given by �7.890 kcal.mol�1 for IC1.Actually, this value is comparable to that of the IC3(�7.375 kcal.mol�1), where the IC2 presents the lowest docking
score. However, for complex stabilisation, contribution (from Vander Waals interaction) it takes higher value compared to lipophilicand hydrogen bonding interactions for all binary complexes(Table 1).
On the other hand, Prime MM-GBSA module version 4.5(Schr€odinger) is used to obtain the binding affinity (DG) that rep-resents the free energy change upon formation of the complex, incomparison to total individual energy based on change in thesolvent-accessible surface area. It allows the stability
Figure 3. Docking binding poses of the inclusion complexes.
JOURNAL OF ENZYME INHIBITION AND MEDICINAL CHEMISTRY 609
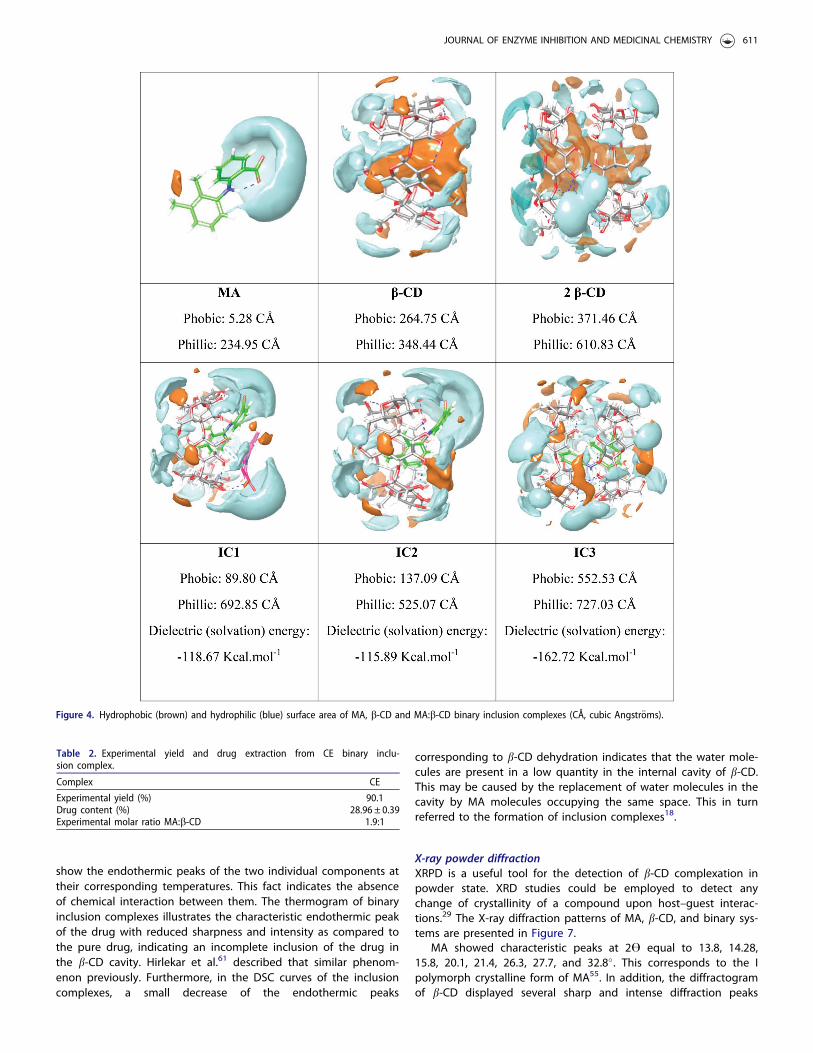
determination of binary inclusion complexes54. In fact, the DGbinding energy exhibits a similar behaviour as that of dockingscore calculations. The IC1 is the most stable complex(�37.698 kcal.mol�1) followed by IC3 (�35.995 kcal.mol�1), and IC2(�21.468 kcal.mol�1) (Table 1). The introduction of a second MAmolecule in the primary complex will enhance stability (Figure 3).This is a consequence of further hydrogen electrostatic interactionand improved filling of the b-CD cavity. Figure 4 provides moredetails about the hydrophobic and hydrophilic surface areas ofMA, b-CD, and the binary complexes. From Figure 4, the hydro-philic area increases upon formation of IC1. In fact, higher polarsurface area of the supramolecular inclusion complex improvedthe MA solubility.
Preparation of solid complexes and loading
According to job’s plot results and the molecular docking observa-tions (2:1) MA:b-CD complexes were prepared by PM, KN, and CEmethods. In all inclusion methods, loss of complexes’ mass wasobserved. In CE method, large volumes of organic solvent andlonger process cause more important loss of mass. So an experi-mental yield was calculated (Table 2) for CE. With an experimentalloading value of 28.96%, the ratio of (2:1) MA:b-CD complex wasalso confirmed.
Characterisation of the ingredients and their complexes
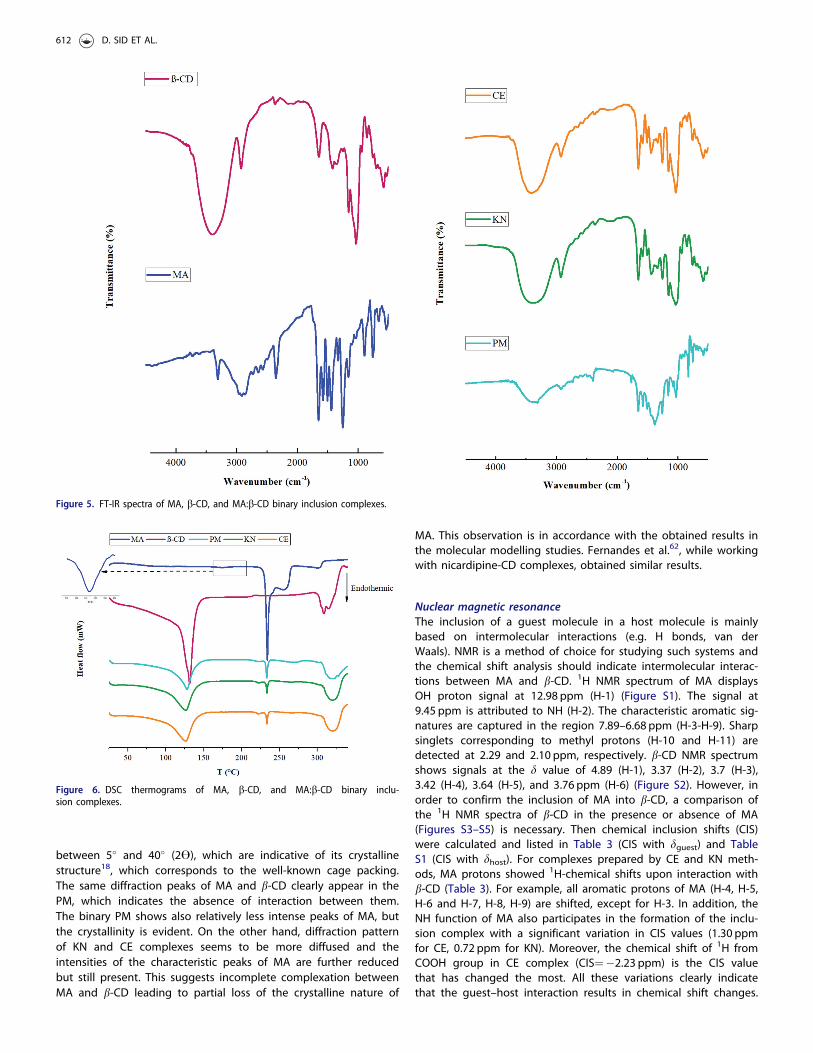
Fourier-transform infrared spectroscopyIn order to examine the plausible interactions between MA andb-CD in the solid state, the IR spectra of binary complexes arecompared to those of the PM and the pure drug (Figure 5). Thespectrum of pure drug shows many intense and sharp absorptionbands. Actually, this fact is due to the different functional groupsexisting in MA, for instance: aromatic ring, carboxylic group, minegroup, and methyl group. In fact, the band recorded in the highwave numbers’ region can be used to distinguish the polymorphforms of MA. This very weak band at 3310 cm�1 is assigned toN�H stretching modes of the most stable polymorphism form Iof MA55. The band at 2915 cm�1 is attributed to the �(O�H) out-of-phase mode. Very intense and sharp band (recorded at1649 cm�1) is due to stretching mode �(C¼O) of the carboxylicgroup. The bands due to the �(C–C) stretching modes of the aro-matic rings are recorded between 1500 and 1450 cm�1, where theband due to the deformation mode d(N–H) of the amine group isrecorded at 1574 cm�1. The bands for the methyl group d(CH3)are recorded between 1470 and 1430 cm�1 and the band origi-nated from the �(C–N) stretching mode is recorded between 1160and 1250 cm�1. Bands due to out-of-plane deformations, d(N–H)and d(C–H), are recorded below 1000 cm�155.
FTIR spectrum of b-CD (Figure 5) shows that prominent absorp-tion band at 3393 cm�1 is due to the O-H stretching vibration. Afurther peak appearing in the region of 2800–3000 cm�1
represents the stretching vibrations of CH and CH2 groups. Thepeaks appearing at 1022 and 1162 cm�1 can be assigned to thestretching vibrations of C-OH and C-O-C groups of b-CD. The peakat 750 cm�1 also represents the pyranose ring vibration56. Finally,the peak at 650 cm�1 is due to the presence of water inb-CD cavity.
The FTIR spectrum of the PM imitates both peaks of MA andb-CD, which could be considered as simple superimposition of MAand b-CD spectra. Therefore, the presence of chemical incompati-bility among pure MA and b-CD is ruled out.
However, in the FTIR spectra of complexes prepared by CE andKN, MA bands are almost masked by the very intense and broadb-CD bands. The results indicate interactions of MA into the b-CDcavity. We notice that the CO band of MA at 1649 cm�1 is shiftedto 1656 cm�1 in CE spectrum and to 1647 cm�1 in KN spectrum.Also, the N-H band at 1574 cm�1 is 1586 cm�1 in CE spectrum and1577 cm�1 in KN spectrum. This is a usual phenomenon observedby researchers in synthesising the inclusion complexes betweenb-CD and a guest molecule38,57,58.
We can add that the inclusion of the MA molecule with its aro-matic rings into the electron rich cavity of the b-CD may amplifythe density of the electron cloud. This last can lead to an increasein energy and consequently higher IR frequency absorption. Thehydrogen bonding contacts and Van der Waals forces in com-plexes could also alter the microenvironment and eventually coulddecline the frequency between the inclusion complex and its con-stituent molecules57.
The broad hydroxyl band of pure b-CD at 3393 cm�1 is shiftedto higher frequency region in the FTIR spectra for the KN and CEcomplexes. This last can be considered as a good indication ofthe inclusion complex formation. Additionally, the aromatic C-Hand N-H deformation bands for binary complexes strongly driftedtowards lower wave number. Overall, the binary inclusion com-plexes did not display any new IR peaks signifying that no chem-ical bonds are formed with the obtained complexes.
Differential scanning calorimetric analysisThe DSC technique is significantly important to understand thecompatibility between the drug and CD in its complexes. Whenguest molecules are included in CD cavities, their melting, boiling,and sublimation points can shift to different temperatures or dis-appear18. The DSC thermograms for MA, b-CD, and binary systemsare depicted in Figure 6.
The DSC thermogram of MA shows two endodermic peaks at174 and 232 �C which correspond to the transition from form I–IIand to the fusion of form II, respectively. MA decomposes afterfusion and completely decarboxylates at 300 �C59. The thermalcurve of b-CD shows a loss of physical water starting from 50 �Cwith a strong endotherm at 130 �C, which is caused by the liber-ation of crystal water molecules from the cavity. However, thepeak corresponding to the decomposition process of b-CD isobserved around 310 �C60. The thermal curves of the complexes
Table 1. Prime MM-GBSA calculations.
DG values in Kcal.mol�1
Ratio(MA:b-CD) Binda Docking score Glide Lipob Glide vdwc Glide Hbondd Glide Emodel
1:1 (IC2) �21.468 �4.575 �2.179 �21.123 �0.042 �26.6122:1 (IC1) �37.698 �7.890 �3.454 �37.387 �0.202 �46.2621:2 (IC3) �35.995 �7.375 �3.139 �28.990 �0.160 �50.976afree energy of binding (Glide energy); bfree energy of binding from lipophilic binding; cfree energy of binding from van der Waalsenergy; dfree energy of binding from hydrogen bonding.
610 D. SID ET AL.
show the endothermic peaks of the two individual components attheir corresponding temperatures. This fact indicates the absenceof chemical interaction between them. The thermogram of binaryinclusion complexes illustrates the characteristic endothermic peakof the drug with reduced sharpness and intensity as compared tothe pure drug, indicating an incomplete inclusion of the drug inthe b-CD cavity. Hirlekar et al.61 described that similar phenom-enon previously. Furthermore, in the DSC curves of the inclusioncomplexes, a small decrease of the endothermic peaks
corresponding to b-CD dehydration indicates that the water mole-cules are present in a low quantity in the internal cavity of b-CD.This may be caused by the replacement of water molecules in thecavity by MA molecules occupying the same space. This in turnreferred to the formation of inclusion complexes18.
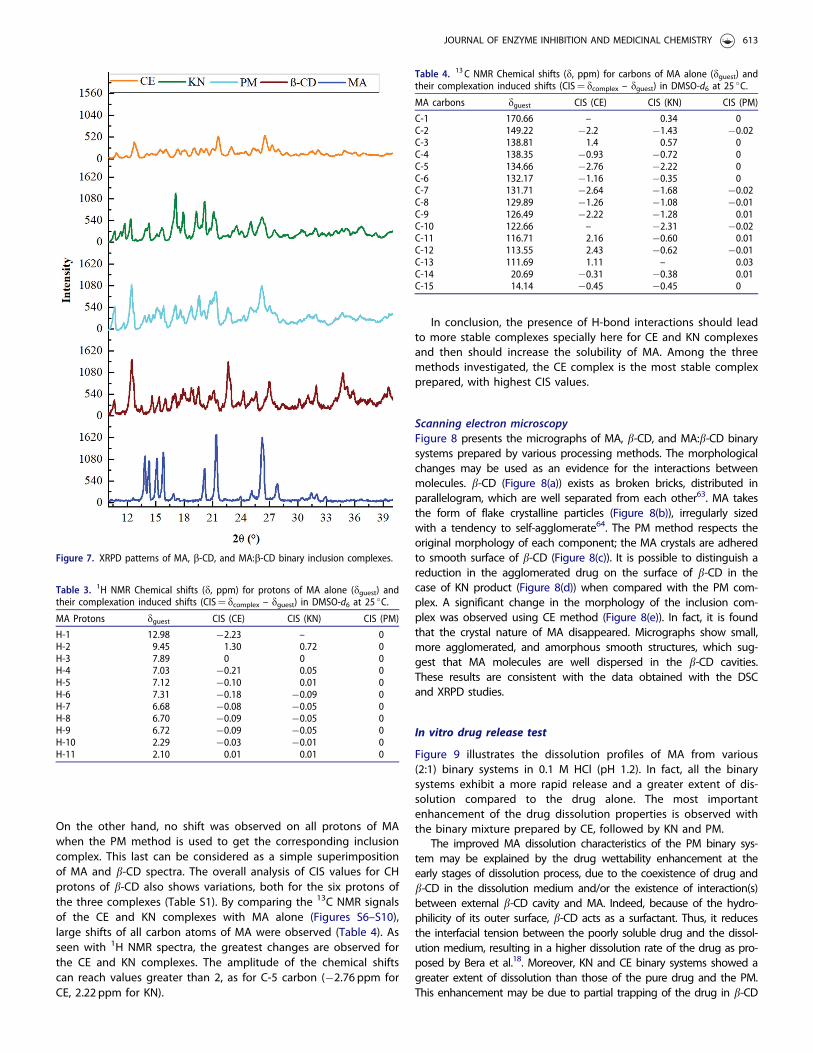
X-ray powder diffractionXRPD is a useful tool for the detection of b-CD complexation inpowder state. XRD studies could be employed to detect anychange of crystallinity of a compound upon host–guest interac-tions.29 The X-ray diffraction patterns of MA, b-CD, and binary sys-tems are presented in Figure 7.
MA showed characteristic peaks at 2� equal to 13.8, 14.28,15.8, 20.1, 21.4, 26.3, 27.7, and 32.8�. This corresponds to the Ipolymorph crystalline form of MA55. In addition, the diffractogramof b-CD displayed several sharp and intense diffraction peaks
Figure 4. Hydrophobic (brown) and hydrophilic (blue) surface area of MA, b-CD and MA:b-CD binary inclusion complexes (CÅ, cubic Angstr€oms).
Table 2. Experimental yield and drug extraction from CE binary inclu-sion complex.
Complex CE
Experimental yield (%) 90.1Drug content (%) 28.96 ± 0.39Experimental molar ratio MA:b-CD 1.9:1
JOURNAL OF ENZYME INHIBITION AND MEDICINAL CHEMISTRY 611
between 5� and 40� (2�), which are indicative of its crystallinestructure18, which corresponds to the well-known cage packing.The same diffraction peaks of MA and b-CD clearly appear in thePM, which indicates the absence of interaction between them.The binary PM shows also relatively less intense peaks of MA, butthe crystallinity is evident. On the other hand, diffraction patternof KN and CE complexes seems to be more diffused and theintensities of the characteristic peaks of MA are further reducedbut still present. This suggests incomplete complexation betweenMA and b-CD leading to partial loss of the crystalline nature of
MA. This observation is in accordance with the obtained results inthe molecular modelling studies. Fernandes et al.62, while workingwith nicardipine-CD complexes, obtained similar results.
Nuclear magnetic resonanceThe inclusion of a guest molecule in a host molecule is mainlybased on intermolecular interactions (e.g. H bonds, van derWaals). NMR is a method of choice for studying such systems andthe chemical shift analysis should indicate intermolecular interac-tions between MA and b-CD. 1H NMR spectrum of MA displaysOH proton signal at 12.98 ppm (H-1) (Figure S1). The signal at9.45 ppm is attributed to NH (H-2). The characteristic aromatic sig-natures are captured in the region 7.89–6.68 ppm (H-3-H-9). Sharpsinglets corresponding to methyl protons (H-10 and H-11) aredetected at 2.29 and 2.10 ppm, respectively. b-CD NMR spectrumshows signals at the d value of 4.89 (H-1), 3.37 (H-2), 3.7 (H-3),3.42 (H-4), 3.64 (H-5), and 3.76 ppm (H-6) (Figure S2). However, inorder to confirm the inclusion of MA into b-CD, a comparison ofthe 1H NMR spectra of b-CD in the presence or absence of MA(Figures S3–S5) is necessary. Then chemical inclusion shifts (CIS)were calculated and listed in Table 3 (CIS with dguest) and TableS1 (CIS with dhost). For complexes prepared by CE and KN meth-ods, MA protons showed 1H-chemical shifts upon interaction withb-CD (Table 3). For example, all aromatic protons of MA (H-4, H-5,H-6 and H-7, H-8, H-9) are shifted, except for H-3. In addition, theNH function of MA also participates in the formation of the inclu-sion complex with a significant variation in CIS values (1.30 ppmfor CE, 0.72 ppm for KN). Moreover, the chemical shift of 1H fromCOOH group in CE complex (CIS¼�2.23 ppm) is the CIS valuethat has changed the most. All these variations clearly indicatethat the guest–host interaction results in chemical shift changes.
Figure 5. FT-IR spectra of MA, b-CD, and MA:b-CD binary inclusion complexes.
Figure 6. DSC thermograms of MA, b-CD, and MA:b-CD binary inclu-sion complexes.
612 D. SID ET AL.
On the other hand, no shift was observed on all protons of MAwhen the PM method is used to get the corresponding inclusioncomplex. This last can be considered as a simple superimpositionof MA and b-CD spectra. The overall analysis of CIS values for CHprotons of b-CD also shows variations, both for the six protons ofthe three complexes (Table S1). By comparing the 13C NMR signalsof the CE and KN complexes with MA alone (Figures S6–S10),large shifts of all carbon atoms of MA were observed (Table 4). Asseen with 1H NMR spectra, the greatest changes are observed forthe CE and KN complexes. The amplitude of the chemical shiftscan reach values greater than 2, as for C-5 carbon (�2.76 ppm forCE, 2.22 ppm for KN).
In conclusion, the presence of H-bond interactions should leadto more stable complexes specially here for CE and KN complexesand then should increase the solubility of MA. Among the threemethods investigated, the CE complex is the most stable complexprepared, with highest CIS values.
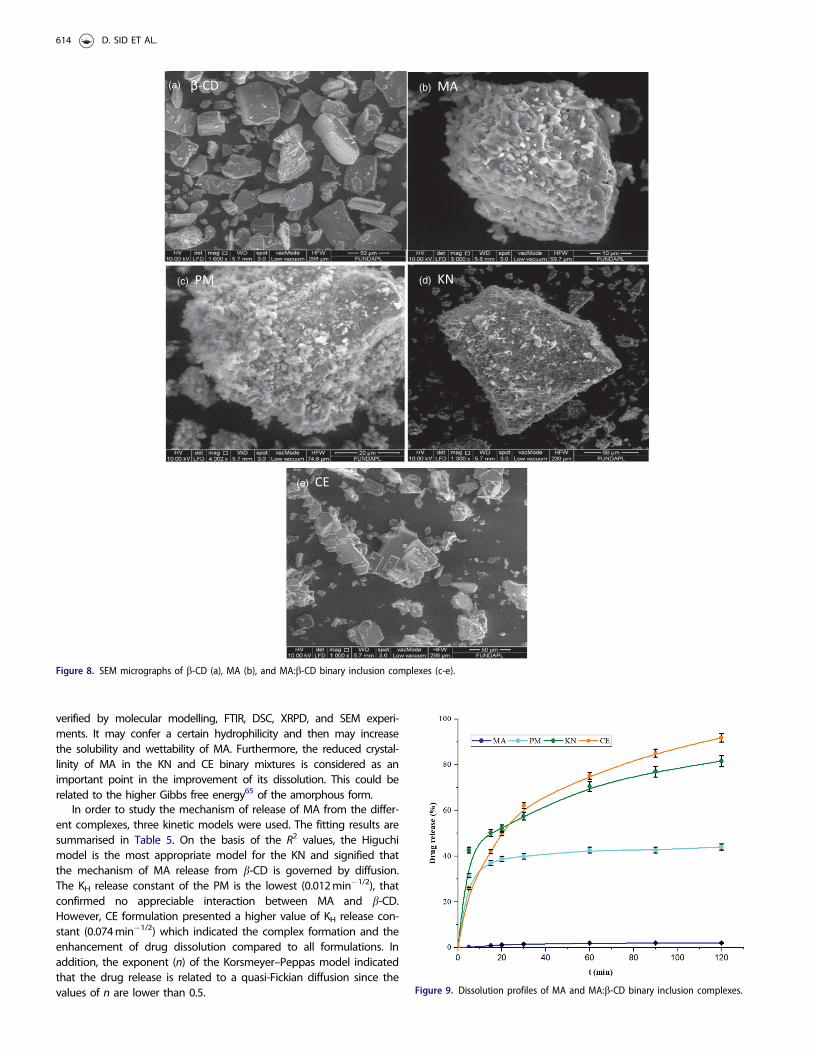
Scanning electron microscopyFigure 8 presents the micrographs of MA, b-CD, and MA:b-CD binarysystems prepared by various processing methods. The morphologicalchanges may be used as an evidence for the interactions betweenmolecules. b-CD (Figure 8(a)) exists as broken bricks, distributed inparallelogram, which are well separated from each other63. MA takesthe form of flake crystalline particles (Figure 8(b)), irregularly sizedwith a tendency to self-agglomerate64. The PM method respects theoriginal morphology of each component; the MA crystals are adheredto smooth surface of b-CD (Figure 8(c)). It is possible to distinguish areduction in the agglomerated drug on the surface of b-CD in thecase of KN product (Figure 8(d)) when compared with the PM com-plex. A significant change in the morphology of the inclusion com-plex was observed using CE method (Figure 8(e)). In fact, it is foundthat the crystal nature of MA disappeared. Micrographs show small,more agglomerated, and amorphous smooth structures, which sug-gest that MA molecules are well dispersed in the b-CD cavities.These results are consistent with the data obtained with the DSCand XRPD studies.
In vitro drug release test
Figure 9 illustrates the dissolution profiles of MA from various(2:1) binary systems in 0.1 M HCl (pH 1.2). In fact, all the binarysystems exhibit a more rapid release and a greater extent of dis-solution compared to the drug alone. The most importantenhancement of the drug dissolution properties is observed withthe binary mixture prepared by CE, followed by KN and PM.
The improved MA dissolution characteristics of the PM binary sys-tem may be explained by the drug wettability enhancement at theearly stages of dissolution process, due to the coexistence of drug andb-CD in the dissolution medium and/or the existence of interaction(s)between external b-CD cavity and MA. Indeed, because of the hydro-philicity of its outer surface, b-CD acts as a surfactant. Thus, it reducesthe interfacial tension between the poorly soluble drug and the dissol-ution medium, resulting in a higher dissolution rate of the drug as pro-posed by Bera et al.18. Moreover, KN and CE binary systems showed agreater extent of dissolution than those of the pure drug and the PM.This enhancement may be due to partial trapping of the drug in b-CD
Figure 7. XRPD patterns of MA, b-CD, and MA:b-CD binary inclusion complexes.
Table 3. 1H NMR Chemical shifts (d, ppm) for protons of MA alone (dguest) andtheir complexation induced shifts (CIS¼ dcomplex – dguest) in DMSO-d6 at 25 �C.
MA Protons dguest CIS (CE) CIS (KN) CIS (PM)
H-1 12.98 �2.23 – 0H-2 9.45 1.30 0.72 0H-3 7.89 0 0 0H-4 7.03 �0.21 0.05 0H-5 7.12 �0.10 0.01 0H-6 7.31 �0.18 �0.09 0H-7 6.68 �0.08 �0.05 0H-8 6.70 �0.09 �0.05 0H-9 6.72 �0.09 �0.05 0H-10 2.29 �0.03 �0.01 0H-11 2.10 0.01 0.01 0
Table 4. 13C NMR Chemical shifts (d, ppm) for carbons of MA alone (dguest) andtheir complexation induced shifts (CIS¼ dcomplex – dguest) in DMSO-d6 at 25 �C.
MA carbons dguest CIS (CE) CIS (KN) CIS (PM)
C-1 170.66 – 0.34 0C-2 149.22 �2.2 �1.43 �0.02C-3 138.81 1.4 0.57 0C-4 138.35 �0.93 �0.72 0C-5 134.66 �2.76 �2.22 0C-6 132.17 �1.16 �0.35 0C-7 131.71 �2.64 �1.68 �0.02C-8 129.89 �1.26 �1.08 �0.01C-9 126.49 �2.22 �1.28 0.01C-10 122.66 – �2.31 �0.02C-11 116.71 2.16 �0.60 0.01C-12 113.55 2.43 �0.62 �0.01C-13 111.69 1.11 – 0.03C-14 20.69 �0.31 �0.38 0.01C-15 14.14 �0.45 �0.45 0
JOURNAL OF ENZYME INHIBITION AND MEDICINAL CHEMISTRY 613
verified by molecular modelling, FTIR, DSC, XRPD, and SEM experi-ments. It may confer a certain hydrophilicity and then may increasethe solubility and wettability of MA. Furthermore, the reduced crystal-linity of MA in the KN and CE binary mixtures is considered as animportant point in the improvement of its dissolution. This could berelated to the higher Gibbs free energy65 of the amorphous form.
In order to study the mechanism of release of MA from the differ-ent complexes, three kinetic models were used. The fitting results aresummarised in Table 5. On the basis of the R2 values, the Higuchimodel is the most appropriate model for the KN and signified thatthe mechanism of MA release from b-CD is governed by diffusion.The KH release constant of the PM is the lowest (0.012min�1/2), thatconfirmed no appreciable interaction between MA and b-CD.However, CE formulation presented a higher value of KH release con-stant (0.074min�1/2) which indicated the complex formation and theenhancement of drug dissolution compared to all formulations. Inaddition, the exponent (n) of the Korsmeyer–Peppas model indicatedthat the drug release is related to a quasi-Fickian diffusion since thevalues of n are lower than 0.5.
(d) KN
(a) β-CD
(e) CE
(b) MA
(c) PM
Figure 8. SEM micrographs of b-CD (a), MA (b), and MA:b-CD binary inclusion complexes (c-e).
Figure 9. Dissolution profiles of MA and MA:b-CD binary inclusion complexes.
614 D. SID ET AL.
In vitro anti-inflammatory activities
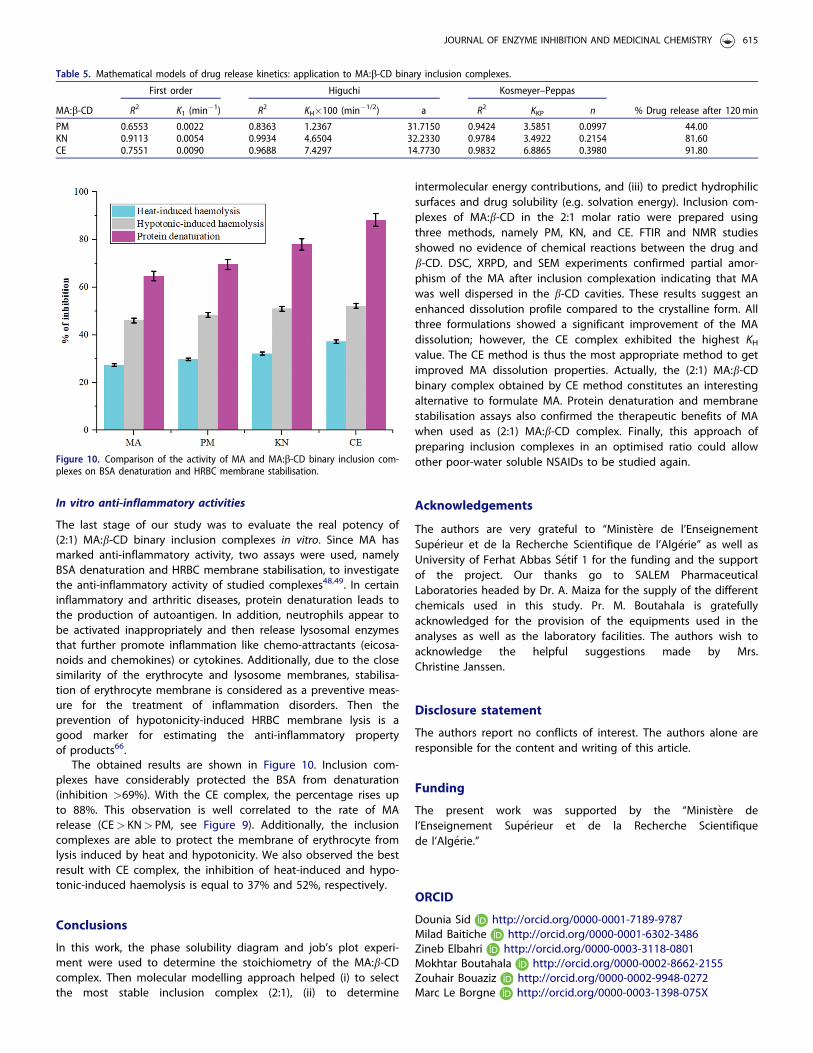
The last stage of our study was to evaluate the real potency of(2:1) MA:b-CD binary inclusion complexes in vitro. Since MA hasmarked anti-inflammatory activity, two assays were used, namelyBSA denaturation and HRBC membrane stabilisation, to investigatethe anti-inflammatory activity of studied complexes48,49. In certaininflammatory and arthritic diseases, protein denaturation leads tothe production of autoantigen. In addition, neutrophils appear tobe activated inappropriately and then release lysosomal enzymesthat further promote inflammation like chemo-attractants (eicosa-noids and chemokines) or cytokines. Additionally, due to the closesimilarity of the erythrocyte and lysosome membranes, stabilisa-tion of erythrocyte membrane is considered as a preventive meas-ure for the treatment of inflammation disorders. Then theprevention of hypotonicity-induced HRBC membrane lysis is agood marker for estimating the anti-inflammatory propertyof products66.
The obtained results are shown in Figure 10. Inclusion com-plexes have considerably protected the BSA from denaturation(inhibition >69%). With the CE complex, the percentage rises upto 88%. This observation is well correlated to the rate of MArelease (CE> KN> PM, see Figure 9). Additionally, the inclusioncomplexes are able to protect the membrane of erythrocyte fromlysis induced by heat and hypotonicity. We also observed the bestresult with CE complex, the inhibition of heat-induced and hypo-tonic-induced haemolysis is equal to 37% and 52%, respectively.
Conclusions
In this work, the phase solubility diagram and job’s plot experi-ment were used to determine the stoichiometry of the MA:b-CDcomplex. Then molecular modelling approach helped (i) to selectthe most stable inclusion complex (2:1), (ii) to determine
intermolecular energy contributions, and (iii) to predict hydrophilicsurfaces and drug solubility (e.g. solvation energy). Inclusion com-plexes of MA:b-CD in the 2:1 molar ratio were prepared usingthree methods, namely PM, KN, and CE. FTIR and NMR studiesshowed no evidence of chemical reactions between the drug andb-CD. DSC, XRPD, and SEM experiments confirmed partial amor-phism of the MA after inclusion complexation indicating that MAwas well dispersed in the b-CD cavities. These results suggest anenhanced dissolution profile compared to the crystalline form. Allthree formulations showed a significant improvement of the MAdissolution; however, the CE complex exhibited the highest KHvalue. The CE method is thus the most appropriate method to getimproved MA dissolution properties. Actually, the (2:1) MA:b-CDbinary complex obtained by CE method constitutes an interestingalternative to formulate MA. Protein denaturation and membranestabilisation assays also confirmed the therapeutic benefits of MAwhen used as (2:1) MA:b-CD complex. Finally, this approach ofpreparing inclusion complexes in an optimised ratio could allowother poor-water soluble NSAIDs to be studied again.
Acknowledgements
The authors are very grateful to “Minist�ere de l’EnseignementSup�erieur et de la Recherche Scientifique de l’Alg�erie” as well asUniversity of Ferhat Abbas S�etif 1 for the funding and the supportof the project. Our thanks go to SALEM PharmaceuticalLaboratories headed by Dr. A. Maiza for the supply of the differentchemicals used in this study. Pr. M. Boutahala is gratefullyacknowledged for the provision of the equipments used in theanalyses as well as the laboratory facilities. The authors wish toacknowledge the helpful suggestions made by Mrs.Christine Janssen.
Disclosure statement
The authors report no conflicts of interest. The authors alone areresponsible for the content and writing of this article.
Funding
The present work was supported by the “Minist�ere del’Enseignement Sup�erieur et de la Recherche Scientifiquede l’Alg�erie.”
ORCID
Dounia Sid http://orcid.org/0000-0001-7189-9787Milad Baitiche http://orcid.org/0000-0001-6302-3486Zineb Elbahri http://orcid.org/0000-0003-3118-0801Mokhtar Boutahala http://orcid.org/0000-0002-8662-2155Zouhair Bouaziz http://orcid.org/0000-0002-9948-0272Marc Le Borgne http://orcid.org/0000-0003-1398-075X
Table 5. Mathematical models of drug release kinetics: application to MA:b-CD binary inclusion complexes.
MA:b-CD
First order Higuchi Kosmeyer–Peppas
% Drug release after 120minR2 K1 (min�1) R2 KH�100 (min�1/2) a R2 KKP n
PM 0.6553 0.0022 0.8363 1.2367 31.7150 0.9424 3.5851 0.0997 44.00KN 0.9113 0.0054 0.9934 4.6504 32.2330 0.9784 3.4922 0.2154 81.60CE 0.7551 0.0090 0.9688 7.4297 14.7730 0.9832 6.8865 0.3980 91.80
Figure 10. Comparison of the activity of MA and MA:b-CD binary inclusion com-plexes on BSA denaturation and HRBC membrane stabilisation.
JOURNAL OF ENZYME INHIBITION AND MEDICINAL CHEMISTRY 615
References
1. Benet LZ, Kroetz D, Sheiner L, et al. Pharmacokinetics: thedynamics of drug absorption, distribution, metabolism, andelimination. In: Hardman JG, Limbert LE, Molinoff PB,Ruddon RW, Gilman AG, eds. Goodman and Gilman’s thepharmacological basis of therapeutics. 9th ed. New York(NY): McGraw-Hill Inc.; 1996:3–27.
2. Wei M, Yang X, Watson P, et al. Development of QSARmodel for predicting the inclusion constants of organicchemicals with a-cyclodextrin. Environ Sci Pollut Res Int2018;25:17565–74.
3. Kalepu S, Nekkanti V. Insoluble drug delivery strategies:review of recent advances and business prospects. ActaPharm Sin B 2015;5:442–53.
4. Dizaj SM, Vazifehasl Z, Salatin S, et al. Nanosizing of drugs:effect on dissolution rate. Res Pharm Sci 2015;10:95–108.
5. Ren F, Jing Q, Tang Y, et al. Characteristics of bicalutamidesolid dispersions and improvement of the dissolution. DrugDev Ind Pharm 2006;32:967–72.
6. Wang N, Xie C, Lu H, et al. Cocrystal and its application inthe field of active pharmaceutical ingredients and foodingredients. Curr Pharm Des 2018;24:2339–48.
7. Chaudhari SP, Dugar RP. Application of surfactants in soliddispersion technology for improving solubility of poorlywater soluble drugs. J Drug Deliv Sci Technol 2017;41:68–77.
8. Gursoy RN, Benita S. Self-emulsifying drug delivery systems(SEDDS) for improved oral delivery of lipophilic drugs.Biomed Pharmacother 2004;58:173–82.
9. Priya AS, Sivakamavalli J, Vaseeharan B, Stalin T.Improvement on dissolution rate of inclusion complex ofrifabutin drug with b-cyclodextrin. Int J Biol Macromol 2013;62:472–80.
10. Crini G, Fourmentin S, Fenyvesi �E, et al. Fundamentals andapplications of cyclodextrins. In: Fourmentin S, Crini G,Lichtfouse E, eds. Cyclodextrin fundamentals, reactivity andanalysis. 1st ed. Cham, Switzerland: Springer InternationalPublishing; 2018:1–55.
11. Conceic~ao J, Adeoye O, Cabral-Marques HM, Lobo JMS.Cyclodextrins as excipients in tablet formulations. DrugDiscov Today 2018;23:1274–84.
12. Jambhekar SS, Breen P. Cyclodextrins in pharmaceutical for-mulations I: structure and physicochemical properties, for-mation of complexes, and types of complex. Drug DiscovToday 2016;21:356–62.
13. Kontogiannidou E, Ferrari M, Deligianni AD, et al. In vitroand ex vivo evaluation of tablets containing piroxicam-cyclo-dextrin complexes for buccal delivery. Pharmaceutics 2019;11:398.
14. Prandina A, Herfindal L, Radix S, et al. Enhancement of iodi-nin solubility by encapsulation into cyclodextrin nanopar-ticles. J Enzyme Inhib Med Chem 2018;33:370–5.
15. Perret F, Marminon C, Zeinyeh W, et al. Preparation andcharacterization of CK2 inhibitor-loaded cyclodextrin nano-particles for drug delivery. Int J Pharm 2013;441:491–8.
16. Nacereddine A, Bollacke A, R�oka E, et al. Self-assembledsupramolecular nanoparticles improve the cytotoxic efficacyof CK2 inhibitor THN7. Pharmaceuticals 2018;11:10.
17. Kurkov SV, Loftsson T. Cyclodextrins. Int J Pharm 2013;453:167–80.
18. Bera H, Chekuri S, Sarkar S, et al. Novel pimozide-b-cyclodex-trin-polyvinylpyrrolidone inclusion complexes for tourettesyndrome treatment. J Mol Liq 2016;215:135–43.
19. Cimolai N. The potential and promise of mefenamic acid.Expert Rev Clin Pharmacol 2013;6:289–305.
20. Cryer B, Feldman M. Cyclooxygenase-1 and cyclooxygenase-2 selectivity of widely used nonsteroidal anti-inflammatorydrugs. Am J Med Sci 1998;104:413–21.
21. Winder CV, Kaump DH, Glazko AJ, Holmes EL. Experimentalobservations on flufenamic, mefenamic, and meclofenamicacids. I. Pharmacology. Ann Phys Rehabil Med 1966;VIII:7–49.
22. Baum C, Kennedy DL, Forbes MB. Utilization of nonsteroidalantiinflammatory drugs. Arthritis Rheum 1985;28:686–92.
23. Abdul Mudalip SK, Abu Bakar MR, Jamal P, Adam F.Solubility and dissolution thermodynamic data of mefe-namic acid crystals in different classes of organic solvents. JChem Eng Data 2013;58:3447–52.
24. Kafarska K, Gacki M, Wolf WM. Synthesis, spectroscopic, andthermal investigations of metal complexes with mefenamicacid. J Chem 2017;2017:1–7.
25. Stephens WH, El-Ghobarey AF, Macleod MM, Buchanan WW.A double-blind, crossover trial of mefenamic acid, sulindacand flurbiprofen in rheumatoid arthritis. Curr Med Res Opin1979;5:754–8.
26. Ozgoli G, Goli M, Moattar F. Comparison of effects of ginger,mefenamic acid, and ibuprofen on pain in women with pri-mary dysmenorrhea. J Altern Complement Med 2009;15:129–32.
27. Mavrikakis ME, Madkour MM, Buchanan WW. The place ofmefenamic acid in the treatment of rheumatoid arthritis.Scott Med J 1978;23:189–90.
28. Joo Y, Kim H-S, Woo R-S, et al. Mefenamic acid shows neu-roprotective effects and improves cognitive impairment inin vitro and in vivo Alzheimer’s disease models. MolPharmacol 2006;69:76–84.
29. Ghanghas P, Jain S, Rana C, Sanyal SN. Chemopreventiveaction of non-steroidal anti-inflammatory drugs on theinflammatory pathways in colon cancer. BiomedPharmacother 2016;78:239–47.
30. Lee FD. Drug-related pathological lesions of the intestinaltract. Histopathology 1994;25:303–8.
31. Zentler-Munro PL, Northfield TC. Drug-induced gastrointes-tinal disease. Br Med J 1979;1:1263–5.
32. Gibson GR, Whitacre EB, Ricotti CA. Colitis induced by non-steroidal anti-inflammatory drugs: report of four cases andreview of the literature. J Gen Intern Med 1992;152:625–32.
33. Zhao Q, Miriyala N, Su Y, et al. Computer-aided formulationdesign for a highly soluble Lutein-cyclodextrin multiple-com-ponent delivery system. Mol Pharm 2018;15:1664–73.
34. Quevedo MA, Zoppi A. Current trends in molecular model-ing methods applied to the study of cyclodextrin complexes.J Incl Phenom Macro 2018;90:1–14.
35. Mazzaferro S, Bouchemal K, Gallard JF, et al. Bivalentsequential binding of docetaxel to methyl-b-cyclodextrin. IntJ Pharm 2011;416:171–80.
36. Vavia PR, Adhage NA. Freeze-dried inclusion complexes oftolfenamic acid with beta-cyclodextrins. Pharm Dev Technol2000;5:571–4.
37. Terekhova IV, Volkova TV, Perlovich GL. Experimental ana-lysis of complex formation of niflumic acid withb-Cyclodextrins. J Incl Phenom Macro 2006;55:335–40.
38. Jambhekar S, Casella R, Maher T. The physicochemical char-acteristics and bioavailability of indomethacin from b-cyclo-dextrin, hydroxyethyl-b-cyclodextrin, and hydroxypropyl-b-cyclodextrin complexes. Int J Pharm 2004;270:149–66.
616 D. SID ET AL.
39. Tayade PT, Vavia PR. Inclusion complexes of ketoprofen withbeta-cyclodextrins: oral pharmacokinetics of ketoprofen inhuman. Indian J Pharm Sci 2006;68:164–70.
40. Siva S, Kothai Nayaki S, Rajendiran N. Spectral and molecularmodeling investigations of supramolecular complexes ofmefenamic acid and aceclofenac with a- and b-cyclodextrin.Spectrochim Acta A Mol Biomol Spectrosc 2017;174:349–62.
41. Hłado�n T, Pawlaczyk J, Szafran B. Stability of mefenamic acidin the Inclusion complex with b-cyclodextrin in the solidphase. J Incl Phenom 1999;35:497–506.
42. Derle DV, Bele M, Kasliwal N. In vitro and in vivo evaluationof mefenamic acid and its complexes with b-cyclodextrinand HP-b-cyclodextrin. Asian J Pharm 2008;2:30–4.
43. Higuchi T. A phase solubility technique. Adv Anal ChemInstrum 1965;4:117–211.
44. Accelrys materials studio, versions v 5.5.0.0 (2010) and v6.0.0.0. San Diego (CA): Accelrys Inc.; 2012.
45. Maestro, version 9.3, Schr€odinger. New York (NY): LLC; 2012.46. Delley B. An all-electron numerical method for solving the
local density functional for polyatomic molecules. J ChemPhys 1990;92:508–17.
47. Zhao Y, Truhlar DG. Density functionals with broad applic-ability in chemistry. Acc Chem Res 2008;41:157–67.
48. Assas N, Elbahri Z, Baitiche M, Djerboua F. Effects of someprocess parameters on the niflumic acid controlled releasepolymeric microspheres: optimization using designs ofexperiments. Asia Pac J Chem Eng 2019;14:e2283.
49. Mizushima Y, Kobayashi M. Interaction of anti-inflammatorydrugs with serum proteins, especially with some biologicallyactive proteins. J Pharm Pharmacol 1968;20:169–73.
50. Bulani VD, Kothavade PS, Kundaikar HS, et al. Inclusion com-plex of ellagic acid with b-cyclodextrin: characterization andin vitro anti-inflammatory evaluation. J Mol Struct 2016;1105:308–15.
51. Pradines B, Gallard JF, Iorga BI, et al. Investigation of thecomplexation of albendazole with cyclodextrins for thedesign of new antiparasitic formulations. Carbohydr Res2014;398:50–5.
52. Buchanan CM, Buchanan NL, Edgar KJ, et al. Building newdrug delivery systems: in vitro and in vivo studies of drug-hydroxybutenyl cyclodextrin complexes. In: Edgar KJ, HeinzeT, Buchanan CM, eds. Polysaccharide materials: performanceby design. Washington (DC): American Chemical SocietyBooks; 2009:31–64.
53. Rudrangi SRS, Bhomia R, Trivedi V, et al. Influence of thepreparation method on the physicochemical properties ofindomethacin and methyl-b-cyclodextrin complexes. Int JPharm 2015;479:381–90.
54. Sherje AP, Kulkarni V, Murahari M, et al. Inclusion complex-ation of etodolac with hydroxypropyl-beta-cyclodextrin andauxiliary agents: formulation characterization and molecularmodeling studies. Mol Pharm 2017;14:1231–42.
55. Cunha VR, Izumi CM, Petersen PA, et al. Mefenamic acidanti-inflammatory drug: probing its polymorphs by vibra-tional (IR and Raman) and solid-state NMR spectroscopies. JPhys Chem B 2014;118:4333–44.
56. Fateminasab F, Bordbar AK, Shityakov S, Gholami S.Diadzein complexation with unmodified cyclodextrins: adetailed experimental and theoretical study. J Mol Liq 2018;271:80–95.
57. Sambasevam K, Mohamad S, Sarih N, Ismail N. Synthesis andcharacterization of the inclusion complex of b-cyclodextrinand Azomethine. Int J Mol Sci 2013;14:3671–82.
58. Khoukhi OE, Elbahri Z, Diaf K, Baitiche M. Piroxicam/b-cyclo-dextrin complex included in cellulose derivatives-basedmatrix microspheres as new solid dispersion-controlledrelease formulations. Chem Pap 2016;70:828–39.
59. Romero S, Escalera B, Bustamante P. Solubility behavior ofpolymorphs I and II of mefenamic acid in solvent mixtures.Int J Pharm 1999;178:193–202.
60. Giordano F, Novak C, Moyano JR. Thermal analysis of cyclo-dextrins and their inclusion compounds. Thermochim Acta2001;380:123–51.
61. Hirlekar RS, Sonawane SN, Kadam VJ. Studies on the effectof water-soluble polymers on drug–cyclodextrin complexsolubility. AAPS Pharm Sci Tech 2009;10:858.
62. Fernandes CM, Vieira MT, Veiga FJB. Physicochemical charac-terization and in vitro dissolution behavior of nicardipine-cyclodextrins inclusion compounds. Eur J Pharm Sci 2002;15:79–88.
63. Shanmuga PA, Balakrishnan BS, Veerakanellore GB, Stalin T.In-vitro dissolution rate and molecular docking studies ofcabergoline drug with b-cyclodextrin. J Mol Struct 2018;1160:1–8.
64. Panchagnula R, Sundaramurthy P, Pillai O, et al. Solid-statecharacterization of mefenamic acid. J Pharm Sci 2004;93:1019–29.
65. Khadka P, Ro J, Kim H, et al. Pharmaceutical particle technol-ogies: an approach to improve drug solubility, dissolutionand bioavailability. Asian J Pharm Sci 2014;9:304–16.
66. Chippada SC, Volluri SS, Bammidi SR, Vangalapati M. In vitroanti-inflammatory activity of methanolic extract of Centellaasiatica by HRBC membrane stabilization. Rasayan J Chem2011;4:457–60.
JOURNAL OF ENZYME INHIBITION AND MEDICINAL CHEMISTRY 617