Solar Collectors Orientation - L. David Roper's … Solar Collectors Orientation L. David Roper...
7
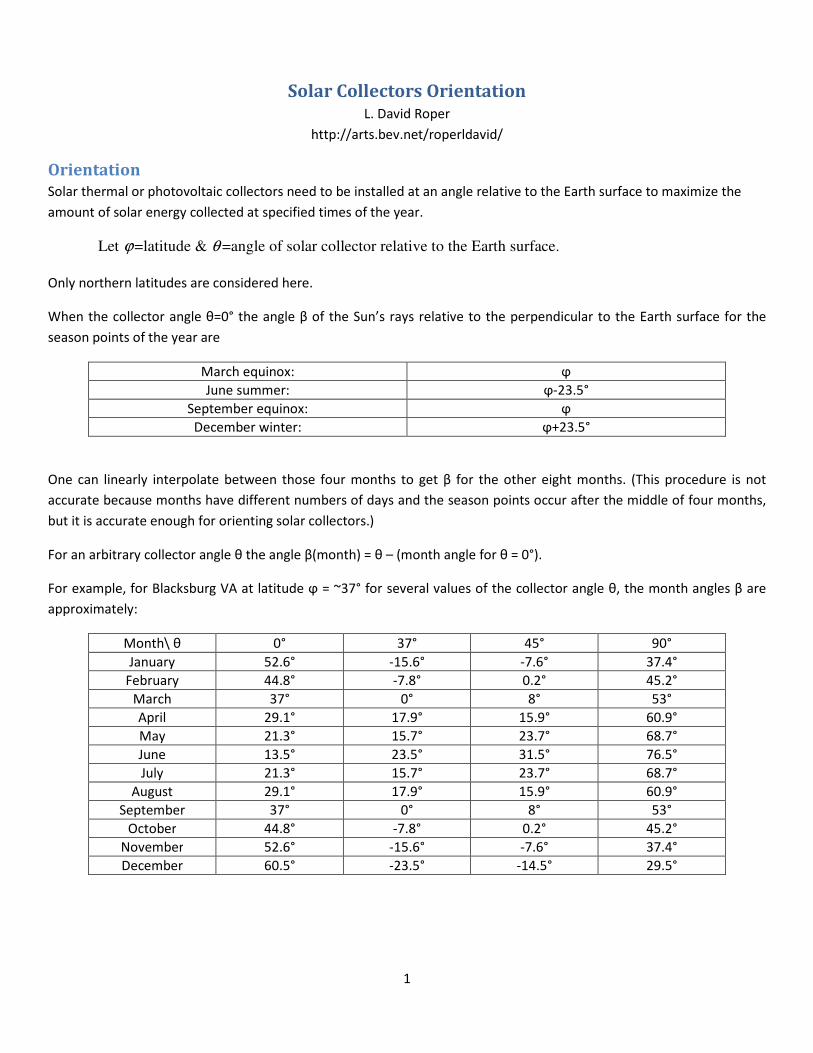
1 Solar Collectors Orientation L. David Roper http://arts.bev.net/roperldavid/ Orientation Solar thermal or photovoltaic collectors need to be installed at an angle relative to the Earth surface to maximize the amount of solar energy collected at specified times of the year. Let =latitude & =angle of solar collector relative to the Earth surface. ϕ θ Only northern latitudes are considered here. When the collector angle θ=0° the angle β of the Sun’s rays relative to the perpendicular to the Earth surface for the season points of the year are March equinox: ϕ June summer: ϕ-23.5° September equinox: ϕ December winter: ϕ+23.5° One can linearly interpolate between those four months to get β for the other eight months. (This procedure is not accurate because months have different numbers of days and the season points occur after the middle of four months, but it is accurate enough for orienting solar collectors.) For an arbitrary collector angle θ the angle β(month) = θ – (month angle for θ = 0°). For example, for Blacksburg VA at latitude ϕ = ~37° for several values of the collector angle θ, the month angles β are approximately: Month\ θ 0° 37° 45° 90° January 52.6° -15.6° -7.6° 37.4° February 44.8° -7.8° 0.2° 45.2° March 37° 0° 8° 53° April 29.1° 17.9° 15.9° 60.9° May 21.3° 15.7° 23.7° 68.7° June 13.5° 23.5° 31.5° 76.5° July 21.3° 15.7° 23.7° 68.7° August 29.1° 17.9° 15.9° 60.9° September 37° 0° 8° 53° October 44.8° -7.8° 0.2° 45.2° November 52.6° -15.6° -7.6° 37.4° December 60.5° -23.5° -14.5° 29.5°
Transcript of Solar Collectors Orientation - L. David Roper's … Solar Collectors Orientation L. David Roper...
1
Solar Collectors Orientation L. David Roper
http://arts.bev.net/roperldavid/
Orientation
Solar thermal or photovoltaic collectors need to be installed at an angle relative to the Earth surface to maximize the
amount of solar energy collected at specified times of the year.
Let =latitude & =angle of solar collector relative to the Earth surface.ϕ θ
Only northern latitudes are considered here.
When the collector angle θ=0° the angle β of the Sun’s rays relative to the perpendicular to the Earth surface for the
season points of the year are
March equinox: ϕ
June summer: ϕ-23.5°
September equinox: ϕ
December winter: ϕ+23.5°
One can linearly interpolate between those four months to get β for the other eight months. (This procedure is not
accurate because months have different numbers of days and the season points occur after the middle of four months,
but it is accurate enough for orienting solar collectors.)
For an arbitrary collector angle θ the angle β(month) = θ – (month angle for θ = 0°).
For example, for Blacksburg VA at latitude ϕ = ~37° for several values of the collector angle θ, the month angles β are
approximately:
Month\ θ 0° 37° 45° 90°
January 52.6° -15.6° -7.6° 37.4°
February 44.8° -7.8° 0.2° 45.2°
March 37° 0° 8° 53°
April 29.1° 17.9° 15.9° 60.9°
May 21.3° 15.7° 23.7° 68.7°
June 13.5° 23.5° 31.5° 76.5°
July 21.3° 15.7° 23.7° 68.7°
August 29.1° 17.9° 15.9° 60.9°
September 37° 0° 8° 53°
October 44.8° -7.8° 0.2° 45.2°
November 52.6° -15.6° -7.6° 37.4°
December 60.5° -23.5° -14.5° 29.5°
2
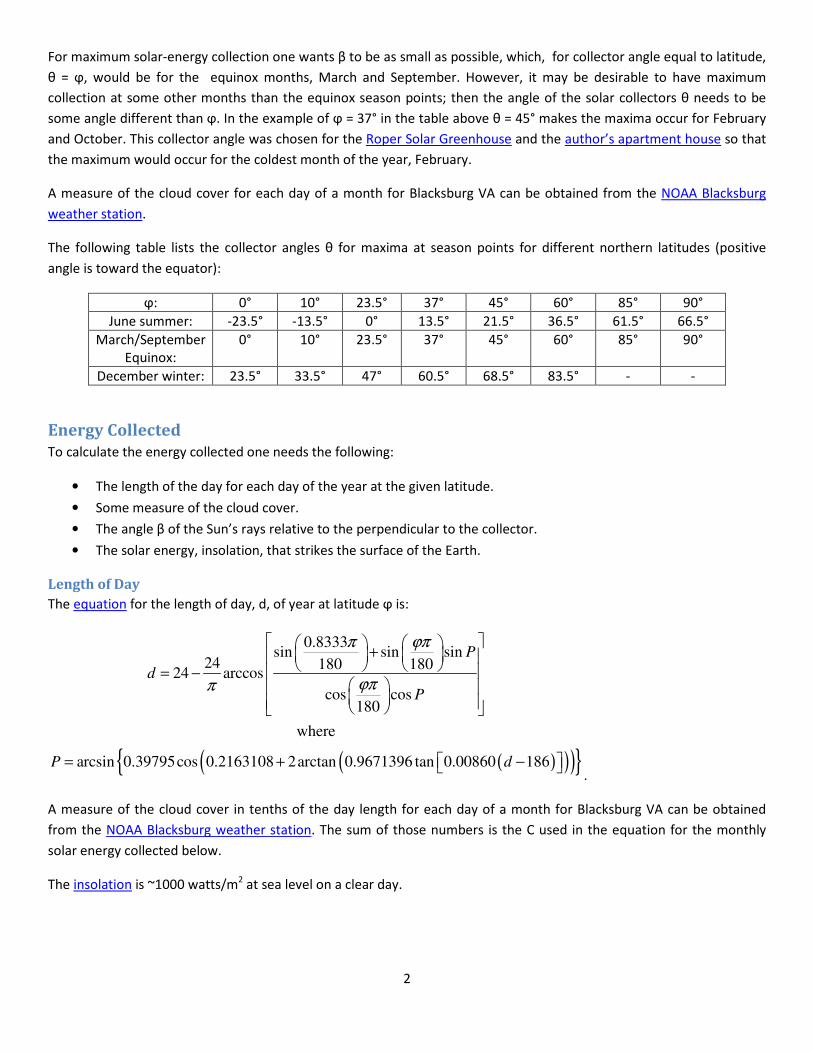
For maximum solar-energy collection one wants β to be as small as possible, which, for collector angle equal to latitude,
θ = ϕ, would be for the equinox months, March and September. However, it may be desirable to have maximum
collection at some other months than the equinox season points; then the angle of the solar collectors θ needs to be
some angle different than ϕ. In the example of ϕ = 37° in the table above θ = 45° makes the maxima occur for February
and October. This collector angle was chosen for the Roper Solar Greenhouse and the author’s apartment house so that
the maximum would occur for the coldest month of the year, February.
A measure of the cloud cover for each day of a month for Blacksburg VA can be obtained from the NOAA Blacksburg
weather station.
The following table lists the collector angles θ for maxima at season points for different northern latitudes (positive
angle is toward the equator):
ϕ: 0° 10° 23.5° 37° 45° 60° 85° 90°
June summer: -23.5° -13.5° 0° 13.5° 21.5° 36.5° 61.5° 66.5°
March/September
Equinox:
0° 10° 23.5° 37° 45° 60° 85° 90°
December winter: 23.5° 33.5° 47° 60.5° 68.5° 83.5° - -
Energy Collected
To calculate the energy collected one needs the following:
• The length of the day for each day of the year at the given latitude.
• Some measure of the cloud cover.
• The angle β of the Sun’s rays relative to the perpendicular to the collector.
• The solar energy, insolation, that strikes the surface of the Earth.
Length of Day
The equation for the length of day, d, of year at latitude ϕ is:
( )( )( ){ }
0.8333sin sin sin
24 180 18024 arccos
cos cos180
where
arcsin 0.39795cos 0.2163108 2arctan 0.9671396 tan 0.00860 186
P
d
P
P d
π ϕπ
ϕππ
+
= −
= + − .
A measure of the cloud cover in tenths of the day length for each day of a month for Blacksburg VA can be obtained
from the NOAA Blacksburg weather station. The sum of those numbers is the C used in the equation for the monthly
solar energy collected below.
The insolation is ~1000 watts/m2 at sea level on a clear day.
3
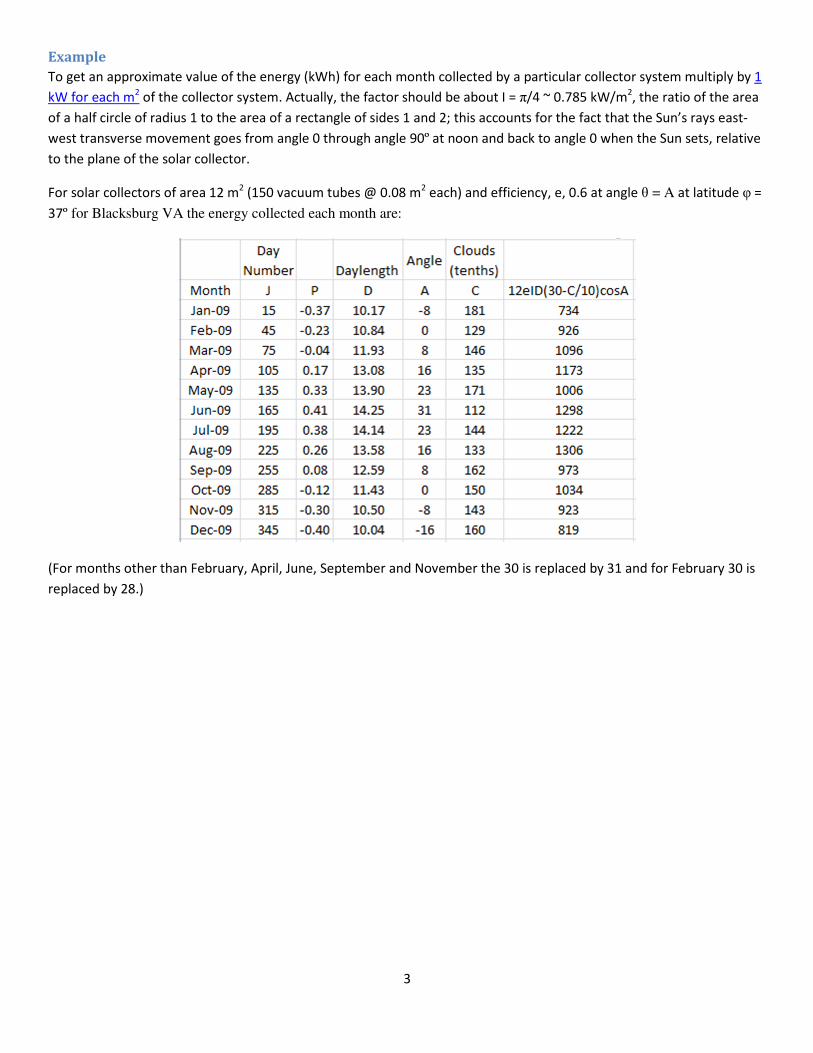
Example
To get an approximate value of the energy (kWh) for each month collected by a particular collector system multiply by 1
kW for each m2 of the collector system. Actually, the factor should be about I = π/4 ~ 0.785 kW/m
2, the ratio of the area
of a half circle of radius 1 to the area of a rectangle of sides 1 and 2; this accounts for the fact that the Sun’s rays east-
west transverse movement goes from angle 0 through angle 90º at noon and back to angle 0 when the Sun sets, relative
to the plane of the solar collector.
For solar collectors of area 12 m2 (150 vacuum tubes @ 0.08 m
2 each) and efficiency, e, 0.6 at angle θ = A at latitude φ =
37º for Blacksburg VA the energy collected each month are:
(For months other than February, April, June, September and November the 30 is replaced by 31 and for February 30 is
replaced by 28.)
4
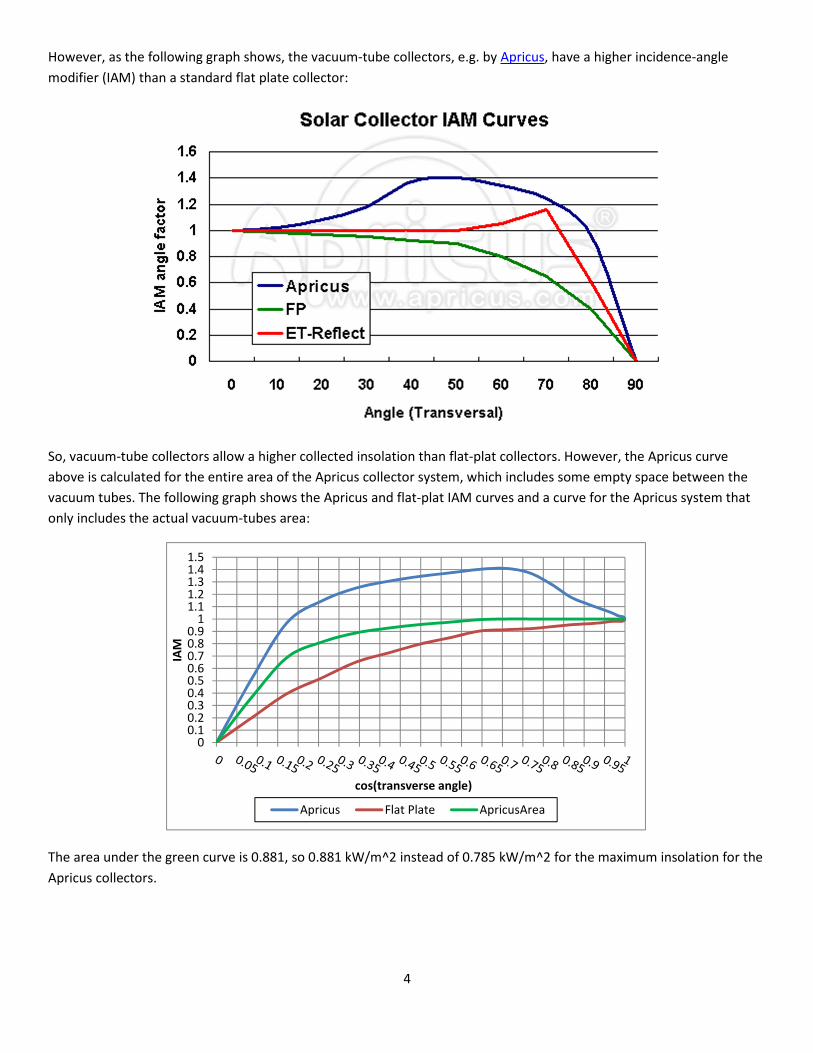
However, as the following graph shows, the vacuum-tube collectors, e.g. by Apricus, have a higher incidence-angle
modifier (IAM) than a standard flat plate collector:
So, vacuum-tube collectors allow a higher collected insolation than flat-plat collectors. However, the Apricus curve
above is calculated for the entire area of the Apricus collector system, which includes some empty space between the
vacuum tubes. The following graph shows the Apricus and flat-plat IAM curves and a curve for the Apricus system that
only includes the actual vacuum-tubes area:
The area under the green curve is 0.881, so 0.881 kW/m^2 instead of 0.785 kW/m^2 for the maximum insolation for the
Apricus collectors.
00.10.20.30.40.50.60.70.80.9
11.11.21.31.41.5
IAM
cos(transverse angle)
Apricus Flat Plate ApricusArea
5
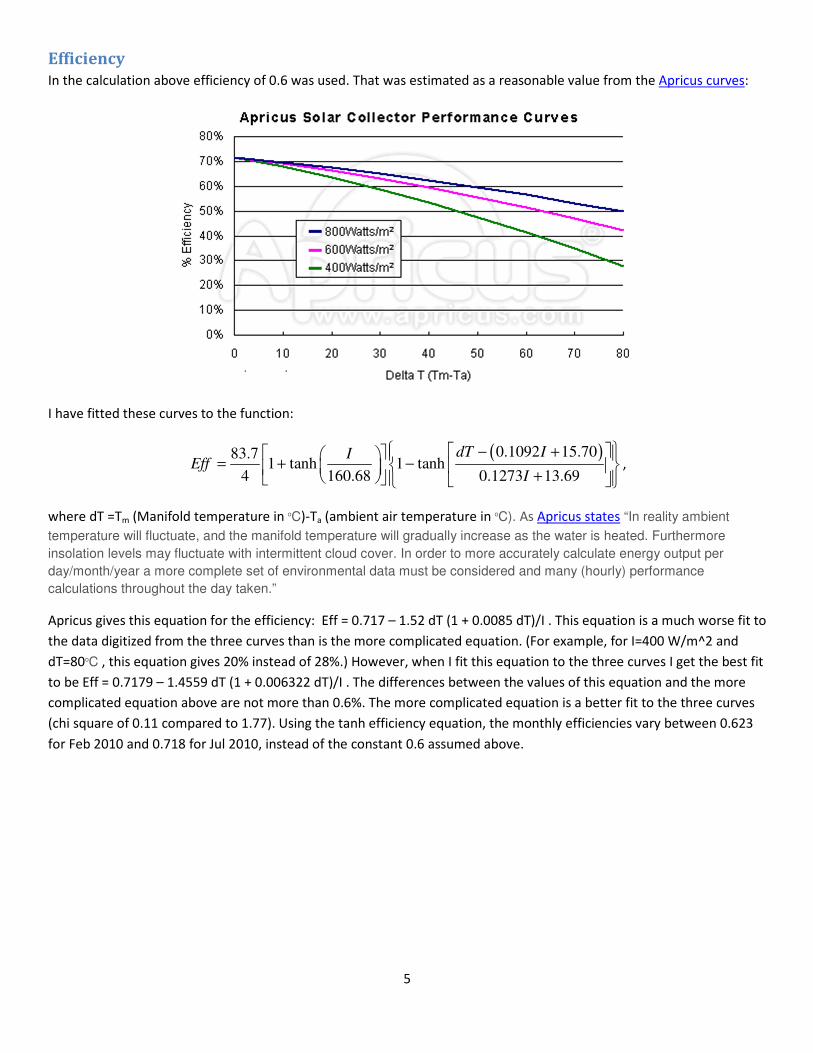
Efficiency
In the calculation above efficiency of 0.6 was used. That was estimated as a reasonable value from the Apricus curves:
I have fitted these curves to the function:
( )0.1092 15.7083.71 tanh 1 tanh
4 160.68 0.1273 13.69
dT IIEff
I
− + = + − +
,
where dT =Tm (Manifold temperature in oC)-Ta (ambient air temperature in oC). As Apricus states “In reality ambient
temperature will fluctuate, and the manifold temperature will gradually increase as the water is heated. Furthermore
insolation levels may fluctuate with intermittent cloud cover. In order to more accurately calculate energy output per
day/month/year a more complete set of environmental data must be considered and many (hourly) performance
calculations throughout the day taken.”
Apricus gives this equation for the efficiency: Eff = 0.717 – 1.52 dT (1 + 0.0085 dT)/I . This equation is a much worse fit to
the data digitized from the three curves than is the more complicated equation. (For example, for I=400 W/m^2 and
dT=80oC , this equation gives 20% instead of 28%.) However, when I fit this equation to the three curves I get the best fit
to be Eff = 0.7179 – 1.4559 dT (1 + 0.006322 dT)/I . The differences between the values of this equation and the more
complicated equation above are not more than 0.6%. The more complicated equation is a better fit to the three curves
(chi square of 0.11 compared to 1.77). Using the tanh efficiency equation, the monthly efficiencies vary between 0.623
for Feb 2010 and 0.718 for Jul 2010, instead of the constant 0.6 assumed above.
6
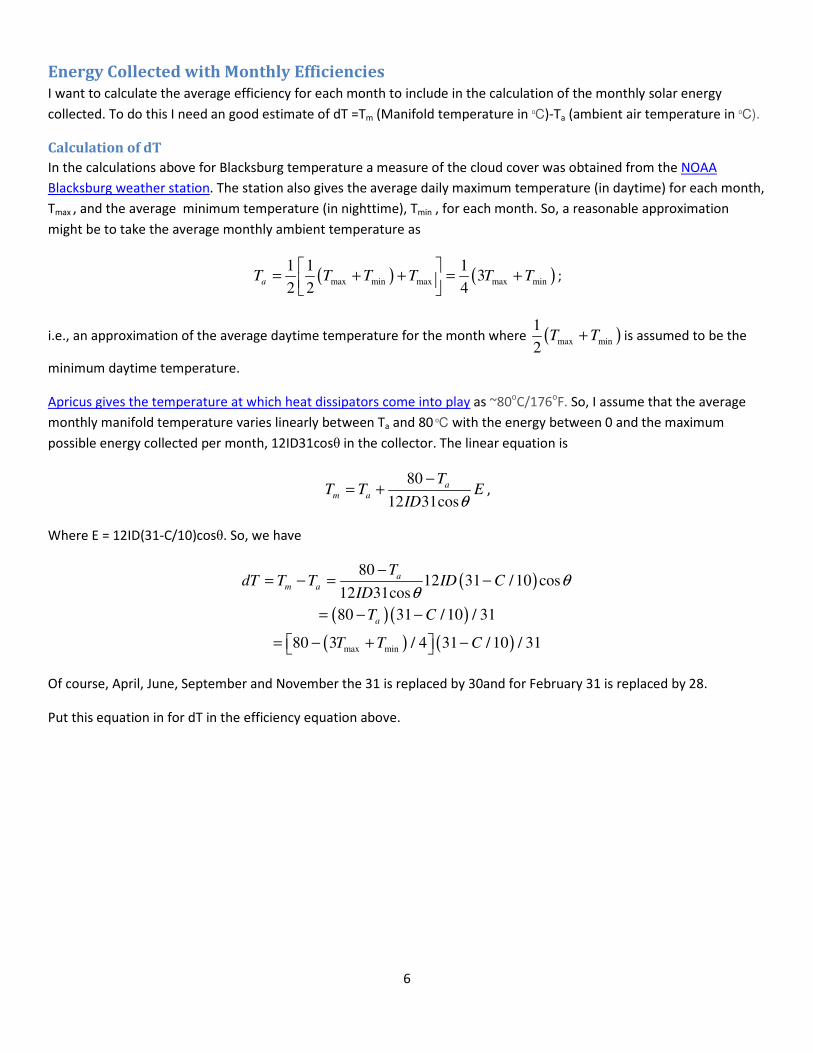
Energy Collected with Monthly Efficiencies
I want to calculate the average efficiency for each month to include in the calculation of the monthly solar energy
collected. To do this I need an good estimate of dT =Tm (Manifold temperature in oC)-Ta (ambient air temperature in oC).
Calculation of dT
In the calculations above for Blacksburg temperature a measure of the cloud cover was obtained from the NOAA
Blacksburg weather station. The station also gives the average daily maximum temperature (in daytime) for each month,
Tmax , and the average minimum temperature (in nighttime), Tmin , for each month. So, a reasonable approximation
might be to take the average monthly ambient temperature as
( ) ( )max min max max min
1 1 13
2 2 4aT T T T T T
= + + = +
;
i.e., an approximation of the average daytime temperature for the month where ( )max min
1
2T T+ is assumed to be the
minimum daytime temperature.
Apricus gives the temperature at which heat dissipators come into play as ~80oC/176
oF. So, I assume that the average
monthly manifold temperature varies linearly between Ta and 80 oC with the energy between 0 and the maximum
possible energy collected per month, 12ID31cosθ in the collector. The linear equation is
80
12 31cos
a
m a
TT T E
ID θ
−= + ,
Where E = 12ID(31-C/10)cosθ. So, we have
( )
( )( )
( ) ( )max min
8012 31 /10 cos
12 31cos
80 31 / 10 / 31
80 3 / 4 31 / 10 / 31
a
m a
a
TdT T T ID C
ID
T C
T T C
θθ
−= − = −
= − −
= − + −
Of course, April, June, September and November the 31 is replaced by 30and for February 31 is replaced by 28.
Put this equation in for dT in the efficiency equation above.
7
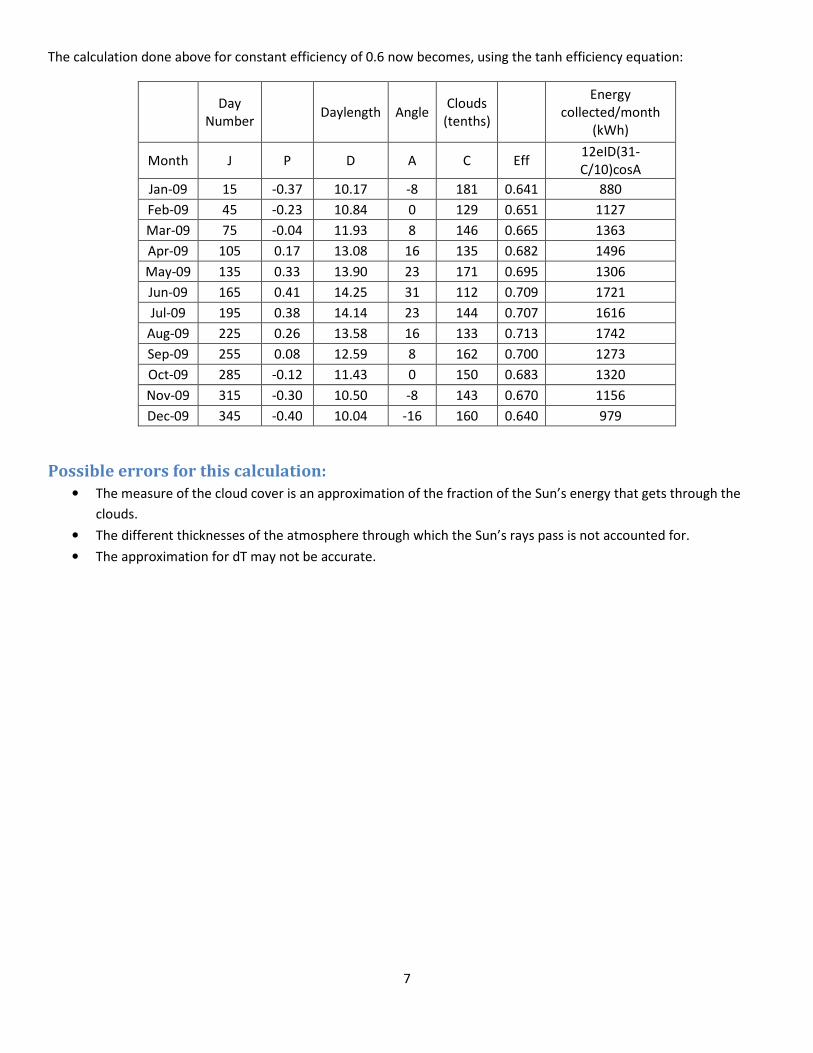
The calculation done above for constant efficiency of 0.6 now becomes, using the tanh efficiency equation:
Day
Number
Daylength Angle Clouds
(tenths)
Energy
collected/month
(kWh)
Month J P D A C Eff 12eID(31-
C/10)cosA
Jan-09 15 -0.37 10.17 -8 181 0.641 880
Feb-09 45 -0.23 10.84 0 129 0.651 1127
Mar-09 75 -0.04 11.93 8 146 0.665 1363
Apr-09 105 0.17 13.08 16 135 0.682 1496
May-09 135 0.33 13.90 23 171 0.695 1306
Jun-09 165 0.41 14.25 31 112 0.709 1721
Jul-09 195 0.38 14.14 23 144 0.707 1616
Aug-09 225 0.26 13.58 16 133 0.713 1742
Sep-09 255 0.08 12.59 8 162 0.700 1273
Oct-09 285 -0.12 11.43 0 150 0.683 1320
Nov-09 315 -0.30 10.50 -8 143 0.670 1156
Dec-09 345 -0.40 10.04 -16 160 0.640 979
Possible errors for this calculation:
• The measure of the cloud cover is an approximation of the fraction of the Sun’s energy that gets through the
clouds.
• The different thicknesses of the atmosphere through which the Sun’s rays pass is not accounted for.
• The approximation for dT may not be accurate.